Attached files
| file | filename |
|---|---|
| 8-K - 8-K - Tennessee Commerce Bancorp, Inc. | a11-14815_18k.htm |
Exhibit 99.1
|
|
TENNESSEE COMMERCE BANCORP, INC. NASDAQ: TNCC www.tncommercebank.com |
|
|
2 Cautionary Note Regarding Forward-Looking Statements This presentation contains forward-looking statements within the meaning of Section 27A of the Securities Act of 1933 and Section 21E of the Securities Exchange Act of 1934. Forward-looking statements, which are based on assumptions and estimates and describe our future plans, strategies, and expectations, are generally identifiable by the use of the words “anticipate,” “will,” “believe,” “may,” “could,” “would,” “should,” “estimate,” “expect,” “intend,” “seek,” or similar expressions. These forward-looking statements may address, among other things, our business plans, objectives or goals for future operations or expansion, including efforts to increase core deposits, our forecasted revenues, earnings, assets, or other measures of performance, including asset performance, or estimates of risks and future costs and benefits. Although these statements reflect our good faith belief based on current expectations, estimates and projections, they are subject to risks, uncertainties and assumptions, and are not guarantees of future performance. Important factors that could cause actual results to differ materially from the forward-looking statements we make in this presentation include, but are not limited to: the effects of future economic, business and market conditions and changes, domestic and foreign, that may affect general economic conditions; governmental monetary and fiscal policies; legislative and regulatory changes, including changes in banking, securities and tax laws, regulations and policies and their application by our regulators, and changes in the scope and cost of FDIC insurance and other coverage; negative developments in the financial services industry and U.S. and global credit markets; the effect of capital constraints on our pace of growth and our ability to raise additional capital when needed, and the Dodd-Frank Act, which changes the definition and amounts of minimum capital required of banking institutions; the risks of changes in interest rates on the levels, composition and costs of deposits, loan demand and the values and liquidity of loan collateral, securities and interest-sensitive assets and liabilities; fluctuations in non-interest income, including limitations on bank fees and charges contained in the Dodd-Frank Act; the financial health of the local economies in which we do business; our concentration of commercial and industrial loans; the sufficiency of our current sources of funds; our use of internet and brokered deposits; informal or formal enforcement actions to which we may become subject; our reliance on key personnel; changes in accounting policies, rules and practices; changes in borrower credit risks and payment behaviors; changes in the availability and cost of credit and capital in the financial markets; changes in the prices, values and sales volumes of real and personal property that we need to dispose of following foreclosure; the failure of assumptions and estimates underlying the establishment of reserves for possible loan losses and other estimates; certain risks related to mergers, acquisitions and divestitures, including, without limitation, the related time and costs of implementing such transactions, integrating operations as part of these transactions and possible failures to achieve expected gains, revenue growth and/or expense savings from such transactions; changes in technology or products that may be more difficult and costly or less effective than anticipated; the payment and liquidation rights of holders of our Fixed Rate Cumulative Perpetual Preferred Stock, Series A, and holders of our subordinated debentures; any future issuances of our common stock or other equity securities; reductions in our deferred tax assets; reductions in the amount of net operating loss carry-forwards that we may be able to utilize for income tax purposes; and other factors and risks described in any of our reports filed with the Securities and Exchange Commission under the Securities Exchange Act of 1934. If one or more of these risks or uncertainties materialize, or if any of our underlying assumptions prove incorrect, our actual results, performance, or achievements may vary materially from future results, performance, or achievements expressed or implied by these forward-looking statements. All forward-looking statements attributable to us or persons acting on our behalf are expressly qualified in their entirety by the cautionary statements in this section. We do not intend to and assume no responsibility for updating or revising any forward-looking statements contained in this presentation, whether as a result of new information, future events, or otherwise. |
|
|
3 Company Overview Tennessee Commerce Bank is a $1.5 billion business bank located in Franklin, TN, within the Nashville MSA Core strategic focus on secured lending to small and mid-sized businesses Over 50% of our loan portfolio consists of C&I Focused on C&I lending for over a decade The vast majority of our loans are well secured by a variety of collateral Highly experienced management team Majority of the senior management team has 30+ years of commercial lending experience Lenders have on average 20+ years of experience |
|
|
4 Company Profile Business bank focused on secured lending to small and medium sized businesses, entrepreneurs and professionals in the Nashville Metropolitan Market Headquartered in Franklin (Williamson County), TN Assets: $1.5 billion Net Loans: $1.2 billion TBV / Share: $7.05 Market Cap (June 9, 2011): $30.5 million Price / Tangible Book Value: 0.35x Net Interest Margin (Q1 2011): 3.89% Efficiency Ratio (Q1 2011): 59.56% TCE / TA: 5.65% Tier 1 Common Ratio: 6.93% Total Risk Based Capital Ratio: 12.19% |
|
|
5 Investment Highlights Business Bank approach focused on lending to small and medium sized enterprises (“SME”) Decade of C&I lending experience 38.1% CAGR in assets over last 10 years; not reliant on M&A for growth Experienced management team whose interests are aligned with shareholders Attractive market demographics Local economy has experienced rapid growth from diverse industries including health services, education, automotive, publishing, insurance and technology Williamson County has 18th highest median income in the U.S. and is the fastest growing county in Tennessee Franklin, Tennessee was selected as the 8th best city for startups according to Bloomberg Businessweek 2010 High concentration of entrepreneurs in local business community Differentiated business model Long-term relationships and a firm understanding of our clients’ businesses and cash flows Ability to evaluate opportunities and respond quickly to lending opportunities Expertise in areas of specialty finance in addition to conventional commercial lending Strong emphasis on customer service results in above average returns Source: ESRI and SNL Financial |
|
|
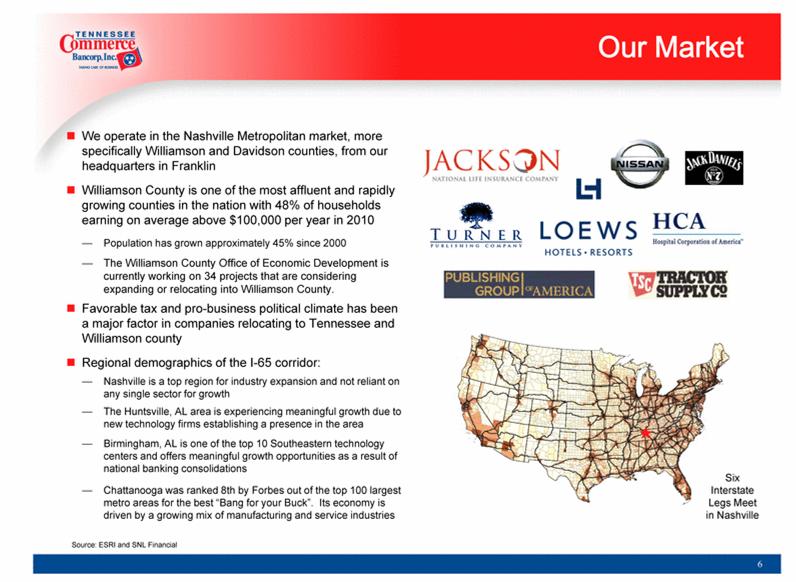
6 Our Market We operate in the Nashville Metropolitan market, more specifically Williamson and Davidson counties, from our headquarters in Franklin Williamson County is one of the most affluent and rapidly growing counties in the nation with 48% of households earning on average above $100,000 per year in 2010 Population has grown approximately 45% since 2000 The Williamson County Office of Economic Development is currently working on 34 projects that are considering expanding or relocating into Williamson County. Favorable tax and pro-business political climate has been a major factor in companies relocating to Tennessee and Williamson county Regional demographics of the I-65 corridor: Nashville is a top region for industry expansion and not reliant on any single sector for growth The Huntsville, AL area is experiencing meaningful growth due to new technology firms establishing a presence in the area Birmingham, AL is one of the top 10 Southeastern technology centers and offers meaningful growth opportunities as a result of national banking consolidations Chattanooga was ranked 8th by Forbes out of the top 100 largest metro areas for the best “Bang for your Buck”. Its economy is driven by a growing mix of manufacturing and service industries Six Interstate Legs Meet in Nashville Source: ESRI and SNL Financial |
|
|
7 Management Team Name Position Years in Industry Years at TNCC Background Michael R. Sapp Chairman, Chief Executive Officer and President 34 12 Senior Vice President – First American National Bank Lending Officer – BancOhio National Bank Frank Perez Chief Financial Officer 14 4 CFO – Cumberland Bank & Trust, Audit Manager – Crowell & Crowell, PLLC Senior Accountant – AIG American General Senior Accountant – Crowe Chizek H. Lamar Cox Chief Operating Officer 43 12 Various positions at NationsBank of Tennessee, C&S Bank, Hibernia Bank and Commerce Union Tommy Crocker Chief Risk Officer 32 6 Senior Vice President – First American National President & COO – First American Commercial Finance Doug Rogers National Lending Executive 37 7 Commercial Lender – Commerce Union Bank Commercial Lender – First American National John Burton Regional Lending Executive 37 9 Senior Vice President – Commerce Union CFO – Advanced Integrated Technologies |
|
|
8 Q1 Results Summary Net Loss in Q1, before preferred dividend, of $2,824,000; $0.26 per diluted share (after preferred dividend) Represents ROAA of (0.88)% and ROACE of (14.68)% Net interest income of $13.2 million representing a decrease of 0.72% compared to Q1 2010 Net interest margin of 3.89% Efficiency ratio of 59.56% Pre-tax, pre-provision income of $4.5 million Q1 Credit trends: Adjusted NPAs¹ increased $3.3 million from the fourth quarter of 2010 to 6.83% of total assets (slightly offset by a $2.9 million reduction in repossessed assets) NPLs + loans 90 days past due increased $6.8 million from the fourth quarter to 5.3% of total loans LLP increased $5.2 million from the fourth quarter to $8.9 million Reserves increased from the fourth quarter to $26.1 million, representing 2.16% of total loans ¹ Adjusted non-performing assets are comprised of nonaccrual loans, troubled debt, loans 90+ days past due, repossessions and other real estate owned |
|
|
9 C&I Focus No shared national credits and sub-prime or alt-A loans Going forward focus is on direct / owner managed business lending in markets we know well Re-mixture of loan portfolio from 60/40 to 80/20 in our target area Specialty lending focused on USDA credit enhancement under its Rural Development Program and Business and Industry Guaranteed Loan Program Expertise in equipment and asset-based lending High customer attraction and retention rate due to service-oriented business model Scalable business platform and efficient operating model |
|
|
10 Efficient Model Efficiency Ratio Assets Per Employee (millions) Revenue Per Employee (1) (millions) ¹ Annualized |
|
|
11 Deposit Composition Q1 2011 Types of Deposits Q1 2010 Q1 2011 % ? Money Market & Savings 302,636 $ 478,880 $ 58.24% Demand & Now 27,895 39,570 41.85% IRA 36,321 36,616 0.81% Time Deposits < $100,000 434,548 514,434 18.38% Time Deposits > $100,000 298,323 197,536 -33.78% Brokered deposits 140,112 103,021 -26.47% Total Deposits 1,239,835 $ 1,370,057 $ 10.50% Deposit Metrics Core Deposits / Total Deposits 65.03% 78.00% Cost of Total Deposits 2.11% 1.68% Loans / Total Deposits 94.05% 86.31% Wholesale / Total Deposits 35.36% 21.94% |
|
|
12 Deposit Strategy Our nearest branch is on your phone, laptop or desktop computer, rather than in a brick and mortar location Significant opportunities exist in our current business book to increase deposits Cross-sell depository services to our existing borrowing customers, as less than 10% currently have deposit relationships Cross-sell checking, bill payment and internet banking to current CD customers Acquire new depository customers by focusing on municipalities and high balance businesses through direct calling and technology based products An experienced deposit-focused team New Chief Deposit Officer Deposit team is being created and incentivized based on number and type of acquired accounts and average balances We began targeting deposit prospects in early July 2010 We continue to increase our product and service offerings to our clients Significant investments have been made in internet banking systems Deployed BlackBerry and iPhone apps; Droid app in process Remote Capture Allows customers to make deposits from their place of business Gives us more transparency into our customers’ cash flows Free Courier Service Suite of cash management products and services |
|
|
13 Loan Portfolio Composition Q1 2011 Q1 2011 624,266 $ 51.65% Traditional C&I 407,612 Large Specialty Lending 89,729 Small Specialty Lending 126,925 116,337 9.63% Commercial 104,528 Retail 11,809 42,802 3.54% 313,543 25.94% Non-Owner Occupied 182,361 Owner Occupied 100,606 Multi Family 30,576 3,222 0.27% 108,440 8.97% 1,208,610 $ Total Commercial & Industrial Real Estate-Construction Real Estate 1-4 Family Real Estate-Commercial Consumer Tax Leases |
|
|
Profitability Metrics 14 Net Interest Margin Return on Average Common Equity Return on Average Assets Pre-Tax Pre-Provision Earnings Per Share |
|
|
15 Credit Metrics Net Charge-offs / Average Loans Nonperforming Assets / Assets Nonperforming Loans / Gross Loans Loan Loss Reserve / Nonperforming Loans Q1 2011 has $27.7 million in repossessed assets that have been marked to market and are being held on the balance sheet as part of management’s strategy to take advantage of potential price appreciation as economic conditions improve. |
|
|
Capital Position 16 12/31/2010 03/31/2011 Tangible Common / Tangible Assets 6.14% 5.65% Tier 1 Leverage 9.94% 9.73% Tier 1 Common 7.28% 6.93% Tier 1 Capital 11.37% 10.93% Total Capital 12.62% 12.19% |
|
|
Conclusion 17 Experienced management team, interests aligned with shareholders Attractive geography with strong organic growth prospects Seasoned performance Current focus on emerging stronger from the uncertainties emanating from the economic downturn and regulatory environment Significant growth opportunities, ability to capitalize on current market dislocation Differentiated business model Attractive valuation |
|
|
Reconciliations 18 The Company utilizes the efficiency ratio when evaluating the performance of the Company. The Company believes the efficiency ratio to be an important measure of financial strength of the Company. Reconciliation of Pre-Tax Pre-Provision (Unaudited) 2006 2007 2008 2009 2010 2010 Q1 2011 Q1 (Dollars in thousands) Net Income (loss) 7,734 $ 10,539 $ 12,526 $ (5,578) $ 3,444 $ 1,729 $ (2,824) $ Provision for loan loss 4,350 6,350 9,111 31,039 20,011 4,600 8,948 Income tax expense (benefit) 2,985 3,643 4,772 (3,407) 1,768 1,098 (1,651) Pre-tax, pre-provision income 15,069 $ 20,532 $ 26,409 $ 22,054 $ 25,223 $ 7,427 $ 4,473 $ Reconciliation of Efficiency Ratio (Unaudited) 2006 2007 2008 2009 2010 2010 Q1 2011 Q1 (Dollars in thousands) Non-interest expense 9,056 $ 13,263 $ 17,608 $ 21,305 $ 29,665 $ 6,509 $ 6,588 $ Net-interest income 19,377 27,272 34,951 44,916 52,505 13,249 13,153 Non-interest income 1,763 2,880 4,294 (1,557) 2,383 687 (2,092) Net revenues 21,140 $ 30,152 $ 39,245 $ 43,359 $ 54,888 $ 13,936 $ 11,061 $ Efficiency Ratio 42.84% 43.99% 44.87% 49.14% 54.05% 46.71% 59.56% |
|
|
Reconciliations 19 Tangible common equity to tangible assets is defined by the Company as total shareholders' equity, excluding preferred stock, net of discount, and common stock warrant, reduced by goodwill and other intangible assets, divided by the difference of total assets less goodwill and other intangible assets. Management believes the ratio of tangible equity to tangible assets is important to investors who are interested in evaluating the adequacy of the Company's capital levels. . Reconciliation of Tangible Common Equity to Tangible Common Assets (Unaudited) 2006 2007 2008 2009 2010 2010 Q1 2011 Q1 (Dollars in thousands) Tangible Assets: Total Assets 623,518 $ 900,153 $ 1,218,084 $ 1,383,432 $ 1,453,166 $ 1,382,851 $ 1,521,343 $ Less: Goodwill - - - - - - - Other identifiable intangible assets - - - - - - - Total assets 623,518 900,153 1,218,084 1,383,432 1,453,166 1,382,851 1,521,343 Tangible Shareholders' Equity: Total shareholders' equity 51,224 63,121 101,747 96,292 119,337 98,407 116,210 Less: Goodwill - - - - - - - Preferred stock, net of discount - - (29,547) (29,632) (29,724) (29,655) (29,747) Warrant - - (453) (453) (453) (453) (453) Total tangible common equity 51,224 $ 63,121 $ 71,747 $ 66,207 $ 89,160 $ 68,299 $ 86,010 $ Tangible common equity to tangible assets 8.22% 7.01% 5.89% 4.79% 6.14% 4.94% 5.65% |
|
|
20 Investor Relations Contact Frank Perez, Chief Financial Officer Tennessee Commerce Bancorp, Inc. 381 Mallory Station Rd. Franklin, TN 37067 Tel: (615) 599-2274 Fax: (615) 807-3206 Email: IR@tncommercebank.com |

|
|
21 |