Attached files
| file | filename |
|---|---|
| EX-23.1 - SUPERTEX 10K FY11 EXHIBIT 23.1 - SUPERTEX INC | supx10kfy11exhibit23-1.htm |
| EX-31.2 - SUPERTEX 10K FY11 EXHIBIT 31.2 - SUPERTEX INC | supx10kfy11exhibit31-2.htm |
| EX-21.1 - SUPERTEX 10K FY11 EXHIBIT 21.1 - SUPERTEX INC | supx10kfy11exhibit21-1.htm |
| EX-32.1 - SUPERTEX 10K FY11 EXHIBIT 32.1 - SUPERTEX INC | supx10kfy11exhibit32-1.htm |
| EX-32.2 - SUPERTEX 10K FY11 EXHIBIT 32.2 - SUPERTEX INC | supx10kfy11exhibit32-2.htm |
| EX-31.1 - SUPERTEX 10K FY11 EXHIBIT 31.1 - SUPERTEX INC | supx10kfy11exhibit31-1.htm |
|
UNITED STATES
|
|
SECURITIES AND EXCHANGE COMMISSION
|
|
Washington, D.C. 20549
|
|
FORM 10-K
|
|
(MARK ONE)
|
|
|
(x)
|
Annual Report Pursuant to Section 13 or 15(d) of the Securities Exchange Act of 1934 (Fee Required)
For the fiscal year ended April 2, 2011
|
|
or
|
|
|
( )
|
Transition Report Pursuant to Section 13 or 15(d) of the Securities and Exchange Act of 1934
For the transition period from _______ to ________
|
|
Commission File No. 0-12718
|
|
|
SUPERTEX, INC.
|
|
|
(Exact name of Registrant as specified in its charter)
|
|
|
California
|
94-2328535
|
|
|
(State or other jurisdiction of incorporation or organization)
|
(I.R.S. Employer Identification No.)
|
|
|
1235 Bordeaux Drive, Sunnyvale, California 94089
|
||
|
(Address of principal executive offices)
|
||
|
Registrant's Telephone Number, Including Area Code: (408) 222-8888
|
||
|
Securities registered pursuant to Section 12(b) of the Act:
|
||
|
Title of each class: Common Stock
|
Name of each exchange on which registered: NASDAQ Global Select Market
|
|
|
Securities registered pursuant to Section 12(g) of the Act: None
|
||
|
Indicate by check mark if the registrant is a well-known seasoned issuer, as defined in Rule 405 of the Securities Act. Yes o No x
|
||
|
Indicate by check mark if the registrant is not required to file reports pursuant to Section 13 of Section 15(d) of the Act. Yes o No x
|
||
|
Indicate by check mark whether the Registrant (1) has filed all reports required to be filed by Section 13 or 15(d) of the Securities Exchange Act of 1934 during the preceding 12 months (or for such shorter period that the Registrant was required to file such reports), and (2) has been subject to such filing requirements for the past 90 days. Yes x No o
|
||
|
Indicate by check mark whether the registrant has submitted electronically and posted on its corporate Website, if any, every Interactive Data File required to be submitted and posted pursuant to Rule 405 of Regulation S-T (§229.405 of this chapter) during the preceding 12 months (or for shorter period that the registrant was required to submit and post such files). Yes o No o
|
||
|
Indicate by check mark if disclosure of delinquent filers pursuant to Item 405 of Regulation S-K (Sec. 229.405 of this chapter) is not contained herein, and will not be contained, to the best of registrant’s knowledge, in definitive proxy or information statements incorporated by reference in Part III of this Form 10-K or any amendment to this Form 10-K. o
|
||
|
Indicate by check mark whether the registrant is an accelerated filer (as defined in Rule 12b-2 of the Act). Check one.
Large accelerated filer o Accelerated filer x Non-accelerated filer o Smaller Reporting Company o
|
||
|
As of October 1, 2010, the last business day of the registrant’s most recently completed second fiscal quarter, there were 12,995,905 shares of the registrant’s common stock outstanding, and the aggregate market value of such shares held by non-affiliates of the registrant was $247,183,092, based on the closing price reported on the NASDAQ National Market on October 1, 2010. Shares of common stock held by officers, directors and other persons who may be deemed “affiliates” of the Registrant have been excluded from this computation. This determination of affiliate status is not necessarily a conclusive determination for other purposes. The total number of shares outstanding of the Registrant's common stock as of June 3, 2011, was 12,714,713.
|
||
|
Indicate by check mark whether the registrant is a shell company (as defined in Rule 12b-2 of the Act). Yes o No x
|
||
|
Documents Incorporated by Reference: Part III incorporates by reference portions of the Company's definitive proxy statement for the Annual Meeting of Shareholders to be held on August 19, 2011 (the "Proxy Statement").
|
||
|
Exhibit Index is on Page 70
|
||
|
Total number of pages is 71
|
||
SUPERTEX, INC.
ANNUAL REPORT - FORM 10K
Table of Contents
|
PART I
|
|||||
|
|
Page
|
||||
|
Item
|
1.
|
Business………………………………………………………………………………………..............................................................................................................
|
1
|
||
|
Item
|
1A.
|
Risk Factors…………………………………………………………………………………................................................................................................................
|
9
|
||
|
Item
|
1B.
|
Unresolved Staff Comments………………………………………………………………….............................................................................................................
|
13
|
||
|
Item
|
2.
|
Properties……………………………………………………………………………………................................................................................................................
|
13
|
||
|
Item
|
3.
|
Legal Proceedings…………………………………………………………………………….............................................................................................................
|
14
|
||
|
Item
|
4.
|
Removed and Reserved………………………………………………………………………...........................................................................................................
|
14
|
||
|
PART II
|
|||||
|
Item
|
5.
|
Market for Registrant's Common Equity, Related Shareholder Matters and Issuer Purchases of Equity Securities………………………………...........
|
15
|
||
|
Item
|
6.
|
Selected Financial Data………………………………………………………………………...........................................................................................................
|
19
|
||
|
Item
|
7.
|
Management's Discussion and Analysis of Financial Condition and Results of Operations….............................................................................................
|
19
|
||
|
Item
|
7A.
|
Quantitative and Qualitative Disclosures about Market Risk…………………………………...................................................................................................
|
34
|
||
|
Item
|
8.
|
Financial Statements and Supplementary Data……………………………………………….......................................................................................................
|
35
|
||
|
Item
|
9.
|
Changes in and Disagreements with Accountants on Accounting and Financial Disclosure…
|
35
|
||
|
Item
|
9A.
|
Controls and Procedures………………………………………………………………………........................................................................................................
|
35
|
||
|
Item
|
9B.
|
Other Information…………………………………………………………………………….............................................................................................................
|
37
|
||
|
PART III
|
|||||
|
Item
|
10.
|
Directors, Executive Officers, and Corporate Governance……………………………………...................................................................................................
|
37
|
||
|
Item
|
11.
|
Executive Compensation……………………………………………………………………….......................................................................................................
|
37
|
||
|
Item
|
12.
|
Security Ownership of Certain Beneficial Owners and Management and Related Stockholder Matters ............................................................................
|
37
|
||
|
Item
|
13.
|
Certain Relationships and Related Transactions, and Director Independence………………................................................................................................
|
38
|
||
|
Item
|
14.
|
Principal Accountant Fees and Services………………………………………………………....................................................................................................
|
38
|
||
|
PART IV
|
|||||
|
Item
|
15.
|
Exhibits and Financial Statement Schedules…………………………………………………....................................................................................................
|
39
|
||
|
|
|||||
|
Signatures
|
…………………………………………………………………………………………………........................................................................................................
|
41
|
|||
PART I
Item 1. Business
This Annual Report on Form 10-K includes forward-looking statements. These forward-looking statements are not historical facts, and are based on current expectations, estimates, and projections about our industry, our beliefs, our assumptions, and our goals and objectives. Words such as "anticipates," "expects," "intends," "plans," "believes," "seeks," and "estimates," and variations of these words and similar expressions, are intended to identify forward-looking statements. Examples of the kinds of forward-looking statements in this report include statements regarding the following: (1) our expectation that our recently introduced and future new products to be drivers for increased revenue and that our growth strategy relies on our ability to continuously and successfully introduce and market new innovative products that meet our customers’ requirements; (2 ) our expectation to introduce a greater number of products for the ultrasound market in fiscal 2012 than in fiscal 2011 and our belief that we will continue to be a major player in this business; (3) our expectation to introduce a significant number of new LED driver products for the solid-state lighting market in fiscal 2012, that this market will continue to increase in fiscal 2012 and become a large market during the next few years; (4) our expectation to leverage our newly-developed high voltage design processes to introduce many new products and expect to complete many of the approximately 60 products currently under development during fiscal years 2012 and 2013; (5) our belief that our position as a leading supplier in our targeted markets can only be maintained through continuous investments in research and development; (6) our belief that we are well positioned to fulfill our wafer manufacturing capacity needs for the near future and that almost all of the current backlog will be shipped in fiscal 2012; (7) we see significant opportunities with medical ultrasound imaging machine companies in China and Korea for our medical ultrasound products ; (8) our expectation that shipments of our general lighting drivers will continue to increase during fiscal 2012 which will drive increases in our overall sales to the LED lighting market from the current quarterly run rate; (9) our efforts to strive to be the technology enabler for our customers; (10) our belief that our patents may have value and that our success depends primarily on the experience, creative skills, technical expertise, and marketing ability of our personnel rather than on the ownership of patents; (11) our belief that our continued growth and success will depend in part on our ability to attract and retain highly skilled employees; (12) our expectation that our international sales will continue to account for a significant portion of our total sales; (13) our belief that possible claims and assessments are unlikely to result in a material adverse impact; (14) our belief that we will be able to recover our ARS at par value in a future period, that the estimated range of fair value of our ARS is appropriate, that their credit quality is high and that the auction failures will not materially impact our ability to fund our working capital needs, capital expenditures and other business requirements; (15) our board of directors’ intention not to pay a cash dividend; (16) our belief that our deferred tax assets will be utilized; (17) our expectation that R&D spending in fiscal year 2012 will be between 16% and 20% of net sales; (18) our expectation to spend approximately $6,600,000 for capital acquisitions in fiscal 2012; (19) our belief that we have substantial production capacity in place to handle any projected increase in business in fiscal 2012 and our belief that existing cash, cash equivalents and short-term investments, together with cash flow from operations, will be sufficient to meet our liquidity and capital requirements through the next twelve months; (20) our belief that the effect of our contractual obligations will be minimal on liquidity and cash flow in future periods; (21) our belief that our cash exposure to fluctuations on foreign exchange rates is relatively small, thus we do not employ hedging techniques designed to mitigate this foreign currency exposure; and (22) our targeting to repurchase the approximately remaining $54 million of shares in the next two years in our share repurchase program. These statements are only predictions, are not guarantees, of future performance, and are subject to risks, uncertainties, and other factors, some of which are beyond our control and are difficult to predict, and could cause actual results to differ materially from those expressed or forecasted in the forward-looking statements. These risks and uncertainties include those described in Item 1A “Risk Factors” and elsewhere in this report, as well as the risks (1) that our patents may not have material value and that there may not be a market to cross-license them; (2) that there may be alternative ways for us to maintain our competitive position than through investments in R&D, that these alternatives may cost us less money or be more effective than investments in R&D, that our investments in R&D may not result in new products, and that even if our investments in R&D result in new products, these products may not enable us to maintain our competitive position; (3) that the failures of the auction markets may continue and the government guarantees on our securities may not be as strong as we had thought so that we would incur losses on our ARS; (4) that we will not generate enough cash from operations to meet our cash and working capital requirements through the end of fiscal 2012 especially in light of our stock repurchase program; (5) that we need to spend more on capital acquisitions than anticipated, or that we overestimate or underestimate our need for capital acquisition; (6) that changes in short-term interest rates are significant enough to affect our investment portfolio; (7) that our customers and potential customers will not design our devices into their products or their products containing our devices will not have the demand we anticipate, or competitors will design products in our niche and drive down our prices and gross margins; (8) that our newly introduced products will not be widely adopted so that they do not generate substantial revenue; and (9) that our estimates of trends in our focus markets are inaccurate and in particular that the medical ultrasound opportunities in South Korea and China may not materialize and the use of LEDs in general lighting may not expand. Except as required by law, we undertake no obligation to update any forward-looking statement, whether as a result of new information, future events, or otherwise.
1
Supertex, Inc. (“Supertex,” the “Company,” “we,” and “us”) is a producer of high voltage analog and mixed signal semiconductor components. We design, develop, manufacture, and market integrated circuits (“ICs”), utilizing state-of-the-art high voltage DMOS, HVCMOS and HVBiCMOS analog and mixed signal technologies. With respect to our DMOS transistor products, we maintain an established application specific position in providing key products for the industrial, telecommunications, instrumentation, medical, and automatic test equipment (“ATE”) industries. We are also an industry leader in high voltage ICs (HVCMOS and HVBiCMOS), taking advantage of the best features of CMOS, bipolar and DMOS technologies and integrating them into the same chip. These ICs are used in the medical ultrasound imaging, LCD TV LED backlighting, LED general lighting, telecommunications, printer, flat panel display, industrial and consumer product industries.
We market and sell our products through direct sales personnel, independent sales representatives and distributors in the United States of America and abroad, primarily to original equipment manufacturers of electronic products. Our executive offices are located at 1235 Bordeaux Drive, Sunnyvale, California, 94089, and our principal manufacturing facilities are located in San Jose, California, and in Hong Kong. We have two design centers, one in our Sunnyvale worldwide headquarters and the other in our wholly owned subsidiary, Supertex, Ltd. in Hong Kong. Our Hong Kong facility also houses the headquarters of Supertex, Ltd., worldwide logistic and distribution center, and production test facilities. We maintain ten direct field sales offices located in the following areas: Irving, Texas; Oley, Pennsylvania; the United Kingdom; Germany; Hong Kong, Shanghai & Shenzhen, China; Taiwan; Japan; and South Korea. Our headquarters’ mailing address is 1235 Bordeaux Drive, Sunnyvale, California 94089 and the telephone number is (408) 222-8888. Our website address is www.supertex.com. The content of the website is not incorporated into this Form 10-K.
Products and Markets
Our four target markets are medical electronics, LED lighting, imaging, and telecom. Our products are primarily used in or with medical ultrasound imaging equipment, large commercial ink-jet printers, LED general lighting and light emitting diodes (“LEDs”) for backlighting LCD TVs, electro-luminescent (“EL”) lamps for backlighting cell phone keypads and LCD displays, and optical MEMS for telecommunications switches. Our products are basically interface products, interfacing between low voltage logic circuits and high voltage “real world” media and vice versa. We supply both standard and custom products. The typical gestation period of our new products from introduction through design-in by the customer to volume production is one year, although certain products for medical applications have longer gestation periods. During fiscal 2011, we introduced twenty new standard products, the majority of which were aimed at high growth markets such as medical ultrasound imaging and solid-state LED lighting. We expect our recently introduced products as well as our future new products to be drivers for increased revenue as our customers design them into their products under development which they then introduce and which start volume production.
We also provide custom processing services for the manufacture of ICs, using customer-owned designs and mask tooling. Under this “custom processing service” or “foundry” arrangement, a tangible product is made and sold, and the Company bears the risk of loss until title is passed. Title to the product under the custom processing service arrangement is passed to the customer at the time of shipment from our facility. During fiscal 2011, sales of custom processed products represented approximately 11% of our total revenues compared to 14% in fiscal 2010. Sales of custom processing services are categorized and included in the sales of our target markets.
2
The products in our target markets are described below.
The Medical Electronics Market
We have provided both standard and high-end custom ICs to the ultrasound imaging market for many years and have established key business relationships with leading OEMs. The products we manufacture for this market include high voltage analog multiplexer switches, pulsers, high-speed MOSFET drivers and discrete high voltage MOSFETs and arrays.
We have dominated the high voltage analog switch and high voltage integrated pulser product offerings in this market segment for many years. In recent years, the overall ultrasound market has been shifting to portable ultrasound imaging units. These high-performance, portable, affordable imaging systems are accelerating the proliferation of ultrasound imaging systems to medical specialties in addition to cardiology and obstetrics/gynecology (“OB/GYN”). Even within these traditional clinical diagnostic segments, cardiology ultrasound imaging is showing an exciting pipeline of technological innovations and strong procedural volume growth. The adoption of ultrasound imaging by new user groups -- surgeons and emergency ward physicians -- is also spurring medical ultrasound imaging system market growth.
Our high voltage expertise affords us a dominant position in the ultrasound “transmit” market with MOSFET drivers, high voltage analog switches and multiplexers, high voltage pulsers, and complementary high voltage MOSFET arrays. We released ten new medical ultrasound products in fiscal 2011, and expect to introduce a greater number of products for the ultrasound imaging market in fiscal 2012.
The market for our ultrasound imaging products continues to grow. The capabilities and performance of the machines that utilize our products continue to improve, allowing them to be used more broadly across a wider spectrum of imaging applications than ever before. Geographically, the market is expanding as well. Traditionally, the United States, Europe and Japan were the main designers and producers of medical ultrasound machines. While companies in these areas continue to grow and develop new machines, today we are also seeing significant opportunities for us from ultrasound machine companies in China and Korea.
The LED Drivers Market
Supertex offers an extensive line of high-performance LED driver products for the solid-state lighting market, ranging from simple, low-cost linear regulators to feature-rich switching regulators configured in buck, boost, buck-boost, and single ended primary inductance converter (“SEPIC”) topologies. As one of the pioneers in the high voltage LED driver IC market, we have established a strong market position. We have developed many efficient and cost effective products for general lighting in automotive, industrial, and consumer applications, and for backlighting LCD TVs, monitors and laptop screens. We expect to introduce a significant number of new LED driver products for the solid-state lighting market in fiscal 2012.
The Imaging Market
We offer the following two product lines:
|
(1)
|
A family of products for driving electroluminescent (“EL”) lamps for backlighting hand-held instruments, such as cell phone keypads, watches, monochrome flat screens and MP3 players. We are one of the key providers of EL drivers for cell phones and watches, and we have a significant share of this market due to our patented inductorless EL driver ICs.
|
|
(2)
|
Driver ICs for driving non-impact printers and plotters, primarily using inkjet technologies. Our printer product family is used in ink-jet and electrostatic types of printers and plotters that are mostly high-end products with full glossy color capability, high resolution and high-speed output.
|
The Telecommunications (“Telecom”) Market
We provide high voltage amplifier ICs to drive optical micro-electro-mechanical systems (MEMS) for the telecommunications market for use in optical switching applications. Our MEMS driver ICs feature 32 channels per chip and are capable of driving output voltages of up to 300 volts. We also produce high voltage electronic switch ICs that replace typical electromechanical or mechanical hook switches in telephones, high voltage ICs for use as ring generators, and protection ICs for line cards.
3
The Industrial/Other Market
This market category primarily represents ICs and DMOS devices we design and manufacture for various industrial and other catch-all applications. Also included in this category are high voltage driver ICs used in ATE and power management ICs.
Net sales generated from each of these markets is discussed under “Management’s Discussion and Analysis of Financial Condition and Results of Operations” in the “Net Sales” section.
As a leading provider of products to these specific markets, we have been able to work very closely with key Tier-1 customers to define new products and identify their future product needs. Such close collaboration has facilitated our development of a wide range of leading-edge new products and has allowed our customers to quickly develop new and more advanced products for their markets. While we work with certain Tier-1 customers to design new products, generally such products have broader applications so that they are useful to multiple customers.
In the DMOS transistor technology, we focus on certain specific niches such as very low threshold, low capacitance, and low leakage devices where these features justify a premium and are most suitable for special applications such as medical ultrasound imaging, LED lighting, telecommunication, ATE, and hand-held instruments. These high voltage DMOS transistor products also serve as building blocks and predecessors to a fully integrated solution of our high voltage ICs.
We operate in one business segment. Information regarding Supertex, Inc.’s Segment Reporting can be found in Note 13 to the Consolidated Financial Statements.
Research and Development
We incurred expenses of $14,851,000, $15,404,000, and $14,553,000 on research and development activities during fiscal years 2011, 2010 and 2009, respectively. Our research and development activities in fiscal 2011 were dedicated to developing new high voltage processes, both internal and with external foundry partners, resulting in a total of twenty new standard product introductions. The products introduced in fiscal 2011 were primarily targeted for use in the rapidly growing LED and medical ultrasound industries. As we move forward into fiscal 2012, we expect to leverage our newly-developed high voltage design processes to introduce many new products for these markets, as well as for our other target markets. There are currently approximately 60 products in development, many of which are expected to be completed during fiscal years 2012 and 2013, although there is no assurance that all these products will be completed or introduced due to market conditions, technical difficulties, or other factors.
Our products, which we strive to make best in class, have experienced very good traction in the marketplace, leading to significant design wins in all our target markets. We believe best in class products are those that provide the best performance at a competitive price, where in the case of LED drivers performance is measured by receiving high input voltage and producing tightly controlled output current. Most of our design wins resulted from close collaboration with the Tier-1 customers in their respective markets and a shorter design and development cycle to support our customers’ needs. We believe that our position as a leading supplier in our targeted markets can only be maintained through continuous investments in research and development. We focus our efforts on designing new products with existing process technologies while also developing new process technologies to be used for future products. We continuously strive to effectively monitor and control our research and development programs in order to obtain improved performance and greater technological achievements at lower costs. Because we have our own wafer fabrication facility (“fab”) with ample capacity, and our designers have years of experience in our target markets, we can tailor our processes and circuits to meet customer needs which we can respond to much more expediently and ramp up production.
4
Manufacturing
Our manufacturing operations include wafer fabrication in San Jose, California; limited proto-type assembly and packaging in Sunnyvale, California; and product testing and quality control in Sunnyvale, California and Hong Kong. Of our long-lived tangible assets, as further described in Note 13 to our financial statements included in this annual report on Form 10-K, 21% and 17% were located in our Hong Kong facility at the end of fiscal 2011 and 2010, respectively, with the remaining balance located in the U.S. As of the end of fiscal 2011, the carrying value of all our property, plant and equipment located in Hong Kong amounted to $1,183,000.
We subcontract most of our standard product packaging and some production testing to independent contract assemblers, principally located in Thailand, Malaysia, Philippines and China. After assembly, packaged units are shipped back to our Hong Kong and Sunnyvale test facilities for final product testing and quality control before shipment to customers. Although our offshore assemblers have not experienced any serious work stoppages, political instability or other epidemics in these countries may adversely affect our assembly and test operations. Even though we have qualified assemblers in different countries to reduce risk, any prolonged work stoppage or other inability to assemble and test our products would have a material adverse impact on our operating results. Furthermore, economic risks, such as changes in tariff, currency exchange rates, or freight rates or interruptions in air transportation, could adversely affect our operating results. We also maintain a specialized assembly area at our Sunnyvale manufacturing facilities to package engineering proto-types to ensure high priority on-time deliveries and to assemble high reliability circuits required in military and other high reliability applications.
We believe that we are well positioned to fulfill our wafer manufacturing capacity needs for the near future because currently in our first quarter of fiscal 2012 our fab is running at about thirty-five percent utilization and we are able to expand capacity through hiring of additional manufacturing staff. We maintain an inventory balance based on current sales level and forecast of future demand. An amount for tactical inventory is kept in our die bank warehouse to reduce lead time in fulfilling expected, as well as unforecasted, customer orders. In addition, we carry as inventory on our balance sheet products which we own that are stored at customer hubs for some of our customers as well as products that are owned and held for resale by our distributors, both domestic and foreign, even though some of that inventory has been paid for by the distributors.
Availability of raw silicon wafers and epitaxial services began to be in tight supply during the fourth quarter of fiscal 2010 and continued through the third quarter of fiscal 2011, however supplies are currently adequate. The availability of assembly, packaging, and testing services used in the backend of our manufacturing process are also currently adequate after being subject to longer lead times during the fourth quarter of fiscal 2010 through the second quarter of fiscal 2011. These materials and services are currently obtained from multiple sources.
Environmental Laws
Government regulations impose various environmental controls on the waste treatment and discharge of certain chemicals and gases after their use in semiconductor processing. We believe that our activities substantially comply with present environmental regulations. However, increasing attention has been focused on the environmental impact of semiconductor manufacturing operations. While we have not experienced any material adverse effects on our business or financial results from our compliance with environmental regulations and installation of pollution control equipment, there can be no assurance that changes in such regulations, such as the passing of California Assembly Bill 32, “Global Warming Solutions Act”, will not necessitate our acquisition of costly equipment or compliance with other requirements in the future. We work closely with pollution experts from federal, state, and local agencies, especially from the cities of Sunnyvale and San Jose, California, to help us comply with current requirements.
Marketing and Sales
We market our standard and custom products in the United States and abroad through our direct sales and marketing personnel in our Sunnyvale headquarters and Hong Kong facility, as well as through independent sales representatives and distributors supported by our field sales managers out of our sales offices in: Texas; Pennsylvania; the United Kingdom; Germany; Hong Kong, Shanghai & Shenzhen, China; Japan; Taiwan and South Korea.
5
Our marketing organization also helps us create and satisfy customer demand and manages the strategic and tactical marketing plan for the company. Strategic marketing encompasses analyzing current market conditions, anticipating market demands, and gathering competitive information to expeditiously act on future opportunities. We maintain strategic marketing activities in order to keep pace with future customer requirements and technology advancements to stay abreast of competition. Tactical marketing focuses on customer fulfillment for requests of literature, samples and applications assistance, as well as generating quotes for pricing. We are gradually shifting our efforts towards a stronger standard product line as opposed to a mix of standard and custom products that require substantially more resources to support.
Net sales is the sum of our direct sales to original equipment manufacturers (“OEMs”) and our distributors’ resale of our products. We recognize revenue from direct product sales to end customers upon transfer of title and risk of loss, which is upon shipment of the product, provided persuasive evidence of an arrangement exists, the price is fixed or determinable, no significant obligations remain, and collection of the resulting receivable is reasonably assured. For sales to OEMs, we use either a binding purchase order or signed agreement as evidence of an arrangement. For those customers who have a hub arrangement, we recognize sales when our products are drawn from the hub to the customer’s manufacturing facility or to its assembly subcontractor’s manufacturing facility. Sales through our distributors are evidenced by a binding purchase order on a transaction-by-transaction basis. Because of the uncertainty associated with pricing concessions and possible returns, with the exception of certain products, we defer the recognition of such sales and the related costs of sales until our distributors have sold the merchandise to their end customers. Following a prior period change in the terms and conditions to eliminate return rights for distributors for certain products, we continued to defer revenue recognition until the distributors had sold these parts as we would grant concessions and accept some returns for a period of time after the change. Beginning the fourth quarter of fiscal 2009, for sales to distributors of certain products that are not returnable, we had sufficient history of not granting concessions to begin to recognize revenue on such items upon their shipment. Our distributors provide us an inventory balance report at the end of each period, which allows us to determine products sold to their end customers.
A significant portion of our sales is to a small number of customers. We estimate that our OEM customer, General Electric Company, accounted for 12%, 11% and 13% of our net sales from both direct and indirect channels (“combined sales”) for fiscal years 2011, 2010 and 2009, respectively. Combined sales to another OEM customer, Samsung Electronics, accounted for 14% of our net sales for fiscal 2010. No other direct or indirect customers accounted for more than 10% of net sales in fiscal 2011, 2010 and 2009.
International sales represented 71%, 68% and 63% of net sales in fiscal years 2011, 2010 and 2009, respectively, and are made primarily through independent distributors to customers in Europe and Asia. Sales are attributed to a geographic area based on destination locations as opposed to customer headquarters. International sales are denominated only in U.S. dollars. Although export sales are subject to certain governmental commodity controls and restrictions for national security purposes, we have not had any material adverse effects on our business or financial results because of these limitations.
Seasonality
In previous years our medical ultrasound market has been seasonally weaker in the second half of our fiscal year. For example, in three of the past four fiscal years we experienced relatively higher sales to the medical electronics market during the first half of our fiscal year, with either the first or the second fiscal quarter being the highest quarter of our fiscal year. This is largely attributable to the effect of increased demand for our customers’ products in their December quarter as they typically take about 90 days to build a new medical ultrasound machine. This seasonality effect during fiscal 2010 was nullified due to the economic recovery during the second half of fiscal 2010. The historical seasonality pattern returned in fiscal 2011.
Backlog
Our backlog at April 2, 2011 was approximately $15,162,000 compared with $22,317,000 and $12,217,000 at April 3, 2010 and March 28, 2009, respectively. Our backlog at the end of fiscal 2010 was higher than typical due to the unexpected resurgence in customer orders coming out of the recession of 2008 to 2009. We expect that almost all of the current backlog will be shipped in fiscal 2012. However, customers may cancel or reschedule orders without significant penalty, and the price of products may be adjusted between the time the purchase order is booked into backlog and the time the product is shipped to the customer. In addition, the orders contained in our backlog may cover periods of various lengths. For these reasons, we believe that backlog may not be meaningful in predicting our actual net revenue for any future period.
6
Competition
In general, competition among suppliers of semiconductor components is intense, especially in the analog sector where the gross margins are traditionally much higher, including products for the medical electronics, imaging, telecom, LED lighting, and industrial/other markets we primarily serve. In general, we face different competitors in different markets or for different products. For example, we compete with several larger analog semiconductor companies with far greater resources although we believe we have defended our market leading positions successfully for many years. For example, we compete with Maxim, Hitachi and Texas Instruments in the medical electronic market; we compete with Rogers Durel and Micrel in the electroluminescent lighting market; and we compete with Texas Instruments, National Semiconductor, NXP and O2 Micro in the LED lighting and backlighting market. In addition, we may compete with some of our own customers which have in-house semiconductor design capabilities and may develop and in-source products to replace those that we currently sell them as did Samsung in fiscal 2011 for our LED drivers for backlighting their LED TVs.
Our products are generally not sold pursuant to long term contracts, enabling our customers to switch suppliers if they choose and making us more vulnerable to competitors. Competition in the industry is based primarily upon factors such as product prices, product performance, product line diversity, delivery capabilities, customer relationships and the ability to adapt to rapid technological change in the development of new and improved products. The weighing of these factors varies depending on the specific needs of a customer at any given point in time. We believe we are competitive with respect to these factors; however, market statistics are not generally available for many of our products. Many of our domestic and foreign competitors have larger facilities, more financial, technical, and human resources and more diverse product lines.
Among our competitive advantages and core competencies are the following: (1) high voltage analog and mixed signal circuit design and device intellectual property; (2) high voltage DMOS, HVCMOS and HVBiCMOS wafer fabrication (“fab”) processes that are high yielding and low cost and do not require our fab to have the latest submicron feature sizes; (3) owning and operating our own fab to protect our IP; and (4) having long-term close working relationships with our key customers. We capitalize on our leadership position in the niche markets we focus on by working very closely with our customers to help them with next generation products, thereby achieving design-wins in order to maintain or grow market-share in our target markets. We compete primarily on the basis of product innovation and responsiveness to changing needs of customers, including both product specifications and delivery requirements. In short, we strive to be the technology enablers for our customers.
Patents and Licenses
We hold thirty-one United States patents which will expire between 2015 and 2029, and we have additional United States patent applications pending. Although we believe that our patents may have value, there can be no assurance that our current patents or any additional patents that we may obtain in the future will provide meaningful protection from competition. We believe that our success depends primarily on the experience, creative skills, technical expertise, and marketing ability of our personnel rather than on the ownership of patents. Patents may, however, be useful for cross-license purposes and have served us well in the past.
We are not aware of any of our products infringing on any valid patent or other proprietary rights of third parties but we cannot be certain that they do not. If infringement would be alleged, there is no assurance that the necessary licenses could be obtained, or if obtained, would be on terms or conditions that would not have a material adverse effect on the Company.
7
Employees
As of April 2, 2011, we had 373 full time employees primarily located in Northern California and Hong Kong. Many of our employees are highly skilled, and we believe our continued growth and success will depend in part on our ability to attract and retain such employees. At times, like other semiconductor manufacturers, we experience difficulty in hiring and retaining sufficient numbers of skilled personnel, especially experienced analog integrated circuit designers. Engineers with analog circuit experience and training are scarcer than experienced digital engineers. Analog and mixed-signal expertise tends to be learned over time based on experience and on-the-job-training, whereas digital expertise is relatively easier to learn and is extensively taught in universities due to its overall market size. Engineers with high voltage analog circuit experience are even scarcer. We often recruit top college graduates directly from universities and train them ourselves.
We believe that the compensation, benefits, and incentives offered to our employees are competitive with those generally offered throughout the semiconductor industry. There are no collective bargaining agreements between our employees and us, and there has been no work stoppage due to labor difficulties. We consider our employee relations to be good.
Executive Officers of the Company
|
Name
|
Position with the Company
|
Age
|
Officer Since
|
|||
|
Henry C. Pao
|
President and Chief Executive Officer
|
73
|
1976
|
|||
|
Benedict C. K. Choy
|
Senior Vice President, Technology Development
|
65
|
1976
|
|||
|
William P. Ingram
|
Vice President, Wafer Fab Operations
|
63
|
1999
|
|||
|
Michael Lee
|
Vice President, I.C. Design
|
56
|
1999
|
|||
|
William Petersen
|
Vice President, Worldwide Sales
|
58
|
2001
|
|||
|
Michael Tsang
|
Vice President, Standard Products
|
52
|
2006
|
|||
|
Phillip A. Kagel
|
Vice President, Finance and Chief Financial Officer
|
61
|
2006
|
|||
|
Stephen Lin
|
Vice President, Marketing and Business Development
|
52
|
2011
|
Officers are appointed by and serve at the discretion of the Board of Directors. There are no family relationships between any directors or executive officers of the Company.
Henry C. Pao is a founder of Supertex and has served as President and Chief Executive Officer and as a Director since the Company's formation in fiscal 1976. He also served as Chief Financial Officer until October 2006. Previously, he worked at Fairchild Semiconductor, Raytheon, Sperry Rand and IBM. He has B.S., M.S., and Ph.D. degrees in Electrical Engineering from the University of Illinois at Champaign-Urbana.
Benedict C. K. Choy, a founder of the Company, joined Supertex in fiscal 1976 as Vice President, Device Technology and Process Development, and has served as Senior Vice President since February 1988. Previously, he worked at Fairchild Semiconductor, National Semiconductor, and Raytheon. He has a B.S. degree in Electrical Engineering from the University of California, Berkeley. Mr. Choy was a member of the board of directors from 1986 through August 20, 2004. In January 19, 2006, Mr. Choy was appointed by the board as a member of the board of directors of the Company to fill a vacated position and has served since.
William P. Ingram joined Supertex in April 1995 as its Director of Wafer Fab Operations. Prior to joining Supertex, he was Vice President of Technology Development at Crosspoint Solutions, before which he held management positions at Fairchild and National Semiconductor. He began his career at National Semiconductor after receiving his B.S. degree in Electrical Engineering with honors from the North Carolina State University.
Michael Lee re-joined Supertex in October 1993 as Director of I.C. Design and was promoted to Vice President of I.C. Design in 1999. Before that, he had a combined total of fifteen years of industry experience in I.C. Design. Mr. Lee began his career at Supertex in 1978 after receiving his M.S. degree in Electrical Engineering from the University of California, Berkeley.
8
William Petersen first joined Supertex in 1984 as Sales Manager for the Central Region of the United States. From 1990 through 1994, he was the Company's National Sales Manager, overseeing sales operations throughout the United States. Mr. Petersen re-joined Supertex in September 1999 as Director of Sales. He was promoted to Vice President of Worldwide Sales in April 2001. Prior to working at Supertex, he worked at Siemens as Central Area Manager from 1980-1984. Mr. Petersen attended the University of Iowa.
Michael Tsang joined Supertex in 1995 as a Product Engineer. He was promoted to Engineering Director in 2000 and to Vice President in 2006, managing our Power, Analog, Ringer, and Telecom (P.A.R.T.) Product Engineering Department. Prior to joining Supertex, he held positions in Process Engineering, Product Marketing Engineering, and Device Engineering at Siliconix. He holds a Bachelor of Science degree in Electrical Engineering from California State University, San Jose and an MBA from University of Southern California, Marshall School of Business.
Phillip A. Kagel joined Supertex in October, 2006 as Vice President of Finance and Chief Financial Officer. Previously, beginning in April, 2005, he consulted for Supertex on financial and accounting matters, with his engagement converting to full-time beginning in April, 2006, it being part-time initially so that he could consult for other companies as well. He was Senior Vice President of Finance and Chief Financial Officer of Ultra Clean Holdings from August, 2004 to March, 2005 and Senior Vice President of Finance and Chief Financial Officer of Sipex from February, 2003 to April, 2004. In addition, he consulted at Riverstone Networks, Inc. from April, 2004 to July, 2004 and he held the positions of Vice President, Controller and Vice President of Global Tax at Solectron from August, 1997 to November, 2002. He holds a Bachelor of Science degree in Mathematics from Brigham Young University and an MBA from the University of Missouri.
Stephen Lin joined Supertex in February of 2011 as Vice President of Marketing and Business Development. Prior to joining Supertex Mr. Lin consulted for various telecommunications media technology companies in China beginning February, 2010. He was Managing Director of Mobility Ventures from March 2009 to January 2010. He held VP and senior management positions at Legerity from August 2002 to January 2004, and at Zetex Asia from February 2004 to December 2006. Beginning January 2007 he was Vice President & General Manager of BU Mobile and Entertainment, Greater China until January 2009 and Board member of T3G, a TD-SCDMA division of Philips Semiconductor in Shanghai until January 2008. Mr. Lin holds BSEE and MSEE degrees from McGill University and an MBA from Santa Clara University.
Available Information
We file electronically with the SEC our annual reports on Form 10-K, quarterly reports on Form 10-Q, current reports on Form 8-K, and amendments, if any, to those reports pursuant to Section 13(a) or 15(d) of the Securities Exchange Act of 1934. The Company makes available free of charge on or through its Internet website at its internet address www.supertex.com copies of these reports as soon as reasonably practicable after filing or furnishing the information to the SEC; however the information in, or that can be accessed through, our website is not part of this annual report on Form 10-K. Copies of such documents also may be requested by contacting the Company’s Investor Relations department at (408) 222-4295.
Item 1A. Risk Factors
The following are certain risk factors that could affect our business, financial results and results of operations. These risk factors should be considered in connection with evaluating the forward-looking statements contained in this Annual Report on Form 10-K because these factors could cause the actual results and conditions to differ materially from those projected in the forward-looking statements. Investing in our common stock involves risks, including those described below. These risks are not the only ones that we face. If any of the risks actually occur, our business, financial condition or results of operations could be negatively affected. In that case, the trading price of our common stock could decline, and you may lose all or part of your investment.
9
Factors Which May Affect Operating Results
Semiconductor companies as a group are subject to many similar risks. These include the risks that (1) the demand for semiconductors decreases, as the industry has historically been very cyclical; (2) there are shortages of raw materials and/or fab capacity; or (3) there are changes in underlying circuit or process technology or fab technology. Other factors that could affect our future results include whether we can generate new bookings from both new and current products; general economic conditions, both in the United States and foreign markets, and economic conditions specific to the semiconductor industry; risks associated with customer concentration; our ability to introduce new products, to enhance existing products, and to meet the continually changing requirements of our customers; our ability to maintain and enhance relationships with our assembly and test subcontractors and independent distributors and sales representatives; and whether we can manufacture efficiently and control costs. In addition, we are subject to the risks described below, which are specific to our business:
|
·
|
The semiconductor industry is historically cyclical and subject to significant volatility. During the second half of fiscal 2009 through the first half of fiscal 2010, the severe global economic downturn caused substantial reduction in demand for our products, thereby adversely affecting our financial results. We are subject to continued fluctuations which could affect future revenues, profit and cash. Many factors affect demand for our products, including credit availability, rising interest rates, consumer spending pricing levels, and costs of materials. There can be no assurance that if the global economy recovers that our sales will increase commensurately.
|
|
·
|
We have focused our product offerings primarily on niche markets which leverage our capabilities and in which we believe we have dominance because we are a technology enabler for our customers. We generally choose markets which are sizable enough to be worth pursuing but which are not large enough to attract fierce competition. These markets could grow sufficiently to attract increased competition or else competitors could enter due to happenstance or downturns elsewhere. One of our emerging markets is driver ICs for LED lighting and backlighting, which has begun to grow and is expected to become a large market during the next few years and is beginning to attract severe competition. In addition, our niche markets might be more susceptible to shrinkage than more diverse markets due to their concentration on a few product offerings.
|
|
·
|
We work with our customers to develop products that they will design into their systems. Even if we do achieve a design win, the customer’s system may never go into production or the production volume may be smaller than we had anticipated. Although we attempt to develop products which will be useful for multiple customers, we may misjudge the market and develop a product which may be useful for only a very few customers.
|
|
·
|
A significant portion of our sales are from a small number of customers and the loss of one of these customers or failure to collect a receivable from them could adversely affect our operations and financial position. We do not have a long-term distributorship agreement with any of our distributors. Normal terms and conditions of sale apply, which include a 60-day notice of cancellation and charges for work-in-process for cancellations less than 60 days from shipment. While we have maintained a good relationship with our significant customers and distributors, deterioration in that relationship could materially and adversely affect our business and financial results. We estimate that the combined sales to General Electric Company accounted for approximately 12% of our net sales for the fiscal year ended April 2, 2011, while combined sales to General Electric Company and Samsung accounted for approximately 25% of our net sales for fiscal 2010.
|
|
·
|
We have several competitors that are substantially larger and could bring to bear substantially more resources than we have in our niche markets. We have been able to maintain profitable margins in part because of our dominance in most of our niche markets. Increased competition could cause our margins to decrease. In addition, some of our own customers have in-house semiconductor design capabilities and may develop and in-source products to replace those that we currently sell them as did Samsung in fiscal 2011 for our LED drivers for backlighting their LED TVs.
|
10
|
·
|
We sell a substantial amount of our products internationally. International sales represent 71%, 68% and 63% of net sales, for fiscal years 2011, 2010 and 2009, respectively. We expect our international sales to continue to account for a significant portion of our total sales. We also package and test most of our products abroad. Problems with foreign economies, political turmoil, wars, epidemics, fluctuations in currency exchange rate, increased freight costs, interruptions in air transportation, and generally longer receivable collection periods could disrupt our business and increase our operating expenses.
|
|
·
|
Our gross margins may fluctuate depending on many factors, including but not limited to, our product mix, competitive pricing dynamics, product yields, various manufacturing costs, plant utilization, provisions for excess and obsolete inventory, absorption of manufacturing overhead, product warranties, and returns and allowances.
|
|
·
|
We are dependent upon one fab which we own and operate. Were this fab to become unable to meet our needs for causes such as obsolescence due to process technology changes, our ability to produce our products would be adversely affected. In addition, we could encounter difficulties in operating our fab after an earthquake or any natural disaster.
|
|
·
|
Our operations may be interrupted and our business would be harmed in the event of an earthquake, terrorist act, and other disasters. Our principal executive offices, our fab facility, and major suppliers are located in areas that have been subject to severe earthquakes. In the event of an earthquake, we and/or our major suppliers may be temporarily unable to continue operations and may suffer significant property damage. Any such interruption in our ability or that of our major suppliers to continue operations at our facilities could delay the development and shipment of our products. Like other U.S. companies, our business and operating results are subject to uncertainties arising out of the economic consequences of current and potential military actions or additional terrorist activities and associated political instability, and the impact of heightened security concerns on domestic and international travel and commerce. Such uncertainties could also lead to delays or cancellations of customer orders, a general decrease in corporate spending or our inability to effectively market and sell our products. Any of these results could substantially harm our business and results of operations, causing a decrease in our revenues.
|
|
·
|
We are dependent upon continued innovation by our engineers. The competition for engineers with relevant experience is extremely intense in the Silicon Valley, where most of our engineers are located. We must compete in terms of salary, benefits, and working conditions with many start-ups which can offer more equity incentives. We established an IC Design Center in Hong Kong in fiscal 2001 where competition for qualified engineers is not as intense as that in Silicon Valley. However, a majority of our process technology activities remains in our Sunnyvale and San Jose facilities. Our innovative product design and applications activities are located in both Sunnyvale and Hong Kong facilities.
|
|
·
|
Our success depends upon our ability to protect our intellectual property, including patents, trade secrets, and know-how, and to continue our technological innovation. We cannot assure that the steps we have taken to protect our intellectual property will be adequate to prevent misappropriation or that others will not develop competitive technologies or products. The failure to obtain necessary licenses or other rights could cause us to lose market share and harm our business.
|
|
·
|
We are dependent upon the continued service of several of our key management and technical personnel. The loss of the services of one or more of our engineers, executive officers and other key personnel or our inability to recruit replacements for, or to attract, retain and motivate these individuals would be harmful to our business. We do not have long-term employment contracts with our employees.
|
11
|
·
|
We operate a fab in San Jose, California, where we use various chemicals and solvents that are regulated by various environmental agencies. We cooperate and work with these agencies to comply with these regulations. Should we nonetheless inadvertently contaminate the soil or ground water, or should the previous operator of the fab have done so, we may be responsible for significant costs to remediate the situation. As of April 2, 2011, we estimated our asset retirement obligation to be $326,000.
|
|
·
|
Failure to comply with present or future laws, rules and regulations of any kind that govern our business could result in suspension of all or a portion of production, cessation of all or a portion of operations, or the imposition of significant administrative, civil, or criminal penalties, any of which could harm our business. Depending on whether certain of our semiconductor products are subject to control under the International Traffic and Arms Regulations (“ITAR”), certain of our testing and assembly operations offshore with respect to such products may have violated ITAR. Upon discovery, we voluntarily notified the U.S. Department of State and submitted a follow-on report after completing our investigation of the facts and circumstances. Should our actions have violated ITAR, we could face substantial civil fines or other penalties at the discretion of the US Department of State, which to date has not imposed any fine or penalty. While at this time we are unable to estimate the extent of any fines or penalties or other potential losses that we may incur with respect to this matter, we believe that it is unlikely, although not remote, that the ultimate outcome would have a material adverse effect on us. Since becoming aware of these potential ITAR issues, we have moved the assembly and testing of these products to ITAR-certified onshore facilities.
|
|
·
|
A director of and the President and CEO of the Company, Henry Pao, along with his brother, Frank Pao, and the estate of their late father, Yunni Pao, collectively own approximately 13% of our outstanding stock. They have no agreement among themselves to act together with respect to the Company or their stockholdings. However, were they to act in concert, they would be our largest beneficial shareholder and may have the ability to elect one or more directors, to direct management, and to delay or prevent a change in control.
|
|
·
|
We are subject to taxation by domestic and foreign taxing authorities. Our business is subject to the application of multiple and sometimes conflicting tax laws and regulations. The application of tax laws is subject to legal and factual interpretation, judgment and uncertainty, and tax laws themselves are subject to change. Consequently, taxing authorities from various jurisdictions may impose tax assessments or judgments against us that could result in a significant change to earnings related to prior periods, and or an increase in our effective income tax rate.
|
|
·
|
The Sarbanes-Oxley Act of 2002 required us to change or supplement some of our corporate governance and securities disclosure and compliance practices. The SEC and NASDAQ have revised, and continue to revise their regulations and listing standards. These developments have increased and may continue to increase our legal compliance and financial reporting costs. These developments also may make it more difficult and more expensive for us to obtain director and officer liability insurance, and we may be required to accept reduced coverage or incur substantially higher costs to obtain coverage. This, in turn, could make it more difficult for us to attract and retain qualified members of our board of directors or qualified executive officers.
|
|
·
|
We invest our excess cash in marketable securities consisting primarily of municipal bonds, corporate bonds, auction rate securities (“ARS”), government agency bonds, discount notes and certificates of deposits. As of the end of fiscal year 2011, the ARS we owned had a par value of $32,750,000. Since the fourth fiscal quarter of 2008, the ARS market has experienced failures. The funds associated with securities that experienced failed auctions will not be accessible until a successful auction occurs, a buyer is found outside of the auction process, or the underlying securities have matured or are recalled by the issuer. Given the recent disruptions in the credit markets and the fact that the liquidity for these types of securities remains uncertain, as of April 2, 2011, we classified all of our ARS as long-term assets in our Consolidated Balance Sheet, as our ability to liquidate such securities in the next 12 months is uncertain. We have also recorded a $2,550,000 temporary decline in fair value for these investments, which in accordance with the authoritative guidance, has been recorded in Other Comprehensive Loss. We believe that we will be able to recover these securities at par value in a future period, as they are AAA or Aaa rated and, are guaranteed by the United States Department of Education. However, there is no assurance that we will be able to settle these bonds and recover the cash, nor if we do recover the cash, when this may occur. We may have to incur further impairment if the auctions of our securities continue to fail. If the fair value of these investments declines permanently or is other than temporarily impaired, we would be required to take an impairment charge which would flow through our income statement as an expense and could cause us to incur a loss for the relevant fiscal period.
|
12
|
·
|
Stock option accounting rules require charges to income due to stock compensation associated with options and result in lower reported operating results prepared in accordance with generally accepted accounting principles. The additional expenses resulting from the authoritative guidance in stock compensation may negatively impact our future stock price if we continue to utilize broad-based employee stock plans to attract and retain employees or else, if we cease doing so and others do not, it could result in a competitive disadvantage to us in the employee marketplace.
|
|
·
|
Our stock price is subject to wide fluctuations from many factors such as changing financial market conditions, variations in our quarterly operating results, changes in estimates and recommendations by securities analysts, hedging of our stock and other transactions by investors.
|
|
·
|
In January 2011, our Board of Directors designated $60 million of our cash, cash equivalents and investments for a major stock repurchase during the next twelve to twenty-four months and accordingly increased our share repurchase plan by approximately two million shares to 2,500,000 shares. Whether we utilize that much cash for stock repurchases depends upon such factors as the price of our stock, the dollar volume of transactions in our stock, and whether we learn of material non-public information at a time we do not have a 10b5-1 program in place which permits us to continue buying shares in the market. As of June 3, 2011, we had only repurchased $8.5 million of our shares, which is short of the $2.5 million run rate per month necessary to repurchase $60 million shares in twenty-four months.
|
Item 1B. Unresolved Staff Comments
None.
Item 2. Properties
We lease a building at 71 Vista Montana, San Jose, California, covering approximately 61,700 square feet where our six-inch submicron wafer fabrication and process engineering are located. In April 2010, we amended the lease term of this facility by extending the term five years to expire in April 2016.
We lease a portion of a building located at 10 Sam Chuk Street, San Po Kong, Kowloon, Hong Kong, to house our back-end processing operations including: wafer sort, final test, quality control and assembly logistics as well as our Hong Kong Design Center and our International Sales and Distribution Center. The original lease for 23,600 square feet was renewed in September 2009 and expires on November 30, 2012. A lease for additional space of 4,500 square feet was renewed in September 2009 and covers three years from September 16, 2009 to September 15, 2012. A lease for additional space of 10,000 square feet was signed in May 2008 and covers three years and from August 1, 2008 to September 30, 2011. We have an option to renew all three of these Hong Kong leases for an additional three years.
We own our corporate headquarters, a facility of approximately 42,000 square feet on approximately three acres of land at 1235 Bordeaux Drive, Sunnyvale, California, which houses the executive offices, sales and marketing, including applications, product and test engineering, R&D, prototype and hi-rel assembly, quality control, production control, corporate finance and administration staff.
We believe that our existing facilities and equipment are well maintained and are in good operating condition.
13
Item 3. Legal Proceedings
From time to time we are subject to possible claims or assessments from third parties arising in the normal course of business. Management has reviewed such possible claims and assessments with legal counsel and believes that it is unlikely that they will result in a material adverse impact on the Company’s financial position, results of operations or cash flows.
Item 4. Removed and Reserved.
14
PART II
|
Item 5.
|
Market for Registrant's Common Equity and Related Shareholder Matters and Issuer Purchases of Equity Securities
|
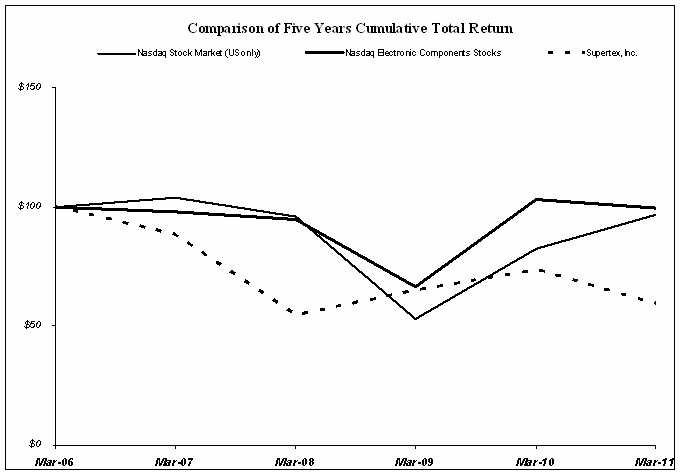
Performance Graph
This chart and graph show the value of a $100 cash investment on the last business day of fiscal year 2006 in (i) the Company’s Common Stock, (ii) the NASDAQ Composite Total Return Index – U.S., and (iii) the NASDAQ Electronic Components Total Return Index. All values assume reinvestments of all dividends and are calculated as of the last day of each of our fiscal years, except for the value of fiscal 2011, which was calculated as of March 31, 2011, as the NASDAQ has yet to release the Total Return Index for April 2011. Note that historic stock price performance shown on the graph below is not necessarily indicative of future stock price performance.
|
Fiscal Years
|
||||||||||||||||||||||||
|
2006
|
2007
|
2008
|
2009
|
2010
|
2011
|
|||||||||||||||||||
|
Nasdaq Stock Market (US only)
|
$ | 100.00 | $ | 103.69 | $ | 95.79 | $ | 53.00 | $ | 82.41 | $ | 96.85 | ||||||||||||
|
Nasdaq Electronic Components Stocks
|
$ | 100.00 | $ | 97.94 | $ | 94.65 | $ | 66.34 | $ | 102.86 | $ | 99.49 | ||||||||||||
|
Supertex, Inc.
|
$ | 100.00 | $ | 88.28 | $ | 54.57 | $ | 64.94 | $ | 73.60 | $ | 59.22 | ||||||||||||
The information contained in this Item 5 under the heading “Performance Graph” (i) is being furnished and shall not be deemed “filed” for the purposes of Section 18 of the Securities Exchange Act of 1934, as amended, or otherwise subject to the liabilities of that section, and (ii) shall not be incorporated by reference into any registration statement or other document pursuant to the Securities Exchange Act of 1934, as amended, or the Securities Act of 1933, as amended, except as shall be expressly set forth by specific reference in such filing to this Item 5 Performance Graph information.
15
Market Information
The following table sets forth the range of high and low closing sale prices reported on The NASDAQ Global Select Market under the symbol SUPX for the periods indicated.
|
Fiscal Years Ended
|
||||||||||||||||
|
April 2, 2011
|
April 3, 2010
|
|||||||||||||||
|
High
|
Low
|
High
|
Low
|
|||||||||||||
|
First Quarter
|
$ | 29.58 | $ | 23.91 | $ | 27.30 | $ | 22.49 | ||||||||
|
Second Quarter
|
27.75 | 21.88 | 31.73 | 23.05 | ||||||||||||
|
Third Quarter
|
25.84 | 21.99 | 31.27 | 23.16 | ||||||||||||
|
Fourth Quarter
|
24.88 | 20.55 | 29.80 | 22.64 | ||||||||||||
On June 3, 2011, the last reported sale price was $20.81 per share. There were 91 registered holders of record of SUPX’s common stock as of June 3, 2011. A substantially greater number of holders of its common stock are “street name” or beneficial holders, whose shares are held of record by banks, brokers and other financial institutions. We have not paid cash dividends on our common stock in fiscal years 2011 and 2010, and the Board of Directors presently intends to continue this policy in order to retain earnings for the development of the Company's business. Accordingly, it is anticipated that no cash dividends will be paid to holders of common stock in the foreseeable future.
Securities authorized for issuance under equity compensation plans
We maintain the following three shareholder-approved equity compensation plans, as further described in Note 11 to our Consolidated Financial Statements.
Employee Stock Purchase Plan - Our shareholders approved the adoption of the 2000 Employee Stock Purchase Plan (“ESPP”) and the reservation of shares of common stock for issuance under the ESPP at the August 18, 2000 annual shareholders meeting. The maximum aggregate number of common stock available for purchase under the ESPP is 500,000 shares plus an annual increase on the first day of our fiscal year of the lesser of 100,000 shares or three percent (3%) of the outstanding shares on that date or a lesser amount determined by our board of directors. During fiscal 2011, our board of directors determined not to increase the maximum aggregate number of common stock available for purchase under the ESPP. Eligible employees may elect to withhold up to 20% of their cash compensation to purchase shares of our common stock at a price equal to 95% of the market value of the stock at the end of a six-month offering period. An eligible employee may purchase no more than 500 shares of common stock during any six-month accumulation period. A total of 7,422 shares, 6,504 shares and 7,738 shares of our common stock were issued under the ESPP for fiscal years 2011, 2010 and 2009, respectively. There were 204,928 shares available for future issuance under the ESPP at the end of fiscal year 2011.
Stock Option Plans - The 2001 Stock Option Plan (the “2001 Plan”) provides for granting incentive stock options to employees and non-statutory stock options to employees and consultants; however beginning in August 2006, our board of directors determined to grant only non-statutory options. Our board of directors, acting through its designated stock option committee, determines the terms and conditions for individual options. Options granted under the 2001 Plan were granted at the fair market value of our common stock on the date of grant and generally vested over five years, 20% on the first anniversary of the grant date and 20% at the end of each of the following four years. Options granted prior to August 2007, generally have a seven-year term while options granted during or subsequent to August 2007, generally have a ten-year term, with all options expiring prior to such term thirty days after termination of service. No further options may be granted under the 2001 Plan due to the adoption of our new equity incentive plan as described in the following paragraph.
16
All outstanding stock awards granted under the 2001 Plan will continue to be subject to the terms and conditions as set forth in the agreement evidencing such stock awards and the terms of the 2001 Plan.
Our shareholders approved the adoption of the 2009 Equity Incentive Plan (the “2009 Plan”) at the August 14, 2009 annual meeting for shareholders. Under the 2009 Plan, the total number of shares of our common stock reserved for issuance consists of 1,000,000 shares plus (1) the 159,509 shares which remain authorized for issuance under the 2001 Plan but which were not subject to outstanding stock awards as of August 14, 2009, and (2) those of the 1,440,400 shares subject to stock awards outstanding under the 2001 Plan as of August 14, 2009, that terminate prior to exercise and would otherwise be returned to the share reserves under the 2001 Plan, with the total shares in addition to the 1,000,000 shares thus being up to a maximum of 1,599,909 shares. The 2009 Plan allows us to continue our prior option practices under the 2001 Plan to grant non-statutory options to key employees with an exercise price equal to the fair market value of our stock on the date of grant. Our options typically have a term of ten years and vest over five years, 20% on the first anniversary of the grant date and 20% at the end of each of the following four years. The 2009 Plan also provides us with the flexibility in designing equity incentives, including restricted stock awards, stock appreciation rights, restricted stock unit awards, performance stock awards, and performance cash awards. As of April 2, 2011, there were 977,849 shares remaining available for grant under the 2009 Plan.
As of April 2, 2011, there were 1,186,402 and 268,220 shares issuable upon exercise of outstanding options under the 2001 and 2009 Plans at a weighted average exercise price of $28.33 and $24.21, respectively.
We recorded tax benefits of $13,000 in fiscal 2011 and $63,000 in fiscal 2010 on the exercise of non-qualified stock options and early dispositions of stock acquired through the exercise of the incentive stock options under the 2001 Plan and on purchases under ESPP. Such benefits were recognized as an increase in shareholders’ equity. The table below shows information as of April 2, 2011, with respect to equity compensation plans under which our equity securities are authorized for issuance. Our current equity compensation plans, consisting of the 2001 and 2009 Plans and ESPP, were approved by security holders. We have no equity compensation plans that were not previously approved by our shareholders.
|
Number of Securities to be Issued upon Exercise of Outstanding Options, Warrants, and Rights
|
Weighted-Average Exercise Price of Outstanding Options, Warrants, and Rights
|
Number of Securities Remaining Available for Future Issuance under Equity Compensation Plans (Excluding Securities Reflected in Column (a))
|
||||||||||
|
Plan Category
|
(a)
|
(b)
|
(c)
|
|||||||||
|
Equity compensation plans approved by security holders
|
1,454,622 | $ | 27.57 | 1,182,777 | (1) | |||||||
|
Equity compensation plans not approved by security holders
|
- | N/A | - | |||||||||
(1) Includes 204,928 shares reserved as of April 2, 2011 for future purchases by employees through payroll deductions under the ESPP.
17
Purchases of Equity Securities by the Issuer and Affiliated Purchasers
The following is a summary of share purchase activities by the issuer during the three months ended April 2, 2011. There was no purchase activity by an “affiliated purchaser” as defined in Rule 10b-18(a)(3).
|
Period
|
Total Number of Shares Purchased (1)
|
Average Price Paid per Share
|
Total Number of Shares Purchased as Part of Publicly Announced Plans or Programs (2)
|
Maximum Number of Shares that May yet be Purchased Under the Plans or Programs
|
||||||||||||
|
01/01/11 – 01/29/11
|
21,600 | $ | 22.86 | 21,600 | 2,478,400 | |||||||||||
|
01/30/11 – 02/26/11
|
243,275 | 22.98 | 243,275 | 2,235,125 | ||||||||||||
|
02/27/11 – 04/02/11
|
8,022 | 22.83 | 8,022 | 2,227,103 | ||||||||||||
|
Total
|
272,897 | $ | 22.97 | 272,897 | ||||||||||||
_________________________________
|
(1)
|
Our current share repurchase program, under which we repurchased these 272,897 shares during the three months ended April 2, 2011, has been in place since 1999. Although we publicly announced the most recent 1,944,145 share program increase, we are not certain but do not believe we publicly announced this program at its inception, although our financial statements have reflected purchases from time to time under this program. These 272,897 shares were purchased in open market transactions.
|
|
(2)
|
We adopted a share repurchase program in 1992 authorizing the repurchase of 1,000,000 shares. The board of directors terminated this program in 1999 after 938,000 shares had been repurchased and adopted a share repurchase program authorizing the repurchase of 900,000 shares plus the 62,000 shares authorized for repurchase under the 1992 program whose repurchase had not been affected. As described in footnote (1), we are not certain but do not believe that we publicly announced the inception of the1999 repurchase program. On January 30, 2008, and January 21, 2011, the board of directors amended the 1999 repurchase program to add 1,000,000 and 1,944,145 shares, respectively . The 1999 repurchase program has no expiration date, other than, unless extended, when all of the shares in the program have been repurchased. As of April 2, 2011, there were 2,227,103 shares remaining in the 1999 repurchase program. Neither this program nor any other repurchase program or plan has expired during the fourth fiscal quarter ended April 2, 2011 nor have we decided to terminate any repurchase plan or program prior to expiration. There are no existing repurchase plans or programs under which we do not intend to make further purchases.
|
We have had share repurchase programs in place since 1992 under which our board of directors authorized us to repurchase an aggregate of 4,844,145 shares.
Since the inception of these repurchase programs in 1992 through April 2, 2011, we have repurchased a total of 2,617,042 shares of the common stock for an aggregate cost of approximately $42,818,000. Upon their repurchase, shares are restored to the status of authorized but unissued shares. As of April 2, 2011, there were 2,227,103 shares authorized for future repurchase under our current program.
18
Item 6. Selected Financial Data
The selected financial information and other data presented below should be read in conjunction with the "Consolidated Financial Statements," "Notes to Consolidated Financial Statements," and "Management's Discussion and Analysis of Financial Condition and Results of Operations" included elsewhere in this Form 10-K. We use a 52-53 week fiscal year ending the Saturday nearest March 31. Fiscal years 2011, 2009, 2008, and 2007 each consisted of 52 weeks. Fiscal year 2010 consisted of 53 weeks.
|
Fiscal Year
|
Fiscal Year
|
Fiscal Year
|
Fiscal Year
|
Fiscal Year
|
||||||||||||||||
|
(in thousands, except per share amounts)
|
2011
|
2010
|
2009
|
2008
|
2007
|
|||||||||||||||
|
Balance Sheet Data:
|
||||||||||||||||||||
|
Total assets
|
$ | 220,596 | $ | 205,218 | $ | 190,304 | $ | 177,351 | $ | 185,932 | ||||||||||
|
Total liabilities
|
$ | 27,677 | $ | 24,842 | $ | 22,728 | $ | 25,476 | $ | 24,680 | ||||||||||
|
Statement of Income Data:
|
||||||||||||||||||||
|
Net Sales
|
$ | 83,172 | $ | 66,724 | $ | 78,810 | $ | 82,559 | $ | 98,020 | ||||||||||
|
Gross margin
|
45,188 | 32,002 | 41,879 | 46,981 | 58,349 | |||||||||||||||
|
Income from operations
|
16,143 | 3,758 | 13,994 | 16,492 | 27,904 | |||||||||||||||
|
Net income
|
$ | 12,282 | $ | 5,125 | $ | 12,545 | $ | 17,005 | $ | 21,427 | ||||||||||
|
Net income per share:
|
||||||||||||||||||||
|
Basic
|
$ | 0.95 | $ | 0.40 | $ | 0.98 | $ | 1.25 | $ | 1.56 | ||||||||||
|
Diluted
|
$ | 0.94 | $ | 0.39 | $ | 0.97 | $ | 1.23 | $ | 1.53 | ||||||||||
|
Shares used in per share computation:
|
||||||||||||||||||||
|
Basic
|
12,976 | 12,912 | 12,836 | 13,585 | 13,715 | |||||||||||||||
|
Diluted
|
13,030 | 12,995 | 12,927 | 13,790 | 14,040 | |||||||||||||||
Item 7. Management's Discussion and Analysis of Financial Condition and Results of Operations
Overview
We design, develop, manufacture, and market high voltage ICs, DMOS transistors and arrays, utilizing state-of-the-art high voltage DMOS, HVCMOS and HVBiCMOS analog and mixed signal technologies. We are an industry leader in high voltage integrated circuits (HVCMOS and HVBiCMOS), taking advantage of the best features of CMOS, bipolar and DMOS technologies and integrating them into the same chip. These ICs are used in the medical ultrasound imaging, LCD TV backlighting, LED general lighting, telecommunications, printer, flat panel display, and industrial and consumer product industries. We also supply custom integrated circuits for our customers using customer-owned designs and mask tooling with our process technologies. Our current growth strategy relies on our ability to continuously and successfully introduce and market new innovative products that meet our customers’ requirements.
19
The following discussion should be read in conjunction with the "Consolidated Financial Statements" and "Notes to Consolidated Financial Statements" and "Selected Financial Data" included elsewhere in this Form 10-K and is subject to the forward looking statement disclaimer at the start of Item 1, Business. The following table sets forth items from the Consolidated Statements of Income as a percentage of net sales for the periods indicated:
|
Fiscal Years Ended
|
|||||||||
|
April 2, 2011
|
April 3, 2010
|
March 28, 2009
|
|||||||
|
Net sales
|
100.0
|
%
|
100.0
|
%
|
100.0
|
%
|
|||
|
Cost of sales
|
45.7
|
52.0
|
46.9
|
||||||
|
Research and development
|
17.8
|
23.1
|
18.4
|
||||||
|
Selling, general and administrative
|
17.1
|
19.2
|
16.9
|
||||||
|
Income from operations
|
19.4
|
5.7
|
17.8
|
||||||
|
Interest and Other income:
|
|||||||||
|
Interest income
|
1.0
|
1.6
|
4.0
|
||||||
|
Other income, net
|
1.0
|
2.3
|
(1.8)
|
||||||
|
Income before provision for income taxes
|
21.4
|
9.6
|
20.0
|
||||||
|
Provision for income taxes
|
6.6
|
1.9
|
4.1
|
||||||
|
Net income
|
14.8
|
%
|
7.7
|
%
|
15.9
|
%
|
|||
We operate in one business segment comprising the design, development, manufacturing and marketing of high voltage semiconductor devices including analog and mixed signal ICs, transistors and arrays.
Critical Accounting Policies and Estimates
Our discussion and analysis of financial condition and results of operations are based upon our Consolidated Financial Statements, which have been prepared in accordance with accounting principles generally accepted in the United States of America. Note 1 to the Consolidated Financial Statements describes the significant accounting policies and methods used in the preparation of the Consolidated Financial Statements. The preparation of these financial statements requires us to make estimates and judgments that affect the reported amounts of assets, liabilities, revenues and expenses. Significant estimates in these financial statements include revenue recognition, net realizable value of inventories, provision for income taxes and tax valuation allowance, and asset impairments. We base our estimates on historical experience and on various other assumptions that are believed to be reasonable under the circumstances, the results of which form the basis for making judgments about the carrying values of assets and liabilities that are not readily apparent from other sources.
We consider the accounting policies described below to be our critical accounting policies. Our critical accounting policies are those that both (1) are most important to the portrayal of the financial condition and results of operations and (2) require management’s most difficult, subjective, or complex judgments, often requiring estimates about matters that are inherently uncertain. These critical accounting policies reflect our significant judgments, assumptions, and estimates used in the preparation of the Consolidated Financial Statements. Our management has discussed the development and selection of these critical accounting policies and estimates with the audit committee of our board of directors and the audit committee has reviewed our disclosures in relation to this report.
Revenue Recognition
We recognize revenue from direct product sales to end-user customers upon transfer of title and risk of loss, which is upon shipment of the product provided persuasive evidence of an arrangement exists, the price is fixed or determinable, no significant obligations remain, and collection of the resulting receivable is reasonably assured. For sales to OEMs, we use either a binding purchase order or signed agreement as evidence of an arrangement. For those customers who have a hub arrangement, we recognize revenue when our products are transferred from the hub to the customer’s manufacturing facility or to its assembly subcontractor’s manufacturing facility. Sales through our distributors are evidenced by binding purchase orders on a transaction-by-transaction basis. Because of the uncertainty associated with pricing concessions and possible returns, with the exception of certain products, we defer the recognition of revenue to all our distributors, domestic and foreign, and the related costs of sales until our distributors have sold the merchandise to their end customers. Following a prior period change in our terms and conditions to eliminate return rights for distributors for certain products, we continued to defer revenue recognition until the distributors had sold these parts as we would nonetheless grant concessions and accept some returns for a period of time after the change. Beginning in the fourth quarter of fiscal 2009, we had established sufficient history of not granting such concessions or granting such returns that we began to recognize revenue on such items upon their shipment to the distributors.
20
We also provide custom processing services for manufacture of ICs, using customer-owned designs and mask tooling. Under this “custom processing service” arrangement, a tangible product is sold, and we bear the risk of loss until title is passed on to the customer at the time of shipment. Title to the product under the “custom processing service” arrangement is passed to the customer at the time of shipment.
From time to time, deferred revenue results from up-front billings to customers under non-recurring engineering (“NRE”) contracts. We recognize revenue from our NRE contracts upon completion of contract milestones, which corresponds to when we provide the services and/or products. Revenue is deferred for any amounts received prior to completion of contract milestones, such as amounts to be received upon delivery of the proto-type product, if such a delivery is not an agreed upon milestone. Some of our NRE contracts include formal customer acceptance provisions in which case, at the end of each period, we determine whether customer acceptance has been obtained for the specific milestone. If customer acceptance has not been obtained, we defer the recognition of such revenue until customer acceptance is obtained.
Inventory Valuation
Our inventories are stated at the lower of cost (determined on a first-in, first-out basis) or net realizable value. They are high technology products which are specialized in nature and subject to rapid technological obsolescence. Standard manufacturing cost includes materials, labor, and overhead costs including depreciation, and includes factors for estimated production yield and throughput time. We determine net realizable value of our inventories based on the last selling price, net of selling cost, of our products prior to the balance sheet date. If there has been no recent sale of a particular product, the expected selling price, net of selling cost is deemed as the net realizable value. Inventory balances are adjusted to approximate the lower of our standard manufacturing cost or net realizable value. Any adjustment to write down inventory to net realizable value is charged to cost of sales in the period that the adjustment is made.
Additionally, we evaluate our ending inventories for excess quantities and obsolescence at each balance sheet date. This evaluation includes analyses of sales levels by product and projections of future demand during the next 12 months, which may involve a great deal of management judgment. Inventories on hand in excess of forecasted demand and inventories that we consider obsolete are written down. We make judgments in establishing inventory net book value and do not write down inventory if management believes certain excess or obsolete inventory will be sold within 12 months. In addition, we age our inventory based on start date. Inventory that has been inactive for more than one year is considered slow moving inventory and is also written down and charged to cost of sales. Subsequent changes in facts and circumstances do not result in the reduction of the allowance until these inventories are subsequently sold or scrapped. Any proceeds received will favorably affect gross margin for the period.
While we have programs whose objective is to minimize the required inventories on hand according to the field sales forecast and we consider technological obsolescence when adjusting inventory carrying values to market values, it is possible that future demand or market conditions could be less favorable than our projections, in which case additional inventory write-downs may be required and will be reflected in cost of sales in the period the revision is made.
21
Accounting for Income Taxes
Income taxes are accounted for under the asset and liability method. We make certain estimates and judgments in determining income tax expense for financial statement purposes. These estimates and judgments occur in the calculation of certain deferred tax assets and liabilities, which arise from timing differences in the recognition of revenue and expense for tax and financial statement purposes. Such deferred income tax assets and liabilities are recognized for the future tax consequences attributable to differences between the financial statement carrying amounts of existing assets and liabilities and their respective tax base, operating losses and tax credit carry-forwards. Changes in tax rates affect the deferred income tax assets and liabilities and are recognized in the period in which the tax rates are enacted.
Our management must determine the probability that we will be able to utilize our deferred tax assets. If we determine that recovery is unlikely, then a valuation allowance against our deferred tax asset must be recorded by increasing income tax expense. As of April 2, 2011, we believe that our deferred tax assets recorded on our balance sheet will be utilized. However, should there be a change in our ability to utilize or recover our deferred tax assets, an additional income tax expense would be incurred in the period in which it was determined that the recovery is not probable.
On February 20, 2009, California enacted tax-related economic incentives and tax increases which included an election to apply a single sales factor apportionment formula for most businesses starting in tax years beginning on or after January 1, 2011. As a result, we revalued our California deferred tax assets expected to be realized.
The authoritative guidance of income taxes provides guidance on the financial statement recognition and measurement of a tax position taken or expected to be taken in a tax return, and clarifies the accounting for uncertainty in income taxes recognized in the financial statements. This authoritative guidance also provides guidance on derecognition, classification, interest and penalties, accounting in interim periods, disclosures, and transition. This authoritative guidance requires significant judgment in determining what constitutes an individual tax position as well as assessing the outcome of each tax position. Changes in judgment as to recognition or measurement of tax positions can materially affect the estimate of the effective tax rate, and consequently affect our operating results. The reserve amount associated with this authoritative guidance was determined with considerable judgment and estimation, and is continuously monitored by management based on the best information available including changes in tax regulations, the outcome of relevant court cases, ongoing tax audits, and other information. During the fiscal year ended April 2, 2011, the liability for uncertain tax positions less accrued interest and penalties decreased from $4,142,000 to $4,052,000. Of the total $4,052,000 of uncertain tax benefits, $3,083,000 represents the amount that if recognized, would favorably affect the effective income tax rate in any future periods. We cannot conclude on the range of cash payments that will be made within the next twelve months associated with our uncertain tax positions.
Accounting for available-for-sale investments
Our available-for-sale portfolio in fiscal 2011 includes municipal bonds, corporate bonds, ARS, government agency bonds, discount notes and certificates of deposits. These securities are reported at fair value. The ARS held by us are primarily backed by pools of student loans and are guaranteed by the United States Department of Education. In addition, all ARS held by us are rated by the major independent rating agencies as either AAA or Aaa. Due to the lack of availability of observable market quotes on our investment portfolio of ARS, the fair value was estimated based on a discounted cash flow model and included a discount factor for illiquidity of the ARS market. The assumptions used in the discounted cash flow model include estimates for interest rates, timing and amounts of cash flows, liquidity of the underlying security, expected holding periods and contractual terms of the security. We review our securities for impairments in accordance with the authoritative guidance and other related guidance issued by the Financial Accounting Standard Board (“FASB”) in order to determine the classification of the impairment as “temporary” or “other-than-temporary.” Declines in fair value that are considered other-than-temporary are charged to the Statement of Income and those that are considered temporary are reported as a component of accumulated other comprehensive income (loss) in shareholders’ equity.
22
In light of the current market condition for ARS, we developed different scenarios for the significant inputs used in the discounted cash flow model, including, but not limited to liquidity discount of 150 basis points for the current ARS market, and the timing of recovery of ARS market from three to six years. The estimated fair value of our ARS ranges from $29,300,000 to $30,800,000 or 89% to 94% of par value. We believe this estimated range of fair value of our ARS is appropriate taking into consideration historical ARS market data, the possibility of development of a secondary market for ARS, recent market participant behaviors, and public policy implications associated with the student loan based ARS market. We concluded that the fair value of our ARS was $30,200,000, or 92% of par value, as of April 2, 2011 and recorded a temporary impairment of $2,550,000.
The above listing is not intended to be a comprehensive list of all of our accounting policies. In many cases, the accounting treatment of a particular transaction is specifically dictated by generally accepted accounting principles, with no need for management's judgment in their application. There are also areas in which management's judgment in selecting any available alternative would not produce a materially different result. See our audited consolidated financial statements and notes thereto which begin on page 43 of this Annual Report on Form 10-K which contain accounting policies and other disclosures required by generally accepted accounting principles.
Recent Developments
We operate in the highly cyclical global semiconductor market, evidenced by fluctuating demand cycles for our products. During fiscal years 2005 through 2007 we experienced sales growth, however sales declined in fiscal 2008 and 2009 primarily due to a reduction in demand from one of our significant customers, as its products that use our EL inverter ICs experienced significantly reduced sales, and due to the global recession which began in the second half of fiscal 2009 and continued through the first half of fiscal 2010. Our overall custom processing services sales experienced alternating years of growth and decline during fiscal 2007 through 2011, with 2007 and 2009 being growth years. We have not focused on expanding this portion of our business because its gross profit is generally low even though it does add to our fab capacity utilization.
During the second half of fiscal 2010, overall sales of products in all of our target markets increased 27% compared to the first half, following their decline in the recent global recession that began for us in the third quarter of fiscal 2009. During the recession, quarterly sales run-rate reduced from a previous level of approximately $23,000,000 to a trough of $13,555,000. In the third and fourth quarters of fiscal 2010 sales were $16,735,000 and $20,559,000, respectively. Sales continued to grow in the first quarter of fiscal 2011, as demand increased for our medical ultrasound pulsers and analog switches, our telecom optical MEMS drivers, and our LED general lighting and backlighting products. However, overall sales declined consecutively during the last three quarters of fiscal 2011 primarily due to the combined effect of reductions of medical ultrasound customer end user demand and to a lesser extent increased competition, and due to lower customer end user demand for our EL inverters, as well as reduction in content per TV and customer in-sourcing of our LED backlighting drivers. Counter to the cyclical trends experienced by most of our target markets during the past five years, combined sales of our LED general lighting and backlighting products steadily increased from $1,412,000 in fiscal 2007 to $14,850,000 in fiscal 2010 but were slightly down in 2011 to $13,242,000.
23
Results of Operations
Fiscal 2011 vs. Fiscal 2010
Net Sales
We operate in one business segment comprised of the design, development, manufacturing and marketing of high voltage analog and mixed signal ICs, DMOS transistors and arrays. A breakdown of our total sales to customers in the medical electronics, LED lighting, imaging, telecom, and industrial/other markets as well as year-over-year changes are shown below:
|
Fiscal Years Ended
|
Year-Over-Year
|
|||||||||||||||||||
|
(dollars in thousands)
|
April 2, 2011
|
April 3, 2010
|
Change
|
|||||||||||||||||
|
Medical Electronics
|
$ | 30,635 | 37 | % | $ | 24,735 | 37 | % | 24 | % | ||||||||||
|
Imaging
|
16,369 | 20 | % | 13,407 | 20 | % | 22 | % | ||||||||||||
|
LED Lighting
|
13,242 | 16 | % | 14,850 | 22 | % | -11 | % | ||||||||||||
|
Telecom
|
9,376 | 11 | % | 5,252 | 8 | % | 79 | % | ||||||||||||
|
Industrial/Other
|
13,550 | 16 | % | 8,480 | 13 | % | 60 | % | ||||||||||||
|
Total Net Sales
|
$ | 83,172 | 100 | % | $ | 66,724 | 100 | % | 25 | % | ||||||||||
We have a broad base of customers, which in some cases manufacture end products spanning multiple markets. As such, the assignment of revenue to the aforementioned markets requires the use of estimates, judgment, and extrapolation. Actual results may differ from those reported.
The 25% increase in net sales compared to the prior fiscal year was primarily due to the overall economic recovery which began in our second half of fiscal 2010. Sales continued to increase sequentially through the first quarter of fiscal 2011 and then declined in the last three quarters of fiscal 2011 due to the combined effect of reductions in demand (1) for medical ultrasound products resulting from adjustment in channel inventory, seasonality and competition, (2) for EL drivers, and (3) for LED backlighting drivers resulting from in-sourcing of an LED backlighting driver by our major LED TV customer. Total fiscal 2011 sales increased in all four of our target markets except for LED lighting where a steep decline in sales of LED driver ICs for backlighting LCD TVs that employ LED backlighting (“LED TVs”) in the fourth quarter of our fiscal year resulted in a material annual decline in such sales which offset sales increases in our LED driver IC’s for general lighting.
Our sales to the medical electronics market accounted for 37% of total sales in fiscal 2011 and increased 24% compared to the prior fiscal year. This sales increase was due to increased shipments of our analog switches and high voltage pulser circuits and chipsets resulting primarily from the strengthening of the overall economy, partially offset by lower custom processing services demand from our medical instrument customers.
In recent years, the overall ultrasound market has been shifting from big console systems to transportable and hand-carried ultrasound imaging units, which has driven the ultrasound imaging market growth along with product upgrades for console cart-wheel machines and large stationary systems. Because of space and power constraints, there are more requirements for integration, and with our high voltage IC technology we have been among the most qualified to support these requirements. Geographically, the imaging equipment market is expanding very rapidly in China, India and many African countries. Traditionally, OEMs in the United States, Germany, and Japan have been the main developers and manufacturers of medical ultrasound imaging machines to whom we have sold our products successfully. Companies in those regions continue to grow and develop new machines. Today we see significant opportunities with medical ultrasound imaging machine companies in China and Korea. This market began to grow for us in fiscal 2007 and continued in fiscal 2008. The global economic slowdown which began in the second half of fiscal 2009 and carried through the second quarter of fiscal 2010 negatively impacted sales of capital equipment, including medical ultrasound imaging machines. Due to the global economic improvement, the global demand for medical ultrasound imaging machines picked up in our fourth fiscal quarter of fiscal 2010 and continued through the second quarter of fiscal 2011. However, in addition to our normal seasonal decline in the third and fourth quarters, we experienced declines resulting from the impact of increased competition. We are expanding our product development activities and product offerings to capitalize on these exciting market growth opportunities. Through the introduction of our new integrated solutions along with our discrete transistor and array building block product offerings, we believe we will continue to be a major player in this business.
24
Sales to the imaging market, which largely consist of EL inverter ICs, commercial printing ICs, display ICs and custom processing services, in fiscal 2011 increased 22% compared to the prior year. This was primarily due to increased sales of our display and commercial printing ICs and increased custom processing services, both resulting from the improved economy and due to higher shipments of our EL inverter ICs for mobile phones. We are one of the key providers of EL driver ICs for backlighting cell phones keypads and are also pursuing EL backlighting applications in other products, such as keyboard backlighting for netbooks, notebooks and laptops. In addition, we are one of the key providers of driver ICs for hand-held instruments and watches and the leading supplier in the high-end industrial printer market with both standard and custom products.
Sales to the LED lighting market decreased 11% compared to the prior fiscal year. This decrease resulted from a reduction in shipments of our high voltage LED driver ICs for LED TVs due to a reduction in dollar content per TV of our LED drivers, our major customer insourcing these drivers beginning in our third fiscal quarter, and the global slowdown of TV sales. This decrease was partially offset by an increase in LED driver sales for general lighting. We expect shipments of our general lighting drivers to continue to increase during fiscal 2012 which will drive increases in our overall sales to the LED lighting market from the current quarterly run rate.
Sales to the telecom market in fiscal 2011 increased 79% compared to the prior fiscal year. This increase in sales was primarily due to significantly higher shipments of our high voltage driver ICs for optical-to-optical switching applications because of the strengthening of the global economy and the increasing demand for video streaming and higher bandwidth.
Sales to the industrial/other market increased 60% in fiscal 2011 compared to fiscal 2010 primarily due to the strengthening of the overall economy that began in the second half of fiscal 2010.
Our current growth strategy relies on our ability to continuously and successfully introduce and market new innovative products that meet our customers’ requirements.
Our principal geographic markets are in Asia, the U.S., and Europe. Sales by geographic regions as well as year-over-year percentage changes were as follows. The sales amounts are based on where we ship our products to, rather than where the customers’ headquarters are located.
|
Fiscal Years Ended
|
Year-Over-Year
|
|||||||||||||||||||
|
(Dollars in thousands)
|
April 2, 2011
|
April 3, 2010
|
Change
|
|||||||||||||||||
|
Asia (excl. China)
|
$ | 24,622 | 30 | % | $ | 17,280 | 26 | % | 42 | % | ||||||||||
|
United States
|
24,304 | 29 | % | 21,043 | 32 | % | 15 | % | ||||||||||||
|
China
|
21,120 | 25 | % | 21,060 | 32 | % | 0 | % | ||||||||||||
|
Europe
|
12,503 | 15 | % | 7,022 | 10 | % | 78 | % | ||||||||||||
|
Other
|
623 | 1 | % | 319 | 0 | % | 95 | % | ||||||||||||
|
Total Net Sales
|
$ | 83,172 | 100 | % | $ | 66,724 | 100 | % | 25 | % | ||||||||||
Net sales to international customers in fiscal 2011 were $58,868,000, or 71% of our net sales as compared to $45,681,000 or 68% of net sales for the prior fiscal year. This increase in international net sales was primarily due to the strengthening of the global economy and the increase in sales of our drivers of LED general lighting products due to the penetration of LED lighting in several lighting applications. The increase in sales to the United States was primarily due to the strengthening of the global economy.
25
Cost of Sales and Gross Profit
Gross profit represents net sales less cost of sales. Cost of sales includes the cost of purchasing raw silicon wafers; costs associated with assembly, packaging, test, quality assurance and product yields; the cost of personnel, facilities, and equipment associated with manufacturing support; and net charges for excess or obsolete inventory.
Gross profit for fiscal year 2011 was $45,188,000 compared to $32,002,000 in fiscal year 2010. This increase was primarily due to increased sales.
|
Fiscal Years Ended
|
||||||||
|
(Dollars in thousands)
|
April 2, 2011
|
April 3, 2010
|
||||||
|
Gross Margin Percentage
|
54 | % | 48 | % | ||||
|
Included in Gross Margin Percentage Above
|
||||||||
|
Gross Margin Benefit from Cost of Previously Written Down Inventory Sold
|
$ | 1,358 | $ | 1,645 | ||||
|
Percentage of Net Sales
|
1.6 | % | 2.5 | % | ||||
The increase in gross margin percentage was primarily attributable to increased fab utilization and other economic scale benefits from higher overall sales, favorable product mix, and lower inventory reserves. We wrote down inventory totaling of $2,859,000 and $3,448,000 for fiscal years 2011 and 2010, respectively.
Research and Development(“R&D”)
|
Fiscal Years Ended
|
Year-Over-Year | |||||||||||
|
(Dollars in thousands)
|
April 2, 2011
|
April 3, 2010
|
Change
|
|||||||||
|
R&D Expenses
|
$ | 14,851 | $ | 15,404 | -4 | % | ||||||
|
Percentage of Net Sales
|
18 | % | 23 | % | ||||||||
R&D expenses include payroll and benefits, processing costs, and depreciation. We also expense prototype experimental wafers and mask sets related to new products development as R&D expenses.
The year-over-year decrease of $553,000 in R&D expense was primarily due to reduced employee stock compensation expense of $246,000, a reduced expense of $238,000 related to the Company’s Non-Qualified Deferred Compensation Plan (“NQDCP”) as the Plan assets increased in fair value by $216,000 compared to $454,000 during fiscal 2010, and reduced employee compensation expense of $119,000. An increase or decrease in the fair value of the Company's NDQCP assets corresponds to an increase or decrease in the NDQCP liability. To recognize the increase or decrease in the NDQCP plan assets, the Company records the difference in fair value to other income (expense) net. Correspondingly, to recognize the increase or decrease in the NDQCP liability, the Company records the difference to other benefits expense.
The decrease in percentage of net sales is primarily due to the increased sales. We expect R&D spending in fiscal year 2012 to be between 16% and 20% of net sales.
Selling, General and Administrative (“SG&A”)
|
Fiscal Years Ended
|
Year-Over-Year | |||||||||||
|
(Dollars in thousands)
|
April 2, 2011
|
April 3, 2010
|
Change
|
|||||||||
|
SG&A Expenses
|
$ | 14,194 | $ | 12,840 | 11 | % | ||||||
|
Percentage of Net Sales
|
17 | % | 19 | % | ||||||||
SG&A expenses consist primarily of employee related expenses, commissions to sales representatives, occupancy expenses including expenses associated with our regional sales offices, cost of advertising and publications, and outside services such as legal, auditing, tax and compliance services related to Sarbanes-Oxley Act of 2002.
The increase of $1,354,000 in SG&A expenses resulted primarily from increased employee compensation expense of $990,000, higher sales commissions and incentives of $502,000, and increased consulting and professional service expense of $378,000 related to tax planning and legal expenses. These expenses were partially offset by lower benefits expense of $581,000 due to a lower increase in fair value of the Company’s NQDCP assets of $382,000 during fiscal 2011 compared to an increase last year of $964,000. An increase or decrease in the fair value of the Company's NDQCP assets corresponds to an increase or decrease in the NDQCP liability. To recognize the increase or decrease in the NDQCP plan assets, the Company records the difference in fair value to other income (expense) net. Correspondingly, to recognize the increase or decrease in the NDQCP liability, the Company records the difference to other benefits expense.
SG&A expenses may fluctuate both in absolute dollars and as a percentage of net sales.
26
Interest and Other Income, Net
|
Fiscal Years Ended
|
Year-Over-Year
|
|||||||||||
|
(Dollars in thousands)
|
April 2, 2011
|
April 3, 2010
|
Change
|
|||||||||
|
Interest Income
|
$ | 812 | $ | 1,058 | -23 | % | ||||||
|
Other Income (Expense), Net
|
825 | 1,560 | -47 | % | ||||||||
|
Total Interest Income and Other income, Net
|
$ | 1,637 | $ | 2,618 | -37 | % | ||||||
|
Percentage of Net Sales
|
2 | % | 4 | % | ||||||||
Interest income consists primarily of interest income from our cash, cash equivalents, short-term and long-term investments. The decrease in interest income in fiscal 2011 was due to a shift in our investment portfolio from higher-yielding ARS to other short-term securities, partially offset by interest income generated by higher cash and investment balance.
Other income (expense), net was $735,000 lower compared to the prior year. The decrease was primarily due to an increase in fair value of investments held by the Company’s NQDCP of $689,000 in fiscal 2011 compared to an increase of $1,607,000 in fiscal 2010, partially offset by a $100,000 gain on sale of equipment.
Provision for Income Taxes
The provision for income taxes represents federal, state and foreign taxes. The provision for income taxes for fiscal 2011 was $5,498,000 at an effective tax rate of 31%, compared to $1,251,000 at an effective tax rate of 20% in 2010. Our effective tax rate of 31% was less than the combined federal and state tax rate due to the domestic production activities deduction, the benefits of R&D credits, tax exempt investment income, and shifts of income among jurisdictions with different tax rates, partially offset by the adverse impact of a valuation allowance recorded against California deferred tax assets.
During the quarter ended October 2, 2010, we identified the inclusion of certain R&D expenses in the calculation of the R&D tax credit which were not in compliance with IRS regulations. As a result, the income tax expense for the quarter ended December 26, 2009 and year ended April 3, 2010 was understated by $217,000. This amount was corrected in the three months ended October 2, 2010. We assessed the materiality of this adjustment on the prior periods and concluded that it was not material to those periods. We also concluded that the out of period adjustment, which resulted in a $217,000 increase in tax expense for the fiscal year ended April 2, 2011, was not material to such period.
27
Fiscal 2010 vs. Fiscal 2009
Net Sales
A breakdown of our total sales to customers in the medical electronics, LED lighting, imaging, telecom, and industrial/other markets as well as year-over-year changes are shown below:
|
Fiscal Years Ended
|
Year-Over-Year
|
|||||||||||||||||||
|
(dollars in thousands)
|
April 3, 2010
|
March 28, 2009
|
Change
|
|||||||||||||||||
|
Medical Electronics
|
$ | 24,735 | 37 | % | $ | 33,368 | 43 | % | -26 | % | ||||||||||
|
LED Lighting
|
14,850 | 22 | % | 4,973 | 6 | % | 199 | % | ||||||||||||
|
Imaging
|
13,407 | 20 | % | 20,550 | 26 | % | -35 | % | ||||||||||||
|
Telecom
|
5,252 | 8 | % | 7,139 | 9 | % | -26 | % | ||||||||||||
|
Industrial/Other
|
8,480 | 13 | % | 12,780 | 16 | % | -34 | % | ||||||||||||
|
Total Net Sales
|
$ | 66,724 | 100 | % | $ | 78,810 | 100 | % | -15 | % | ||||||||||
Net sales for the fiscal year 2010 were 15% lower, compared to fiscal 2009, which was primarily due to reduced demand resulting from weakness in the overall economy which began in the second half of fiscal 2009 and continued through the first half of 2010.
Our sales to the medical electronics market accounted for 37% of total sales in fiscal 2010 and decreased 26% compared to the prior fiscal year. This sales decrease was primarily attributable to a reduction in selling prices of analog switches and high voltage ultrasound pulser ICs and chipsets due to increased competition, and to a lesser extent due to lower unit shipments of our analog switches and high voltage ultrasound pulser ICs and chipsets due to the weak overall economy.
Sales to the LED lighting market in fiscal 2010 increased 199% compared to fiscal 2009. This increase was due primarily to significantly increased shipments of our high voltage LED driver ICs for backlighting LCD TVs with LED backlighting units (“LED TVs”) which have ramped up volume production during the past several quarters at a tier-one OEM prior to a decline in the fourth quarter as the customer transitioned to its 2010 models which use our new drivers which allow longer LED strings and fewer drivers per TV set. During fiscal 2010 we also began shipping production quantities to three second tier OEMs. Additionally, general lighting LED application sales have increased compared to fiscal 2009.
Sales to the imaging market in fiscal 2010 decreased 35% compared to the prior year primarily due to significantly reduced demand for our customers’ products and the weak overall economy. This was partially offset by increased shipments of our EL inverter ICs to a hand-set OEM for a new family of products during the second half of fiscal 2010. In the other major component of our imaging market, drivers for non-impact inkjet printers and plotters as well as other displays, sales were lower in fiscal 2010 compared to fiscal 2009 due to the overall weak economy; however, during our second half of fiscal 2010 sales of these products increased compared to the first half.
Sales to the telecom market in fiscal 2010 decreased 26% compared to the prior fiscal year. This decrease in sales was primarily due to lower shipments of driver ICs for a military radio application and to a lesser extent reduced demand for high voltage MEMS driver ICs for optical-to-optical switching applications.
Sales to the industrial/other market decreased 34% in fiscal 2010 compared to fiscal 2009 due to the overall economic downturn that began in the second half of fiscal 2009 and continued through the first half of fiscal 2010, however sales in our fourth fiscal quarter increased significantly from the quarterly run-rate experienced in the first three fiscal quarters.
28
Our principal geographic markets are in Asia, the U.S., and Europe. Sales by geographic regions as well as year-over-year percentage changes were as follows. The sales amounts are based on where we ship our products to, rather than where the customers’ headquarters are located.
|
Fiscal Years Ended
|
Year-Over-Year
|
|||||||||||||||||||
|
(Dollars in thousands)
|
April 3, 2010
|
March 28, 2009
|
Change
|
|||||||||||||||||
|
China
|
$ | 21,060 | 32 | % | $ | 17,968 | 23 | % | 17 | % | ||||||||||
|
United States
|
21,043 | 32 | % | 29,301 | 37 | % | -28 | % | ||||||||||||
|
Asia (excl. China)
|
17,280 | 26 | % | 20,670 | 26 | % | -16 | % | ||||||||||||
|
Europe
|
7,022 | 10 | % | 10,093 | 13 | % | -30 | % | ||||||||||||
|
Other
|
319 | 0 | % | 778 | 1 | % | -59 | % | ||||||||||||
|
Total Net Sales
|
$ | 66,724 | 100 | % | $ | 78,810 | 100 | % | -15 | % | ||||||||||
Net sales to international customers in fiscal 2010 were $45,681,000, or 68% of our net sales as compared to $49,509,000 or 63% of net sales for the prior fiscal year. This decrease in international net sales was primarily due to the global economic downturn and the decline in shipments of our EL inverters to manufacturing locations in Asia, excluding China. The increase in sales to China was primarily due to higher shipments of our drivers for LED lighting and backlighting products and to a lesser extent due to higher medical ultrasound sales. The decrease in sales to the United States was primarily due to the global economic downturn and the migration of contract manufacturing to Asia.
Cost of Sales and Gross Profit
Gross profit represents net sales less cost of sales. Cost of sales includes the cost of purchasing raw silicon wafers; costs associated with assembly, packaging, test, quality assurance and product yields; the cost of personnel, facilities, and equipment associated with manufacturing support; and net charges for excess or obsolete inventory.
Gross profit for fiscal year 2010 was $32,002,000 compared to $41,879,000 in fiscal year 2009.
|
Fiscal Years Ended
|
||||||||
|
(Dollars in thousands)
|
April 3, 2010
|
March 28, 2009
|
||||||
|
Gross Margin Percentage
|
48 | % | 53 | % | ||||
|
Included in Gross Margin Percentage Above
|
||||||||
|
Gross Margin Benefit from Cost of Previously Written Down Inventory Sold
|
$ | 1,645 | $ | 1,372 | ||||
|
Percentage of Net Sales
|
2.5 | % | 1.7 | % | ||||
The decline in gross margin was primarily attributable to lower overall sales, unfavorable product mix, reduced average selling prices in certain medical ultrasound products, and higher inventory reserves. These factors were partially offset by reduced manufacturing costs. We wrote down inventory totaling of $3,448,000 and $2,322,000 for fiscal years 2010 and 2009, respectively.
Research and Development(“R&D”)
|
Fiscal Years Ended
|
Year-Over-Year | |||||||||||
|
(Dollars in thousands)
|
April 3, 2010
|
March 28, 2009
|
Change
|
|||||||||
|
R&D Expenses
|
$ | 15,404 | $ | 14,553 | 6 | % | ||||||
|
Percentage of Net Sales
|
23 | % | 18 | % | ||||||||
R&D expenses include payroll and benefits, processing costs, and depreciation. We also expense proto-type experimental wafers and mask sets related to new products development as R&D expenses.
The R&D expense increased $851,000 compared to fiscal 2009, primarily due to increased costs for masks and tooling in support of development activities for advanced circuit designs of $644,000, higher labor benefits expense of $512,000 due to an increase during fiscal 2010 of $454,000 in fair value of the Company’s NQDCP assets compared to a decrease of $495,000 during fiscal 2009, along with higher employee stock compensation expense of $404,000, partially offset by lower profit sharing bonus and other benefits, and due to higher design consulting expense and legal expense for patent filings. These increases were partially offset by reduced usage of wafer fab services in support of new product development activities for advanced manufacturing processes development of $642,000.
29
Selling, General and Administrative (“SG&A”)
|
Fiscal Years Ended
|
Year-Over-Year | |||||||||||
|
(Dollars in thousands)
|
April 3, 2010
|
March 28, 2009
|
Change
|
|||||||||
|
SG&A Expenses
|
$ | 12,840 | $ | 13,332 | -4 | % | ||||||
|
Percentage of Net Sales
|
19 | % | 17 | % | ||||||||
SG&A expenses consist primarily of employee related expenses, commissions to sales representatives, occupancy expenses including expenses associated with our regional sales offices, cost of advertising and publications, and outside services such as legal, auditing, tax and compliance services related to Sarbanes-Oxley Act of 2002.
The decrease of $492,000 in SG&A expenses compared to fiscal 2009 resulted primarily from a $934,000 decrease in consulting and professional service expense related to reduced tax planning, audit and legal expenses, a $452,000 decrease in payroll expense due to reduced staffing, and a $413,000 decrease in sales commissions. These decreases were partially offset by a higher benefits expense of $1,598,000 primarily relating to an increase in fair value of the Company’s NQDCP assets of $964,000 during fiscal 2010 compared to a decrease last year of $806,000. Increase or decrease in the fair value of the Company's NDQCP assets corresponds to the increase or decrease in the NDQCP liability. To recognize the increase or decrease in the NDQCP assets, the Company records the difference in fair value to other income and expense. Correspondingly, to recognize the increase or decrease in the NDQCP liability, the Company records the difference to other benefits expense.
Interest Income and Other Expense, Net
|
Fiscal Years Ended
|
Year-Over-Year
|
|||||||||||
|
(Dollars in thousands)
|
April 3, 2010
|
March 28, 2009
|
Change
|
|||||||||
|
Interest Income
|
$ | 1,058 | $ | 3,209 | -67 | % | ||||||
|
Other Income (Expense), Net
|
1,560 | (1,437 | ) | 209 | % | |||||||
|
Total Interest Income and Other income, Net
|
$ | 2,618 | $ | 1,772 | 48 | % | ||||||
|
Percentage of Net Sales
|
4 | % | 2 | % | ||||||||
Interest income, which consists primarily of interest income from our cash, cash equivalents, short-term and long-term investments. The decrease in interest income in fiscal 2010 was due to lower interest rates, partially offset by interest income generated by higher cash and investment balance.
Other income (expense), net was income of $1,560,000 for fiscal 2010 compared to an expense of $1,437,000 for fiscal 2009. This difference of $2,997,000 was primarily due to an increase in fair value of investments held by the Company’s NQDCP of $1,607,000 in fiscal 2010 versus a decrease in such fair value of $1,464,000 in fiscal 2009.
Provision for Income Taxes
The provision for income taxes represents federal, state and foreign taxes. The provision for income taxes for fiscal 2010 was $1,251,000 at an effective tax rate of 20% compared to $3,221,000 also at an effective tax rate of 20% in 2009. Our effective tax rate of 20% was less than the combined federal and state tax rate due to the benefits of R&D credits, release of reserves on uncertain tax positions, tax exempt investment income, domestic production activities deduction and shifts of income among jurisdiction with different tax rates, partially offset by the adverse impact of stock based compensation expenses.
30
Financial Condition
Overview
Total cash, cash equivalents, short-term and long-term investments balance as of April 2, 2011, was $163,922,000, compared with $152,013,000 on April 3, 2010, and $137,034,000 on March 28, 2009. The increase in fiscal 2011 resulted primarily from $14,450,000 of cash provided by operating activities, proceeds from exercises of stock options and ESPP of $2,533,000, and a reduction in impairment of $1,650,000 on the ARS, partially offset by purchases of the Company’s stock of $6,267,000 and capital expenditures of $1,210,000. Working capital is defined as current assets less current liabilities. Working capital was $156,673,000, an increase of $49,402,000 from $107,271,000 as of April 3, 2010. This increase in working capital was mostly the result of an increase in cash provided by operating activities of $14,450,000 and partial redemptions of our ARS of $36,450,000, which were reinvested in short-term securities.
Liquidity and Capital Resources
In summary, our cash flows were as follows (in thousands):
|
Fiscal Years Ended
|
||||||||||||
|
April 2, 2011
|
April 3, 2010
|
March 28, 2009
|
||||||||||
|
Net cash provided by operating activities
|
$ | 14,450 | $ | 8,541 | $ | 22,406 | ||||||
|
Net cash provided by (used in) investing activities
|
3,086 | (23,872 | ) | (17,792 | ) | |||||||
|
Net cash (used in) provided by financing activities
|
(3,727 | ) | 1,240 | 1,728 | ||||||||
|
Net (decrease) increase in cash and cash equivalents
|
$ | 13,809 | $ | (14,091 | ) | $ | 6,342 | |||||
Fiscal 2011
Operating Activities
Net cash provided by operating activities is net income adjusted for certain non-cash items and changes in assets and liabilities. The increase of $5,909,000 compared to the prior year resulted from a greater net income after non-cash adjustments of $7,782,000, partially offset by a decrease from changes in assets and liabilities totaling $1,873,000. The increased non-cash adjustments to net income were $625,000 and resulted primarily from a decrease in deferred income taxes, compared to an increase last year and a lower unrealized gain from short-term investments. These changes in non-cash adjustments were partially offset by decreases due to lower depreciation expense, a reduction in provision for excess and obsolete inventories due to increased overall demand, and lower stock based compensation. Changes in operating assets and liabilities reduced cash provided by operating activities due to an increase in prepaid taxes compared to a decrease last year, a greater increase in inventories compared to last year as production increased in the first half of fiscal 2011 in anticipation of increased sales which did not materialize, a lesser increase in trade accounts payable and accrued liabilities, and a decrease in deferred revenue. These reductions to cash were partially offset by a reduction in trade accounts receivable due to decreased sales during the second half of fiscal 2011 compared to an increase in the second half of fiscal 2010, and due to a decrease in prepaid expenses and other assets.
Investing Activities
Investing cash flows consist primarily of capital expenditures and purchases of short-term investments, partially offset by sales of short-term investments and redemptions of long-term investments. Cash provided by investing activities was $3,086,000 in fiscal year 2011 compared to cash used of $23,872,000 in fiscal year 2010. During fiscal year 2011, we received par value redemptions of our ARS totaling $36,450,000. Partially offsetting this was $32,254,000 of greater purchases than disposals of short-term investments and capital expenditure of $1,210,000. Our capital expenditures in fiscal 2011 were devoted primarily to equipment to expand our test capacity and to upgrades of our software and computer hardware.
31
Our investment portfolio is primarily comprised of municipal bonds, corporate bonds, ARS, government agency bonds, discount notes and certificates of deposits.
As further described in Note 3, auction failures have limited and we expect will continue to limit our ability to liquidate our ARS for some period of time. However, we do not believe the auction failures will materially impact our ability to fund our working capital needs, capital expenditures, or other business requirements. As of April 2, 2011, we had approximately $156,673,000 of working capital, including approximately $133,722,000 of cash, cash equivalents, and short-term investments, and we have generated cash from our operations for the past several years.
Financing Activities
Financing cash flows consist primarily of proceeds from the exercise of stock options under the 2001 and 2009 Plans and sales of stock through the ESPP, reclassification of non-cash excess tax benefit from operating into financing activities, and repurchases of stock on the open market. Net cash used by financing activities in fiscal 2011 was $3,727,000, due to repurchases of our shares from the open market, partially offset by proceeds associated with the exercise of stock options and employee purchases through the employee stock purchase plan. In contrast, in fiscal 2010 when cash provided by financing activities was $1,240,000, we did not repurchase any shares.
We expect to spend approximately $6,600,000 for capital acquisitions in fiscal 2012. We believe that we have substantial production capacity in place to handle any projected increase in business in fiscal 2012. Almost all of our $5,708,000 book value of property, plant and equipment are located in the United States and Hong Kong. We also believe that existing cash, cash equivalents and short-term investments, together with cash flow from operations, will be sufficient to meet our liquidity and capital requirements through the next twelve months even were we to be able to repurchase the approximately remaining $54 million of shares we are targeting in the next two years in our share repurchase program.
Fiscal 2010
Operating Activities
Net cash provided by operating activities is net income adjusted for certain non-cash items and changes in assets and liabilities. For the year ended April 3, 2010, net cash provided by operating activites was $8,541,000 compared to $22,406,000 in fiscal 2009. This decrease of $13,865,000 resulted from a lesser net income after non-cash adjustments of $11,332,000 and a decrease from changes in assets and liabilities totaling $2,533,000. The lower non-cash adjustments were primarily an unrealized gain from short-term investments compared to an unrealized loss last year and a reduction in deferred income taxes compared to an increase last year, partially offset by higher provision for excess and obsolete inventories due to reduced overall demand during the first half of fiscal 2010, and higher stock-based compensation expense. Also contributing to the decrease in cash provided by operating activities were increased trade accounts receivable due to a significant increase in sales during the fourth quarter of fiscal 2010 compared to a decrease in the second half of fiscal 2009, and due to increases in prepaid expenses and inventories, while income taxes payable decreased. These changes in non-cash adjustments were partially offset by increases in trade accounts payable, prepaid income taxes and deferred revenue, as our distributors increased the amount of inventory being carried, while in fiscal 2009 they decreased inventories.
Investing Activities
Investing cash flows consist primarily of capital expenditures and purchases of short-term investments, partially offset by sales of short-term investments and redemptions of long-term investments. Cash used in investing activities was $23,872,000 in fiscal year 2010 compared to cash used of $17,792,000 in fiscal year 2009. During fiscal year 2010, we bought $41,921,000 more of short-term investments than we sold. Partially offsetting this use of cash were par value redemptions of our ARS totaling $19,250,000. Our capital expenditures in fiscal 2010 of $1,201,000 were lower than in fiscal 2009.
32
Financing Activities
Financing cash flows consist primarily of proceeds from the exercise of stock options under the 2001 and 2009 Plans and sales of stock through the ESPP, reclassification of non-cash excess tax benefit from operating into financing activities, and repurchases of stock on the open market. Net cash provided by financing activities in fiscal 2010 was $1,240,000, primarily from proceeds associated with the exercise of stock options and employee purchases through the employee stock purchase plan. In fiscal 2010, we did not repurchase any shares from the open market.
Off-Balance Sheet Arrangements
We do not have any material off-balance sheet arrangements. Noted below under “Contractual Obligations” are various commitments we have associated with our business such as lease commitments, open purchase obligations and other items that are not recorded on our balance sheet, since we have not yet received the related goods or services as of April 2, 2011.
Contractual Obligations
The following table summarizes our significant contractual cash obligations at April 2, 2011, which consist of operating facility leases and open volume purchase orders which provide volume discounts. Such obligations are expected to have minimal effect on our liquidity and cash flow in future periods (in thousands):
|
Contractual Obligations
|
Total
|
Less than 1 Year
|
1-2 Years
|
2-3 Years
|
3-4 Years
|
4-5 Years
|
More than 5 years
|
|||||||||||||||||||||
|
Operating lease obligations (1)
|
$ | 3,513 | $ | 855 | $ | 725 | $ | 621 | $ | 620 | $ | 639 | $ | 53 | ||||||||||||||
|
Purchase obligations
|
8,262 | 7,991 | 5 | 266 | - | - | - | |||||||||||||||||||||
|
Total Contractual Cash Obligations
|
$ | 11,775 | $ | 8,846 | $ | 730 | $ | 887 | $ | 620 | $ | 639 | $ | 53 | ||||||||||||||
_____________________________
(1) We lease facilities under non-cancelable lease agreements expiring at various times through April 2016. Rental expense amounted to $1,068,000 for fiscal 2011. Rental expenses were $1,200,000 (net of sublease income of $11,000) in fiscal 2010.
As of April 2, 2011, the liability for uncertain tax positions, net of offsetting tax benefits associated with the correlative effects of potential transfer pricing adjustments, state income taxes, interest deductions, and other receivables was $3,083,000. As of April 2, 2011, we had accumulated balances for estimated interest and penalties related to unrecognized tax benefits in income tax expense of $512,000 and $410,000, respectively. For the year ended April 2, 2011, we recorded estimated interest of $131,000 and estimated penalties of $21,000. We cannot conclude on the range of cash payments that will be made within the next twelve months associated with our uncertain tax positions.
Common Stock Repurchases
Share repurchase activities for fiscal years ended April 2, 2011 and April 3, 2010 were as follows:
|
Fiscal Years Ended
|
||||||||
|
April 2, 2011
|
April 3, 2010
|
|||||||
|
Number of shares repurchased
|
273,000 | - | ||||||
|
Cost of shares repurchased
|
$ | 6,267,000 | $ | - | ||||
|
Average price per share
|
$ | 22.97 | $ | - | ||||
Since the inception of these repurchase programs in 1992 through April 2, 2011, we have repurchased a total of approximately 2,617,000 shares of the common stock for an aggregate cost of $42,818,000. Upon their repurchase, shares are restored to the status of authorized but unissued shares. As of April 2, 2011, there were approximately 2,227,000 shares authorized for future repurchase under our current program.
33
Recent Accounting Pronouncements
In April 2011, FASB issued new authoritative guidance regarding Fair Value Measurement: Amendments to Achieve Common Fair Value Measurement and Disclosure Requirements in U.S. GAAP and IFRSs. This amendment attempts to clarify the Board’s intent on the application of existing fair value measurement and disclosure requirements as well as change to a particular principle or requirement for measuring fair value and for disclosing information about fair value measurements. This amendment is effective for interim and annual periods after December 15, 2011. We are currently assessing the potential effect to our Consolidated Financial Statements in applying this guidance.
Item 7A. Quantitative and Qualitative Disclosures about Market Risk
Interest Rate Risk
We are exposed to financial market risks primarily due to changes in interest rates. We do not use derivatives to alter the interest characteristics of our investment securities. We have no holdings of derivative or commodity instruments, and our holdings are for purposes other than trading. Our investment portfolio is primarily comprised of municipal bonds, corporate bonds, ARS, government agency bonds, discount notes and certificates of deposits. Investments and cash and cash equivalents generated interest income of $812,000 and $1,058,000 in fiscal years 2011 and 2010, respectively. Based on our investments and cash and cash equivalent balance as of April 2, 2011, one percentage point change in interest rates would cause change in our annual interest income by an amount of approximately $1,584,000.
ARS are subject to the risk that the secondary market might fail to provide the liquidity opportunity at the rate reset points. This risk, which we have encountered with regard to our ARS, manifests itself in sponsoring broker-dealers withdrawing from the auction process that provides the rate reset and liquidity. We recorded a $2,550,000 temporary impairment in value as of April 2, 2011, which decreased from $4,200,000 as of April 3, 2010, due to our reduced ARS holdings resulting from several ARS redemptions. In the event we need to access the funds associated with failed auctions, they are not expected to be accessible until one of the following occurs: a successful auction occurs, the issuer redeems the issue, a buyer is found outside of the auction process or the underlying securities have matured.
The ARS we hold had contractual maturities generally between 14 to 30 years and had a total par value of $32,750,000 as of April 2, 2011, compared to $69,200,000 as of April 3, 2010. They are in the form of auction rate bonds backed by a pool of student loans, whose interest rates were reset every seven to thirty-five days through an auction process prior to the fourth quarter of fiscal 2008. At the end of each reset period, investors can sell or continue to hold the securities at par. The ARS held by us are backed by student loans and are guaranteed by the United States Department of Education. In addition, all ARS held by us are rated by the major independent rating agencies as either AAA or Aaa. As our ARS are of high credit rating, we believe the credit risk is very low.
If the issuer of the ARS is unable to successfully close future auctions or does not redeem the ARS, or the United States government fails to support its guaranty of the obligations, we may be required to adjust the carrying value of the ARS and record other-than-temporary impairment charges in future periods, which could materially affect our results of operations and financial condition. However, we expect that we will receive the principal associated with these ARS through one of the means described above.
Foreign Currency Exchange Risks
We do not hedge any potential risk from any foreign currency exposure. With our operations in Hong Kong, we face exposure to an adverse change in the exchange rate of the Hong Kong dollar. We believe that our exposure is relatively small, thus we do not employ hedging techniques designed to mitigate this foreign currency exposure. Likewise, we could experience unanticipated currency gains or losses. As the level of activity at this operation changes over time, actual currency gains or losses could have an adverse impact to the Consolidated Financial Statements. Our foreign sales are denominated in United States dollars. Currency exchange fluctuations in countries where we do business could harm the business by resulting in pricing that is not competitive with prices denominated in local currencies.
34
Item 8. Financial Statements and Supplementary Data
The fiscal fourth quarter ended April 3, 2010 consisted of 14 weeks and each of the other quarters presented consisted of 13 weeks.
|
Quarters Ended
|
||||||||||||||||||||||||||||||||
|
Apr 2,
|
Jan 1,
|
Oct 2,
|
Jul 3,
|
Apr 3,
|
Dec 26,
|
Sep 26,
|
Jun 27,
|
|||||||||||||||||||||||||
|
2011
|
2011
|
2010
|
2010
|
2010
|
2009
|
2009
|
2009
|
|||||||||||||||||||||||||
|
(Unaudited)
|
(in thousands, except per share amounts)
|
|||||||||||||||||||||||||||||||
|
Statement of Income Data:
|
||||||||||||||||||||||||||||||||
|
Net sales
|
$ | 17,983 | $ | 19,675 | $ | 22,359 | $ | 23,155 | $ | 20,559 | $ | 16,735 | $ | 15,875 | $ | 13,555 | ||||||||||||||||
|
Costs of sales
|
8,863 | 9,341 | 9,819 | 9,961 | 11,106 | 8,717 | 8,474 | 6,425 | ||||||||||||||||||||||||
|
Gross profit
|
9,120 | 10,334 | 12,540 | 13,194 | 9,453 | 8,018 | 7,401 | 7,130 | ||||||||||||||||||||||||
|
Income from operations
|
1,571 | 3,141 | 5,059 | 6,372 | 1,706 | 1,078 | 639 | 335 | ||||||||||||||||||||||||
|
Income before provision for income taxes
|
2,129 | 3,586 | 5,782 | 6,283 | 2,180 | 1,583 | 1,492 | 1,121 | ||||||||||||||||||||||||
|
Net income
|
$ | 1,492 | $ | 2,860 | $ | 3,822 | $ | 4,108 | $ | 1,163 | $ | 1,974 | $ | 1,083 | $ | 905 | ||||||||||||||||
|
Net income per share(1)
|
||||||||||||||||||||||||||||||||
|
Basic
|
$ | 0.12 | $ | 0.22 | $ | 0.29 | $ | 0.32 | $ | 0.09 | $ | 0.15 | $ | 0.08 | $ | 0.07 | ||||||||||||||||
|
Diluted
|
$ | 0.12 | $ | 0.22 | $ | 0.29 | $ | 0.32 | $ | 0.09 | $ | 0.15 | $ | 0.08 | $ | 0.07 | ||||||||||||||||
____________________________________________________________________
(1) Basic and diluted earnings per share are computed independently for each of the quarters presented. Therefore, the sum of quarterly basic and diluted per share information may not equal annual basic and diluted earnings per share.
Item 9. Changes in and Disagreements with Accountants on Accounting and Financial Disclosure
None.
Item 9A. Controls and Procedures
(a) Evaluation of Disclosure Controls and Procedures.
(i) Disclosure Controls and Procedures. We maintain disclosure controls and procedures (as defined in Exchange Act Rules 13a-15(e) and 15d-15(e)) that are designed to ensure that information required to be disclosed by us in reports that we file or submit under the Securities Exchange Act of 1934 is recorded, processed, summarized, and reported within the time periods specified in the SEC's rules and forms, and that such information is accumulated and communicated to our management, including our chief executive officer and chief financial officer, as appropriate to allow timely decisions regarding required disclosures.
(ii) Limitations on the Effectiveness of Disclosure Controls. In designing and evaluating our disclosure controls and procedures, management recognized that disclosure controls and procedures, no matter how well conceived and operated, can provide only reasonable, not absolute, assurance that the objectives of the disclosure controls and procedures are met taking into account the totality of the circumstances. Additionally, in designing disclosure controls and procedures, our management necessarily was required to apply its judgment in evaluating the cost-benefit relationship of possible disclosure controls and procedures. The design of any disclosure controls and procedures is also based in part upon certain assumptions about the likelihood of future events, and there can be no assurance that any design will succeed in achieving its stated goals under all potential future conditions.
35
(iii) Evaluation of Disclosure Controls and Procedures. Our chief executive officer and chief financial officer have evaluated our disclosure controls and procedures as of April 2, 2011, and have determined that they are effective at the reasonable assurance level.
(b) Management’s Annual Report on Internal Control over Financial Reporting:
Our management is responsible for establishing and maintaining adequate internal control over our financial reporting which is designed to provide reasonable assurance regarding the reliability of our financial reporting and the preparation of financial statements for external purposes in accordance with U.S. generally accepted accounting principles. Internal control over financial reporting includes those policies and procedures that: (i) pertain to the maintenance of records that, in reasonable detail, accurately and fairly reflect the transactions and dispositions of our assets; (ii) provide reasonable assurance that transactions are recorded as necessary to permit preparation of financial statements in accordance with U.S. generally accepted accounting principles, and that receipts and expenditures of the Company are being made only in accordance with authorizations of our management and directors; and (iii) provide reasonable assurance regarding prevention or timely detection of unauthorized acquisition, use or disposition of our assets that could have a material effect on the financial statements.
Our management with participation of our chief executive officer and our chief financial officer, assessed the effectiveness of our internal control over financial reporting as of April 2, 2011. In making this assessment, our management used the criteria set forth by the Committee of Sponsoring Organizations of the Treadway Commission (“COSO”) in Internal Control-Integrated Framework. Based on the assessment using those criteria, management concluded that, as of April 2, 2011, our internal control over financial reporting is effective.
PricewaterhouseCoopers LLP, the independent registered public accounting firm that audited the consolidated financial statements included in this Annual Report on Form 10-K, also audited and expressed an unqualified opinion on the effectiveness of our internal control over financial reporting as of April 2, 2011. The report on the audit of internal control over financial reporting and the audit of the financial statements appears under item 15(a)(1) in this Annual Report on Form 10-K.
(c) Changes in Internal Control over Financial Reporting.
Our internal control over financial reporting (as defined in Exchange Act Rules 13a-15(f) and 15d-15(f)) is designed to provide reasonable assurance regarding the reliability of our financial reporting and preparation of financial statements for external purposes in accordance with generally accepted accounting principles. There were no changes in our internal control over financial reporting identified in connection with management’s evaluation during the fourth quarter of fiscal 2011 that have materially affected, or are reasonably likely to materially affect, our internal control over financial reporting.
(d) Inherent Limitations on Effectiveness of Controls.
Our management, including our chief executive officer and our chief financial officer, does not expect that our disclosure controls and procedures or our internal control over financial reporting will prevent or detect all errors and all fraud. Any control system, no matter how well designed and operated, can provide only reasonable, not absolute, assurance that the control system’s objectives will be met. The design of a control system must reflect the fact that there are resource constraints and competing use of resources, and the benefits of controls must be considered relative to their costs in light of competing demands on limited resources. Further, because of the inherent limitations in all control systems, no evaluation of controls can provide absolute assurance that misstatements due to errors or frauds will not occur or that all control issues and instances of fraud, if any, within the company have been detected. These inherent limitations include the realities that judgments in decision-making can be faulty and that breakdowns can occur because of a simple error or mistake. Controls can also be circumvented by the individual acts or omissions of some persons, by collusion of two or more people, or by management override of the controls. The design of any system of controls is based in part on certain assumptions about the likelihood of future events, and there can be no assurance that any design will succeed in achieving its stated goals under all potential future conditions. Over time, controls may become inadequate because of changes in conditions or deterioration in the degree of compliance with policies or procedures.
36
Item 9B. Other Information.
None.
PART III
Certain information required by Part III is incorporated by reference from the Company’s definitive Proxy Statement to be filed with the Securities and Exchange Commission in connection with the solicitation of proxies for the Company’s 2011 Annual Meeting of Stockholders currently planned to be held on August 19, 2011 (the “Proxy Statement”).
Item 10. Directors, Executive Officers and Corporate Governance
Information regarding our directors is set forth under "Election of Directors" in the Proxy Statement and is incorporated by reference. The information required by Item 405 of Regulation S-K with respect to disclosure of any known late filings or failure by an insider to file a report required by Section 16(a) of the Exchange Act is incorporated herein by reference from the information contained in the section entitled “Compliance with Section 16(a) of the Exchange Act” in the 2011 Proxy Statement. The required information regarding executive officers is included in Part I hereof under caption "Executive Officers of the Company."
The Company has adopted a Code of Business Conduct and Ethics that applies to all of our employees, agents, contractors, and Board of Directors, including our president and chief executive officer. A copy of the Code of Business Conduct and Ethics is accessible, free of charge, on our Internet website (www.supertex.com). A printed copy is also available on request. Requests should be directed in writing to Supertex, Inc., 1235 Bordeaux Drive, Sunnyvale, CA, 94089, Attention: Investor Relations. Information on our website is not part of this Form 10-K report.
The information required by this item 10 regarding our nominating and corporate governance committee, our audit committee, and our audit committee financial expert is incorporated by reference from the information contained in the 2011 Proxy Statement.
Item 11. Executive Compensation
Information regarding the Company's remuneration of its officers and directors is set forth under "Compensation of Directors" and "Compensation of Executive Officers" in the 2011 Proxy Statement and is incorporated by reference. Other information required by this Item 11 is set forth under “Report of the Executive Compensation Committee of the Board of Directors” and “Compensation Committee Interlocks and Insider Participation” in the 2011 Proxy Statement and is incorporated by reference.
Item 12. Security Ownership of Certain Beneficial Owners and Management and Related Stockholder Matters
Information regarding the security ownership of certain beneficial owners and management is set forth under "Security Ownership of Certain Beneficial Owners and Management" in the 2011 Proxy Statement and is incorporated by reference. The information required by this item with respect to our equity compensation plan is hereby incorporated from Part II, Item 5 of this Form 10-K.
37
Item 13. Certain Relationships and Related Transactions, and Director Independence
Information regarding certain relationships and related transactions is set forth under “Certain Relationship and Related Transactions” in the 2011 Proxy Statement and is incorporated by reference and information regarding our corporate governance is set forth under “Election of Directors” in the 2011 Proxy Statement and is incorporated by reference.
Item 14. Principal Accountant Fees and Services
Information required by this Item regarding accounting fees and services is set forth under the caption “Ratification of Appointment of Independent Registered Public Accounting Firm” in the 2011 Proxy Statement and is incorporated by reference.
38
PART IV
|
Item 15. Exhibits and Financial Statement Schedules
|
|||
|
(a)
|
The following documents are filed as part of this form:
|
||
|
Page
|
|||
|
1.
|
Report of Independent Registered Public Accounting Firm
|
42
|
|
|
2.
|
Consolidated Financial Statements:
|
||
|
Consolidated Balance Sheets as of April 2, 2011 and April 3, 2010
|
43
|
||
|
For the three years ended April 2, 2011, April 3, 2010 and March 28, 2009:
|
|||
|
Consolidated Statements of Income
|
44
|
||
|
Consolidated Statements of Shareholders' Equity
|
45
|
||
|
Consolidated Statements of Cash Flows
|
46
|
||
|
Notes to Consolidated Financial Statements
|
47
|
||
|
3.
|
Exhibits.
|
|
|
Exhibit
|
Exhibit Description
|
|
|
3.1 (1)
|
Restated Articles of Incorporation of Registrant filed May 21, 1980.
|
|
|
3.2 (1)
|
Certificate of Amendment of Articles of Incorporation filed April 16, 1981.
|
|
|
3.3 (1)
|
Certificate of Amendment of Articles of Incorporation filed September 30, 1983.
|
|
|
3.4 (1)
|
Certificate of Amendment of Articles of Incorporation filed October 14, 1988.
|
|
|
3.5 (2)
|
Amended and Restated Bylaws of Registrant.
|
|
|
10.1 (1)*
|
Non-Qualified Deferred Compensation Plan, which became effective January 1, 1996, as most recently amended on December 1, 2008.
|
|
|
10.2 (1)
|
Lease 71 Vista Montana, San Jose, California, comprised of a lease dated December 7, 1988, and five amendments (5/4/89; 6/18/90; 12/21/95; 2/1/99; and 1/23/04) and two assignments (11/15/96 and 2/1/99) with Sobrato Development Companies #871, as landlord, and Supertex, Inc., as assignee/tenant.
|
|
|
10.3 (3)
|
Sixth Amendment to Lease of 71 Vista Montana, San Jose, California dated April 16, 2010, with Sobrato Development Companies #871, as landlord, and Supertex, Inc., as assignee/tenant.
|
|
|
10.4 (1)
|
Leases of Hong Kong Facility dated 5/16/08, 9/11/09, and 9/11/09 with Jing Wah Garments Mfg. Co. Ltd.
|
|
|
10.5 (4)*
|
2000 Employee Stock Purchase Plan.
|
|
|
10.6 (5)*
|
2001 Stock Option Plan.
|
|
|
10.7 (6)*
|
2009 Equity Incentive Plan.
|
|
39
|
10.8 (1)*
|
Profit Sharing Bonus Incentive Plan.
|
|
|
21.1
|
Subsidiary of the Registrant.
|
|
|
23.1
|
Consent of PricewaterhouseCoopers LLP, Independent Registered Public Accounting Firm.
|
|
|
24.1
|
Power of Attorney (See signature page).
|
|
|
31.1
|
Certification of Chief Executive Officer pursuant to Securities Exchange Act Rules 13a-14(a) and 15d-14(a), as adopted pursuant to Section 302 of the Sarbanes-Oxley Act of 2002.
|
|
|
31.2
|
Certification of Chief Financial Officer pursuant to Securities Exchange Act Rules 13a-14(a) and 15d-14(a), as adopted pursuant to Section 302 of the Sarbanes-Oxley Act of 2002.
|
|
|
32.1
|
Certification of Chief Executive Officer pursuant to 18 U.S.C. Section 1350, as adopted pursuant to Section 906 of the Sarbanes-Oxley Act of 2002.
|
|
|
32.2
|
Certification of Chief Financial Officer pursuant to 18 U.S.C. Section 1350, as adopted pursuant to Section 906 of the Sarbanes-Oxley Act of 2002.
|
|
|
(1)
|
Exhibits 3.1, 3.2, 3.3, 3.4, 10.1, 10.2, 10.4, and 10.8 to Registrant’s Annual Report on Form 10-K dated April 3, 2010, filed with the SEC on June 11, 2010 are hereby incorporated by reference.
|
|
|
(2)
|
Exhibit 3.6 to Registrant’s Current Report on Form 8-K dated December 21, 2007, filed with the SEC on December 28, 2007, is hereby incorporated by reference.
|
|
|
(3)
|
Exhibit 10.9 to Registrant’s Current Report on Form 8-K dated April 16, 2010, filed with the SEC on April 22, 2010 is hereby incorporated by reference.
|
|
|
(4)
|
Exhibit 4.1 to Registrant's Registration Statement on Form S-8 (File No. 333-47606) which was filed with the SEC and became effective on October 10, 2000, is hereby incorporated by reference.
|
|
|
(5)
|
Appendix B of Registrant’s amended Proxy Statement on Schedule 14A filed on August 7, 2001 (File No. 000-12718) is hereby incorporated by reference.
|
|
|
(6)
|
Appendix 1 of Registrant’s Proxy Statement on Schedule 14A filed on July 2, 2009 (File No. 000-12718) is hereby incorporated by reference.
|
|
|
*
|
Denotes a management contract or compensatory plan or arrangement.
|
|
|
(b)
|
Exhibits 21.1, 23.1, 24.1, 31.1, 31.2, 32.1 and 32.2 are filed herewith.
|
|
40
SIGNATURES
Pursuant to the requirements of Section 13 or 15(d) of the Securities Act of 1934, the Registrant has duly caused this report to be signed on its behalf by the undersigned, thereunto duly authorized.
|
Supertex, Inc.
|
|||
|
Dated: June 13, 2011
|
/s/ |
PHILLIP A. KAGEL
|
|
| Phillip A. Kagel | |||
| Vice President, Finance and Chief Financial Officer | |||
| (Principal Financial and Accounting Officer) | |||
POWER OF ATTORNEY
KNOW ALL PERSONS BY THESE PRESENTS, that each person whose signature appears below constitutes and appoints Henry C. Pao, his attorney-in-fact, with the power of substitution, for him in any and all capacities, to sign any amendments to this report on Form 10-K, and to file the same, with exhibits thereto and other documents in connection therewith, with the Securities and Exchange Commission, hereby ratifying and confirming all that said attorney-in-fact, or his substitute or substitutes, may do or cause to be done by virtue hereof.
Pursuant to the requirements of the Securities Exchange Act of 1934, this report has been signed below by the following persons on behalf of the registrant and in the capacities and on the dates indicated.
|
Signature
|
Title
|
Date
|
||
|
/s/ HENRY C. PAO
|
Director, President and Chief Executive Officer
|
June 13, 2011
|
||
|
(Henry C. Pao)
|
(Principle Executive Officer)
|
|||
|
/s/ PHILLIP A. KAGEL
|
Vice President, Finance and Chief Financial Officer
|
June 13, 2011
|
||
|
(Phillip A. Kagel)
|
(Principal Financial and Accounting Officer)
|
|||
|
/s/ BENEDICT C. K. CHOY
(Benedict C. K. Choy)
|
Director and Senior Vice President, Technology Development
|
June 13, 2011
|
||
|
/s/ W. MARK LOVELESS
|
Director
|
June 13, 2011
|
||
|
(W. Mark Loveless)
|
||||
|
/s/ ELLIOTT SCHLAM
|
Director
|
June 13, 2011
|
||
|
(Elliott Schlam)
|
||||
|
/s/ MILTON FENG
|
Director
|
June 13, 2011
|
||
|
(Milton Feng)
|
||||
41
Report of Independent Registered Public Accounting Firm
To the Board of Directors and Shareholders of Supertex, Inc.
In our opinion, the accompanying consolidated balance sheets and the related consolidated statements of income, shareholders’ equity and cash flows present fairly, in all material respects, the financial position of Supertex, Inc. and its subsidiary at April 2, 2011 and April 3, 2010, and the results of their operations and their cash flows for each of the three years in the period ended April 2, 2011 in conformity with accounting principles generally accepted in the United States of America. Also in our opinion, the Company maintained, in all material respects, effective internal control over financial reporting as of April 2, 2011, based on criteria established in Internal Control - Integrated Framework issued by the Committee of Sponsoring Organizations of the Treadway Commission (COSO). The Company's management is responsible for these financial statements, for maintaining effective internal control over financial reporting and for its assessment of the effectiveness of internal control over financial reporting, included in Management's Annual Report on Internal Control over Financial Reporting under Item 9A. Our responsibility is to express opinions on these financial statements and on the Company's internal control over financial reporting based on our integrated audits. We conducted our audits in accordance with the standards of the Public Company Accounting Oversight Board (United States). Those standards require that we plan and perform the audits to obtain reasonable assurance about whether the financial statements are free of material misstatement and whether effective internal control over financial reporting was maintained in all material respects. Our audits of the financial statements included examining, on a test basis, evidence supporting the amounts and disclosures in the financial statements, assessing the accounting principles used and significant estimates made by management, and evaluating the overall financial statement presentation. Our audit of internal control over financial reporting included obtaining an understanding of internal control over financial reporting, assessing the risk that a material weakness exists, and testing and evaluating the design and operating effectiveness of internal control based on the assessed risk. Our audits also included performing such other procedures as we considered necessary in the circumstances. We believe that our audits provide a reasonable basis for our opinions.
A company’s internal control over financial reporting is a process designed to provide reasonable assurance regarding the reliability of financial reporting and the preparation of financial statements for external purposes in accordance with generally accepted accounting principles. A company’s internal control over financial reporting includes those policies and procedures that (i) pertain to the maintenance of records that, in reasonable detail, accurately and fairly reflect the transactions and dispositions of the assets of the company; (ii) provide reasonable assurance that transactions are recorded as necessary to permit preparation of financial statements in accordance with generally accepted accounting principles, and that receipts and expenditures of the company are being made only in accordance with authorizations of management and directors of the company; and (iii) provide reasonable assurance regarding prevention or timely detection of unauthorized acquisition, use, or disposition of the company’s assets that could have a material effect on the financial statements.
Because of its inherent limitations, internal control over financial reporting may not prevent or detect misstatements. Also, projections of any evaluation of effectiveness to future periods are subject to the risk that controls may become inadequate because of changes in conditions, or that the degree of compliance with the policies or procedures may deteriorate.
/s/ PricewaterhouseCoopers LLP
San Jose, California
June 13, 2011
42
SUPERTEX, INC.
CONSOLIDATED BALANCE SHEETS
(in thousands)
|
April 2, 2011
|
April 3, 2010
|
|||||||
|
ASSETS
|
||||||||
|
Current Assets:
|
||||||||
|
Cash and cash equivalents
|
$ | 23,962 | $ | 10,153 | ||||
|
Short-term investments
|
109,760 | 76,860 | ||||||
|
Trade accounts receivable, net
|
8,100 | 10,786 | ||||||
|
Inventories
|
20,600 | 15,450 | ||||||
|
Prepaid expenses and other current assets
|
2,975 | 3,726 | ||||||
|
Prepaid income taxes
|
6,461 | 2,456 | ||||||
|
Deferred income taxes
|
7,228 | 8,162 | ||||||
|
Total current assets
|
179,086 | 127,593 | ||||||
|
Long-term investments
|
30,200 | 65,000 | ||||||
|
Property, plant and equipment, net
|
5,708 | 6,791 | ||||||
|
Other assets
|
622 | 580 | ||||||
|
Deferred income taxes
|
4,980 | 5,254 | ||||||
|
Total assets
|
$ | 220,596 | $ | 205,218 | ||||
|
LIABILITIES AND SHAREHOLDERS’ EQUITY
|
||||||||
|
Current Liabilities:
|
||||||||
|
Trade accounts payable
|
$ | 3,283 | $ | 3,748 | ||||
|
Accrued salaries and employee benefits
|
12,430 | 11,430 | ||||||
|
Other accrued liabilities
|
772 | 1,167 | ||||||
|
Deferred revenue
|
3,664 | 3,962 | ||||||
|
Income taxes payable
|
2,264 | 15 | ||||||
|
Total current liabilities
|
22,413 | 20,322 | ||||||
|
Income taxes payable, noncurrent
|
4,974 | 4,520 | ||||||
|
Other accrued liabilities, noncurrent
|
290 | - | ||||||
|
Total liabilities
|
27,677 | 24,842 | ||||||
|
Commitments and contingencies (Note 14)
|
||||||||
|
Shareholders’ equity:
|
||||||||
|
Preferred stock, no par value -- 10,000 shares authorized, none issued and outstanding
|
- | - | ||||||
|
Common stock, no par value -- 30,000 shares authorized; issued and outstanding 12,808 shares as of April 2, 2011 and 12,944 shares as of April 3, 2010
|
68,499 | 64,296 | ||||||
|
Accumulated other comprehensive loss
|
(1,683 | ) | (2,566 | ) | ||||
|
Retained earnings
|
126,103 | 118,646 | ||||||
|
Total shareholders' equity
|
192,919 | 180,376 | ||||||
|
Total liabilities and shareholders' equity
|
$ | 220,596 | $ | 205,218 | ||||
See accompanying Notes to Consolidated Financial Statements.
43
SUPERTEX, INC.
CONSOLIDATED STATEMENTS OF INCOME
(in thousands, except per share amounts)
|
Fiscal Years Ended
|
||||||||||||
|
April 2, 2011
|
April 3, 2010
|
March 28, 2009
|
||||||||||
|
Net sales
|
$ | 83,172 | $ | 66,724 | $ | 78,810 | ||||||
|
Cost and expenses:
|
||||||||||||
|
Cost of sales
|
37,984 | 34,722 | 36,931 | |||||||||
|
Research and development
|
14,851 | 15,404 | 14,553 | |||||||||
|
Selling, general and administrative
|
14,194 | 12,840 | 13,332 | |||||||||
|
Total costs and expenses
|
67,029 | 62,966 | 64,816 | |||||||||
|
Income from operations
|
16,143 | 3,758 | 13,994 | |||||||||
|
Interest and other income:
|
||||||||||||
|
Interest income
|
812 | 1,058 | 3,209 | |||||||||
|
Other income(expense), net
|
825 | 1,560 | (1,437 | ) | ||||||||
|
Income before provision for income taxes
|
17,780 | 6,376 | 15,766 | |||||||||
|
Provision for income taxes
|
5,498 | 1,251 | 3,221 | |||||||||
|
Net income
|
$ | 12,282 | $ | 5,125 | $ | 12,545 | ||||||
|
Net income per share
|
||||||||||||
|
Basic
|
$ | 0.95 | $ | 0.40 | $ | 0.98 | ||||||
|
Diluted
|
$ | 0.94 | $ | 0.39 | $ | 0.97 | ||||||
|
Shares used in per share computation
|
||||||||||||
|
Basic
|
12,976 | 12,912 | 12,836 | |||||||||
|
Diluted
|
13,030 | 12,995 | 12,927 | |||||||||
See accompanying Notes to Consolidated Financial Statements.
44
SUPERTEX, INC.
CONSOLIDATED STATEMENTS OF SHAREHOLDERS' EQUITY
(in thousands)
|
Number of Common Shares
|
Stock Amount
|
Accumulated Other Comprehensive Loss
|
Retained Earnings
|
Share-holders’ Equity
|
Comprehensive Income
|
|||||||||||||||||||
|
Balance, March 29, 2008
|
12,749 | $ | 54,968 | $ | (4,069 | ) | $ | 100,976 | $ | 151,875 |
|
|||||||||||||
|
Stock options exercised
|
115 | 1,504 | - | - | 1,504 | |||||||||||||||||||
|
Issuance of shares under ESPP
|
8 | 167 | - | - | 167 | |||||||||||||||||||
|
Stock-based compensation expense
|
- | 2,761 | - | - | 2,761 | |||||||||||||||||||
|
Excess tax benefit from stock-based compensation plans
|
- | 149 | - | - | 149 | |||||||||||||||||||
|
Net income
|
- | - | - | 12,545 | 12,545 | $ | 12,545 | |||||||||||||||||
|
Unrealized loss from available-for-sale investments, net of taxes
|
- | - | (1,425 | ) | - | (1,425 | ) | (1,425 | ) | |||||||||||||||
| Balance, March 28, 2009 | 12,872 | 59,549 | (5,494 | ) | 113,521 | 167,576 | 11,120 | |||||||||||||||||
|
Stock options exercised
|
66 | 1,060 | - | - | 1,060 | |||||||||||||||||||
|
Issuance of shares under ESPP
|
6 | 154 | - | - | 154 | |||||||||||||||||||
|
Stock-based compensation expense
|
- | 3,470 | - | - | 3,470 | |||||||||||||||||||
|
Excess tax benefit from stock-based compensation plans
|
- | 63 | - | - | 63 | |||||||||||||||||||
|
Net income
|
- | - | - | 5,125 | 5,125 | 5,125 | ||||||||||||||||||
|
Unrealized gain from available-for-sale investments, net of taxes
|
- | - | 2,928 | - | 2,928 | 2,928 | ||||||||||||||||||
|
Balance, April 3, 2010
|
12,944 | 64,296 | (2,566 | ) | 118,646 | 180,376 | 8,053 | |||||||||||||||||
|
Stock options exercised
|
130 | 2,355 | - | - | 2,355 | |||||||||||||||||||
|
Issuance of shares under ESPP
|
7 | 178 | - | - | 178 | |||||||||||||||||||
|
Stock repurchase
|
(273 | ) | (1,442 | ) | - | (4,825 | ) | (6,267 | ) | |||||||||||||||
|
Stock-based compensation expense
|
- | 3,099 | - | - | 3,099 | |||||||||||||||||||
|
Excess tax benefit from stock-based compensation plans
|
- | 13 | - | - | 13 | |||||||||||||||||||
|
Net income
|
- | - | - | 12,282 | 12,282 | 12,282 | ||||||||||||||||||
|
Unrealized gain from available-for-sale investments, net of taxes
|
- | - | 883 | - | 883 | 883 | ||||||||||||||||||
|
Balance, April 2, 2011
|
12,808 | $ | 68,499 | $ | (1,683 | ) | $ | 126,103 | $ | 192,919 | $ | 13,165 | ||||||||||||
See accompanying Notes to Consolidated Financial Statements.
45
SUPERTEX, INC.
CONSOLIDATED STATEMENTS OF CASH FLOWS
(in thousands)
|
Fiscal Years Ended
|
||||||||||||
|
CASH FLOWS FROM OPERATING ACTIVITIES
|
April 2, 2011
|
April 3, 2010
|
March 28, 2009
|
|||||||||
|
Net income
|
$ | 12,282 | $ | 5,125 | $ | 12,545 | ||||||
|
Non-cash adjustments to net income:
|
||||||||||||
|
Depreciation and amortization
|
2,303 | 2,952 | 3,397 | |||||||||
|
Provision for doubtful accounts and sales returns
|
525 | 488 | 646 | |||||||||
|
Provision for excess and obsolete inventories
|
2,859 | 3,448 | 2,322 | |||||||||
|
Deferred income taxes
|
484 | (929 | ) | 1,071 | ||||||||
|
Stock-based compensation
|
3,099 | 3,470 | 2,761 | |||||||||
|
Tax benefit related to stock-based compensation plans
|
13 | 63 | 149 | |||||||||
|
Excess tax benefit related to stock-based compensation
|
(7 | ) | (26 | ) | (57 | ) | ||||||
|
Unrealized (gain) loss from short-term investments, categorized as trading
|
(689 | ) | (1,607 | ) | 1,464 | |||||||
|
(Gain) loss on disposal of property, plant and equipment
|
(98 | ) | 5 | 23 | ||||||||
|
Changes in operating assets and liabilities:
|
||||||||||||
|
Trade accounts receivable
|
2,125 | (3,183 | ) | 4,546 | ||||||||
|
Inventories
|
(8,009 | ) | (3,198 | ) | (986 | ) | ||||||
|
Prepaid expenses and other assets
|
745 | (2,239 | ) | 1,867 | ||||||||
|
Prepaid income taxes
|
(4,005 | ) | 2,132 | (4,588 | ) | |||||||
|
Trade accounts payable and accrued expenses
|
418 | 3,540 | (4,442 | ) | ||||||||
|
Deferred revenue
|
(298 | ) | 686 | (1,073 | ) | |||||||
|
Income taxes payable
|
2,703 | (2,186 | ) | 2,761 | ||||||||
|
Net cash provided by operating activities
|
14,450 | 8,541 | 22,406 | |||||||||
|
CASH FLOWS FROM INVESTING ACTIVITIES
|
||||||||||||
|
Purchases of property, plant and equipment, net
|
(1,210 | ) | (1,201 | ) | (1,971 | ) | ||||||
|
Proceeds from disposal of property, plant and equipment
|
100 | - | - | |||||||||
|
Purchases of investments
|
(174,665 | ) | (86,233 | ) | (34,529 | ) | ||||||
|
Sales of investments
|
53,699 | 11,143 | 6,558 | |||||||||
|
Maturities of investments
|
125,162 | 52,419 | 12,150 | |||||||||
|
Net cash provided by (used in) investing activities
|
3,086 | (23,872 | ) | (17,792 | ) | |||||||
|
CASH FLOWS FROM FINANCING ACTIVITIES
|
||||||||||||
|
Proceeds from exercise of stock options and employee stock purchase plan
|
2,533 | 1,214 | 1,671 | |||||||||
|
Stock repurchased
|
(6,267 | ) | - | - | ||||||||
|
Excess tax benefit related to stock-based compensation
|
7 | 26 | 57 | |||||||||
|
Net cash (used in) provided by financing activities
|
(3,727 | ) | 1,240 | 1,728 | ||||||||
|
NET INCREASE (DECREASE) IN CASH AND CASH EQUIVALENTS
|
13,809 | (14,091 | ) | 6,342 | ||||||||
|
CASH AND CASH EQUIVALENTS:
|
||||||||||||
|
Beginning of period
|
10,153 | 24,244 | 17,902 | |||||||||
|
End of period
|
$ | 23,962 | $ | 10,153 | $ | 24,244 | ||||||
|
Supplemental cash flow disclosures:
|
||||||||||||
|
Income taxes paid, net of refunds
|
$ | 5,089 | $ | 3,479 | $ | 2,985 | ||||||
|
Supplemental disclosure of non-cash activities:
|
||||||||||||
|
Additions to property, plant and equipment included in accounts payable and accrued expenses
|
$ | 12 | $ | 74 | $ | 6 | ||||||
See accompanying Notes to Consolidated Financial Statements.
46
SUPERTEX, INC.
NOTES TO CONSOLIDATED FINANCIAL STATEMENTS
1. NATURE OF BUSINESS AND SIGNIFICANT ACCOUNTING POLICIES
Nature of Business
Supertex, Inc. (together with its wholly-owned subsidiary, Supertex Limited, herein referred to as “Supertex” or the “Company”) designs, develops, manufactures, and markets high voltage analog and mixed signal integrated circuits utilizing high voltage DMOS, HVCMOS and HVBiCMOS analog and mixed signal technologies. The Company supplies standard and custom interface products primarily for use in the medical electronics, LED lighting, imaging, telecommunications, and industrial/other markets.
Principles of Consolidation
The consolidated financial statements include the accounts of the Company and its wholly-owned subsidiary. All significant inter-company balances and transactions have been eliminated.
Fiscal Period
The Company uses a 52-53 week fiscal year ending the Saturday nearest to March 31st. Fiscal years 2011 and 2009 both comprised 52 weeks. Fiscal year 2010 comprised 53 weeks.
Use of Estimates
The preparation of financial statements in conformity with generally accepted accounting principles requires management to make estimates and assumptions that affect the reported amounts of assets and liabilities and the disclosure of contingent assets and liabilities at the date of the financial statements and the reported amounts of sales and expenses during the reporting period. Significant estimates in these financial statements include revenue recognition, provision for sales returns and allowances, allowance for doubtful accounts, warranty reserves, estimates for useful lives associated with long lived assets, asset impairments, auction rate security (“ARS”) valuation, net realizable value of inventories, certain accrued liabilities and provision for income taxes and tax valuation allowance. Actual results could differ from those estimates.
Certain Risks and Uncertainties
The Company’s business is concentrated in the high voltage semiconductor component industry, which is rapidly changing, highly competitive and subject to competitive pricing pressures. The Company's operating results may experience substantial period-to-period fluctuations due to these factors, including the cyclical nature of the semiconductor industry, the changes in customer requirements, the timely introduction of new products, the Company's ability to implement new capabilities or technologies, its ability to manufacture efficiently, its reliance on subcontractors and vendors, and general economic conditions.
Cash and Cash Equivalents
Investments with an original or remaining maturity of 90 days or less, as of the date of purchase, are considered cash equivalents, and consist of municipal bonds, corporate bonds, ARS, government agency bonds, discount notes and certificates of deposits. The Company maintains cash balances at a variety of financial institutions and has not experienced any material losses relating to such balances.
Short-term and long-term investments
The appropriate classification of investments in marketable securities is determined at the time of purchase and such designation is reevaluated at each balance sheet date. The Company also monitors its investments for impairment periodically and records appropriate reductions in carrying values when the declines are determined to be other-than-temporary.
47
SUPERTEX, INC.
NOTES TO CONSOLIDATED FINANCIAL STATEMENTS – (CONTINUED)
Investments categorized as trading consisted entirely of investments in mutual funds held by the Company’s Non-qualified Deferred Compensation Plan (“NQDCP”) and are included as short-term investments on the consolidated balance sheets.
The Company’s short-term and long-term investments as of April 2, 2011 are composed of municipal bonds, corporate bonds, ARS, government agency bonds, discount notes and certificates of deposits. Unrealized gains and losses are reported in accumulated other comprehensive income (loss), a separate component of shareholders’ equity, net of any related tax effect. Realized gains and losses and declines in value judged to be other than temporary on available-for-sale securities are included in interest income (expense). There were no realized losses and declines in value judged to be other than temporary recorded in fiscal years 2011, 2010 and 2009. For the purpose of computing realized gains and losses, cost is identified on a specific identification basis. The ARS investments held by the Company as of April 2, 2011 have experienced failed auctions due to sales orders exceeding purchase orders, so the Company’s ARS investments are considered illiquid until there is a successful auction for them. As of April 2, 2011, the par value of $32,750,000 ARS was presented in long-term investments. Due to the lack of availability of observable market quotes on the Company’s investment portfolio of ARS, the fair value was estimated based on a discounted cash flow model and included a discount factor for illiquidity of the ARS market. The assumptions used in the discounted cash flow model include estimates for interest rates, timing and amounts of cash flows, liquidity of the underlying security, expected holding periods and contractual terms of the security.
For investments other than the ARS, the fair value is observable and therefore no estimates are required.
The Company reviews its impairments to determine the classification of the impairment as “temporary” or “other-than-temporary.” Declines in fair value that are considered other than temporary are charged to statement of income and those that are considered temporary are reported as a component of accumulated other comprehensive income (loss) in shareholders’ equity.
In evaluating the impairment of any individual ARS, the Company classified such impairment as temporary or other-than-temporary. The differentiating factors between temporary and other-than-temporary impairment are primarily the length of time and the extent to which the market value has been less than cost, the financial condition and near-term prospects of the issuer, and the intent and ability of the Company to hold its ARS investments for a period of time sufficient to allow for any anticipated recovery in market value.
Based on this assessment of fair value of ARS as of April 2, 2011, the unrealized loss of $2,550,000 was recorded in accumulated other comprehensive loss, net of tax of $903,000.
The valuation of the Company’s investment portfolio is subject to uncertainties that are difficult to predict. Factors that may impact the Company’s valuation include changes of credit ratings, as well as collateral values, default rate of underlying assets, counterparty risk and ongoing strength of the liquidity market (See Notes 2 and 3).
Accounts Receivable
An allowance for doubtful accounts is calculated based on a percentage based on historical experience applied to outstanding accounts receivable, specific doubtful account identification, and management judgment. The Company writes off accounts receivable against the allowance when it determines a balance is uncollectible and no longer actively pursues collection of the receivable.
Concentration of credit risk and foreign operations
Financial instruments, which potentially subject the Company to concentrations of credit risk, consist principally of cash and cash equivalents, short-term and long-term investments, and accounts receivable. The Company’s accounts receivable are derived from sales and earned from customers located in the U.S. and certain foreign countries and regions, including China, Asia, Europe and Japan. For the years ended April 2, 2011, April 3, 2010 and March 28, 2009, sales to foreign customers based on destination locations were all denominated in U.S. dollars and accounted for 71%, 68% and 63%, of net sales, respectively. The Company performs ongoing credit evaluations of its customers’ financial condition and requires no collateral from its customers.
48
SUPERTEX, INC.
NOTES TO CONSOLIDATED FINANCIAL STATEMENTS – (CONTINUED)
As of April 2, 2011, one customer accounted for 15% of gross accounts receivable. One customer accounted for 11% of gross accounts receivable as of April 3, 2010.
Foreign Currency Risk
Because of the Company’s operations in Hong Kong, the Company may face exposure to an adverse change in the exchange rate of the Hong Kong dollar that is currently pegged to the U.S. dollar. The Company believes that its exposure is relatively small, thus it does not employ hedging techniques designed to mitigate this foreign currency exposure. The Company could experience unanticipated currency gains or losses. As the level of activity at this operation changes over time, actual currency gains or losses could have an adverse impact to the consolidated financial statements.
A small amount of the Company’s assets are denominated in Hong Kong dollars including two bank accounts, one for its Hong Kong subsidiary’s daily cash requirements while the second account is held for that subsidiary’s employees’ contributions to the Employee Stock Purchase Plan. The Company also has bank accounts denominated in Chinese Renminbi and a bank account denominated in Japanese Yen, which were established to fund cash requirements for its two sales offices in mainland China and one in Japan. All other cash and investment accounts are denominated in United States dollars and domiciled in the United States with the exception of one investment account that is domiciled in Ireland.
The Company’s foreign sales are denominated in United States dollars. Currency exchange fluctuations in countries where the Company does business could harm the business by resulting in pricing that is not competitive with prices denominated in local currencies.
Foreign Currency Remeasurement
The functional currency of the Company’s Hong Kong subsidiary is the U.S. dollar. As such, gains and losses resulting from remeasurement from local currency to the U.S. dollar are included in other income (expense), net. Such gains and losses have not been material for any period presented.
Inventories
Inventories are stated at the lower of cost (determined on a first-in, first-out basis) or net realizable value. The Company’s inventories include high technology parts and components that are specialized in nature and subject to rapid technological obsolescence. While the Company has programs to minimize the required inventories on hand and considers technological obsolescence when estimating amounts required to reduce recorded amounts to net realizable values, it is possible that such estimates could change in the near term.
Property, Plant and Equipment
Property, plant and equipment are stated at cost and generally depreciated using accelerated methods over estimated useful lives of five years or less. Building and building improvements are recorded at cost and are depreciated on a straight-line basis over the useful life of the building of thirty-nine years. Leasehold improvements are recorded at cost and are amortized on a straight-line basis over the lesser of the related lease term or the estimated useful life of the assets.
Impairment of Long-lived assets
The Company routinely considers whether indicators of impairment of long-lived assets are present. If such indicators are present, the Company determines whether the sum of the estimated undiscounted cash flows attributable to the assets in question is less than their carrying value. If less, the Company recognizes an impairment loss based on the excess of the carrying amount of the assets over their respective fair values. Fair value is determined using various approaches, including discounted future cash flows, independent appraisals or other relevant methods. If the assets determined to be impaired are to be held and used, the Company recognizes an impairment charge to the extent the present value of anticipated net cash flows attributable to the asset are less than the asset's carrying value. The fair value of the asset then becomes the asset's new carrying value, which the Company depreciates or amortizes over the remaining estimated useful life of the asset where appropriate. The Company may incur impairment losses in future periods if factors influencing its estimates change. Historically, the Company has not had an impairment charge on its tangible long-lived assets.
49
SUPERTEX, INC.
NOTES TO CONSOLIDATED FINANCIAL STATEMENTS – (CONTINUED)
Revenue Recognition
The Company recognizes revenue from direct product sales to end-user customers upon transfer of title and risk of loss, which is upon shipment of the product provided persuasive evidence of an arrangement exists, the price is fixed or determinable, no significant obligations remain and collection of the resulting receivable is reasonably assured. For sales to original equipment manufacturers (“OEMs”), the Company uses either a binding purchase order or signed agreement as evidence of an arrangement. Sales through distributors are evidenced by binding purchase orders on a transaction-by-transaction basis. Sales to distributors are made primarily under arrangements allowing limited rights of return, limited price protection and limited right of stock rotation on merchandise unsold by the distributors. Because of the uncertainty associated with pricing concessions and possible returns, with the exception of certain products, the Company defers the recognition of such sales and the related costs of sales until distributors have sold the merchandise to their end customers. Following a prior period change in the terms and conditions to eliminate return rights for distributors for certain products, the Company continued to defer revenue recognition until the distributors had sold these parts as the Company would grant concessions and accept some returns for a period of time after the change. Beginning in the fourth quarter of fiscal 2009, for sales to distributors of such products, the Company had established sufficient history of not granting such concessions or accepting such returns to begin to recognize revenue on such items upon their shipment. The Company’s distributors provide an inventory balance report at the end of each period, which allows the Company to determine products sold to their end customers.
The Company also provides custom processing services for manufacture of integrated circuits, using customer-owned designs and mask tooling. Under this “custom processing service” arrangement, a tangible product is sold, and the Company bears the risk of loss until title is passed. Title to the product under the “custom processing service” arrangement is passed to the customer at the time of shipment.
From time to time, deferred revenue results from up-front billings from customers under non-recurring engineering (“NRE”) contracts. The Company recognizes revenue from NRE contracts upon completion of contract milestones, which corresponds to when the Company provides the services and/or products. Revenue is deferred for any amounts received prior to completion of engineering contract milestones, such as amounts received upon delivery of proto-type, if such a delivery is an agreed upon milestone. Some of the NRE contracts include formal customer acceptance provisions. In this case at the end of each period, the Company determines whether customer acceptance has been obtained for the specific milestone. If customer acceptance has not been obtained, the Company defers the recognition of such revenue until customer acceptance is obtained.
Sales Returns and Other Allowances
The Company records a provision for estimated sales returns and allowances on product sales in the same period as the related revenues are recorded. The Company bases this provision on historical experience, analyses of outstanding Return Material Authorization and Allowance Authorization data and any other form of notification of pending returns. The Company continuously monitors and tracks product returns and in circumstances where it is aware of a specific customer return or allowance which is over and above normal historical sales returns, the Company records a specific allowance against the amounts due, in order to reduce its net receivable from such customer. While sales returns have historically been within the Company’s expectations and the provisions established, the Company cannot guarantee that it will continue to experience the same return rates that it has in the past. Any significant increase in product failure rates and the resulting credit returns could have a material adverse impact on the Company’s operating results for the period or periods in which such returns occur.
50
SUPERTEX, INC.
NOTES TO CONSOLIDATED FINANCIAL STATEMENTS – (CONTINUED)
Warranty Reserves
For sales through distributors, the Company’s policy is to replace under warranty defective products at its own expense for a period of 90 days from date of shipment. This period may be extended in certain cases. This liability is limited to replacement of the product and freight and delivery costs. In certain cases, the Company may pay for rework. This warranty shall not apply to any of such products which have been repaired or altered, except by the Company, or which shall have been subjected to misuse, negligence, or accident. The Company does not extend the original warranty period of any product which has either been repaired or replaced by the Company. The Company reserves for estimated warranty costs in the same period as the related revenues are recorded. The estimate is based on historical experience. The warranty reserve as of April 2, 2011 and April 3, 2010 was $48,000 and $100,000, respectively.
Research and Development Expense
All research and development expenses that have no alternative future use are expensed as incurred. Research and development expenses consist primarily of payroll and benefits of those employees engaged in research, new process development activities, new product design and development activities, costs related to design tools, license expenses related to intellectual property, supplies and services, depreciation and other occupancy costs. The Company also expenses proto-type wafers and mask sets related to new products.
Net Income per Share
Basic net income is computed as net income divided by the weighted average number of common shares outstanding for the period. Diluted net income per share reflects the potential dilution that could occur from common shares issuable through stock options and the Employee Stock Purchase Plan.
Stock-based Compensation
The Company applies the fair value recognition provisions of stock-based compensation, and accordingly uses the prospective transition method, which requires the measurement and recognition of compensation expense for all stock-based payment awards made to employees and directors, including stock options, based on the estimated fair value of those awards at their grant date. The Company uses the Black-Scholes option-pricing model to determine the fair value of stock options, which requires various subjective assumptions including expected term, expected volatility and risk-free interest rates. The Company records this fair value as compensation expense on a straight-line basis over the period during which the employee or director is to perform services in connection with the award (generally over the vesting period of the award).
Income Taxes
Income taxes are accounted for under the asset and liability method. The Company makes certain estimates and judgments in determining income tax expense for financial statement purposes. These estimates and judgments occur in the calculation of certain deferred tax assets and liabilities, which arise from timing differences in the recognition of revenue and expense for tax and financial statement purposes. Such deferred income tax assets and liabilities are recognized for the future tax consequences attributable to differences between the financial statement carrying amounts of existing assets and liabilities and their respective tax base, operating losses and tax credit carry-forwards. Changes in tax rates affect the deferred income tax assets and liabilities and are recognized in the period in which the tax rates are enacted.
Management must determine the probability that the Company will be able to utilize deferred tax assets. If it determines that recovery is unlikely, then a valuation allowance against the deferred tax asset must be recorded by increasing income tax expense. As of April 2, 2011, the Company believes that the deferred tax assets recorded on its balance sheet will be utilized. However, should there be a change in the Company’s ability to utilize or recover its deferred tax assets, an additional income tax expense would be incurred in the period in which it was determined that the recovery is not probable.
51
SUPERTEX, INC.
NOTES TO CONSOLIDATED FINANCIAL STATEMENTS – (CONTINUED)
On February 20, 2009, California enacted tax-related economic incentives and tax increases which included an election to apply a single sales factor apportionment formula for most businesses starting in tax years beginning on or after January 1, 2011. As a result of the legislation during fiscal 2009, the Company revalued its California deferred tax assets expected to be realized.
The authoritative guidance on income taxes provides guidance on the financial statement recognition and measurement of a tax position taken or expected to be taken in a tax return, and clarifies the accounting for uncertainty in income taxes recognized in the financial statements. This authoritative guidance also provides guidance on derecognition, classification, interest and penalties, accounting in interim periods, disclosures, and transition. This authoritative guidance requires significant judgment in determining what constitutes an individual tax position as well as assessing the outcome of each tax position. Changes in judgment as to recognition or measurement of tax positions can materially affect the estimate of the effective tax rate, and consequently affect operating results. The reserve amount associated with this authoritative guidance was determined with considerable judgment and estimation, and is continuously monitored by management based on the best information available including changes in tax regulations, the outcome of relevant court cases, ongoing tax audits, and other information.
Advertising Costs
The Company expenses advertising and promotional costs as they are incurred. Advertising expense was immaterial for fiscal 2011, 2010 and 2009.
Fair Value of Financial Instrument
Carrying amounts of the Company's financial instruments including cash and cash equivalents, short-term and long-term investments, accounts receivable, accounts payable and accrued liabilities approximate fair value.
Comprehensive Income
Comprehensive income includes all changes in equity during a period from non-owner sources. Accumulated other comprehensive loss, as presented on the accompanying balance sheets, consists of unrealized gains and losses on available-for-sale securities, net of tax.
Reclassification
For presentation purposes, certain prior period amounts have been reclassified to conform to the reporting in the current period financial statements. These reclassifications do not affect the Company’s net income, as previously reported.
Recent Accounting Pronouncements
In April 2011, FASB issued new authoritative guidance regarding Fair Value Measurement: Amendments to Achieve Common Fair Value Measurement and Disclosure Requirements in U.S. GAAP and IFRSs. This amendment attempts to clarify the Board’s intent on the application of existing fair value measurement and disclosure requirements as well as change to a particular principle or requirement for measuring fair value and for disclosing information about fair value measurements. This amendment is effective for interim and annual periods after December 15, 2011. The company is currently assessing the potential effect to its Consolidated Financial Statements in applying this guidance, but do not expect it to have material effect.
2. Fair Value
The Company measures its cash equivalents, short-term investments and long-term investments at fair value. Fair value is defined as the price that would be received from selling an asset and paid to transfer a liability in an orderly transaction between market participants at the measurement date. When determining the fair value measurements for assets and liabilities required or permitted to be recorded at fair value, the Company considers the principal or most advantageous market in which it would transact and considers assumptions that market participants would use when pricing the asset or liability, such as inherent risk, transfer restrictions, and risk of nonperformance.
52
SUPERTEX, INC.
NOTES TO CONSOLIDATED FINANCIAL STATEMENTS – (CONTINUED)
A three-tiered fair value hierarchy is established as basis for considering the above assumptions and determining the inputs used in the valuation methodologies in measuring fair values. The three levels of inputs are defined as follows:
Level 1 – Unadjusted quoted market prices for identical assets or liabilities in active markets that the Company has the ability to access.
Level 2 – Quoted prices for similar assets or liabilities in active markets; quoted prices for identical or similar assets or liabilities in inactive markets.
Level 3 - Valuations based on models where significant inputs are not observable. The unobservable inputs reflect the Company’s own assumptions about the assumptions that market participants would use.
The Company maximizes the use of observable inputs and minimizes the use of unobservable inputs. If a financial instrument uses input that is significant to the fair value calculation, the instrument will be categorized based upon the lowest level of input that is significant to the fair value calculation. The Company’s financial assets and liabilities measured at fair value on a recurring basis include cash equivalents and investment securities, both short-term and long-term.
Included in the Company’s long-term investments are ARS, which are collateralized by student loans. Due to the lack of availability of observable market quotes for the Company’s investment portfolio of these ARS, the fair value was estimated based on a discounted cash flow model and included a discount factor for illiquidity of the ARS market. The assumptions used in the discounted cash flow model include estimates for interest rates, timing and amounts of cash flows, liquidity of the underlying security, expected holding periods and contractual terms of the security. In light of the current market condition for ARS, the Company developed different scenarios for the significant inputs used in the discounted cash flow model, including but not limited to liquidity discount of 150 basis points per year for the current ARS market, and the timing of recovery of the ARS market from three to six years. The estimated fair value of the Company’s ARS ranges from $29,300,000 to $30,800,000. The Company believes this estimated range of fair values of its ARS is appropriate taking into consideration historical ARS market data, the possibility of development of a secondary market for ARS, recent market participant behavior, and public policy implications associated with the student loan based ARS market. The Company concluded that the fair value of its ARS was $30,200,000 as of April 2, 2011, net of a temporary impairment of $2,550,000 to par value.
The Company also considered the quality, amount of collateral, and US government guarantee for the ARS and looked to other marketplace transactions and information received from other third party brokers in order to assess whether the fair value based on the discounted cash flow model was reasonable. The valuation of the Company’s investment portfolio is subject to uncertainties that are difficult to predict. Factors that may affect the Company’s valuation include changes to credit ratings of the securities as well as the underlying assets supporting those securities, rates of default of the underlying assets, underlying collateral values, discount rates, counterparty risk and ongoing strength and quality of market credit and liquidity. Significant inputs to the investment valuations are unobservable in the active markets and therefore the Company’s ARS are classified as Level 3 in the hierarchy.
53
SUPERTEX, INC.
NOTES TO CONSOLIDATED FINANCIAL STATEMENTS – (CONTINUED)
The following tables summarize assets and liabilities measured at fair value as of April 2, 2011 and April 3, 2010, excluding accrued interest (in thousands):
|
April 2, 2011
|
||||||||||||||||
|
Fair value measurements
|
||||||||||||||||
|
Assets
|
Level 1
|
Level 2
|
Level 3
|
Total
|
||||||||||||
|
Money market funds
|
$ | 10,681 | (1) | $ | - | $ | - | $ | 10,681 | |||||||
|
Municipal bonds
|
- | 62,768 | (2) | - | 62,768 | |||||||||||
|
Discount notes
|
- | 3,998 | - | 3,998 | ||||||||||||
|
Corporate bonds
|
- | 28,177 | (3) | - | 28,177 | |||||||||||
|
Government agency bonds
|
- | 10,816 | (4) | - | 10,816 | |||||||||||
|
Certificate of deposits
|
- | 748 | - | 748 | ||||||||||||
|
Equity mutual funds related to NQDCP
|
8,157 | - | - | 8,157 | ||||||||||||
|
Long-term investments in ARS
|
- | - | 30,200 | 30,200 | ||||||||||||
|
Total assets at fair value
|
$ | 18,838 | $ | 106,507 | $ | 30,200 | $ | 155,545 | ||||||||
|
Liabilities
|
||||||||||||||||
|
Obligation related to NQDCP
|
$ | 8,157 | $ | - | $ | - | $ | 8,157 | ||||||||
|
|
_________________________
|
(1) The money market funds of $10,681,000 were classified as cash equivalents as of April 2, 2011.
(2) Included in municipal bonds was $151,000, which was classified as a cash equivalent as of April 2, 2011.
(3) Included in corporate bonds was $253,000, which was classified as a cash equivalent as of April 2, 2011.
(4) Included in government agency bonds was $4,500,000, which was classified as a cash equivalent as of April 2, 2011.
|
April 3, 2010
|
||||||||||||||||
|
Fair value measurements
|
||||||||||||||||
|
Assets
|
Level 1
|
Level 2
|
Level 3
|
Total
|
||||||||||||
|
Money market funds
|
$ | 7,341 | $ | - | $ | - | $ | 7,341 | ||||||||
|
Municipal bonds
|
- | 69,390 | - | 69,390 | ||||||||||||
|
Equity mutual funds related to NQDCP
|
7,470 | - | - | 7,470 | ||||||||||||
|
Long-term investments in ARS
|
- | - | 65,000 | 65,000 | ||||||||||||
|
Total assets at fair value
|
$ | 14,811 | $ | 69,390 | $ | 65,000 | $ | 149,201 | ||||||||
|
Liabilities
|
||||||||||||||||
|
Obligation related to NQDCP
|
$ | 7,470 | $ | - | $ | - | $ | 7,470 | ||||||||
The following table summarizes the change in fair value of the Company’s level 3 assets during the fiscal year ended April 2, 2011 (in thousands):
|
Fair value measurements of assets using level 3 inputs
|
Long-term investments in ARS
|
|||
|
Beginning balance at April 3, 2010
|
$ | 65,000 | ||
|
Redemption of investments in ARS
|
(36,450 | ) | ||
|
Unrealized loss reversed in "Accumulated other comprehensive loss"
|
1,650 | |||
|
Ending balance at April 2, 2011
|
$ | 30,200 | ||
During the fiscal year ended April 2, 2011, the Company received $36,450,000 relating to ARS redeemed at par value.
54
SUPERTEX, INC.
NOTES TO CONSOLIDATED FINANCIAL STATEMENTS – (CONTINUED)
3. CASH AND CASH EQUIVALENTS AND INVESTMENTS
The Company’s cash and cash equivalents as of April 2, 2011, and April 3, 2010 are as follows (in thousands):
|
April 2, 2011
|
April 3, 2010
|
|||||||
|
Cash
|
$ | 8,377 | $ | 2,812 | ||||
|
Cash equivalents:
|
||||||||
|
Money market funds
|
10,681 | 7,341 | ||||||
|
Government agency Bonds
|
4,500 | - | ||||||
|
Corporate bonds
|
253 | - | ||||||
|
Municipal bonds
|
151 | - | ||||||
|
Total cash and cash equivalents
|
$ | 23,962 | $ | 10,153 | ||||
The Company’s portfolio of short-term and long-term investments as of April 2, 2011, and April 3, 2010, is as follows (in thousands):
|
April 2, 2011
|
||||||||||||||||
|
Amortized
|
Unrealized
|
Unrealized
|
Carrying
|
|||||||||||||
|
Cost
|
Gain
|
Loss
|
Value
|
|||||||||||||
|
Short-term investments:
|
||||||||||||||||
|
Trading securities:
|
$ | 8,157 | $ | - | $ | - | $ | 8,157 | ||||||||
|
Available-for-sale securities:
|
||||||||||||||||
|
Municipal bonds
|
62,617 | 2 | (2 | ) | 62,617 | |||||||||||
|
Discount notes
|
3,998 | - | - | 3,998 | ||||||||||||
|
Corporate bonds
|
27,968 | - | (44 | ) | 27,924 | |||||||||||
|
Government agency bonds
|
6,317 | - | (1 | ) | 6,316 | |||||||||||
|
Certificates of deposits
|
749 | - | (1 | ) | 748 | |||||||||||
|
Total short-term investments
|
$ | 109,806 | $ | 2 | $ | (48 | ) | $ | 109,760 | |||||||
|
Long-term investments:
|
||||||||||||||||
|
Available-for sale securities
|
$ | 32,750 | $ | - | $ | (2,550 | ) | $ | 30,200 | |||||||
|
April 3, 2010
|
||||||||||||||||
|
Amortized
|
Unrealized
|
Unrealized
|
Carrying
|
|||||||||||||
|
Cost
|
Gain
|
Loss
|
Value
|
|||||||||||||
|
Short-term investments:
|
||||||||||||||||
|
Trading securities:
|
$ | 7,470 | $ | - | $ | - | $ | 7,470 | ||||||||
|
Available-for-sale securities:
|
||||||||||||||||
|
Municipal bonds
|
69,393 | - | (3 | ) | 69,390 | |||||||||||
|
Total short-term investments
|
$ | 76,863 | $ | - | $ | (3 | ) | $ | 76,860 | |||||||
|
Long-term investments:
|
||||||||||||||||
|
Available-for sale securities
|
$ | 69,200 | $ | - | $ | (4,200 | ) | $ | 65,000 | |||||||
55
SUPERTEX, INC.
NOTES TO CONSOLIDATED FINANCIAL STATEMENTS – (CONTINUED)
The Company’s short-term and long-term investments by contractual maturities are as follows (in thousands):
|
April 2, 2011
|
April 3, 2010
|
|||||||
|
Short-term investment:
|
||||||||
|
Trading securities:
|
||||||||
|
Due in one year or less
|
$ | 8,157 | $ | 7,470 | ||||
|
Available-for-sale securities:
|
||||||||
|
Due in one year or less
|
62,919 | 69,390 | ||||||
|
Due in one to two years
|
38,684 | - | ||||||
|
Total short-term investments
|
$ | 109,760 | $ | 76,860 | ||||
|
Long-term investment:
|
||||||||
|
Available-for-sale securities at amortized cost:
|
||||||||
|
Due after ten years
|
$ | 30,200 | $ | 65,000 | ||||
|
Total long-term investments
|
$ | 30,200 | $ | 65,000 | ||||
Short-term investments classified as trading securities for fiscal years 2011 and 2010 consisted entirely of investments in mutual funds held by the NQDCP. Unrealized gain to trading securities was $689,000 for the fiscal year ended April 2, 2011, compared to $1,607,000 for the fiscal year ended April 3, 2010.
The Company’s available-for-sale portfolio in fiscal 2011 was comprised of municipal bonds, corporate bonds, ARS, government agency bonds, discount notes and certificates of deposits.
During the fiscal year ended April 2, 2011, the Company disposed of short-term available-for-sale securities totaling $142,098,000 at par. During the fiscal years ended April 3, 2010 and March 28, 2009, the Company disposed of short-term available-for-sale securities totaling $44,278,000 and $6,065,000, respectively. The realized gains and losses of these transactions were immaterial.
Historically, given the liquidity created by auctions, the Company’s ARS were presented as current assets under short-term investments on the Company’s balance sheet. However, since the fourth quarter of fiscal 2008 the ARS held by the Company have experienced failed auctions due to sales orders exceeding purchase orders, so the Company’s ARS are considered illiquid until there is a successful auction for them. Accordingly, ARS with a par value of $32,750,000 and $69,200,000 were classified as non-current assets and were presented in long-term investments at fair value of $30,200,000 and $65,000,000, respectively, on the Company’s balance sheet as of April 2, 2011 and April 3, 2010.
The ARS are investments with contractual maturities generally between 14 to 30 years. They are in the form of auction rate bonds, whose interest rates had historically been reset every seven to thirty-five days through an auction process. At the end of each reset period, investors could sell or continue to hold the securities at par. These ARS held by the Company are primarily backed by pools of student loans and are guaranteed by the United States Department of Education. In addition, all the ARS held by the Company are rated by the major independent rating agencies as either AAA or Aaa.
As of April 2, 2011, all of the Company’s long-term investment securities were reported at fair value. Due to the lack of availability of observable market quotes on the Company’s investment portfolio of ARS, the fair value was estimated based on a discounted cash flow model. The assumptions used in the discounted cash flow model include estimates for interest rates, timing and amounts of cash flows, liquidity of the underlying security, expected holding periods, and contractual terms of the security.
The Company concluded that the decline in the fair value of ARS investments as of April 2, 2011, was not other than temporary in part due to the following:
56
SUPERTEX, INC.
NOTES TO CONSOLIDATED FINANCIAL STATEMENTS – (CONTINUED)
|
·
|
the decline in market value is due to unusual general market conditions;
|
|
·
|
these investments are of high credit quality and a significant portion of them are collaterized and are guaranteed by the US Department of Education;
|
|
·
|
as of April 2, 2011, there have been no defaults on the ARS held by the Company;
|
|
·
|
their AAA or Aaa credit ratings have not been reduced as of April 2, 2011;
|
|
·
|
the Company has the intent and ability to hold these investments until the anticipated recovery in market value occurs; and
|
|
·
|
recently, some ARS were redeemed at par value. The Company received redemptions of $12,150,000 and $19,250,000 at par value in fiscal 2009 and 2010, respectively. During fiscal 2011 the Company received seven payments totaling $36,450,000 comprising redemptions of ARS at par value.
|
If uncertainties in the credit and capital markets continue or these markets deteriorate further, the Company may incur additional impairments to its ARS holdings. The Company will continue to monitor its ARS holdings and may be required to record an impairment charge through the income statement if the decline in fair value is determined to be other-than-temporary or the credit ratings of its ARS holdings decline.
4. ACCOUNTS RECEIVABLE, NET (in thousands):
|
April 2, 2011
|
April 3, 2010
|
|||||||
|
Accounts receivable
|
$ | 8,581 | $ | 11,245 | ||||
|
Less: Allowance for doubtful accounts and sales returns
|
(481 | ) | (459 | ) | ||||
|
Total trade accounts receivable, net
|
$ | 8,100 | $ | 10,786 | ||||
Allowances for doubtful accounts related to trade accounts receivable are (in thousands):
|
Description
|
Balance at Beginning of Period
|
Additions Charged to Expense
|
Deductions and Other(1)
|
Balance at End of Period
|
||||||||||||
|
Twelve months ended April 2, 2011
|
$ | 242 | $ | 5 | $ | - | $ | 247 | ||||||||
|
Twelve months ended April 3, 2010
|
$ | 495 | $ | 57 | $ | (310 | ) | $ | 242 | |||||||
|
Twelve months ended March 28, 2009
|
$ | 595 | $ | (100 | ) | $ | - | $ | 495 | |||||||
_________________________
(1) Write-offs of doubtful accounts.
During the fiscal year ended March 28, 2009, the Company recorded an allowance for doubtful accounts of $110,000 related to other receivables included in the prepaid expense and other current assets. As of April 2, 2011, the allowance for doubtful accounts related to other receivable amounted to $51,000.
Allowances for sales returns are (in thousands):
|
Description
|
Balance at Beginning of Period
|
Additions Charged to Revenue
|
Deductions and Other(1)
|
Balance at End of Period
|
||||||||||||
|
Twelve months ended April 2, 2011
|
$ | 217 | $ | 556 | $ | (539 | ) | $ | 234 | |||||||
|
Twelve months ended April 3, 2010
|
$ | 266 | $ | 454 | $ | (503 | ) | $ | 217 | |||||||
|
Twelve months ended March 28, 2009
|
$ | 483 | $ | 636 | $ | (853 | ) | $ | 266 | |||||||
________________________
(1) Represents amounts charged to the allowance for sales returns.
57
SUPERTEX, INC.
NOTES TO CONSOLIDATED FINANCIAL STATEMENTS – (CONTINUED)
The Company sells its products to OEMs through its direct sales and marketing personnel, and through its independent sales representative and distributors. Sales to distributors and related cost of sales are recognized upon resale to their end customers.
The Company has estimated that its OEM customer, General Electric Company, accounted for 12%, 11%, and 13% of its net sales from both direct and indirect channels (“combined sales”) for fiscal 2011, 2010, and 2009, respectively. The combined sales to another OEM customer, Samsung Electronics, accounted for 14% of the Company’s net sales in fiscal 2010. No other direct or indirect customers accounted for more than 10% of net sales in fiscal 2011, 2010 and 2009.
5. INVENTORIES (in thousands):
|
April 2, 2011
|
April 3, 2010
|
|||||||
|
Raw materials
|
$ | 1,786 | $ | 1,221 | ||||
|
Work-in-process
|
12,880 | 9,978 | ||||||
|
Finished goods
|
4,347 | 2,229 | ||||||
|
Finished goods at distributors and on consignment
|
1,587 | 2,022 | ||||||
|
Total Inventories
|
$ | 20,600 | $ | 15,450 | ||||
The Company wrote down inventory totaling $2,859,000, $3,448,000 and $2,322,000 for fiscal years 2011, 2010 and 2009, respectively. The Company sold previously written down inventory of $1,358,000, $1,645,000 and $1,372,000 for fiscal 2011, 2010 and 2009, respectively.
6. PROPERTY, PLANT AND EQUIPMENT (in thousands):
|
April 2, 2011
|
April 3, 2010
|
|||||||
|
Land
|
$ | 825 | $ | 825 | ||||
|
Machinery and equipment
|
38,171 | 37,223 | ||||||
|
Leasehold improvements
|
3,044 | 2,994 | ||||||
|
Building
|
2,563 | 2,563 | ||||||
|
Furniture and fixtures
|
339 | 332 | ||||||
| 44,942 | 43,937 | |||||||
|
Less accumulated depreciation and amortization
|
(39,234 | ) | (37,146 | ) | ||||
|
Property, plant and equipment, net
|
$ | 5,708 | $ | 6,791 | ||||
During the quarter and year ended April 3, 2010, the Company identified an error in its prior periods totaling $235,000 related to accumulated depreciation. As a result, the accumulated depreciation expense for the years ended April 1, 2006 through April 3, 2010 was understated by $235,000. The Company assessed the materiality of this error on the prior periods and concluded that such error was not material to those periods. The Company also concluded that the out of period correction of this error, which resulted in a $235,000 increase in depreciation expense for the year ended April 3, 2010, was not material to such period.
7. PRODUCT RETURN AND WARRANTY RESERVES
The Company’s standard policy is to accept the return of defective parts for credit from non-distributor customers for a period of 90 days from date of shipment. This period may be extended in certain cases. The Company records estimated product returns as a reduction to revenue in the same period as the related revenues are recorded. These estimates are based on historical experience, analysis of outstanding return material authorizations, and allowance authorization data. See Note 4 to the Consolidated Financial Statements for the reductions to revenue for estimated product returns for the fiscal years 2011, 2010 and 2009.
58
SUPERTEX, INC.
NOTES TO CONSOLIDATED FINANCIAL STATEMENTS – (CONTINUED)
For sales through distributors, the Company's policy is to replace under warranty defective products at its own expense for a period of 90 days from date of shipment. This period may be extended in certain cases. This liability is limited to replacement of the product and freight and delivery costs. In certain cases, the Company may pay for rework.
The Company reserves for estimated warranty costs in the same period as the related revenues are recorded. The estimate is based on historical expenses. The warranty reserves were $48,000 and $100,000, respectively, as of April 2, 2011 and April 3, 2010.
8. INCOME TAXES
The domestic and foreign components of income before income taxes are (in thousands):
|
Fiscal Years Ended
|
||||||||||||
|
April 2, 2011
|
April 3, 2010
|
March 28, 2009
|
||||||||||
|
United States
|
$ | 15,663 | $ | 4,690 | $ | 11,852 | ||||||
|
Foreign
|
2,117 | 1,686 | 3,914 | |||||||||
|
Income before provision for income taxes
|
$ | 17,780 | $ | 6,376 | $ | 15,766 | ||||||
During the quarter ended October 2, 2010, the Company identified the inclusion of certain R&D expenses in the calculation of the R&D tax credit which were not in compliance with IRS regulations. As a result, the income tax expense for the quarter ended December 26, 2009 and year ended April 3, 2010 was understated by $217,000. This amount was corrected in the three months ended October 2, 2010. The Company assessed the materiality of this adjustment on the prior periods and concluded that it was not material to those periods. The Company also concluded that the out of period adjustment, which resulted in a $217,000 increase in tax expense for the fiscal year ended April 2, 2011, was not material to such period.
The components of the provision for income taxes are as follows (in thousands):
|
Fiscal Years Ended
|
||||||||||||
|
April 2, 2011
|
April 3, 2010
|
March 28, 2009
|
||||||||||
|
Current:
|
|
|||||||||||
|
Federal
|
$ | 4,416 | $ | 2,091 | $ | 383 | ||||||
|
State
|
(33 | ) | 15 | 938 | ||||||||
|
Non-US
|
716 | 76 | 883 | |||||||||
| 5,099 | 2,182 | 2,204 | ||||||||||
|
Deferred:
|
||||||||||||
|
Federal
|
(593 | ) | (882 | ) | 927 | |||||||
|
State
|
998 | 6 | 132 | |||||||||
|
Non-US
|
(6 | ) | (55 | ) | (42 | ) | ||||||
| 399 | (931 | ) | 1,017 | |||||||||
|
Total provision for income taxes
|
$ | 5,498 | $ | 1,251 | $ | 3,221 | ||||||
59
SUPERTEX, INC.
NOTES TO CONSOLIDATED FINANCIAL STATEMENTS – (CONTINUED)
The provision for income taxes differs from the amount computed by applying the statutory federal income tax rate to income before provision for income taxes as follows:
|
Fiscal Years Ended
|
||||||||||||
|
April 2, 2011
|
April 3, 2010
|
March 28, 2009
|
||||||||||
|
Tax provision at US statutory rates
|
35 | % | 35 | % | 35 | % | ||||||
|
State tax provision, net of Federal benefits
|
7 | 3 | 4 | |||||||||
|
Tax credits
|
(3 | ) | (12 | ) | (4 | ) | ||||||
|
Domestic production activity deduction
|
(5 | ) | (1 | ) | (3 | ) | ||||||
|
Foreign earnings tax differential
|
- | (1 | ) | (3 | ) | |||||||
|
Tax exempt investment income
|
(1 | ) | (5 | ) | (6 | ) | ||||||
|
Stock based compensation
|
- | 4 | 1 | |||||||||
|
IRS settlement
|
- | - | (2 | ) | ||||||||
|
Other
|
(2 | ) | (3 | ) | (2 | ) | ||||||
|
Effective income tax rate
|
31 | % | 20 | % | 20 | % | ||||||
Significant components of deferred tax assets are as follows (in thousands):
|
Fiscal Years Ended
|
||||||||
|
Deferred tax assets:
|
April 2, 2011
|
April 3, 2010
|
||||||
|
Inventory write downs
|
$ | 2,928 | $ | 3,431 | ||||
|
Temporary investment impairment
|
941 | 1,632 | ||||||
|
Accrued liabilities
|
2,946 | 3,028 | ||||||
|
Depreciation and amortization
|
624 | 850 | ||||||
|
Stock compensation
|
2,606 | 1,920 | ||||||
|
Deferred revenue on shipments to distributors
|
593 | 656 | ||||||
|
Allowances for doubtful accounts and sales returns
|
145 | 169 | ||||||
|
Capital Loss
|
- | 282 | ||||||
|
Accrued employee benefits
|
876 | 878 | ||||||
|
Other
|
973 | 1,386 | ||||||
|
Gross deferred tax assets
|
12,632 | 14,232 | ||||||
|
Valuation allowance
|
(424 | ) | (816 | ) | ||||
|
Net deferred tax assets
|
$ | 12,208 | $ | 13,416 | ||||
Deferred income taxes reflect the net effects of temporary differences between the carrying amounts of assets and liabilities for financial reporting purposes and the amounts used for income tax purposes. Management has concluded that it is more likely than not the Company will realize the benefit of its net deferred tax assets. Management reached this conclusion based on its current expectations of future income. Therefore, the amount of the deferred tax asset that is realizable could be reduced in the near term if actual results differ significantly from estimates of future taxable income.
60
SUPERTEX, INC.
NOTES TO CONSOLIDATED FINANCIAL STATEMENTS – (CONTINUED)
Changes in valuation allowance for the fiscal years ended April 2, 2011, April 3, 2010, and March 28, 2009 are as follows:
|
Description
|
Balance at Beginning of Period
|
Charge(1)
|
Deductions and Other
|
Balance at End of Period
|
||||||||||||
|
Twelve months ended April 2, 2011
|
$ | 816 | $ | 1,161 | $ | (1,553 | ) | $ | 424 | |||||||
|
Twelve months ended April 3, 2010
|
$ | 283 | $ | 534 | $ | (1 | ) | $ | 816 | |||||||
|
Twelve months ended March 28, 2009
|
$ | 283 | $ | - | $ | - | $ | 283 | ||||||||
_________________________
|
(1)
|
A valuation allowance was placed on the Company’s California deferred tax assets.
|
Management’s intent is to indefinitely reinvest any undistributed earnings from its Hong Kong subsidiary. Accordingly no provision for Federal and state income taxes has been provided thereon, nor is it practical to determine the amount of this liability. Upon distribution of those earnings in the form of dividends or otherwise, the Company will be subject to United States income taxes.
Tax benefits of $13,000 in fiscal year 2011, $63,000 in fiscal year 2010 and $149,000 in fiscal year 2009 associated with the exercise of stock options were recognized in shareholders’ equity.
During the year ended April 2, 2011, the liability for uncertain tax positions less accrued interest and penalties decreased from $4,142,000 to $4,052,000. Of the total $4,052,000 of unrecognized tax benefits, $3,083,000 represents the amount that if recognized, would favorably affect the effective income tax rate in any future periods. The Company cannot conclude on the range of cash payments that will be made within the next twelve months associated with its uncertain tax positions.
A reconciliation of the March 28, 2009 through April 2, 2011 amount of unrecognized tax benefits (“UTB”) is as follows (in thousands):
|
Fiscal Years Ended
|
||||||||||||
|
April 2, 2011
|
April 3, 2010
|
March 28, 2009
|
||||||||||
|
Beginning balance
|
$ | 4,142 | $ | 4,219 | $ | 3,941 | ||||||
|
Increases (decreases) of unrecognized tax benefits related to prior years' UTB
|
141 | (90 | ) | 634 | ||||||||
|
Increases (decreases) of unrecognized tax benefits related to current year's UTB
|
481 | 387 | 803 | |||||||||
|
Increases (decreases) of unrecognized tax benefits related to settlements
|
- | - | (648 | ) | ||||||||
|
Reductions to unrecognized tax benefits related to lapsing statute of limitations
|
(712 | ) | (374 | ) | (511 | ) | ||||||
|
Ending balance
|
$ | 4,052 | $ | 4,142 | $ | 4,219 | ||||||
The Company records interest and penalties related to unrecognized tax benefits in income tax expense. For the year ended April 2, 2011, the Company recorded estimated interest of $131,000 and estimated penalties of $21,000, which accumulated to balances of $512,000 for estimated interest and $410,000 for estimated penalties related to uncertain tax positions.
The liability for uncertain tax positions, including accrued interest and accrued penalties as of April 2, 2011 was $1,858,000 related to tax positions for which it is reasonably possible that the statute of limitations will expire in various jurisdictions within the next twelve months.
The Company and its subsidiaries are subject to taxation in various jurisdictions, including federal, state and foreign. The Company’s federal and state income tax returns are generally not subject to examination by taxing authorities for fiscal years before 2002.
61
SUPERTEX, INC.
NOTES TO CONSOLIDATED FINANCIAL STATEMENTS – (CONTINUED)
9. COMPREHENSIVE INCOME
Components of the Company’s comprehensive income for the fiscal years ended April 2, 2011, April 3, 2010 and March 28, 2009, respectively, are as follows (in thousands):
|
April 2, 2011
|
April 3, 2010
|
March 28, 2009
|
||||||||||
|
Net income
|
$ | 12,282 | $ | 5,125 | $ | 12,545 | ||||||
|
Unrealized gain (loss) on available-for-sale investments
|
1,607 | 4,791 | (4,925 | ) | ||||||||
|
Deferred income taxes
|
(724 | ) | (1,863 | ) | 3,500 | (1) | ||||||
|
Comprehensive income
|
$ | 13,165 | $ | 8,053 | $ | 11,120 | ||||||
________________________________
|
(1)
|
Included in the $3,500,000 recorded in the fiscal 2009 was the deferred income taxes of $1,587,000 the Company booked in the third quarter of fiscal 2009 to correct an error related to fiscal 2008.
|
As of April 2, 2011, the total unrealized loss on available-for-sale investments amounted to $2,596,000, which was recorded in accumulated other comprehensive loss, net of tax of $913,000. As of April 3, 2010, the total unrealized loss on available-for-sale investments amounted to $4,203,000, which was recorded in accumulated other comprehensive loss, net of tax of $1,637,000. As of March 28, 2009, the total unrealized loss on available-for-sale investments was $8,994,000, which was recorded in accumulated other comprehensive loss, net of tax of $3,500,000.
10. COMMON STOCK REPURCHASES
Share repurchase activities were as follows:
|
Fiscal Years Ended
|
||||||||||||
|
April 2, 2011
|
April 3, 2010
|
March 28, 2009
|
||||||||||
|
Number of shares repurchased
|
273,000 | - | - | |||||||||
|
Cost of shares repurchased
|
$ | 6,267,000 | $ | - | $ | - | ||||||
|
Average price per share
|
$ | 22,97 | $ | - | $ | - | ||||||
In January 2011, the Board of Directors designated $60,000,000 of our cash, cash equivalents and investments for a major stock repurchase during the next twelve to twenty-four months and accordingly increased the Company’s share repurchase program from approximately 556,000 shares to 2,500,000 shares. The amended repurchase program has no expiration date except, unless extended, when an aggregate of 2,500,000 shares have been repurchased, either on the open market or through private transactions.
Since the inception of these repurchase programs in 1992 through April 2, 2011, the Company has repurchased a total of approximately 2,617,000 shares of the common stock for an aggregate cost of $42,818,000. Upon their repurchase, shares are restored to the status of authorized but unissued shares. As of April 2, 2011, there were approximately 2,227,000 shares authorized for future repurchase under the Company’s current program.
11. EMPLOYEE BENEFIT PLANS
Profit Sharing Plan - The Company has a discretionary profit sharing plan for the benefit of eligible employees. Related expenses were $1,672,000, $627,000 and $1,259,000, in fiscal 2011, 2010 and 2009, respectively.
62
SUPERTEX, INC.
NOTES TO CONSOLIDATED FINANCIAL STATEMENTS – (CONTINUED)
Savings and Retirement Plan - The Supertex 401K Savings and Retirement Plan allows for employee savings intended to qualify under the provisions of Section 401 of the Internal Revenue Code (IRC). Employees having at least three months of service may make pretax contributions of up to the IRC maximum allowable amount of their qualified compensation. The Company matches certain percentages of employee contributions, all of which are 100% vested. In fiscal years 2011, 2010 and 2009, the Company's matching contributions were $179,000, $173,000 and $212,000, respectively.
Deferred Compensation Plan - The Non-Qualified Deferred Compensation Plan (the “NQDCP”) is a plan that covers a select group of senior management or highly compensated employees of the Company. The NQDCP was adopted by the Company, effective January 1, 1996. The Plan assets as of April 2, 2011 of $8,157,000 are included in short-term investments in the Company's consolidated balance sheet and classified as trading securities. Such assets shall at all times be subject to claims of the general creditors of the Company. The Company’s liability for this plan as of April 2, 2011 amounts to $8,157,000 and this amount is included in accrued salaries and employee benefits in the Company’s consolidated balance sheet. The Company does not make matching or other contributions to the Plan.
NQDCP obligations are based on the fair value of the underlying assets owed to participants as stipulated by the NQDCP and are included in accrued liabilities in the consolidated financial statements. The Executive Compensation Committee is responsible for the general administration and interpretation of the NQDCP and for carrying out its provisions.
Employee Stock Purchase Plan - The shareholders of the Company approved the adoption of the 2000 Employee Stock Purchase Plan (the “ESPP”) and the reservation of shares of common stock for issuance under this Plan at the August 18, 2000 annual shareholders meeting. The maximum aggregate number of shares of common stock available for purchase under the ESPP is 500,000 plus an annual increase on the first day of the Company’s fiscal year of the lesser of 100,000 shares or three percent (3%) of the outstanding shares on that date or a lesser amount determined by the Board of Directors. During fiscal 2011, the Board of Directors did not grant an annual increase on the maximum aggregate number of shares of common stock available for purchase under the ESPP. Eligible employees may elect to withhold up to 20% of their cash compensation to purchase shares of the Company’s common stock at a price equal to 95% of the market value of the stock at the ending of a six-month offering period. An eligible employee may purchase no more than 500 shares of common stock during any six-month accumulation period.
For fiscal year 2011 there were 7,422 shares of the Company’s common stock that were issued under the ESPP compared to 6,504 shares and 7,738 shares of common stock issued in fiscal 2010 and 2009 respectively. There are 204,928 shares available for future issuance under the ESPP at the end of fiscal year 2011.
Stock Option Plans - The Company’s shareholders approved the adoption of the 2001 Stock Option Plan (the “2001 Plan”) and the reservation of 2,000,000 shares of common stock for issuance under 2001 Plan at the August 17, 2001 annual meeting of shareholders. Options granted under the 2001 Plan were granted at the fair market value of the Company's common stock on the date of grant and generally expired seven years from the date of grant or thirty days after termination of service, whichever occurs first. The options generally vest over five years, 20% on the date one year after their vesting start date and 20% at the end of each of the following four years. On August 24, 2006, the Company’s board of directors approved a change in grant policy of the 2001 Plan to only grant non-statutory stock options to better align the Company’s compensation plan to employee incentives and to Company objectives. On August 17, 2007, the Company’s board of directors approved that all future stock option grants would have a ten-year term, which is within the guidelines of the Company’s 2001 Plan, subject to earlier expiration thirty days after termination of service. No further options may be granted under the 2001 Plan due to the adoption of the new equity incentive plan as described in the following paragraph.
63
SUPERTEX, INC.
NOTES TO CONSOLIDATED FINANCIAL STATEMENTS – (CONTINUED)
The Company’s shareholders approved the adoption of the 2009 Equity Incentive Plan (the “2009 Plan”) at the August 14, 2009 annual meeting for shareholders. Under the 2009 Plan, the total number of shares of Company common stock reserved for issuance consists of 1,000,000 shares plus (1) the 159,509 shares which remained authorized for issuance under the 2001 Plan but which were not subject to outstanding stock awards as of August 14, 2009, and (2) those of the 1,440,400 shares subject to stock awards outstanding under the 2001 Plan as of August 14, 2009, that terminate prior to exercise and would otherwise be returned to the share reserves under the 2001 Plan, with the total shares in addition to the 1,000,000 shares thus being up to a maximum of 1,599,909 shares. The 2009 Plan allows the Company to continue its prior option practices under the 2001 Plan to grant non-statutory options to key employees with an exercise price equal to the fair market value of the Company’s stock on the date of grant. The Company’s options typically have a term of ten years and vest over five years, 20% on the date one year after their vesting start date and 20% at the end of each of the following four years. The 2009 Plan also provides the Company with the flexibility in designing equity incentives, including restricted stock awards, stock appreciation rights, restricted stock unit awards, performance stock awards, and performance cash awards.
Activities under the 2001 and 2009 Plans are as follows:
|
|
Options Outstanding
|
||||||||||||||||||
|
Available For Grant
|
Shares
|
Price Per Share
|
Weighted Average Exercise Price per share
|
||||||||||||||||
|
Balance, March 29, 2008
|
642,579 | 1,022,365 | $ | 11.30 | - | $ | 46.92 | $ | 29.35 | ||||||||||
|
Granted
|
(597,500 | ) | 597,500 | 20.85 | - | 29.70 | 23.13 | ||||||||||||
|
Exercised
|
- | (37,000 | ) | 11.30 | - | 21.75 | 16.39 | ||||||||||||
|
Canceled
|
115,030 | (115,030 | ) | 15.67 | - | 46.92 | 31.95 | ||||||||||||
|
Balance, March 28, 2009
|
160,109 | 1,467,835 | 11.30 | - | 46.92 | 26.94 | |||||||||||||
|
Authorized
|
1,000,000 | - | |||||||||||||||||
|
Granted
|
(59,000 | ) | 59,000 | 23.91 | - | 25.84 | 25.07 | ||||||||||||
|
Exercised
|
- | (65,713 | ) | 11.30 | - | 25.30 | 16.13 | ||||||||||||
|
Canceled
|
16,180 | (16,180 | ) | 20.86 | - | 41.05 | 30.84 | ||||||||||||
|
Balance, April 3, 2010
|
1,117,289 | 1,444,942 | 15.67 | - | 46.92 | 27.31 | |||||||||||||
|
Granted
|
(285,040 | ) | 285,040 | 22.01 | - | 27.23 | 23.63 | ||||||||||||
|
Exercised
|
- | (129,760 | ) | 15.67 | - | 25.30 | 18.15 | ||||||||||||
|
Canceled
|
145,600 | (145,600 | ) | 20.85 | - | 41.05 | 25.75 | ||||||||||||
|
Balance, April 2, 2011
|
977,849 | 1,454,622 | $ | 15.67 | - | $ | 46.92 | $ | 27.57 | ||||||||||
As of April 2, 2011, options outstanding and options exercisable under the 2001 Option Plan had a total intrinsic value of $1,017,000 and $711,000, respectively, and options outstanding and options exercisable under the 2009 Plan had a total intrinsic value of $28,000 and $1,000, respectively.
64
SUPERTEX, INC.
NOTES TO CONSOLIDATED FINANCIAL STATEMENTS – (CONTINUED)
The options outstanding and currently exercisable by exercise price under the 2001 and the 2009 Plans as of April 2, 2011 are as follows:
|
Options Outstanding
|
Options Exercisable
|
||||||||||||||||||||||||
|
Range of Exercise Prices
|
Number Outstanding
|
Weighted-Average Remaining Contractual Life (Years)
|
Weighted-Average Exercise Price
|
Number Exercisable
|
Weighted-Average Exercise Price
|
||||||||||||||||||||
| $ | 15.67 | - | $ | 19.99 | 94,320 | 0.59 | $ | 17.16 | 94,320 | $ | 17.16 | ||||||||||||||
| 20.00 | - | 24.99 | 536,122 | 8.08 | 21.35 | 167,442 | 20.96 | ||||||||||||||||||
| 25.00 | - | 29.99 | 328,320 | 7.48 | 27.00 | 109,320 | 27.23 | ||||||||||||||||||
| 30.00 | - | 34.99 | 241,660 | 3.63 | 33.77 | 204,860 | 33.74 | ||||||||||||||||||
| 35.00 | - | 39.99 | 97,900 | 5.98 | 35.84 | 64,180 | 35.83 | ||||||||||||||||||
| 40.00 | - | 44.99 | 138,300 | 2.54 | 40.91 | 112,060 | 40.92 | ||||||||||||||||||
| 45.00 | - | 46.92 | 18,000 | 2.67 | 46.92 | 14,400 | 46.92 | ||||||||||||||||||
| $ | 15.67 | - | $ | 46.92 | 1,454,622 | 5.98 | $ | 27.57 | 766,582 | $ | 29.45 | ||||||||||||||
The weighted average fair value of options granted during fiscal 2011, 2010 and 2009 was $10.14, $11.50, and $11.61 per share, respectively. All options were granted at the closing trading price of the Company's common stock on the date prior to the date of grant. The total intrinsic value of options exercised during the fiscal year ended April 2, 2011 was $852,000, compared to $663,000 and $1,330,000 for the fiscal years ended April 3, 2010 and March 28, 2009, respectively.
The stock-based compensation expense for the fiscal year ended April 2, 2011, April 3, 2010, and March 28, 2009 is as follows (in thousands, except per share data):
|
Fiscal Years Ended
|
||||||||||||
|
April 2, 2011
|
April 3, 2010
|
March 28, 2009
|
||||||||||
|
Cost of sales
|
$ | 676 | $ | 697 | $ | 558 | ||||||
|
Research and development expenses
|
1,394 | 1,640 | 1,236 | |||||||||
|
Selling, general and administrative expenses
|
1,029 | 1,133 | 967 | |||||||||
|
Total stock-based compensation expense
|
$ | 3,099 | $ | 3,470 | $ | 2,761 | ||||||
During the fiscal year ended April 2, 2011, the Company granted 285,040 options with an estimated total grant date fair value of $2,891,000. During the fiscal year ended April 3, 2010, the Company granted 59,000 options with an estimated total grant date fair value of $679,000. During the fiscal year ended March 28, 2009, the Company granted 597,500 options with an estimated total grant date fair value of $6,940,000.
As of April 2, 2011, the unrecognized employee stock-based compensation cost balance related to stock options, net of forfeitures, was $6,151,000 and will be recognized over an estimated weighted average amortization period of approximately 1.8 years.
65
SUPERTEX, INC.
NOTES TO CONSOLIDATED FINANCIAL STATEMENTS – (CONTINUED)
Valuation Assumptions
In valuing the stock-based compensation expense, the options and awards were stratified into two categories, namely: directors and officers (“D&O”) and all other employees (“All Others”), as the experiences of these two groups were different for the expected term of the options. The fair value of each option grant is estimated on the date of grant using the Black-Scholes option valuation model using the following weighted-average assumptions:
|
Fiscal Years Ended
|
||||||||
|
April 2, 2011
|
April 3, 2010
|
|||||||
|
Directors & Officers
|
All Other Employees
|
Directors & Officers
|
All Other Employees
|
|||||
|
Expected term (years)
|
6.00
|
5.00 - 5.50
|
6.75
|
5.25
|
||||
|
Stock volatility
|
44.74% - 45.42%
|
44.50% - 46.38%
|
45.89%
|
46.05% - 47.27%
|
||||
|
Risk free interest rates
|
1.72% - 2.46%
|
1.41% - 2.29%
|
2.91%
|
2.12% - 2.64%
|
||||
|
Dividend yields
|
0.0%
|
0.0%
|
0.0%
|
0.0%
|
||||
The Company analyzed various data points to determine the most accurate expected term by group. In the course of its analysis, it considered various factors, including vesting terms and period of awards, contractual term of the award, employee historical exercise, post-vesting employment termination behavior, expected term data from peer companies and various other factors. The Company has identified its own historical volatility to be the most appropriate and most representative of the expected volatility rate to be used for valuing stock-based compensation under the Black-Scholes option-pricing model. The expected volatility was based on the expected term of the two groups of options to be valued. The Company continues to use the estimate of risk-free rate based on the U.S. Treasury yield curve in effect at the time of grant. The Company has never paid cash dividends and does not currently intend to pay cash dividends, thus the Company assumes an expected dividend yield of zero.
12. NET INCOME PER SHARE
Basic net income per share is calculated in accordance with the authoritative guidance for earnings per share, which requires dual presentation of basic and diluted net income per share on the face of the income statement. Basic net income per share is computed as net income divided by the weighted average number of common shares outstanding for the period. Diluted net income per share is computed using the weighted-average number of shares of common stock outstanding plus the effect of all dilutive stock option grants and ESPP shares representing potential shares of common stock outstanding during the period.
The following is a reconciliation of the numerator (net income) and the denominator (number of shares) used in the basic and diluted net income per share calculations.
|
Fiscal Years Ended
|
||||||||||||
|
(in thousands, except per share value)
|
April 2, 2011
|
April 3, 2010
|
March 28, 2009
|
|||||||||
|
Net income
|
$ | 12,282 | $ | 5,125 | $ | 12,545 | ||||||
|
BASIC:
|
||||||||||||
|
Weighted average shares outstanding
|
12,976 | 12,912 | 12,836 | |||||||||
|
Net income per share
|
$ | 0.95 | $ | 0.40 | $ | 0.98 | ||||||
|
DILUTED:
|
||||||||||||
|
Weighted average shares outstanding
|
12,976 | 12,912 | 12,836 | |||||||||
|
Effect of dilutive securities: stock options and ESPP
|
54 | 83 | 91 | |||||||||
|
Weighted average shares outstanding
|
13,030 | 12,995 | 12,927 | |||||||||
|
Net income per share
|
$ | 0.94 | $ | 0.39 | $ | 0.97 | ||||||
Options to purchase the Company’s common stock of 1,303,654 shares at an average price of $28.72 per share, 1,175,094 shares at an average price of $29.40 per share, and 919,355 shares at an average price of $32.20 per share in fiscal 2011, 2010 and 2009, respectively, were outstanding but were not included in the computation of diluted earnings per share because their effect would have been anti-dilutive.
66
SUPERTEX, INC.
NOTES TO CONSOLIDATED FINANCIAL STATEMENTS – (CONTINUED)
13. SEGMENT INFORMATION
The Company operates in one business segment comprising of the design, development, manufacturing and marketing of high voltage analog and mixed signal integrated circuits.
A breakdown of the Company’s total sales to customers in the medical electronics, LED lighting, imaging, telecom, and industrial/other markets for the years ended April 2, 2011, April 3, 2010, and March 28, 2009 are shown below (in thousands):
|
Fiscal Years Ended
|
||||||||||||
|
Net Sales
|
April 2, 2011
|
April 3, 2010
|
March 28, 2009
|
|||||||||
|
Medical Electronics
|
$ | 30,635 | $ | 24,735 | $ | 33,368 | ||||||
|
Imaging
|
16,369 | 13,407 | 20,550 | |||||||||
|
LED Lighting
|
13,242 | 14,850 | 4,973 | |||||||||
|
Telecom
|
9,376 | 5,252 | 7,139 | |||||||||
|
Industrial/Other
|
13,550 | 8,480 | 12,780 | |||||||||
|
Net Sales
|
$ | 83,172 | $ | 66,724 | $ | 78,810 | ||||||
The Company's principal markets are in Asia, the US, and Europe. Below is a summary of net sales by major geographic area for the years ended April 2, 2011, April 3, 2010 and March 28, 2009 (in thousands):
|
Fiscal Years Ended
|
||||||||||||
|
Net Sales
|
April 2, 2011
|
April 3, 2010
|
March 28, 2009
|
|||||||||
|
Asia (excluding China)
|
$ | 24,622 | $ | 17,280 | $ | 20,670 | ||||||
|
United States
|
24,304 | 21,043 | 29,301 | |||||||||
|
China
|
21,120 | 21,060 | 17,968 | |||||||||
|
Europe
|
12,503 | 7,022 | 10,093 | |||||||||
|
Other
|
623 | 319 | 778 | |||||||||
|
Net Sales
|
$ | 83,172 | $ | 66,724 | $ | 78,810 | ||||||
Sales are attributed to geographic location based on product shipment destination location.
Property, plant and equipment, net by country was as follows (in thousands):
|
April 2, 2011
|
April 3, 2010
|
|||||||
|
United States
|
$ | 4,525 | $ | 5,630 | ||||
|
Hong Kong
|
1,183 | 1,161 | ||||||
|
Property, plant and equipment, net
|
$ | 5,708 | $ | 6,791 | ||||
14. COMMITMENTS AND CONTINGENCIES
Operating Leases
As part of the Company’s acquisition of a six-inch wafer fabrication operation in fiscal 1999, the Company assumed an operating lease for its manufacturing facility. On April 16, 2010, the Board of Directors of the Company approved the amendment of the lease extending the lease term by five years, expiring on April 30, 2016 at a specified new rent schedule. Beginning May 2011, the monthly rent was $48,000 with a provision for an annual increase of approximately 3% in each of the following five years. The Company is responsible for maintenance costs, including property taxes, utilities, insurance and other costs. As of April 2, 2011, the Company had an asset retirement obligation of $326,000.
67
SUPERTEX, INC.
NOTES TO CONSOLIDATED FINANCIAL STATEMENTS – (CONTINUED)
The Company also leases a facility to house its operations in Hong Kong under an operating lease for the equivalent of approximately $14,400 per month exclusive of building maintenance fees, rates, taxes and other duties imposed by the government of Hong Kong upon the leased property. The original lease for 23,600 square feet was renewed in September 2009 and expires on November 30, 2012. A lease for additional space of 4,500 square feet was renewed in September 2009 and covers three years from September 16, 2009 to September 15, 2012. A lease for additional space of 10,000 square feet was signed in May 2008 and covers three years and two months from August 1, 2008 to September 30, 2011. The Company has an option to renew all three of these Hong Kong leases for an additional three years.
The Company has other operating leases for its field sales offices in Shenzhen & Shanghai, China, Taiwan, Japan, and Korea expiring at various dates through fiscal year 2016.
Future minimum lease payments under all non-cancelable operating leases as of April 2, 2011 are as follows (in thousands):
|
Payment Due by Fiscal Years
|
Operating Lease(1)
|
|||
|
2012
|
$ | 855 | ||
|
2013
|
725 | |||
|
2014
|
621 | |||
|
2015
|
620 | |||
|
2016
|
639 | |||
|
2017
|
53 | |||
| $ | 3,513 | |||
Facilities rental expenses were approximately $1,068,000 in fiscal year 2011. Facilities rental expenses were $1,200,000 and $1,151,000 (net of facilities sublease income of $11,000 and $26,000) in fiscal years 2010 and 2009, respectively.
Indemnification
As is customary in the Company’s industry, the Company has agreed to defend certain customers, distributors, suppliers, and subcontractors against certain claims, which third parties may assert that its products allegedly infringe certain of their intellectual property rights, including patents, trademarks, trade secrets, or copyrights. The Company has agreed to pay certain amounts of any resulting damage awards and typically has the option to replace any infringing product with non-infringing product. The terms of these indemnification obligations are generally perpetual from the effective date of the agreement. In certain cases, there are limits on and exceptions to the Company’s potential liability for indemnification relating to intellectual property infringement claims. The Company cannot estimate the amount of potential future payments, if any, that it might be required to make as a result of these agreements. To date, the Company has not paid any damage award or been required to defend any claim related to its indemnification obligations, and accordingly, it has not accrued any amount for indemnification obligations. However, there can be no assurance that the Company will not have any financial exposure under those indemnification obligations in the future.
Legal Proceedings
From time to time the Company is subject to possible claims or assessments from third parties arising in the normal course of business. Management has reviewed such possible claims and assessments with legal counsel and believes that it is unlikely that they will result in a material adverse impact on the Company’s financial position, results of operations or cash flows.
68
SUPERTEX, INC.
NOTES TO CONSOLIDATED FINANCIAL STATEMENTS – (CONTINUED)
The Company engaged in certain export-related activities consisting of having one of our integrated circuits shipped to assemblers and its wholly-owned subsidiary in the Far East for assembly and test that may have inadvertently violated the International Traffic and Arms Regulations (“ITAR”) and the Arms Export Control Act. Upon discovery, the Company voluntarily notified the U.S. Department of State and has been investigating the facts and circumstances since March 2010. Should the Company’s actions has violated ITAR, the Company could face substantial civil fines or other penalties at the discretion of the US Department of State, which to date has not imposed any fine or penalty. While at this time the Company is unable to estimate the extent of any fines or penalties or other potential losses that it may incur with respect to this matter, the Company believes that it is unlikely, although not remote, that the ultimate outcome would have a material adverse effect on the Company. Since becoming aware of these potential ITAR issues, the Company has moved the assembly and testing of these products to ITAR certified onshore facilities.
69
SUPERTEX, INC.
EXHIBIT INDEX
(The Registrant will furnish to any shareholders who so request a copy of this Annual Report on Form 10-K and any Exhibit listed below, provided that the Registrant may require payment of a reasonable fee not to exceed its expense in furnishing such information.)
|
3.
|
Exhibits.
|
|
|
Exhibit
|
Exhibit Description
|
|
|
3.1 (1)
|
Restated Articles of Incorporation of Registrant filed May 21, 1980.
|
|
|
3.2 (1)
|
Certificate of Amendment of Articles of Incorporation filed April 16, 1981.
|
|
|
3.3 (1)
|
Certificate of Amendment of Articles of Incorporation filed September 30, 1983.
|
|
|
3.4 (1)
|
Certificate of Amendment of Articles of Incorporation filed October 14, 1988.
|
|
|
3.5 (2)
|
Amended and Restated Bylaws of Registrant.
|
|
|
10.1 (1)*
|
Non-Qualified Deferred Compensation Plan, which became effective January 1, 1996, as most recently amended on December 1, 2008.
|
|
|
10.2 (1)
|
Lease 71 Vista Montana, San Jose, California, comprised of a lease dated December 7, 1988, and five amendments (5/4/89; 6/18/90; 12/21/95; 2/1/99; and 1/23/04) and two assignments (11/15/96 and 2/1/99) with Sobrato Development Companies #871, as landlord, and Supertex, Inc., as assignee/tenant.
|
|
|
10.3 (3)
|
Sixth Amendment to Lease of 71 Vista Montana, San Jose, California dated April 16, 2010, with Sobrato Development Companies #871, as landlord, and Supertex, Inc., as assignee/tenant.
|
|
|
10.4 (1)
|
Leases of Hong Kong Facility dated 5/16/08, 9/11/09, and 9/11/09 with Jing Wah Garments Mfg. Co. Ltd.
|
|
|
10.5 (4)*
|
2000 Employee Stock Purchase Plan.
|
|
|
10.6 (5)*
|
2001 Stock Option Plan.
|
|
|
10.7 (6)*
|
2009 Equity Incentive Plan.
|
|
|
10.8 (1)*
|
Profit Sharing Bonus Incentive Plan.
|
|
|
21.1
|
Subsidiary of the Registrant.
|
|
|
23.1
|
Consent of PricewaterhouseCoopers LLP, Independent Registered Public Accounting Firm.
|
|
|
24.1
|
Power of Attorney (See signature page).
|
|
70
|
31.1
|
Certification of Chief Executive Officer pursuant to Securities Exchange Act Rules 13a-14(a) and 15d-14(a), as adopted pursuant to Section 302 of the Sarbanes-Oxley Act of 2002.
|
|
|
31.2
|
Certification of Chief Financial Officer pursuant to Securities Exchange Act Rules 13a-14(a) and 15d-14(a), as adopted pursuant to Section 302 of the Sarbanes-Oxley Act of 2002.
|
|
|
32.1
|
Certification of Chief Executive Officer pursuant to 18 U.S.C. Section 1350, as adopted pursuant to Section 906 of the Sarbanes-Oxley Act of 2002.
|
|
|
32.2
|
Certification of Chief Financial Officer pursuant to 18 U.S.C. Section 1350, as adopted pursuant to Section 906 of the Sarbanes-Oxley Act of 2002.
|
|
|
(1)
|
Exhibits 3.1, 3.2, 3.3, 3.4, 10.1, 10.2, 10.4, and 10.8 to Registrant’s Annual Report on Form 10-K dated April 3, 2010, filed with the SEC on June 11, 2010 are hereby incorporated by reference.
|
|
|
(2)
|
Exhibit 3.6 to Registrant’s Current Report on Form 8-K dated December 21, 2007, filed with the SEC on December 28, 2007, is hereby incorporated by reference.
|
|
|
(3)
|
Exhibit 10.9 to Registrant’s Current Report on Form 8-K dated April 16, 2010, filed with the SEC on April 22, 2010 is hereby incorporated by reference.
|
|
|
(4)
|
Exhibit 4.1 to Registrant's Registration Statement on Form S-8 (File No. 333-47606) which was filed with the SEC and became effective on October 10, 2000, is hereby incorporated by reference.
|
|
|
(5)
|
Appendix B of Registrant’s amended Proxy Statement on Schedule 14A filed on August 7, 2001 (File No. 000-12718) is hereby incorporated by reference.
|
|
|
(6)
|
Appendix 1 of Registrant’s Proxy Statement on Schedule 14A filed on July 2, 2009 (File No. 000-12718) is hereby incorporated by reference.
|
|
|
*
|
Denotes a management contract or compensatory plan or arrangement.
|
71