Attached files
| file | filename |
|---|---|
| 8-K - FORM 8-K - SUNRISE SENIOR LIVING INC | d8k.htm |
 Investor Conference 2011
June 14, 2011 |
 Disclaimer
2
•
Some of the statements in this presentation, as well as statements made
by management, may be forward-looking statements that are
based on management’s current assumptions, expectations and projections regarding our business and performance, the
economy and forecasts of future events, circumstances and results.
Forward-looking statements include statements concerning the
projected future performance of Sunrise and the markets in which
we operate.
•
These forward-looking statements speak only as of the date of this
presentation. We undertake no obligation to update any
forward-looking statements to reflect the events or circumstances
arising after the date as of which they are made. As with any
projection or forecast, they are inherently susceptible to uncertainty
and changes in circumstances. Our actual results may differ
materially from those set forth in our forward-looking statements,
depending on various factors including the risks and
uncertainties described in filings made with the Securities and
Exchange Commission. As a result of these risks and uncertainties,
recipients of this presentation are cautioned not to place undue
reliance on the forward-looking statements included in this
presentation or that may be made elsewhere from time to time by,
or on behalf of, us.
•
This presentation may contain statistics and other data that may
have been obtained or compiled from information made available
by third-party service providers. While we believe these sources to
be reliable, accuracy and completeness of the information cannot
be guaranteed.
•
This presentation contains certain supplemental non-GAAP financial
measures. While we believe that non-GAAP financial
measures are helpful in evaluating our operating performance, the use
of non-GAAP financial measures in this presentation should
not be considered in isolation from, or as an alternative for, a
measure of financial or operating performance as defined by
GAAP. You are cautioned that there are inherent
limitations associated with the use of each of these
supplemental non-GAAP financial measures as an analytical
tool. Reconciliations of certain non-GAAP financial measures to the most directly comparable GAAP
financial measures can be found in the Appendix to this presentation
and the Company’s supplemental information packages and
2010 Annual Report, which are available on the Company’s website
at www.sunriseseniorliving.com. •
Unless otherwise noted herein, all the information contained in this
presentation is presented as of June 14, 2011. |
 The Sunrise Story and Our Mission
3
Sunrise Founders Terry and Paul Klaassen witnessed 30
years ago how aging men and women had their dignity
and choice taken away from them, simply because they
needed extra assistance. They realized, from deep personal
experience, that
there were no options for seniors other
than the institutional environment of traditional long
-
term care facilities.
Seniors deserved much better.
In 1981, they took
the first step to pioneer a new kind
of senior living. Right from the beginning, they
established
Sunrise’s
Mission
to champion quality of life for all seniors.
The Klaassens created a homelike environment with the unique approach
to care that would become
the foundation of Sunrise: the resident-centered
-
philosophy.
This philosophy anticipated the varying needs of seniors,
including memory care, and the design and staffing of our communities
reflect that foresight.
Sunrise today has been transformed in many ways but remains completely
committed to
our time-tested Mission. This Mission and our Principles of
Service to seniors are as
relevant today as ever. These Principles are also
intertwined with
and true need and
demand for what we do. Sunrise represents the enviable combination of a
life-enriching service
and
a
sound, growing business model.
extraordinary
demographic
advantages |
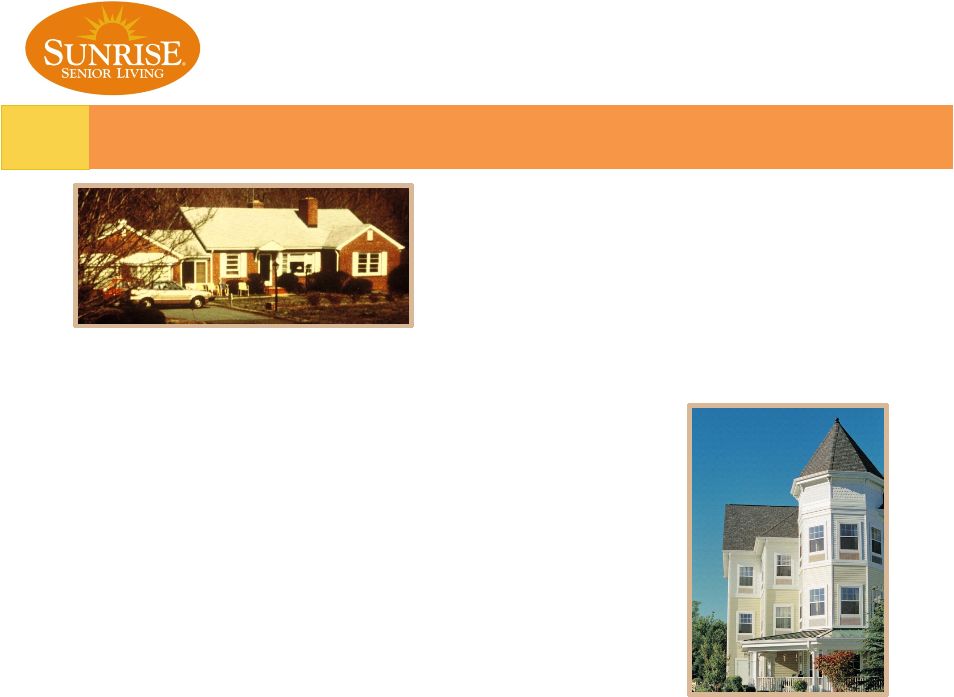
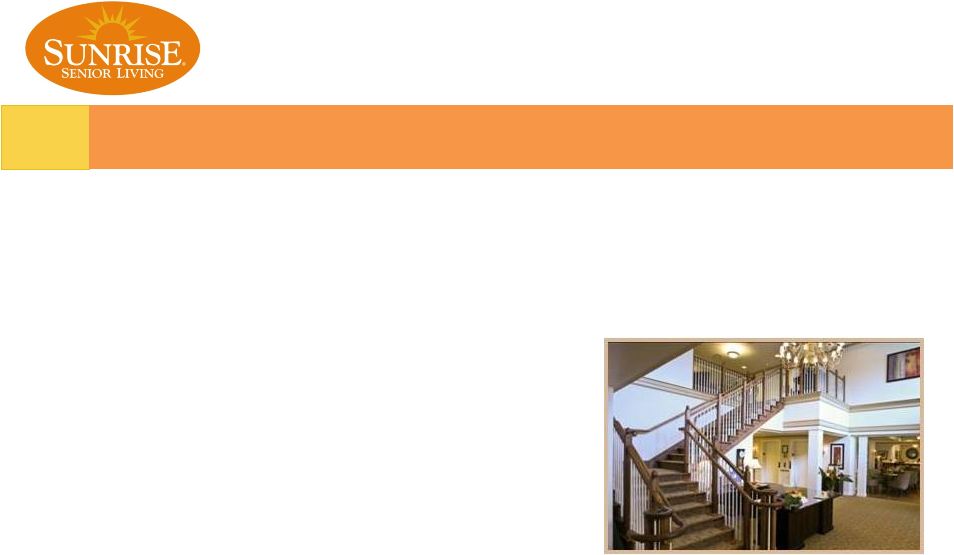 Sunrise Buildings Are Designed for Seniors
4
The Sunrise-developed mansion was deliberately built with the needs
of seniors in mind. Many of these design elements have been
carried through to buildings we have acquired. •
Homelike
appeal,
lush
landscaping
and
residential
character
•
Comfortable
outdoor
areas
–
wrap-around porches with rocking chairs, garden spaces,
trellises •
Thoughtfully
designed,
senior-friendly
features:
•
Large, open foyer and grand staircase
•
Sunrise Bistro, the community hub
•
Living room/parlor with gas-burning fireplace
•
Individual heating and cooling systems in resident suites
•
Sturdy handrails disguised as decorative chair rails
•
Automatic light sensors
•
Strategic capital expenditure planning for future updates
•
Resident
safety:
•
Built
to
I-2
classification
(most
communities),
including
steel
beams,
fire
sprinklers, fire doors
and non-combustible materials
•
Emergency generators, perimeter door security, e-call
systems •
Skylights
and
emphasis
on
natural
lighting
Note: community features vary by location
|
 Service Highlights
5
Premium
product
offering
of
resident-centered
services
for
seniors
Second-largest
provider
of
assisted
living
services
in
the
country*
An
Individualized
Service
Plan
of
care
is
delivered
by
a
team
of
designated
care
managers (DCMs)
As care
needs
increase,
seniors
can
“age
in
place”
Assisted Living (57%)
Skilled Nursing &
Rehabilitative Care (3%)
Focus
on
short-term,
rehabilitative
stays
with
a
goal
of
returning
the
resident
to
the
most
independent
living
setting
possible;
approach
has
more
than
doubled
Medicare mix over the past several years
Generates
several
hundred
move-ins
to
other
Sunrise
neighborhoods
each
year
Due to Total ADR of $390, skilled nursing
represents 7.5% of total revenue in U.S. Independent Living (16%)
Active seniors enjoy an independent, maintenance-free
lifestyle with
on-call
assistance;
additional
services
may
also
be
arranged
as
care
needs
change
Properties are predominantly rental, but also include co-operatives, equity sales
and numerous entrance fee models
Memory Care (24%)
Largest
provider
of
memory
care
services
in
the
country*
DCMs
are
trained
in
therapeutic
techniques
to
validate
resident
emotions
and understand their needs in a secure “Reminiscence
Neighborhood” Life
enrichment
managers
develop
and
adapt
meaningful
activities
that
incorporate resident interests and evoke pleasant memories
*Source: Assisted Living Federation of America
|
 Sunrise Signature Experience
6
Sunrise’s special touches and unique approach to personalized care
are just part of what sets us apart. We Create
Relationship-Based Care Our
designated
care
managers
form
rich
relationships
by
getting
to
know
our
residents’
preferences,
from
what
time they like to wake up in the morning to their favorite meal.
A Team of Serving Hearts
Our
teams
hone
their
skills
through
hands-on
experience
and
in-depth
training
programs
at
our
own
Sunrise
University
–
so
each
team
member
is
delivering
care
the
Sunrise
way.
Offering Peace of Mind
Residents
and
families
can
have
peace
of
mind
in
knowing
that
we’re
here
for
them
around
the
clock.
We
work hard to make sure all residents are living life to the fullest,
not worrying about anything else. Celebrating the Joy of Every
Day We
strive
to
give
every
resident
at
Sunrise
a
life
filled
with
purpose
and
hope.
Our
commitment
to
making
every day special is what makes the Sunrise experience so
unique. Enriching Mind, Body & Spirit
Vibrant
activities
programs
designed
around
residents’
interests,
so
there’s
always
something
fulfilling
to
do.
With All the Comforts of Home
Communities
designed
to
look
and
feel
like
home,
from
our
community
cat
and
dog
to
our
fresh-cut
flowers,
and
hundreds
of
special
touches
to
make
life
easier.
Some Highlights: |
 Enriching the Mind, Body & Spirit
7
•
Qualified team, led by a coordinator-level position focused solely
on activities, offers several meaningful and engaging
activities a day •
Activities
seek
to
benefit
the
mind,
body
and
spirit
of
all
of
our
residents,
from exercise programs like tai-chi to social activities like wine
& cheese happy hours and group outings
•
Sunrise’s new Dining Program features delicious meals made from
scratch every day
by our trained culinary team
•
Residents enjoy the freshest, local ingredients and an assortment of
menu choices designed with their health, tastes and
preferences in mind (He) mentioned that
he wanted spaghetti
and meatballs. As
soon as it was said,
the chef started
making that special
dish…and every
Tuesday ever since.
Family member, Sunrise
of West Babylon, NY
During
the
(short
time)
mom
has
been
at
Sunrise,
she
has
blossomed
–
she
smiles
more
than
she
has
in
years; she’s made new friends; she’s involved in activities and
she is totally satisfied in her new environment.
She
loves
everything.
Family
member,
Sunrise
at
North
Farmington
Hills,
MI
Our residents enjoy the very best in senior living from fulfilling
activities to home-cooked meals
–
we
stop
at
nothing
to
create
a
warm,
enriching
home. |
 Consistent High-Quality Buildings
8
*IL
–
Independent
Living;
AL
–
Assisted
Living;
TC
–
Terrace
Club
(early-stage
memory
care);
REM
–
Reminiscence
(advanced
memory
care);
HC
–
Health
Care/Skilled
Nursing |
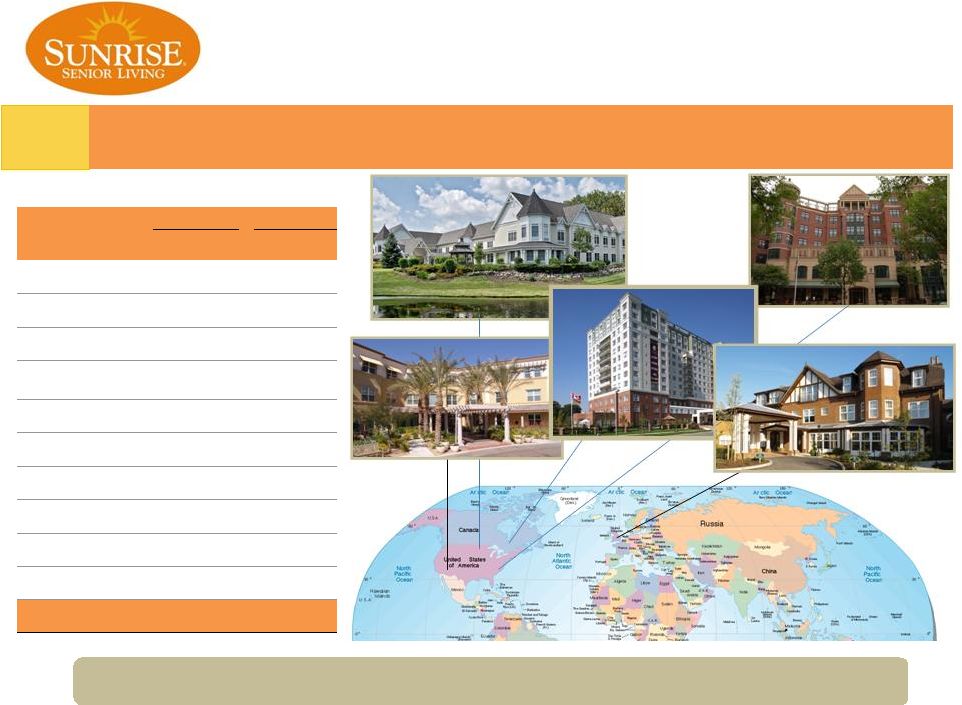 Major Metropolitan Focus
9
Communities
Units
#
% of
Total
#
% of
Total
Washington DC Metro
Market
26
8.2
3,502
11.3
Greater Los Angeles
Market
23
7.3
2,009
6.5
NY Metro Market
22
6.9
1,766
5.7
Greater Chicago Market
20
6.3
1,821
5.9
Greater London
14
4.4
1,145
3.7
Philadelphia Metro
Market
13
4.1
1,509
4.9
San Francisco Market
13
4.1
1,337
4.3
Greater Boston Market
12
3.8
754
2.4
Greater Atlanta
11
3.5
1,099
3.5
Greater Toronto
8
2.5
764
2.5
162
51.1
15,706
50.7
Differentiated
strategy focused on major metropolitan markets with strong fundamentals
|
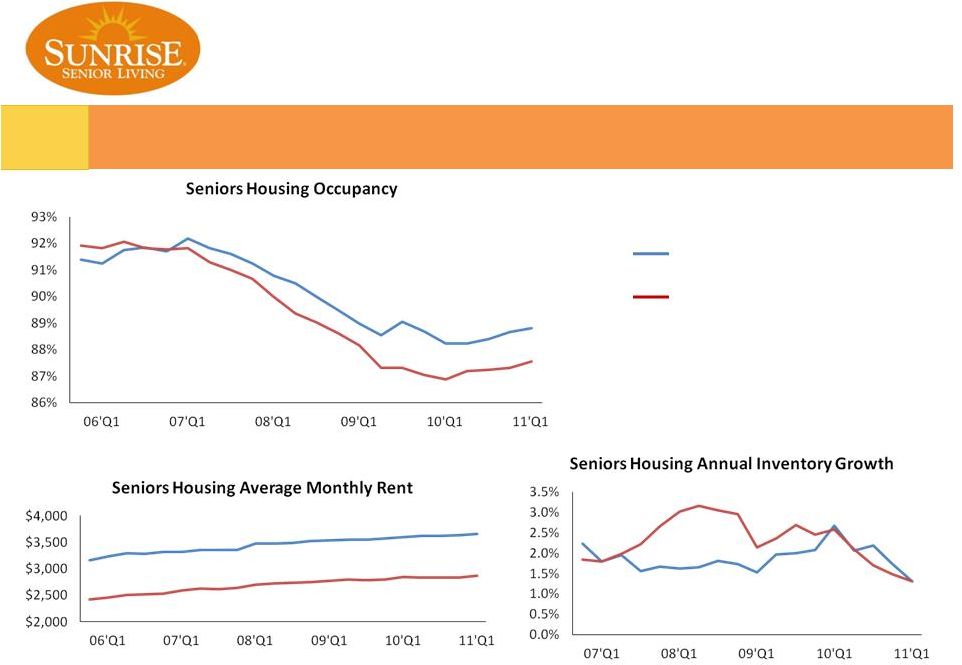 Major Market Performance Over Time
10
Big 6 Markets
MAP31 Excl. Big 6 Markets*
*Big 6 Markets include: New York,
Boston, D.C., Chicago, No. California
and So. California metro markets.
NIC Map Source Data |
 High-Quality Business Relationships |
 Experienced Senior Management Team
12
Management Team
Name
Title
Years of Relevant Experience
Years with Sunrise
Mark S. Ordan
Chief Executive Officer
25+ years
3+ years
Greg Neeb
Chief Investment & Administrative Officer
20+ years
3+ years
Marc Richards
Chief Financial Officer
15+ years
1+ year
David Haddock
General Counsel and Secretary
15+ years
5+ years
Ron Jeanneault
Co-Head of Operations
20+ years
11+ years
Laura McDuffie
Co-Head of Operations
15+ years
9+ years
Edward Burnett
SVP, Capital Markets
10+ years
2+ years
Gregg Colon
SVP, Resident Care & Services
22+ years
16+ years
Philip Kroskin
SVP, Asset Management & Real Estate
19+ years
2+ years
Meghan Lublin
VP, Corporate Marketing & Communications
11+ years
6+ years
Kelly Myers
SVP, Sales
21+ years
11+ years
David Pratt
SVP, Corporate Finance
10+ years
6+ years
Mike Rodis
SVP, Human Resources
30+ years
2+ years
Founders
Name
Title
Years of Relevant Experience
Years with Sunrise
Paul Klaassen
Founder and Chairman
30+ years
30 years
Terry Klaassen
Founder and Special Advisor
30+ years
30 years
Team successfully navigated the recapitalization and has positioned the company for the
future |
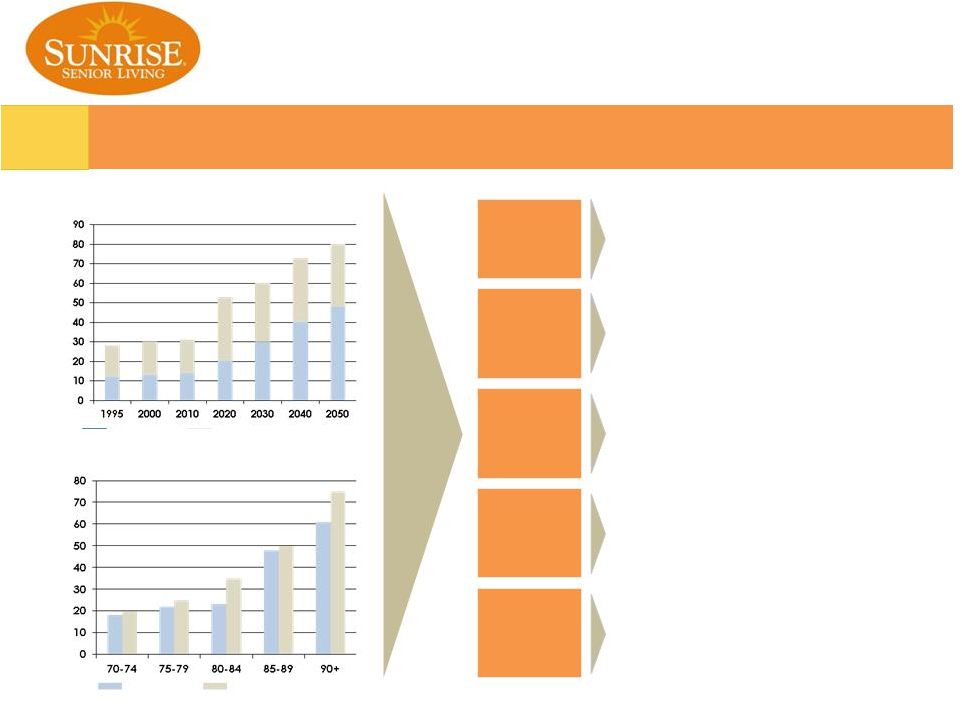 Attractive & Growing Market
13
Growing Senior
Population
•
Over 70MM seniors 65+ by 2040, making
up 20% of the total US population
•
85+ population projected to grow 3%
annually over the next 40 years
Assistance Increases with Age
Need for Care
Increases with
Age
•
Today’s seniors are healthier than in the
past, but many still have difficulty with
Activities of Daily Living (ADLs)
•
19% of 70-74 year olds and 50% of 85+ year
olds require assistance with ADLs
Rising Net
Worth of
Seniors
•
Today’s elderly have more wealth than in
the past (~$163K, up 42% since 1995)
•
Dramatic increase in residential net equity
over the past decade
Increasing
Popularity of
Senior Housing
•
According to a recent NIC survey, 60+
population living in age-qualified housing
increased from 7% to 12% from 1998 –
2007
•
Consumer awareness has increased ~14%
over that same time period
Consistent
Occupancy /
Rental Rate
Growth
•
Median occupancy has remained above
90% since 1994
•
Rents have grown 5% annually for ALF and
4% for ILF since 2000
% Requiring Assistance with ADLs
Population of US Seniors Rising
MM of US Population
75 and over
65 and over
Men
Women
Sources: US Census Bureau, Joint Center of Housing Studies, NIC National Housing Survey,
Federal Reserve Board and ASHA |
 Strong Rate Growth and Well Positioned for Occupancy Rebound
14
Notes
(1)
Compares
same
community
growth
or
change
in
occupancy
for
the
4
th
quarter
of
the
measurement
year
over
the
4
th
quarter
of
the
prior
year
for
the
pool
of
comparable
communities in a given year.
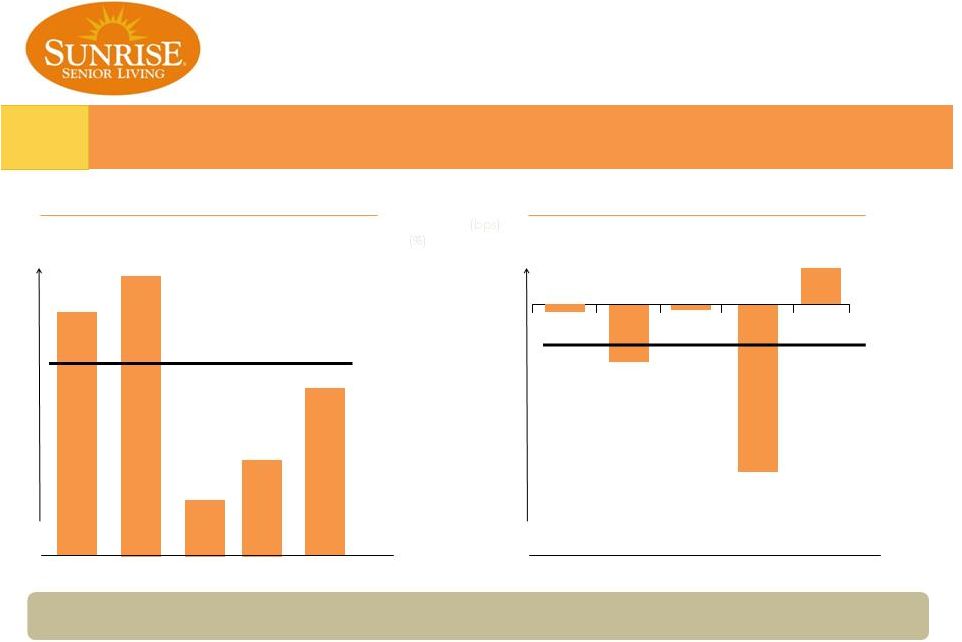
%
(bps)
Same
Community
ADR
Growth
(1)
Same
Community
Occupancy
Change
(1)
2006
2007
2008
2009
2010
7
0
5-Year Average: 4.1%
(%)
100
(500)
(bps)
2006
2007
2008
2009
2010
5-Year Average: (76)bps
High-quality assets translate to consistently strong operating results
|
 SRZ vs. Large Chains* (>25 Properties)
Senior Housing Occupancy
89.0%
Chains 25+
SRZ
88.0%
87.0%
86.0%
85.0%
84.0%
83.0%
82.0%
1 2 3
4 1 2 3
4
1
2009
2010
2011
Senior Housing AMR
$4,400
Chains 25+
SRZ
$4,200
$4,000
$3,800
$3,600
$3,400
$3,200
$3,000
$2,800
$2,600
1 2 3
4 1 2 3
4
1
2009
2010
2011
15
*Large Chains Not Including SRZ – NIC Map Source Data |
 Significant Progress on Key Initiatives
16
Solidified
Balance Sheet
Stabilized
Revenue Streams
Rationalize
Cost Structure
Restructured 4 of the 5 largest management
contracts
Restructured
key
relationships
with
Ventas
and
HCP
Re-focus on Mansion product
Reduced G&A by 30% from 2008 levels
Eliminated approximately 200 corporate
overhead positions
Continuing rationalization in 2011
Deleted non-core businesses and assets and
related costs
Execute Disciplined
Growth Strategy
Arcapita / CNL Transaction
Morgan Stanley Transaction
Initiative
Accomplishments
Sunrise Snapshot
Our recapitalization is substantially complete and we are beginning to implement our disciplined
growth strategy 12/31/08
Current
# of
Properties
435
316
G&A and
Development
Expense
$184MM
$129MM (1)
Equity
Market Cap
$85MM
$475MM (2)
Near finalization of new $50MM revolver
Repaid bulk of consolidated debt
Significantly reduced corporate recourse liabilities
Restructured over $1B of debt in default (venture
and consolidated)
Exited Germany and other unprofitable businesses
(1)
Reflects 2010 figures and includes $21MM of the following items: $6.9MM in professional fees
relating to HCP, CNL, and Ventas transactions, $8.5MM in HCP litigation, $2.6MM in
severance, and $3.0MM in a retention bonus for the CEO. The figure also includes $4.0MM
in non-cash stock compensation.
(2)
As of June 9, 2011. |
 Balance Sheet De-Risk
17
(dollars in thousands)
Defaulted Debt at
Total Debt at
Current
Total Debt at
Proforma
6/30/2009
6/30/2009
Defaulted Debt
3/31/2011
3/31/2011
1)
Wells Fargo
56,556
56,556
-
-
-
Connecticut Avenue
39,703
39,703
-
28,010
28,010
Quebec
-
43,837
49,269
48,147
48,147
Germany
190,213
190,213
-
-
-
Line of Credit
-
69,200
-
-
-
Sweet 16
105,366
105,366
-
-
-
Convertible Notes
-
-
-
-
86,250
AL US
-
-
-
-
339,800
Other Consolidated
47,731
109,658
1,365
78,543
78,543
Total Consolidated Debt
439,569
614,533
50,634
154,700
580,750
Pool 7
128,205
303,175
-
435,000
435,000
Pool 12
-
370,500
-
365,342
-
Pool 14
47,901
47,901
-
46,028
46,028
Pool 16 and 17
152,433
152,433
-
153,282
153,282
Pool 18, 19, and 20
234,859
234,859
199,062
275,227
275,227
Pool 21 and 22
56,848
56,848
56,372
70,750
70,750
Pool 23
-
30,729
30,117
30,244
30,244
Pool 25
-
122,651
-
116,355
116,355
Fountains
328,705
328,705
-
-
-
Clayton
55,648
55,648
-
-
-
Other Joint Ventures
17,116
2,412,945
1,545
1,498,127
1,498,127
Total Joint Venture Debt
1,021,715
4,116,394
287,096
2,990,355
2,625,013
Total Debt
1,461,284
4,730,927
337,730
3,145,055
3,205,763
1) Proforma
consolidated debt includes $86.3MM of convertible notes issued April, 2011 and the
AL US debt, net of a $25MM paydown. |
 Stabilize
Revenue
Stream
–
Management
Contracts
(Including
JVs)
18
Sunrise has
restructured 4
out of its 5
largest
management
contracts:
Portfolio/Partner
Number of
Communities
Average
Maturities
2010 Fee
($ in 000s)
Notes
Ventas
79
2034-2037
19,307
Entered into amended management
agreements in 2010
HCPI
46
2028-2038
17,079
Litigation dismissed and settlement
reached in 2010
Arcapita
29
2028
9,646
Brought
in
new
partner
in
2011
–
Arcapita
had termination rights
Pool 3 (UK)
15
2037
6,712
Working with lender and partner
Morgan Stanley (US)
15
2037
5,824
Bought out partner in 2011 and modified
loan
All Others
97
49,264
No other relationship has aggregate fees
greater than $5 million
Total
281
107,832
Resulting in
extended
maturities:
Remaining Contract
Term (1) (In years)
Number of
Communities
2010
Management Fee
Revenue
Weighted
Avg. Mgmt.
Fee Percent
0-5
14
$ 6,687
5.32%
6-10
1
64
2.96%
11-15
5
1,237
5.38%
16-20
57
19,891
5.72%
20+
204
65,546
6.89%
Sold/Terminated in 2009 and 2010
N/A
14,407
6.23%
281
107,832
6.41% |
 Rationalize Cost Structure –
G&A Completed Initiatives
19
Corporate Costs
2007
2008
2009
2010
Q1 2011
G&A
183,546
150,273
114,566
124,728
32,389
Development Expense
35,076
34,118
12,374
4,484
-
Liquidity Trust
-
-
-
-
407
Accounting Restatement/SEC
51,707
30,224
3,887
(1,305)
-
Restructuring
-
24,178
32,534
11,690
-
Total Corporate Costs
270,329
238,793
163,361
139,597
32,796
Voluntary Separation Program (VSP)
In 2008, we implemented a program to reduce corporate expenses, including a voluntary
separation program for certain team members, as well as a reduction of spending related
to administrative processes, vendors, consultants and other costs. We eliminated
182 positions primarily in our McLean, Virginia headquarters. We recorded severance charges related to this
program of $3.0 million and $15.0 million for 2009 and 2008, respectively.
Re-structure of Office Lease
With the decreased staff, we reconfigured our office space and two floors of leased space in
our headquarters were vacated. We ceased using the space on December 31, 2008.
Additional Corporate Staff Reduction
In 2009 and 2010, we continued to reduce corporate expenses through a further reorganization
of our corporate cost structure, including a reduction in spending related to, among
others, administrative processes, vendors and consultants. The plan was designed
to reduce our annual recurring general and administrative expenses (including expenses previously classified as
venture expense) to approximately $100 million. |
 Business Lines Over Time
20
2011 Q1
2011 Q1
2008
2010
Illustrative ¹
Ill. Annlzd. ¹
Revenue adjusted for EBITDA
Management Fees
116.8
106.9
21.3
85.0
Professional fees from development, marketing, and other
44.2
4.3
0.3
1.2
Owned/Consolidated
NOI
2
(12.3)
12.6
23.6
94.3
Leased NOI
94.3
78.6
21.1
84.3
Sunrise's proportionate share of Joint Ventures
39.8
43.2
4.3
17.2
Total Revenues adjusted for EBITDA
282.8
245.5
70.5
282.0
Expenses
adjusted
for
EBITDA
Community lease expense
59.8
60.2
14.8
59.2
General
and
Administrative/D&V
3
181.2
125.2
30.7
122.8
Other
(13.8)
2.8
0.8
3.2
Total Expenses adjusted for EBITDA
227.2
188.2
46.3
185.2
Blackjack
14.7
0.0
0.0
0.0
Greystone
(28.1)
0.0
0.0
0.0
Trinity
(25.6)
0.0
0.0
0.0
Germany
(29.6)
(9.2)
0.0
0.0
Fountains
(11.6)
1.0
0.0
0.0
Aston Gardens
(3.0)
0.0
0.0
0.0
Other
0.7
0.0
0.0
0.0
Total Discontinued Business Lines
(82.5)
(8.2)
0.0
0.0
(26.9)
49.0
24.2
96.8
1) Illustrative 2011 numbers include Q1 actuals adjusted assuming a
100% ownership of the AL US and CC3 portfolios on Jan 1, 2011. This
financial information is for illustrative purposes only. We did
not own a 100% interest in AL US until June 2011. Additionally during 2011
we will only own a 40% interest in CC3, and can only purchase 100%
commencing in 2013 subject to certain terms and conditions. 2)
Owned NOI excludes interest expense of approximately $29M for the CC3 portfolio, $22M for the AL US portfolio
and $5M for other consolidated assets
3) G&A excludes non-cash stock comp expense
4) Discontinued business lines include NOI less guaranty and interest
payments, with the exception of Fountains and Aston Gardens
which are management fees less guaranty payments 5) See appendix
for bridge to Net Income. Total Adj. EBITDA Less Discontinued
Business Lines Discontinued Business Lines
4
5 |
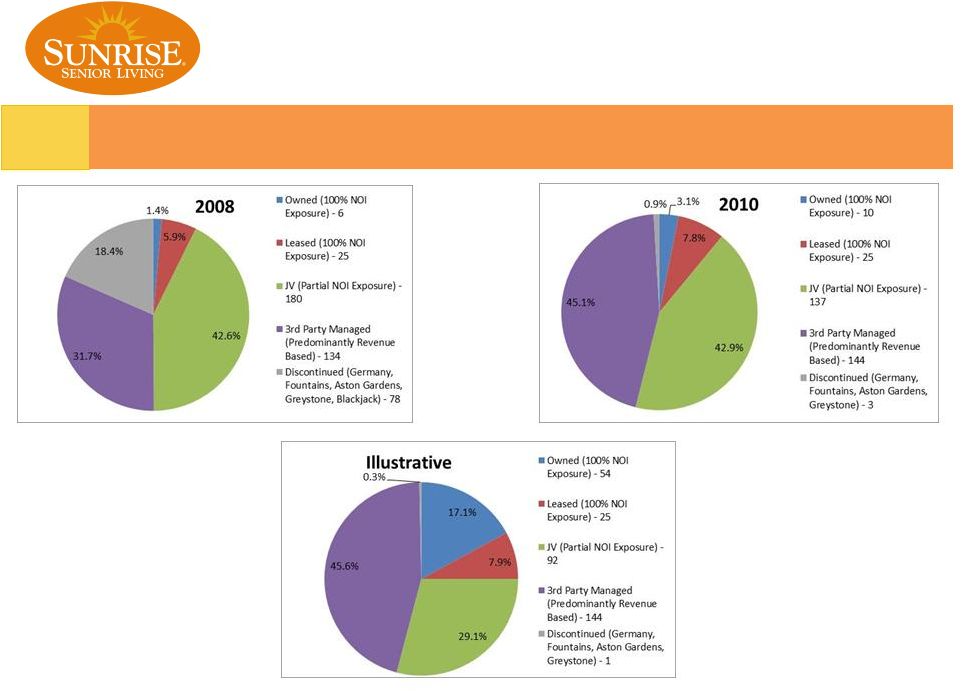 Ownership Mix Over Time
21
-
Illustrative assumes that
Sunrise owned 100% of the AL
US and CCIII ventures. Sunrise
purchased the AL US joint
venture in June 2011, and has
the right to purchase 100% of
the CC3 venture in 2013
subject to certain terms and
conditions. |
 Attractive Growth Prospects
22
Focus on improving operating efficiency
Provide additional revenue-generating
services at existing communities
Selectively expand existing facilities/convert
higher productivity uses
Proprietary deal flow
Maximizes benefit from improved
performance of communities
Capitalize on reputation,
senior living sector
expertise and brand
licensing opportunities for
products, services and
locations
Selective acquisition of
platform-enhancing assets
Measured development of
new communities in major
metro markets
Increase Community Income
Buy-out JV Interests
Brand Extension
Acquisition / Development
Growth
Initiatives |
 CNL Lifestyle –
CC3 Investment Summary
23
Jan 2011, Sunrise contributed its 10% interest in an
existing JV (CC3) for a 40% interest in a new JV with
CNL Lifestyle Properties
–
29 asset / 2,028 unit portfolio
–
Portfolio valued at $630 million
–
Primarily concentrated in the NY, Chicago,
Washington DC and LA markets, representing 67%
of portfolio NOI
–
High-quality portfolio of primarily purpose-built
mansion products
–
Signed new 30-year management agreements with
5% fees that escalate to 6% plus IMF; previous
agreement was terminable for a fee and possible loss
of equity promote
–
Financed with 3 year CMBS offered through
Goldman Sachs at 6.75%
–
Sunrise secured right to fixed price buy-out of its
new partner, available after year 2 at 13% IRR. In
exchange, CNL earns 11.5% current preference
–
Partners
invested
$11.5M
for
CapEx
improvements
* 2013 estimated results based on standard 3% annual increases from 2011
CC3 Portfolio Investment
Summary
2011B
2013B*
Revenues
$ 157,138
$ 166,707
Less: Exp.
$(101,294)
$(107,463)
Less: Mgmt. (5%)
$ (7,857)
$ (8,335)
NOI
$ 47,986
$ 50,909
Less: Other
$ (1,131)
$ (1,177)
Less: Debt Service
$ (29,770)
$ (29,770)
Equity Cash Flow
$ 17,085
$ 19,962
CNL Cash Equity
$ 135,000
Sunrise Carried Equity
$ 79,959
Sunrise Cash Equity
$ 8,841
Total Cash Flow
$ 223,800
$ 17,085
$ 19,962
Return on Equity
7.6%
8.9%
Unleveraged Yield
Net Operating Income
$ 47,986
$ 50,909
Portfolio Value
$ 630,000
$ 630,000
Unleveraged Yield (%)
7.62%
8.08% |
 AL US Investment Summary
24
June 2011, Sunrise bought out its partner’s 80% share in
an existing JV and restructured the JV debt.
–
15 asset /1,091 unit portfolio; high-quality purpose-
built mansions
–
10 of 15 assets in CA, primarily LA market
–
Partner received $45M for 80% equity share
–
Prior to transaction, loan defaulted in Q1 2011 due to
DSCR violation and mgmt contract was terminable by
Lender
–
In Q3 2009, DSCR violation triggered cash flow sweep
and Sunrise began subordinating 3% of mgmt fee
–
Loan was paid down by $25M
–
Loan term extended 3 years to Jun 2015
–
Subordinated management fees (3% of Rev) were
returned to Sunrise
–
Lender to continue sweeping all excess cash flows
–
Loan interest rate reduced through new swap at market
levels
–
Loan covenants adjusted to Sunrise’s benefit
* Cash flow sweep accretive to Sunrise by reducing loan balance and building
equity
** Return on Equity shown on new investment basis due to reduction of
carried equity to effectively zero from over-leverage on portfolio
AL US Portfolio Investment Summary
2011B
Revenues
$ 84,802
Less: Exp.
$ (51,976)
Less: Mgmt. (7%)
$ (5,936)
NOI
$ 26,890
Cash Flow Sweep Amortization *
$ 9,084
Sunrise Subordinated Mgmt Fee (3%)
$ 2,544
Sunrise Incremental Total Cash Flow
$ 11,628
Sunrise Carried Equity
$
- Sunrise Cash Equity
$ 72,000
Sunrise Return on Equity **
16.2%
Unleveraged
Yield (%)
Net Operating Income
$ 26,889
Portfolio Value (Equity + Debt)
$ 423,501
Unleveraged
Yield (%)
6.3% |
 2011
2012
2013
2014
2015+
Capital Structure
Debt Maturity Schedule
(1)
($MM)
Capitalization
(1)
($MM)
48.1
57.9
21.0
5.4
448.4
Equity:
Equity Market Capitalization
(2)
474.6
Debt:
Recourse Debt
85.5
Non-recourse Debt
(1)
409.0
Convertible Debt
86.3
Total Pro Forma Debt
580.8
Total Capitalization
1,055.4
Less: Cash & Cash Equivalents
(3)
(41.0)
Total Enterprise Value (TEV)
1,014.4
Leverage Ratios:
Total Debt / Total Capitalization
55%
Net Debt / Total Enterprise Value
53%
25
400
80
60
40
20
0
Recapitalized balance sheet assuming access to $50MM undrawn credit facility (near
finalization) Notes
(1) Consolidated debt as of 3/31/11 plus the face amount of debt associated with the AL
US purchase and debt modification
(2) As of 6/9/11
(3) Reflects 3/31/11 cash balance of $41M
|
 Premium product offering of resident-centered services for
seniors High-quality, purpose-built assets located in
top metropolitan markets Sector leading brand, reputation and
senior living expertise Leading Provider of
Senior Living Services
Favorable Industry Backdrop
Compelling
supply
and
demand
drivers
with
aging
demographics
and
limited
new supply of senior housing
Leader in memory care and assisted living
Strong Growth Prospects
Internal growth from continued occupancy gains and rate
increases Focus on “owning more of what we
manage” Opportunity to capitalize on our brand, expertise
and sector leading care Well-Positioned Capital
Structure
Recapitalization substantially complete
Proposed $50MM credit facility with new lender (near finalization)
Proven Management Team
Significant relevant experience in the industry
Successfully implemented recapitalization strategy
Founders are pioneers of assisted living industry
Company Highlights
26 |
 Appendix: Reconciliation of non–GAAP measure
27
The following table reconciles adjusted EBITDA, less discontinued business lines, to net
income (loss) attributable to common shareholders (in millions):
2008
2010
Total Adj. EBITDA Less Discontinued Business Lines
(26.9)
49.0
Plus: Discontinued Business Lines
82.5
8.2
Less: Stock Comp Expense
(3.2)
(4.0)
Less: SRZ proportionate share of JVs
(39.8)
(43.2)
Plus: Buyout fees
0.6
63.3
Less: Depreciation and amortization
(39.2)
(41.1)
Less: Write-off of capitalized project costs
(95.8)
0.0
Less: Accounting Restatement, Special Independent Committee inquiry,
SEC investigation and stockholder litigation
(30.2)
1.3
Less: Restructuring Costs
(24.2)
(11.7)
Less: Other Provision for Doubtful Accounts
(19.5)
(5.4)
Less: Loss on Financial guarantees
(5.0)
(0.5)
Less: Impairment on owned communities and land parcels
(27.8)
(5.9)
Less: Impairment of goodwill and intangible assets
(121.8)
0.0
Plus: Interest Income
6.0
1.1
Less: Interest Expense
(6.6)
(7.7)
Plus/Less: Gain/Loss on Investments
(7.8)
0.9
Plus: Gain on fair value of liquidating trust notes
0.0
5.2
Plus/Less: Other income/ expense
(22.1)
1.2
Plus: Gain on sale of real estate and equity interests
17.4
27.7
Plus/Less: Sunrise's share of earnings (loss) and return on investment
in unconsolidated communities
(13.8)
7.5
Plus/Less: Loss from investments accounted for under the profit sharing
method (1.3)
(9.7)
Plus/Less: Provision for/ benefit from income taxes
47.1
(6.6)
Plus Fountains Management Fees
9.6
1.0
Plus: Aston Garden Management Fees
3.2
0.0
Less: Discontinued operations, net of tax
(120.5)
68.5
Net Income/Loss
(439.2)
99.1 |