Attached files
| file | filename |
|---|---|
| 8-K - 8-K - Oak Valley Bancorp | a11-14761_18k.htm |
Exhibit 99.1
|
|
[LOGO] |
|
|
Forward-Looking Statement • This presentation includes forward-looking statements about the corporation for which the corporation claims the protection of safe harbor provisions contained in the Private Securities Litigation Reform Act of 1995. • Forward-looking statements are based on management's knowledge and belief as of today and include information concerning the corporation's possible or assumed future financial condition, and its results of operations and business. Forward-looking statements are subject to risks and uncertainties. A number of important factors could cause actual results to differ materially from those in the forward-looking statements. Those factors include fluctuations in interest rates, government policies and regulations (including monetary and fiscal policies), legislation, economic conditions, including increased energy costs in California, credit quality of borrowers, operational factors and competition in the geographic and business areas in which the company conducts its operations. All forward-looking statements included in this press release are based on information available at the time of the release, and the Company assumes no obligation to update any forward-looking statement. |
|
|
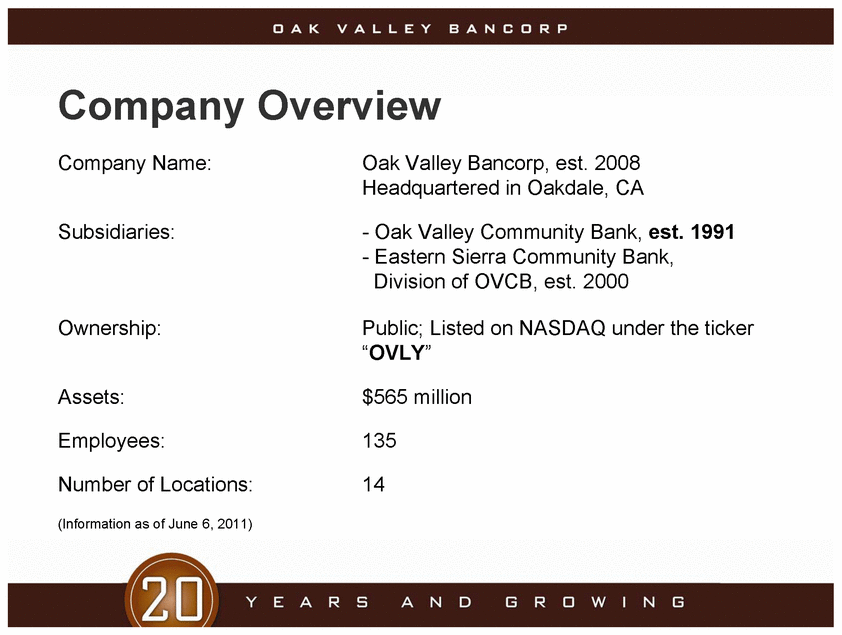
Company Overview Company Name: Oak Valley Bancorp, est. 2008 Headquartered in Oakdale, CA Subsidiaries: - Oak Valley Community Bank, est. 1991 - Eastern Sierra Community Bank, Division of OVCB, est. 2000 Ownership: Public; Listed on NASDAQ under the ticker “OVLY” Assets: $565 million Employees: 135 Number of Locations: 14 (Information as of June 6, 2011) |
|
|
Branch Footprint 1. Oakdale 2. Sonora 3. Modesto – 12th & I 4. Bridgeport 5. Mammoth Lakes 6. Bishop 7. Modesto-Dale 8. Turlock 9. Stockton 10. Patterson 11. Ripon 12. Escalon 13. Modesto – McHenry 14. Manteca |
|
|
Asset Growth 1991-2010 (in Millions) 0 100 200 300 400 500 600 '91 '92 '93 '94 '95 '96 '97 '98 '99 '00 '01 '02 '03 '04 '05 '06 '07 '08 '09 '10 12 23 30 35 41 56 85 103 118 134 158 193 241 313 382 455 455 508 525 552 Stockton 12th & I, Escalon Sonora Oakdale Modesto Bridgeport Mammoth Lakes Bishop, Dale Rd Turlock, Patterson, Ripon, LPO |
|
|
Highlights • Strong NIM • Core Deposit Growth • Strong Risk Management • Continued Diligence on Credit |
|
|
Profitability 1991-2010 (in thousands) (1,000) - 1,000 2,000 3,000 4,000 5,000 91 92 93 94 95 96 97 98 99 00 01 02 03 04 05 06 07 08 09 10 (373) (255) 250 439 574 601 734 1,194 1,372 1,538 1,659 1,797 2,318 3,251 3,935 3,831 3,960 2,162 2,000 4,628 |
|
|
Performance Components 30,000 25,000 20,000 15,000 10,000 5,000 - 2006 2007 2008 2009 2010 Net earnings 3,726 3,925 2,098 1,158 3,786 Net interest income 17,333 18,831 20,515 23,642 25,007 Non-interest expense 12,221 14,213 16,311 15,565 16,138 NPL expense 595 555 3,742 8,515 4,658 CPP - - 64 842 842 |
|
|
NIM – 5 Year Peer Comparison (Peer group: CA Commercial Banks $300M-$1B in assets) 6.00 5.00 4.00 3.00 2.00 1.00 0.00 4.50 4.53 4.72 4.99 5.20 4.83 4.59 4.07 3.82 4.10 2006 2007 2008 2009 2010 Peer OVCB |
|
|
Deposit Growth Account Growth $500 $450 $400 $350 $300 $250 $200 23.0 21.0 19.0 17.0 15.0 13.0 11.0 9.0 7.0 5.0 Dec-07 Dec-08 Dec-09 Dec-10 Total Deposits (m) $377 $378 $429 $477 Accounts (k) 15.8 18.3 19.9 21.3 |
|
|
Strong Risk Management Asset Quality 2006 2007 2008 2009 2010 NPA to Assets OVCB 0.00% 2.00% 1.47% 3.16% 2.22% Peer 0.28% 0.94% 2.70% 3.87% 4.08% Net Charge-offs to Loans OVCB 0.00% 0.10% 0.28% 1.04% 0.68% Peer 0.04% 0.14% 1.91% 1.77% 1.41% Return on Average Assets OVCB 0.92% 0.88% 0.47% 0.40% 0.88% Peer 1.28% 0.91% -0.51% -0.67% -0.13% (Peer group: CA Commercial Banks $300M-$1B in assets) |
|
|
Headwinds • Weak Economy • Market Concern about CRE • Continuously Changing Regulatory Environment |
|
|
Risk-Based Capital (Peer group: CA Commercial Banks $300M-$1B in assets) 17.5% 15.0% 12.5% 10.0% 7.5% 5.0% 2.5% Dec-07 Dec-08 Dec-09 Dec-10 OVCB Peer Group Well Capitalized Est. Target |
|
|
Strategic Direction • Relationship Banking • High Level of Customer Contact • Low-Cost Core Deposits • Focus on Credit Quality • Strategic Opportunity |
|
|
Historic Stock Price Summary 2000 2001 2002 2003 2004 2005 2006 2007 2008 2009 2010 2011 OVLY ($/SH) 3.55 3.32 4.15 7.00 14.89 15.67 13.03 8.25 6.00 4.41 5.90 6.00 OVLY (BV/SH) 2.52 2.63 2.92 3.18 4.10 4.44 4.84 5.57 5.83 6.13 6.64 6.85 OVLY ($/BV) 1.41 1.26 1.42 2.20 3.63 3.53 2.69 1.48 1.03 0.72 0.89 0.88 Peer ($/BV) 1.36 1.56 1.84 2.23 2.50 2.66 2.80 2.06 1.01 0.70 0.89 0.88 - 2.00 4.00 6.00 8.00 10.00 12.00 14.00 16.00 18.00 (Peer group: CA Banks $500M-$1B in assets, median as of May 31, 2011) |
|
|
[LOGO] Thank you! |


