Attached files
Table of Contents
UNITED STATES
SECURITIES AND EXCHANGE COMMISSION
Washington, D.C. 20549
FORM 10-K
| x | ANNUAL REPORT PURSUANT TO SECTION 13 OR 15(d) OF THE SECURITIES EXCHANGE ACT OF 1934 |
For the fiscal year ended March 31, 2011
OR
| ¨ | TRANSITION REPORT PURSUANT TO SECTION 13 OR 15(d) OF THE SECURITIES EXCHANGE ACT OF 1934 |
For the transition period from to
Commission File Number 000-14656
REPLIGEN CORPORATION
(Exact name of registrant as specified in its charter)
| Delaware | 04-2729386 | |
| (State or other jurisdiction of incorporation or organization) |
(I.R.S. Employer Identification No.) | |
| 41 Seyon Street, Bldg. 1, Suite 100 Waltham, MA |
02453 | |
| (Address of principal executive offices) | (Zip Code) | |
Registrant’s telephone number, including area code: (781) 250-0111
Securities registered pursuant to Section 12(b) of the Act:
Title of Each Class
Common Stock, $0.01 Par Value Per Share
Series A Junior Participating Preferred Stock Purchase Rights
Name of Each Exchange on Which Registered
The NASDAQ Stock Market LLC
Securities registered pursuant to Section 12(g) of the Act: None
Title of Each Class
Indicate by check mark if the registrant is a well-known seasoned issuer, as defined in Rule 405 of the Securities Act. Yes ¨ No x.
Indicate by check mark if the registrant is not required to file reports pursuant to Section 13 or Section 15(d) of the Act. Yes ¨ No x.
Indicate by checkmark whether the registrant (1) has filed all reports required to be filed by Section 13 or 15(d) of the Securities Exchange Act of 1934 during the preceding 12 months (or for such shorter period that the registrant was required to file such reports), and (2) has been subject to such filing requirements for the past 90 days. Yes x No ¨.
Indicate by check mark whether the registrant has submitted electronically and posted on its corporate Website, if any, every Interactive Data File required to be submitted and posted pursuant to Rule 405 of Regulation S-T (§232.405 of this chapter) during the preceding 12 months (or for such shorter period that the registrant was required to submit and post such files). Yes ¨ No ¨.
Indicate by check mark if disclosure of delinquent filers pursuant to Item 405 of Regulation S-K (§229.405 of this chapter) is not contained herein, and will not be contained, to the best of registrant’s knowledge, in definitive proxy or information statements incorporated by reference in Part III of this Form 10-K or any amendment to this Form 10-K. ¨
Indicate by check mark whether the registrant is a large accelerated filer, an accelerated filer, a non-accelerated filer, or a smaller reporting company. See the definitions of “large accelerated filer,” “accelerated filer” and “smaller reporting company” in Rule 12b-2 of the Exchange Act. (Check one):
| Large accelerated filer ¨ | Accelerated filer x | Non-accelerated filer ¨ | Smaller reporting company ¨ | |||
| (Do not check if a smaller reporting company) |
Indicate by check mark whether the registrant is a shell company (as defined in Rule 12b-2 of the Act). Yes ¨ No x.
The aggregate market value of the voting and non-voting common equity held by non-affiliates as of September 30, 2010, the last business day of the registrant’s most recently completed second fiscal quarter, was $104,061,098.
The number of shares of the registrant’s common stock outstanding as of May 20, 2011 was 30,812,257.
Documents Incorporated By Reference
Portions of the Company’s Proxy Statement for the 2011 Annual Meeting of Stockholders are incorporated by reference into Part III of this Form 10-K.
Table of Contents
| PAGE | ||||||
| PART I |
||||||
| Item 1. |
1 | |||||
| Item 1A. |
10 | |||||
| Item 1B. |
18 | |||||
| Item 2. |
18 | |||||
| Item 3. |
18 | |||||
| Item 4. |
18 | |||||
| PART II |
||||||
| Item 5. |
19 | |||||
| Item 6. |
21 | |||||
| Item 7. |
Management’s Discussion and Analysis of Financial Condition and Results of Operations |
22 | ||||
| Item 7A. |
33 | |||||
| Item 8. |
33 | |||||
| Item 9. |
Changes in and Disagreements with Accountants on Accounting and Financial Disclosure |
33 | ||||
| Item 9A. |
33 | |||||
| Item 9B. |
36 | |||||
| PART III |
||||||
| PART IV |
||||||
| Item 15. |
38 | |||||
| 41 | ||||||
Table of Contents
PART I
| Item 1. | BUSINESS |
The following discussion of our business contains forward-looking statements that involve risks and uncertainties. When used in this report, the words “intend,” “anticipate,” “believe,” “estimate,” “plan” and “expect” and similar expressions as they relate to us are included to identify forward-looking statements. Our actual results could differ materially from those anticipated in these forward-looking statements and are a result of certain factors, including those set forth under “Risk Factors” and elsewhere in this Annual Report on Form 10-K.
Repligen Corporation (“Repligen,” the “Company” or “we”) is an integrated biopharmaceutical company focused on the development and commercialization of innovative therapies that deliver the benefits of protein therapies to patients and clinicians in the fields of neurology and gastroenterology. We are currently conducting a number of drug development programs for diseases such as pancreatitis, Friedreich’s ataxia and spinal muscular atrophy. We also have a bioprocessing business that focuses on the development and commercialization of products that are used in the production of biopharmaceuticals. In addition, we have out-licensed certain biologics intellectual property from which we receive royalties from Bristol-Myers Squibb Company (“Bristol”) on their net sales in the United States of their product Orencia®.
We were incorporated in May 1981, under the laws of the State of Delaware. Our principal executive offices are at 41 Seyon Street, Waltham, Massachusetts 02453 and our telephone number is (781) 250-0111.
Currently Marketed Products
We currently sell a line of commercial bioprocessing products based on Protein A, as well as a line of pre-packed chromatography columns, which are used in the production of monoclonal antibodies and other biopharmaceutical products.
Products for Biologics Manufacturing
Chromatography resins based on Protein A are widely used in the purification of therapeutic monoclonal antibodies. Most therapeutic monoclonal antibodies are manufactured by the fermentation of mammalian cells that express the monoclonal antibody. The monoclonal antibody is typically produced by a process in which an impure fermentation broth containing the desired monoclonal antibody is passed over a solid support to which Protein A has been chemically attached or a “resin.” The immobilized Protein A binds the monoclonal antibody while other impurities are washed away. The monoclonal antibody is then recovered from the support in a substantially purified form.
We manufacture and market several products based on recombinant forms of Protein A. Our primary customers incorporate various forms of Protein A products into their proprietary monoclonal antibody purification products that they sell directly to the biopharmaceutical industry. We primarily supply Protein A products to GE Healthcare (“GEHC”) under a supply agreement which extends through 2015. The majority of our product sales for the last three years have been sales of Protein A products and related detection assays.
We recently introduced a second product line under the tradename OpusTM which is based on a technology for the production of pre-packed, “plug and play” chromatography columns for the purification of biopharmaceuticals and vaccines. In January 2010, we acquired this patented technology from BioFlash Partners, LLC (“BioFlash”) (see Note 13) that enables reliable production of pre-packed chromatography columns in a format that is ready for use in manufacturing. Opus columns have the potential to improve manufacturing efficiencies by reducing time for column packing, set-up and cleaning. We plan to invest in the expansion of this product line this year based on specific customer feedback. We also expect to seek to acquire, license or distribute additional bioprocessing products which we can sell directly to end-users.
1
Table of Contents
Monoclonal antibodies are highly valuable therapeutic agents and were among the best-selling drugs in the world in 2010. Global revenues from monoclonal antibody products will have moved significantly past the $40 billion level in 2010 and are poised to continue growing steadily through 2015. Examples of therapeutic antibodies include Enbrel® and Remicade® for rheumatoid arthritis and other inflammatory disorders, and Rituxan® for rheumatoid arthritis and Non-Hodgkin’s Lymphoma, among others. There are approximately 286 monoclonal antibodies in various stages of clinical development which may lead to additional growth of the biopharmaceuticals market and in turn, increased demand for Protein A and Opus products.
SecreFlo® for Pancreatic Diagnosis
We discontinued distribution of SecreFlo® in the second quarter of fiscal year 2009 due to the expiration of our agreement with ChiRhoClin, Inc. Previously, we recorded sales of SecreFlo®, a synthetic form of porcine (pig-derived) secretin. SecreFlo® is approved by the U.S. Food and Drug Administration (“FDA”) as an aid in the diagnosis of chronic pancreatitis and gastrinoma (a form of cancer) and as an aid during endoscopic retrograde cholangiopancreatography (“ERCP”), a gastrointestinal procedure.
Intellectual Property on CTLA4-Ig
Orencia® (CTLA4-Ig) Royalties
CTLA4 is a key regulator of the activity of the immune system. CTLA4 “turns off” the immune system after it has successfully cleared a bacterial or viral infection by blocking the activation of T-cells, the immune cells responsible for initiating an immune response. In the 1990’s, our collaborators at the University of Michigan and the U.S. Navy demonstrated in animal models that a fusion protein consisting of fragments of CTLA4 and an antibody (“CTLA4-Ig”) could be used to treat certain autoimmune diseases. This research finding resulted in the granting of U.S. patent No. 6,685,941 (“the ‘941 Patent”) covering the treatment of certain autoimmune disorders including rheumatoid arthritis with CTLA4-Ig. CTLA4-Ig’s mechanism of action is different from the current therapies for autoimmune disease or organ transplant rejection, thus it may provide a treatment for patients who are refractory to existing therapies.
In December 2005, the FDA approved Bristol’s application to market CTLA4-Ig, under the brand name Orencia®, for treatment of rheumatoid arthritis. In January 2006, Repligen and the University of Michigan jointly filed a lawsuit against Bristol in the United States District Court for the Eastern District of Texas for infringement of the ‘941 Patent. In April 2008, Repligen and the University of Michigan entered into a settlement agreement with Bristol pursuant to which, Bristol made an initial payment of $5 million to Repligen and agreed to pay us royalties on the U.S. net sales of Orencia® for any clinical indication at a rate of 1.8% for the first $500 million of annual sales, 2.0% for the next $500 million and 4.0% of annual sales in excess of $1 billion for each year from January 1, 2008 until December 31, 2013.
The ‘941 Patent is owned by the University of Michigan and exclusively licensed to Repligen. In consideration of this exclusive license, Repligen agreed to pay the University of Michigan 15% of all royalty income received, after deducting legal expenses. There are no annual or other fees associated with this agreement. Under this agreement, since its inception through fiscal year 2011, Repligen has paid approximately $3,975,000 to the University of Michigan.
Research and Development
For the past three years, we have devoted substantial resources to the research and development of therapeutic product candidates and our commercial products discussed herein. We spent $12,529,000, $14,160,000 and $12,772,000 in fiscal years 2011, 2010 and 2009, respectively, on company-sponsored research and development activities.
2
Table of Contents
Development Stage Products
Secretin for MRI Imaging of the Pancreas
Secretin is a well-known gastrointestinal hormone produced in the small intestine that regulates the function of the pancreas as part of the process of digestion. We recently completed a Phase 3 clinical trial evaluating the sensitivity and specificity of secretin in combination with MRI to improve the detection of structural abnormalities of the pancreas relative to MRI alone. Detailed visual assessment of the pancreatic ducts and identification of structural abnormalities is important in the assessment, diagnosis and treatment of diseases such as acute and chronic pancreatitis. The use of secretin during MRI harnesses the natural biologic properties of secretin, which signals the release of water-rich fluids into the ducts of the pancreas. Improvement in the detection and delineation of normal and abnormal structures with MRI is attractive for patient care as it can obviate the need for more invasive endoscopic procedures.
We initiated a Phase 2 clinical trial in June 2006 to evaluate the use of RG1068, synthetic human secretin, as an agent to improve the detection of structural abnormalities of the pancreatic ducts during MRI imaging of the pancreas. This was a multi-center, baseline controlled, single dose study in which 76 patients with a history of pancreatitis received an RG1068-MRI and an MRI alone of the pancreas. In May 2007, we announced positive results from this Phase 2 clinical trial. The study showed an improvement in sensitivity of detection of structural abnormalities of the pancreatic duct of approximately 20% with no loss in specificity. In addition, the study showed highly significant increases in the following three assessments: physician confidence in their ability to identify structural abnormalities, the number of pancreatic duct segments visualized, and improvement in the overall quality of the MRI images. Our Phase 2 data was reviewed by the FDA and served as the basis for a pivotal, Phase 3 study.
This Phase 3 clinical trial was initiated in March 2008 and completed in December 2009. This was a multi-center, baseline controlled, single dose study in which 258 patients with a history of pancreatitis at 23 clinical sites within the United States and Canada received an MRI of the pancreas with and without RG1068. The primary objectives of the Phase 3 study were to demonstrate that RG1068 increases the sensitivity in detecting structural abnormalities of the pancreas by MRI, with minimal loss of specificity. The predetermined criteria for a successful study included the achievement of a statistically significant improvement in sensitivity with minimal loss in specificity from two of the three central radiologists reading the MRI images. In this study, one radiologist achieved a statistically significant improvement in sensitivity with RG1068, while a second radiologist showed a trend but did not achieve statistical significance. There was minimal loss in specificity for all radiologists. Based on inconsistencies in the analysis of the radiographic images by the three radiologists hired to review the Phase 3 images, we submitted a request to the FDA and the European Medicines Agency (“EMA”) to re-analyze the Phase 3 data set (“Phase 3 re-read”). In May 2010, the FDA and EMA approved our plan for a re-analysis of images obtained from the Phase 3 trial. In March 2011, we announced positive results of the Phase 3 re-read, in which all three independent radiologists achieved a statistically significant improvement in sensitivity (all radiologists p<0.0001) with minimal loss in specificity. In addition, the RG1068-MRI images showed statistically significant improvements on image quality and confidence in the diagnostic findings when compared to MRI alone. We plan to file a New Drug Application (“NDA”) with the FDA in the second quarter of fiscal 2012. We also expect to build a commercial infrastructure to support the launch of RG1068 in the U.S. and to seek to establish one or more partnerships for commercialization of RG1068 outside the U.S., pending regulatory approvals.
We have received an Orphan Drug designation from the FDA covering the use of RG1068 in MRI which, if we are the first company to receive FDA approval for this use of secretin in the United States, will provide seven years of marketing exclusivity in the United States following approval of the NDA. We also have received “fast track” designation from the FDA which may provide the basis for an expedited review of this NDA by the FDA.
We believe that there may be additional uses for RG1068 and we intend to evaluate whether RG1068 has the potential to improve the detection of pancreatic cancer. We will also seek to acquire products that are complementary to RG1068, which we may be able to sell to gastroenterologists or radiologists.
3
Table of Contents
Histone Deacetylase Inhibitors for Friedreich’s Ataxia and Memory Disorders
Friedreich’s ataxia is an inherited neurodegenerative disease caused by a single gene defect that results in inadequate production of the protein frataxin. Low levels of frataxin lead to degeneration of both the nerves controlling muscle movements in the arms and legs and the nerve tissue in the spinal cord. Symptoms of Friedreich’s ataxia typically emerge between the ages of five and fifteen and often progress to severe disability, incapacitation or loss of life in early adulthood. There are approximately 15,000 patients worldwide with Friedreich’s ataxia. There is currently no treatment for Friedreich’s ataxia.
Repligen is currently developing RG2833, a selective class I histone deacetylase 3 inhibitor for the treatment of Friedreich’s ataxia. In May 2010, we filed an Investigational New Drug Application (“IND”) for RG2833 with the FDA and are now completing additional toxicology studies to support that filing. Pending regulatory approval, we plan to initiate a single, ascending dose Phase 1 study of RG2833 in Friedreich’s ataxia patients in Europe. We have developed methods to measure changes in frataxin levels in patient cells for use in our clinical trial which may enable us to gain an early insight into the potential benefit of treating patients with RG2833. We have received an Orphan Drug designation from the FDA for RG2833, which, if we are the first company to obtain market approval for RG2833 for Friedreich’s ataxia in the United States, will provide seven years of marketing exclusivity in the United States following NDA approval. We have received an Orphan Drug designation from the European Commission for RG2833, which, if we are the first company to obtain market approval for RG2833 for Friedreich’s ataxia in Europe, will provide ten years of marketing exclusivity in Europe following the Marketing Authorization Application (“MAA”) approval. The composition of RG2833 is covered by patent applications in the United States and Europe (see Patents, Licenses and Proprietary Rights section below.)
Repligen is also exploring the applicability of histone deacetylase inhibitors in the treatment of memory disorders.
DcpS Inhibitors for Spinal Muscular Atrophy
We are pursuing development of a drug that targets the scavenger mRNA decapping enzyme, DcpS, for treatment of patients with spinal muscular atrophy (“SMA”). Our inhibitors have the potential to be the first in class treatment for this disease. SMA is an inherited neurodegenerative disease in which a defect in the survival motor neuron gene (“SMN”) results in low levels of the protein SMN and leads to progressive damage to motor neurons, loss of muscle function and, in many patients, early death. There are approximately 20,000 people in the U.S. and Europe diagnosed with SMA.
On October 22, 2009, we entered into an exclusive worldwide commercial license agreement (“FSMA License Agreement”) with Families of Spinal Muscular Atrophy (“FSMA”). Pursuant to the FSMA License Agreement, we obtained an exclusive license to develop and commercialize certain patented technology and improvements thereon, owned or licensed by FSMA, relating to compounds which may have utility in treating SMA. If all milestones are achieved, total financial obligations under this agreement, including milestone payments, sublicense fees, and other charges, could total approximately $16,000,000.
Repligen’s compounds, based on RNA processing enzymes to inhibit DcpS, increase the production of the SMN protein in cells derived from patients. RG3039, our lead compound, has been shown to improve survival in a preclinical model of SMA. We filed an IND for RG3039 in the first quarter of fiscal 2012 and plan to initiate a Phase 1 study of RG3039 in healthy volunteers later in fiscal 2012. We have received an Orphan Drug designation from the FDA for RG3039, which, if we are the first company to obtain market approval for RG3039 for SMA in the United States, will provide seven years of marketing exclusivity in the United States following NDA approval. We are also seeking an Orphan Drug designation from the European Commission for RG3039, which, if granted, and if we are the first company to obtain market approval for RG3039 for SMA in Europe, will provide ten years of marketing exclusivity in Europe following MAA approval. The composition of RG3039 is covered by patent applications in the United States and Europe (see Patents, Licenses and Proprietary Rights section below.)
4
Table of Contents
Uridine for Bipolar Depression
Bipolar disorder, also known as manic depression, is a chronic illness marked by extreme changes in mood, thought, energy and behavior. Uridine is a biological compound that is essential for multiple biosynthetic processes including the synthesis of DNA and RNA, the basic hereditary material found in all cells and numerous other factors essential for cell metabolism. Researchers at McLean Hospital previously demonstrated that uridine is active in a well-validated animal model of depression. Literature reports indicate that certain genes that encode for mitochondrial proteins are significantly down-regulated in the brains of bipolar patients. This insight suggested that the symptoms of bipolar disorder may be linked to dysregulation of energy metabolism in the brain.
In March 2006, we initiated a Phase 2a clinical trial of RG2417, an oral formulation of uridine, in patients with bipolar disorder. The study showed a statistically significant improvement in the symptoms of depression in the patients treated with RG2417 when compared to placebo. Our Phase 2a data was reviewed by the FDA and served as the basis for a Phase 2b proof-of-concept clinical trial which we initiated in November 2008. In March 2011, we announced the results from this Phase 2b study which did not demonstrate a statistically significant improvement when compared to placebo in treating the symptoms of depression. At this time, we do not plan to invest additional resources in RG2417.
Sales and Marketing
We sell our bioprocessing products through our direct sales force, partners such as GEHC and distributors in certain foreign markets. Prior to its discontinuation in the second quarter of fiscal year 2009, we marketed SecreFlo® directly to hospital-based gastroenterologists in the United States.
We will file an NDA covering the use of RG1068 in MRI as early as the second quarter of fiscal 2012. We have also received “fast track” designation from the FDA which may provide the basis for an expedited review of this NDA by the FDA. We expect to build a commercial infrastructure to support the launch of RG1068 in the U.S., if approved, and to establish one or more partnerships for commercialization of RG1068 outside the U.S.
Significant Customers and Geographic Reporting
Customers for our bioprocessing products include chromatography companies, diagnostics companies, biopharmaceutical companies and laboratory researchers. In fiscal years 2011, 2010 and 2009, total revenues from sales to customers in the United States were approximately 50%, 57% and 59%, respectively. During the same fiscal periods, total revenues generated though sales to customers in Sweden were 42%, 36% and 36%, respectively. In April 2008, we settled our litigation with Bristol regarding their sales of Orencia® for which we now receive a royalty. For fiscal years 2011, 2010 and 2009, royalty revenue from Bristol represented 38%, 43% and 46% of total revenues, respectively. Our largest bioprocessing customer accounted for 42%, 36% and 36% of total revenues in fiscal years 2011, 2010 and 2009, respectively.
Employees
As of May 31, 2011, we had 66 employees. Of those employees, 46 were engaged in research, development and manufacturing and 20 were in administrative and marketing functions. Thirty-one of our employees hold doctorates or other advanced degrees. Each of our employees has signed a confidentiality agreement. None of our employees are covered by collective bargaining agreements.
Patents, Licenses and Proprietary Rights
Repligen considers patents to be an important element in the protection of our competitive and proprietary position and actively pursues patent protection in the United States and in major countries abroad. Other forms of protection, including trade secrets, orphan drug status and know-how, are also considered important elements of
5
Table of Contents
our proprietary strategy. As further described below, Repligen owns or has exclusive rights to a number of U.S. patents and U.S. pending patent applications as well as corresponding foreign patents and patent applications. The expiration of key patents owned or licensed by us or the failure of patents to issue on pending patent applications could create increased competition, with potential adverse effects on our business prospects. For each of our license agreements where we license the rights to patents or patent applications, the license will terminate on the day that the last to expire patent covered by each such license agreement expires.
We also rely upon trade secret protection for our confidential and proprietary information. Our policy is to require each of our employees, consultants, business partners and significant scientific collaborators to execute confidentiality agreements upon the commencement of an employment, consulting or business relationship with us. These agreements provide that all confidential information developed or made known to the individual during the course of the individual’s relationship with us is to be kept confidential and not disclosed to third parties except in specific circumstances. In the case of employees and consultants, the agreements generally provide that all inventions conceived by the individual in the course of rendering services to Repligen shall be our exclusive property.
CTLA4-Ig
The ‘941 patent, covering the use of CTLA4-Ig to treat specific autoimmune disorders including rheumatoid arthritis and multiple sclerosis was issued in February 2004. The patent is assigned to the University of Michigan and the U.S. Navy and is exclusively licensed to Repligen. In April 2008, Repligen granted Bristol an exclusive sublicense to this patent.
Protein A
We own a broad U.S. patent covering recombinant Protein A, which expired in September 2009, as well as proprietary technology, trade secrets, and know-how relating to the manufacture of high-purity Protein A. In fiscal 2010, we were granted U.S. Patent No. 7,691,608 B2, “Nucleic Acids Encoding Recombinant Protein A,” which claims a recombinant gene that encodes a Protein A molecule with an amino acid sequence identical to that of the natural Protein A molecule which has long been commercialized for bioprocessing applications. This U.S. patent, with the term extension that was granted, will remain in effect until 2028. Foreign equivalents of this patent are being prosecuted outside of the United States.
Histone Deacetylase Inhibitors
Repligen has entered into an exclusive license agreement with The Scripps Research Institute for worldwide rights to a patent application claiming compounds and methods for treating Friedreich’s ataxia with inhibitors of histone deacetylase (“HDAC”). We have extended this original work and filed additional patent applications which claim both methods and compositions for treating Friedreich’s ataxia. These patent applications are currently being prosecuted in the United States and abroad.
Spinal Muscular Atrophy
In 2009, Repligen entered into an exclusive license agreement with a non-profit organization, the Families of Spinal Muscular Atrophy (“FSMA”), for worldwide rights to patent applications related to compositions and methods for the treatment of spinal muscular atrophy. FSMA had funded the development of these compounds and identified a novel enzyme target (“DcpS”) that these compounds inhibit. Notices of Allowance have been received from the U.S. Patent and Trademark Office for two of these pending applications. Allowed claims include genus and species claims of the lead clinical candidates. Repligen is prosecuting equivalent patent applications abroad.
6
Table of Contents
Uridine
In 2009, Repligen entered into an exclusive license agreement with McLean Hospital for the worldwide rights to an internationally filed patent application which covers the use of uridine in the treatment of patients with bipolar disorder. On June 15, 2010, we were granted U.S. Patent No. 7,737,128 B2, “Pyrimidines, such as uridine, in treatments for patients with bipolar disorder,” which, with the term extension that was granted, will remain in effect until October 2025. Under the terms of the license agreement, McLean received an upfront payment and is eligible to receive payments upon certain product development milestones and royalties upon successful commercialization of uridine for bipolar disorder.
Competition
Our bioprocessing products compete on the basis of quality, performance, cost effectiveness, and application suitability with numerous established technologies. Additional products using new technologies that may be competitive with our products may also be introduced. Many of the companies selling or developing competitive products have financial, manufacturing and distribution resources significantly greater than ours.
The field of drug development is characterized by rapid technological change. New developments are expected to continue at a rapid pace in both industry and academia. There are many companies, both public and private, including large pharmaceutical companies, chemical companies and specialized biotechnology companies, engaged in developing products competitive with products that we have under development. Many of these companies have greater capital, human resources, research and development, manufacturing and marketing experience than we do. They may succeed in developing products that are more effective or less costly than any that we may develop. These competitors may also prove to be more successful than we are in production and marketing. In addition, academic, government and industry-based research groups compete intensely with us in recruiting qualified research personnel, in submitting patent filings for protection of intellectual property rights and in establishing corporate strategic alliances. We cannot be certain that research, discoveries and commercial developments by others will not render any of our programs or potential products noncompetitive.
Manufacturing
Bioprocessing Products
We manufacture Protein A bioprocessing products from recombinant strains of bacteria. We manufacture Protein A for GEHC under a supply agreement which extends through 2015. We purchase raw materials from more than one commercially established company and believe that the necessary raw materials are currently commercially available in sufficient quantities necessary to meet market demand. We utilize our own facility and third parties to carry out certain fermentation and recovery operations, while the purification, immobilization, packaging and quality control testing of our Protein A bioprocessing products are conducted at our facilities. We are ISO 9001 certified and utilize a formal quality system to maintain process control, traceability, and product conformance. We also practice continuous improvement initiatives based on routine internal audits, customer feedback and audits performed by our partners and customers. In addition, our business continuity management system focuses on key areas such as contingency planning, security stocks and off-site storage of raw materials and finished goods to ensure continuous supply of our products.
We recently introduced a second product line under the tradename Opus which is based on a technology for the production of pre-packed, “plug and play” chromatography columns for the purification of biopharmaceuticals and vaccines. Opus columns have the potential to improve manufacturing efficiencies by reducing time for column packing, set-up and cleaning. We plan to invest in the expansion of this product line this year based on specific customer feedback. We also expect to seek to acquire, license or distribute additional bioprocessing products which we can sell directly to end-users.
7
Table of Contents
Therapeutic Product Candidates
We currently rely, and will continue to rely for at least the next few years, upon contract manufacturers for both the procurement of raw materials and the production of our product candidates for use in our clinical trials. Our product candidates will need to be manufactured in a facility and by processes that comply with the FDA’s good manufacturing practices and other similar regulations. It may take a substantial period of time to begin manufacturing our products in compliance with such regulations. If we are unable to establish and maintain relationships with third parties for manufacturing sufficient quantities of our product candidates and their components that meet our planned time and cost parameters, the development and timing of our clinical trials may be adversely affected.
Government Regulation
The development of drug candidates is subject to regulation in the United States by the FDA and abroad by foreign equivalents. Product development and approval within the FDA regulatory framework usually takes a significant number of years and involves the expenditure of substantial capital resources. Timelines for development are uncertain.
Before clinical testing in the United States of any drug candidate may begin, FDA requirements for preclinical efficacy and safety must be completed. Required toxicity testing typically involves characterization of the drug candidate in several animal species. Safety and efficacy data are submitted to the FDA as part of an Investigational New Drug application and are reviewed by the FDA prior to the commencement of human clinical trials.
Clinical trials involve the administration of the drug to human volunteers or patients under the supervision of a qualified investigator, usually a physician, with an FDA-approved protocol. Human clinical trials are typically conducted in three sequential phases:
| • | Phase 1 clinical trials represent the initial administration of the investigational drug to a small group of human subjects to test for safety (pharmacovigilance), dose tolerability, absorption, biodistribution, metabolism, excretion and clinical pharmacology and, if possible, to gain early evidence regarding efficacy and potential biomarkers. |
| • | Phase 2 clinical trials typically involve a small sample of the actual intended patient population and seek to assess the efficacy of the drug for specific targeted indications, to determine dose tolerance and the optimal dose range, and to gather additional information relating to safety and potential adverse effects. |
| • | Once an investigational drug is found to have some efficacy and an acceptable safety profile in the targeted patient population, Phase 3 clinical trials are initiated to establish further clinical safety and efficacy of the investigational drug in a broader sample of the general patient population at multiple study sites in order to determine the overall risk-benefit ratio of the drug and to provide an adequate basis for product approval. The Phase 3 clinical development program consists of expanded, large-scale studies of patients with the target disease or disorder to obtain definitive statistical evidence of the efficacy and safety of the proposed product. |
All data obtained from a comprehensive development program are submitted in an NDA to the FDA and the corresponding agencies in other countries for review and approval. The NDA includes information pertaining to clinical studies and the manufacture of the new drug. Review of an NDA by the FDA can be a time-consuming process, and the FDA may request that we submit additional data or carry out additional studies.
Available Information
We maintain a website with the address www.repligen.com. We are not including the information contained on our website as a part of, or incorporating it by reference into, this annual report on Form 10-K. We make
8
Table of Contents
available free of charge through our website our annual reports on Form 10-K, quarterly reports on Form 10-Q and current reports on Form 8-K, and amendments to these reports, as soon as reasonably practicable after we electronically file such materials with, or furnish such materials to, the Securities and Exchange Commission. Our Code of Business Conduct and Ethics is also available free of charge through our website.
In addition, the public may read and copy any materials that we file with the Securities and Exchange Commission at the Securities and Exchange Commission’s Public Reference Room at 100 F Street, NE, Washington, D.C. 20549. The public may obtain information on the operation of the Public Reference Room by calling the Securities and Exchange Commission at 1-800-SEC-0330. Also, our filings with the Securities and Exchange Commission may be accessed through the Securities and Exchange Commission’s Electronic Data Gathering, Analysis and Retrieval (EDGAR) system at www.sec.gov.
9
Table of Contents
| Item 1A. | RISK FACTORS |
Investors should carefully consider the risk factors described below before making an investment decision.
If any of the events described in the following risk factors occur, our business, financial condition or results of operations could be materially harmed. In that case the trading price of our common stock could decline, and investors may lose all or part of their investment. Additional risks and uncertainties that we are unaware of or that we currently deem immaterial may also become important factors that affect Repligen.
This annual report on Form 10-K contains forward looking statements that involve risks and uncertainties. Our actual results could differ materially from those anticipated in these forward looking statements as a result of certain factors, including the risks faced by us described below and elsewhere in this annual report on Form 10-K.
We are dependent on others to develop, conduct clinical trials for, manufacture, market and sell our principal products.
We conduct some of our development activities, and conduct most of our commercialization activities, through collaborations. These collaborations include academic researchers as well as contracts with vendors. Our collaborations are heavily dependent on the efforts and activities of our collaborative partners. Our existing and any future collaborations may not be technically or commercially successful. For example, if any of our collaborative partners were to breach or terminate an agreement with us, reduce its funding or otherwise fail to conduct the collaboration successfully, we may need to devote additional internal resources to the program that is the subject of the collaboration, scale back or terminate the program or seek an alternative partner, any of which could lead to delays in development and/or commercialization of our products.
We depend on, and expect to continue to depend on, a limited number of customers for a high percentage of our revenues.
As a result, the loss of, or a significant reduction in orders from, any of these customers would significantly reduce our revenues and harm our results of operations. If a large customer purchases fewer of our products, defers orders or fails to place additional orders with us, our revenue could decline, and our operating results may not meet market expectations. In addition, if those customers order our products, but fail to pay on time or at all, our liquidity and operating results could be materially and adversely affected.
Royalty revenue from Bristol-Myers Squibb Company for sales of Orencia® could fail to materialize.
Our royalty agreement with Bristol provides for us to receive payments from Bristol based on their net sales of their Orencia® product in the United States through December 31, 2013. We have no control over Bristol’s sales and marketing practices for Orencia®, and Bristol has no obligation to use commercially reasonable efforts to sell Orencia®. Bristol’s sales could be significantly impacted by regulatory and market influences beyond our control, resulting in low or even no royalty revenue for us.
Our research activities may not identify a clinical candidate with appropriate efficacy, safety and pharmacology to support clinical trials in humans.
In order to conduct Phase 1 clinical trials in humans, we must first demonstrate suitable efficacy, safety and pharmacology characteristics of any potential drug candidates. If we are unsuccessful in these efforts, we may be forced to identify alternative drug candidates at substantial cost, or possibly abandon certain pre-clinical research activities.
10
Table of Contents
Our clinical trials may not be successful and we may not be able to develop and commercialize related products.
In order to obtain regulatory approvals for the commercial sale of our future therapeutic products, we and our collaborative partners will be required to complete extensive clinical trials in humans to demonstrate the safety and efficacy of the products. We have limited experience in conducting clinical trials.
The submission of an IND application may not result in FDA authorization to commence clinical trials. If clinical trials begin, we or our collaborative partners may not complete testing successfully within any specific time period, if at all, with respect to any of our products. Furthermore, we, our collaborative partners, or the FDA, may suspend clinical trials at any time on various grounds, including a finding that the subjects or patients are being exposed to unacceptable health risks. Clinical trials, if completed, may not show any potential product to be safe or effective. Thus, the FDA and other regulatory authorities may not approve any of our potential products for any indication.
The rate of completion of clinical trials is dependent in part upon the rate of enrollment of patients. Patient enrollment is a function of many factors, including the size of the patient population, the proximity of patients to clinical sites, the eligibility criteria for the study, and the existence of competitive clinical trials. Delays in planned patient enrollment may result in increased costs and delays in completion of clinical trials.
We may not obtain regulatory approvals; the approval process is costly and lengthy.
We must obtain regulatory approval for our ongoing development activities and before marketing or selling any of our future therapeutic products. We may not receive regulatory approvals to conduct clinical trials of our products or to manufacture or market our products. In addition, regulatory agencies may not grant such approvals on a timely basis or may revoke previously granted approvals.
The process of obtaining FDA and other required regulatory approvals, such as the approval we are seeking with our NDA submission for RG1068, is lengthy and may be expensive. The time required for FDA and other clearances or approvals is uncertain and typically takes a number of years, depending on the complexity and novelty of the product. Our RG1068 NDA submission to the FDA will be based on a single re-read of our Phase 3 trial results. The FDA may not deem this to be sufficient for approval. Our analysis of data obtained from preclinical and clinical activities is subject to confirmation and interpretation by regulatory authorities, which could delay, limit or prevent regulatory approval. Any delay in obtaining or failure to obtain required clearance or approvals could materially adversely affect our ability to generate revenues from the affected product. We have only limited experience in filing and prosecuting applications necessary to gain regulatory approvals.
We are also subject to numerous foreign regulatory requirements governing the design and conduct of the clinical trials and the manufacturing and marketing of our future products. The approval procedure varies among countries. The time required to obtain foreign approvals often differs from that required to obtain FDA approvals. Moreover, approval by the FDA does not ensure approval by regulatory authorities in other countries (or vice versa).
All of the foregoing regulatory risks also are applicable to development, manufacturing and marketing undertaken by our collaborative partners or other third parties.
Even if we obtain marketing approval, our therapeutic products will be subject to ongoing regulatory review, which may be expensive and may affect our ability to successfully commercialize our products.
Even if we or our collaborative partners receive regulatory approval of a product, such approval may be subject to limitations on the indicated uses for which the product may be marketed, which may limit the size of the market for the product or contain requirements for costly post-marketing follow-up studies. The
11
Table of Contents
manufacturers of our products for which we or our collaborative partners have obtained marketing approval will be subject to continued review and periodic inspections by the FDA and other regulatory authorities. The subsequent discovery of previously unknown problems with the product, clinical trial subjects, or with a manufacturer or facility may result in restrictions on the product or manufacturer, including withdrawal of the product from the market.
If we or our collaborative partners fail to comply with applicable regulatory requirements, we may be subject to fines, suspension or withdrawal of regulatory approvals, product recalls, seizure of products, operating restrictions, and criminal prosecution.
If we are unable to obtain, maintain and enforce patents or regulatory exclusivity (orphan drug or new chemical entity exclusivity) for our products, we may not be able to succeed commercially.
We endeavor to obtain and maintain patent and trade secret protection for our products and processes when available in order to protect them from unauthorized use and to produce a financial return consistent with the significant time and expense required to bring our products to market. Our success will depend, in part, on our ability to:
| • | obtain and maintain patent protection for our products and manufacturing processes; |
| • | preserve our trade secrets; |
| • | operate without infringing the proprietary rights of third parties; and |
| • | secure licenses from others on acceptable terms. |
We cannot be sure that any patent applications relating to our products that we will file in the future or that any currently pending applications will issue on a timely basis, if ever. Since patent applications in the United States filed prior to November 2000 are maintained in secrecy until patents issue and since publication of discoveries in the scientific or patent literature often lag behind actual discoveries, we cannot be certain that we were the first to make the inventions covered by each of our pending patent applications or that we were the first to file patent applications for such inventions. Even if patents are issued, the degree of protection afforded by such patents will depend upon the:
| • | scope of the patent claims; |
| • | validity and enforceability of the claims obtained in such patents; and |
| • | our willingness and financial ability to enforce and/or defend them. |
The patent position of biotechnology and pharmaceutical firms is often highly uncertain and usually involves complex legal and scientific questions. Moreover, no consistent policy has emerged in the United States or in many other countries regarding the breadth of claims allowed in biotechnology patents. Patents which may be granted to us in certain foreign countries may be subject to opposition proceedings brought by third parties or result in suits by us, which may be costly and result in adverse consequences for us.
In some cases, litigation or other proceedings may be necessary to assert claims of infringement, to enforce patents issued to us or our licensors, to protect trade secrets, know-how or other intellectual property rights we own or to determine the scope and validity of the proprietary rights of third parties. Such litigation could result in substantial cost to us and diversion of our resources. An adverse outcome in any such litigation or proceeding could have a material adverse effect on our business, financial condition and results of operations.
If our competitors prepare and file patent applications in the United States that claim technology also claimed by us, we may be required to participate in interference proceedings declared by the U.S. Patent and Trademark Office to determine priority of invention, which would result in substantial costs to us.
12
Table of Contents
Since some of our U.S. patents covering recombinant Protein A have expired, we may face increased competition which could harm our results of operations, financial condition, cash flow and future prospects.
Other companies could begin manufacturing and selling recombinant Protein A in the U.S. and may directly compete with us on certain Protein A products. This may induce us to sell Protein A at lower prices and may erode our market share which could adversely affect our results of operations, financial condition, cash flow and future prospects.
Our freedom to develop our product candidates may be challenged by others, and we may have to engage in litigation to determine the scope and validity of competitors’ patents and proprietary rights, which, if we do not prevail, could harm our business, results of operations, financial condition, cash flow and future prospects.
There has been substantial litigation and other proceedings regarding the complex patent and other intellectual property rights in the pharmaceutical and biotechnology industries. We have been a party to, and in the future may become a party to, patent litigation or other proceedings regarding intellectual property rights.
Other types of situations in which we may become involved in patent litigation or other intellectual property proceedings include:
| • | We may initiate litigation or other proceedings against third parties to seek to invalidate the patents held by such third parties or to obtain a judgment that our products or services do not infringe such third parties’ patents. |
| • | We may initiate litigation or other proceedings against third parties to seek to enforce our patents against infringement. |
| • | If our competitors file patent applications that claim technology also claimed by us, we may participate in interference or opposition proceedings to determine the priority of invention. |
| • | If third parties initiate litigation claiming that our processes or products infringe their patent or other intellectual property rights, we will need to defend against such claims. |
The cost to us of any patent litigation or other proceeding, even if resolved in our favor, could be substantial. Some of our competitors may be able to sustain the cost of such litigation or proceedings more effectively than we can because of their substantially greater financial resources. If a patent litigation or other intellectual property proceeding is resolved unfavorably to us, we or our collaborative partners may be enjoined from manufacturing or selling our products and services without a license from the other party and be held liable for significant damages. The failure to obtain any required license on commercially acceptable terms or at all may harm our business, results of operations, financial condition, cash flow and future prospects.
Uncertainties resulting from the initiation and continuation of patent litigation or other proceedings could have a material adverse effect on our ability to compete in the marketplace. Patent litigation and other proceedings may also absorb significant management time, attention and resources.
For more information about the legal proceedings in which we were involved but which have been settled, please see “Legal Proceedings.”
We may become involved in litigation or other proceedings with collaborative partners, which may be time consuming, costly and could result in delays in our development and commercialization efforts.
We conduct some of our development activities, and conduct most of our commercialization activities, through arrangements with third parties. Any disputes with such partners that lead to litigation or similar
13
Table of Contents
proceedings may result in us incurring legal expenses, as well as facing potential legal liability. Such disputes, litigation or other proceedings are also time consuming and may cause delays in our development and commercialization efforts.
We have limited sales and marketing experience and capabilities.
We have limited sales, marketing and distribution experience and capabilities. We may, in some instances, rely significantly on sales, marketing and distribution arrangements with our collaborative partners and other third parties. In these instances, our future revenues will be materially dependent upon the success of the efforts of these third parties.
If in the future we determine to perform sales, marketing and distribution functions ourselves, we would face a number of additional risks, including:
| • | we may not be able to attract and build a significant marketing staff or sales force; |
| • | the cost of establishing a marketing staff or sales force may not be justifiable in light of any product revenues; and |
| • | our direct sales and marketing efforts may not be successful. |
We have limited pharmaceutical manufacturing capabilities and will be dependent on third party manufacturers.
We have limited pharmaceutical manufacturing experience and no commercial or pilot scale manufacturing facilities for the production of pharmaceuticals. In order to continue to develop pharmaceutical products, apply for regulatory approvals and, ultimately, commercialize any products, we may need to develop, contract for, or otherwise arrange for the necessary manufacturing capabilities.
We currently rely upon third parties to produce material for preclinical and clinical testing purposes and expect to continue to do so in the future. We also expect to rely upon third parties, including our collaborative partners, to produce materials required for the commercial production of certain of our products if we succeed in obtaining the necessary regulatory approvals. We believe that there is no proprietary aspect to the manufacture of our product candidates. However, there are only a limited number of manufacturers that operate under the FDA’s regulations for good manufacturing practices which are capable of and/or approved to manufacture our product candidates. Timing for the initiation of new manufacturers is uncertain, and, if we are unable to arrange for third party manufacturing of our product candidates on a timely basis, or to do so on commercially reasonable terms, we may not be able to complete development of our product candidates or market them, if they are approved.
The manufacture of products by us and our collaborative partners and suppliers is subject to regulation by the FDA and comparable agencies in foreign countries. Delay in complying or failure to comply with such manufacturing requirements could materially adversely affect the marketing of our products.
If we are unable to continue to hire and retain skilled personnel, then we will have trouble developing and marketing our products.
Our success depends largely upon the continued service of our management and scientific staff and our ability to attract, retain and motivate highly skilled technical, scientific, management, regulatory, clinical and marketing personnel. Potential employees with an expertise in the field of molecular biology, biochemistry, regulatory affairs and/or clinical development of new drug and biopharmaceutical manufacturing are not generally available in the market and are difficult to attract and retain. We also face significant competition for such personnel from other companies, research and academic institutions, government and other organizations who have superior funding and resources to be able to attract such personnel. The loss of key personnel or our inability to hire and retain personnel who have technical, scientific or regulatory compliance backgrounds could materially adversely affect our product development efforts and our business.
14
Table of Contents
The market may not be receptive to our products upon their introduction.
The commercial success of our therapeutic products that are approved for marketing will depend upon their acceptance by the medical community and third party payors as being clinically useful, cost effective and safe. All of the products that we are developing are based upon new technologies or therapeutic approaches. As a result, it is hard to predict market acceptance of our products or changes in third party payor reimbursement practices in the U.S. and abroad.
Other factors that we believe will materially affect market acceptance of our products and services include:
| • | the timing of receipt of marketing approvals and the countries in which such approvals are obtained; |
| • | the safety, efficacy and ease of administration of our products; |
| • | the success of physician education programs; |
| • | the availability of government and third party payor reimbursement of our products; |
| • | additional data requests from third party payors to support cost effectiveness before reimbursement of our products; and |
| • | competition from products which may offer better safety, efficacy or lower cost. |
Healthcare reform measures could adversely affect our business.
The efforts of governmental and third-party payors to contain or reduce the costs of health care may adversely affect the business and financial condition of pharmaceutical and biotechnology companies. Specifically, in both the United States and some foreign jurisdictions, there have been a number of legislative and regulatory proposals to change the health care system in ways that could affect our ability to sell our products profitably. The U.S. Congress passed the America Affordable Health Choices Act of 2009 and is considering a number of proposals that are intended to reduce or limit the growth of health care costs and which could significantly transform the market for pharmaceuticals products. We expect further federal and state proposals and health care reforms to continue to be proposed by legislators, which could limit the prices that can be charged for the products we develop and may limit our commercial opportunity. In the United States, the Medicare Prescription Drug, Improvement, and Modernization Act of 2003, also called the Medicare Modernization Act, or MMA, changed the way Medicare covers and pays for pharmaceutical products. These cost reduction initiatives and other provisions of this legislation could decrease the coverage and price that we receive for any approved products and could seriously harm our business. While the MMA applies only to drug benefits for Medicare beneficiaries, private payors often follow Medicare coverage policy and payment limitations in setting their own reimbursement rates, and any reduction in reimbursement that results from the MMA may result in a similar reduction in payments from private payors. The continuing efforts of government and other third-party payors to contain or reduce the costs of health care through various means may limit our commercial opportunity. In addition, the pendency or approval of such proposals could result in a decrease in the price of Repligen’s common stock or limit our ability to raise capital or to enter into collaborations or license rights to our products.
We compete with pharmaceutical and biotechnology companies who are capable of developing new approaches that could make our products and technology obsolete.
The market for therapeutic and commercial products is intensely competitive, rapidly evolving and subject to rapid technological change. Pharmaceutical and biotechnology companies may have substantially greater financial, manufacturing, marketing, and research and development resources than we have. New approaches by these competitors may make our products and technologies obsolete or noncompetitive.
15
Table of Contents
We have incurred substantial losses, we may continue to incur operating losses and we will not be successful until we reverse this trend.
Although the company had significant net income in fiscal years 2009 and 2008 as a result of the ImClone and Bristol settlements, we have historically incurred operating losses since our founding in 1981. We incurred losses in fiscal years 2011 and 2010, and we expect to incur operating losses for the foreseeable future.
While we generate revenue from bioprocessing product sales and began receiving royalty payments in fiscal year 2009 from Bristol for the net sales of their Orencia® product in the United States, this revenue may not be sufficient to cover the costs of our clinical trials and drug development programs. We plan to continue to invest in key research and development activities. As a result, we will need to generate significant revenues in order to achieve profitability. We cannot be certain whether or when this will occur because of the significant uncertainties that affect our business.
We may need to obtain additional capital resources for our drug development programs, or we may be unable to develop or discover new drugs.
We may need additional long-term financing to develop our drug development programs through the clinical trial process as required by the FDA and to develop our commercial products business. We also may need additional long-term financing to support future operations and capital expenditures, including capital for additional personnel and facilities. If we spend more money than currently expected for our drug development programs and our commercial products business, we may need to raise additional capital by selling debt or equity securities, by entering into strategic relationships or through other arrangements. Debt financing, if available, may involve agreements that include covenants limiting or restricting our ability to take specific actions such as incurring additional debt, making capital expenditures or declaring dividends. If we raise additional funds through collaboration, strategic alliance and licensing arrangements with third parties, we may have to relinquish valuable rights to our technologies or product candidates, or grant licenses on terms that are not favorable to us. We may be unable to raise any additional amounts on reasonable terms or when they are needed due to the volatile nature of the biotechnology marketplace. If we are unable to raise this additional capital, we may have to delay or postpone critical clinical studies or abandon other development programs.
Pursuing and completing potential acquisitions could divert management attention and financial resources and may not produce the desired business results.
While we currently do not have commitments or agreements with respect to any acquisitions, as part of our growth strategy, we may make selected acquisitions of complementary businesses. If we pursue any acquisition, our management, in addition to their operational responsibilities, could spend a significant amount of time and management and financial resources to pursue and integrate any acquired business with our existing business. To fund the purchase price of an acquisition, we might use capital stock, cash or a combination of both. Alternatively, we may borrow money from a bank or other lender. If we use capital stock, our stockholders will experience dilution. If we use cash, our financial liquidity may be reduced. If we take on debt, it may involve agreements that include covenants limiting or restricting our ability to take specific actions such as incurring additional debt, making capital expenditures or declaring dividends. If we raise additional funds through collaboration, strategic alliance and licensing arrangements with third parties, we may have to relinquish valuable rights to our technologies or product candidates, or grant licenses on terms that are not favorable to us. In addition, from an accounting perspective, an acquisition may involve amortization of significant amounts of other intangible assets that could adversely affect our ability to maintain profitability.
Despite the investment of these management and financial resources, an acquisition may not produce the revenue, earnings or business synergies that we anticipated or may produce such synergies less rapidly than anticipated for a variety of reasons, including:
| • | difficulties in the assimilation of the operations, operational systems deployments, technologies, services, products and personnel of the acquired company; |
16
Table of Contents
| • | failure of acquired technologies and services to perform as expected; |
| • | risks of entering markets in which we have no, or limited, prior experience; |
| • | effects of any undisclosed or potential legal or tax liabilities of the acquired company; |
| • | compliance with additional laws, rules or regulations that we may become subject to as a result of an acquisition that might restrict our ability to operate; and |
| • | the loss of key employees of the acquired company. |
We may not be able to successfully address these problems. Our future operating results may depend to a significant degree on our ability to successfully integrate acquisitions and manage operations while controlling expenses and cash outflows.
We may be exposed to liabilities under the Foreign Corrupt Practices Act, and any determination that we violated the Foreign Corrupt Practices Act could have a material adverse effect on our business.
We are subject to the Foreign Corrupt Practice Act (the “FCPA”) and other laws that prohibit improper payments or offers of payments to foreign governments and their officials and political parties by U.S. persons and issuers as defined by the statute for the purpose of obtaining or retaining business. We have operations, agreements with third parties and make sales in jurisdictions outside of the U.S., which may experience corruption. Our activities in jurisdictions outside of the U.S. create the risk of unauthorized payments or offers of payments by one of our employees, consultants, sales agents or distributors, because these parties are not always subject to our control. It is our policy to implement safeguards to discourage these practices by our employees. However, our existing safeguards and any future improvements may prove to be less than effective, and the employees, consultants, sales agents or distributors of our Company may engage in conduct for which we might be held responsible. Violations of the FCPA may result in severe criminal or civil sanctions, and we may be subject to other liabilities, which could negatively affect our business, operating results and financial condition. In addition, the government may seek to hold us liable for successor liability FCPA violations committed by any companies in which we invest or that we acquire.
Our stock price could be volatile, which could cause shareholders to lose part or all of their investment.
The market price of our common stock, like that of the common stock of many other development stage biotechnology companies, is highly volatile. In addition, the stock market has experienced extreme price and volume fluctuations. This volatility has significantly affected the market prices of securities of many biotechnology and pharmaceutical companies for reasons frequently unrelated to or disproportionate to the operating performance of the specific companies. These broad market fluctuations may adversely affect the market price of our common stock.
Provisions in our certificate of incorporation and by-laws and of Delaware law may prevent or delay an acquisition of our Company, which could decrease the trading price of our common stock.
Our certificate of incorporation, by-laws and Delaware law contain provisions that are intended to deter coercive takeover practices and inadequate takeover bids by making such practices or bids unacceptably expensive to the raider and to encourage prospective acquirors to negotiate with our Board of Directors rather than to attempt a hostile takeover. These provisions include our Board of Directors’ ability to issue preferred stock without stockholder approval and Delaware law’s various restrictions on mergers and other business combinations between us and any holder of 15% or more of our outstanding common stock. In addition, we maintain a shareholder rights plan which may deter a potential acquiror from pursuing an offer for our company.
We believe these provisions protect our stockholders from coercive or otherwise unfair takeover tactics by requiring potential acquirors to negotiate with our Board of Directors and by providing our Board of Directors
17
Table of Contents
with more time to assess any acquisition proposal. These provisions are not intended to make our company immune from takeovers. However, these provisions apply even if the offer may be considered beneficial by some stockholders and could delay or prevent an acquisition that our Board of Directors determines is not in the best interests of our company and our stockholders.
| Item 1B. | UNRESOLVED STAFF COMMENTS |
None.
| Item 2. | PROPERTIES |
We lease approximately 25,000 square feet of space located in Waltham, Massachusetts which serves as our corporate headquarters. We also conduct manufacturing, research and development, marketing and administrative operations at this facility. In addition, we lease approximately 10,000 square feet of space at a second location in Waltham for expanded manufacturing and administrative operations. Both of these leases expire in 2012. During fiscal 2011, we incurred total rental costs for both facilities of approximately $686,000.
| Item 3. | LEGAL PROCEEDINGS |
From time to time, we may be subject to other legal proceedings and claims in the ordinary course of business. We are not currently aware of any such proceedings or claims that we believe will have, individually or in the aggregate, a material adverse effect on our business, financial condition or results of operations.
| Item 4. | (REMOVED AND RESERVED) |
18
Table of Contents
PART II
| Item 5. | MARKET FOR REGISTRANT’S COMMON EQUITY, RELATED STOCKHOLDER MATTERS AND ISSUER PURCHASES OF EQUITY SECURITIES |
Market Information
Our common stock is traded on the Nasdaq Global Market under the symbol “RGEN.” The quarterly high and low closing prices for our common stock are shown in the following table.
| Fiscal Year 2011 | Fiscal Year 2010 | |||||||||||||||
| High | Low | High | Low | |||||||||||||
| First Quarter |
$ | 3.92 | $ | 3.13 | $ | 5.50 | $ | 3.92 | ||||||||
| Second Quarter |
$ | 3.56 | $ | 3.15 | $ | 5.55 | $ | 4.96 | ||||||||
| Third Quarter |
$ | 4.75 | $ | 3.29 | $ | 5.13 | $ | 3.74 | ||||||||
| Fourth Quarter |
$ | 5.34 | $ | 3.36 | $ | 4.06 | $ | 3.35 | ||||||||
Stockholders and Dividends
As of May 24, 2011, there were approximately 636 stockholders of record of our common stock. We have not paid any dividends since our inception and do not intend to pay any dividends on our common stock in the foreseeable future. We anticipate that we will retain all earnings, if any, to support our operations and our proprietary drug development programs. Any future determination as to the payment of dividends will be at the sole discretion of our Board of Directors and will depend on our financial condition, results of operations, capital requirements and other factors our Board of Directors deems relevant.
Equity Compensation Plan Information
See Part III, Item 12 for information regarding securities authorized for issuance under our equity compensation plans.
Issuer Purchases of Equity Securities
In June 2008, the Board of Directors authorized a program to repurchase up to 1.25 million shares of our common stock to be repurchased at the discretion of management from time to time in the open market or through privately negotiated transactions. The repurchase program has no set expiration date and may be suspended or discontinued at any time. For the twelve-month period ended March 31, 2009, the Company repurchased 492,827 shares of common stock, for an aggregate purchase price of $1,969,240, leaving 757,173 shares remaining under this authorization. Since March 31, 2009, we have made no additional repurchases of shares of common stock.
19
Table of Contents
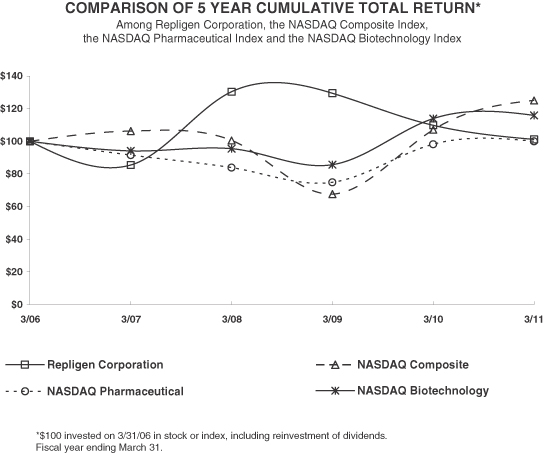
The information contained in the performance graph shall not be deemed to be “soliciting material” or to be “filed” with the Securities and Exchange Commission, and such information shall not be incorporated by reference into any future filing under the Securities Act or Exchange Act, except to the extent that Repligen specifically incorporates it by reference into such filing.
20
Table of Contents
| Item 6. | SELECTED FINANCIAL DATA |
The following selected financial data are derived from the audited financial statements of Repligen. The selected financial data set forth below should be read in conjunction with our financial statements and the related notes thereto and “Management’s Discussion and Analysis of Financial Condition and Results of Operations” included elsewhere in this report and our Annual Report on Form 10-K for the years ended March 31, 2010, 2009, 2008 and 2007.
| Years ended March 31, | ||||||||||||||||||||
| 2011 | 2010 | 2009 | 2008 | 2007 | ||||||||||||||||
| (In thousands except per share amounts) | ||||||||||||||||||||
| Revenue: |
||||||||||||||||||||
| Product revenue |
$ | 14,961 | $ | 10,305 | $ | 14,529 | $ | 18,587 | $ | 13,074 | ||||||||||
| Royalty and other revenue |
12,330 | 10,666 | 14,833 | 709 | 1,000 | |||||||||||||||
| Total revenue |
27,291 | 20,971 | 29,362 | 19,296 | 14,074 | |||||||||||||||
| Operating expenses: |
||||||||||||||||||||
| Cost of product revenue |
5,580 | 4,159 | 5,686 | 6,160 | 3,615 | |||||||||||||||
| Cost of royalty and other revenue |
1,537 | 1,347 | 1,091 | — | — | |||||||||||||||
| Research and development |
12,529 | 14,160 | 12,772 | 7,241 | 5,924 | |||||||||||||||
| Selling, general and administrative |
8,019 | 7,072 | 5,933 | 10,173 | 6,360 | |||||||||||||||
| Net gain from litigation settlement |
— | — | — | (40,170 | ) | — | ||||||||||||||
| Total operating expenses (income) |
27,665 | 26,738 | 25,482 | (16,596 | ) | 15,899 | ||||||||||||||
| (Loss) income from operations |
(374 | ) | (5,767 | ) | 3,880 | 35,892 | (1,825 | ) | ||||||||||||
| Interest expense |
(26 | ) | (2 | ) | (3 | ) | (9 | ) | (11 | ) | ||||||||||
| Investment income |
357 | 870 | 1,896 | 2,051 | 947 | |||||||||||||||
| Income (loss) before taxes |
(43 | ) | (4,899 | ) | 5,773 | 37,934 | (889 | ) | ||||||||||||
| Income tax (benefit) provision |
— | (835 | ) | 27 | 827 | — | ||||||||||||||
| Net income (loss) |
$ | (43 | ) | $ | (4,064 | ) | $ | 5,746 | $ | 37,107 | $ | (889 | ) | |||||||
| Earnings (loss) per share: |
||||||||||||||||||||
| Basic |
$ | (0.00 | ) | $ | (0.13 | ) | $ | 0.19 | $ | 1.20 | $ | (0.03 | ) | |||||||
| Diluted |
$ | (0.00 | ) | $ | (0.13 | ) | $ | 0.18 | $ | 1.18 | $ | (0.03 | ) | |||||||
| Weighted average shares outstanding: |
||||||||||||||||||||
| Basic |
30,782 | 30,752 | 30,958 | 30,834 | 30,379 | |||||||||||||||
| Diluted |
30,782 | 30,752 | 31,290 | 31,321 | 30,379 | |||||||||||||||
| As of March 31, | ||||||||||||||||||||
| 2011 | 2010 | 2009 | 2008 | 2007 | ||||||||||||||||
| (In thousands) | ||||||||||||||||||||
| Balance Sheet Data: |
||||||||||||||||||||
| Cash and marketable securities (1) |
$ | 61,503 | $ | 59,146 | $ | 63,961 | $ | 60,589 | $ | 22,627 | ||||||||||
| Working capital |
51,221 | 55,024 | 50,235 | 49,831 | 22,394 | |||||||||||||||
| Total assets |
72,294 | 71,420 | 73,755 | 68,840 | 29,076 | |||||||||||||||
| Long-term obligations |
584 | 642 | 82 | 143 | 200 | |||||||||||||||
| Accumulated deficit |
(117,965 | ) | (117,921 | ) | (113,857 | ) | (120,577 | ) | (157,683 | ) | ||||||||||
| Stockholders’ equity |
67,087 | 66,120 | 69,123 | 64,107 | 25,538 | |||||||||||||||
| (1) | Excludes restricted cash of $200 related to our headquarters’ lease arrangement for all years presented. |
21
Table of Contents
| Item 7. | MANAGEMENT’S DISCUSSION AND ANALYSIS OF FINANCIAL CONDITION AND RESULTS OF OPERATIONS |
This annual report on Form 10-K contains forward-looking statements which are made pursuant to the safe harbor provisions of Section 27A of the Securities Act of 1933, as amended, and Section 21E of the Securities Exchange Act of 1934, as amended (the “Exchange Act”). The forward-looking statements in this annual report on Form 10-K do not constitute guarantees of future performance. Investors are cautioned that statements in this annual report on Form 10-K that are not strictly historical statements, including, without limitation, statements regarding current or future financial performance, potential impairment of future earnings, management’s strategy, plans and objectives for future operations or acquisitions, clinical trials and results, litigation strategy, product candidate research, development and regulatory approval, selling, general and administrative expenditures, intellectual property, development and manufacturing plans, availability of materials and product and adequacy of capital resources and financing plans constitute forward-looking statements. Such forward-looking statements are subject to a number of risks and uncertainties that could cause actual results to differ materially from those anticipated, including, without limitation, the risks identified under the caption “Risk Factors” and other risks detailed in this annual report on Form 10-K and our other filings with the Securities and Exchange Commission. We assume no obligation to update any forward-looking information contained in this annual report on Form 10-K, except as required by law.
Overview
We are an integrated biopharmaceutical company focused on the development and commercialization of innovative therapies that deliver the benefits of protein therapies to patients and clinicians in the fields of neurology and gastroenterology. We are currently conducting a number of drug development programs for diseases such as pancreatitis, Friedreich’s ataxia and spinal muscular atrophy. We also have a bioprocessing business that focuses on the development and commercialization of biologics that are used in the production of biopharmaceuticals. In addition, we have out-licensed certain biologics intellectual property from which we receive royalties from Bristol-Myers Squibb Company (“Bristol”) on their net sales in the United States of their product Orencia®. Total revenue in fiscal 2011 increased significantly as compared to fiscal 2010 and is primarily due to an increase in our bioprocessing product sales as we experienced increased orders from our largest customer as it rebounded from relatively low levels of activity in the prior period.
CRITICAL ACCOUNTING POLICIES AND ESTIMATES
While our significant accounting polices are more fully described in the notes to our financial statements, we have identified the policies and estimates below as critical to our business operations and the understanding of our results of operations. The impact of and any associated risks related to these policies on our business operations are discussed throughout “Management’s Discussion and Analysis of Financial Condition” and “Results of Operations” where such policies affect our reported and expected financial results.
Revenue recognition
We generate product revenues from the sale of bioprocessing products to customers in the pharmaceutical and process chromatography industries. We recognize revenue related to product sales upon delivery of the product to the customer as long as there is persuasive evidence of an arrangement, the sales price is fixed or determinable and collection of the related receivable is reasonably assured. Determination of whether these criteria have been met are based on management’s judgments primarily regarding the fixed nature of the fee charged for product delivered, and the collectability of those fees. We have a few longstanding customers who comprise the majority of revenue and have excellent payment history and therefore we do not require collateral. We have had no significant write-offs of uncollectible invoices in the periods presented.
22
Table of Contents
At the time of sale, we also evaluate the need to accrue for warranty and sales returns. The supply agreements we have with our customers and related purchase orders identify the terms and conditions of each sale and the price of the goods ordered. Due to the nature of the sales arrangements, inventory produced for sale is tested for quality specifications prior to shipment. Since the product is manufactured to order and in compliance with required specifications prior to shipment, the likelihood of sales return, warranty or other issues is largely diminished. Sales returns and warranty issues are infrequent and have had nominal impact on our financial statements historically.
In April 2008, we settled our outstanding litigation with Bristol and began recognizing royalty revenue in fiscal year 2009 for Bristol’s net sales in the United States of Orencia® which is used in the treatment of rheumatoid arthritis. Pursuant to the Bristol Settlement, we recognized $10,251,000, $8,980,000 and $13,383,000 in royalty revenue in fiscal 2011, 2010 and 2009, respectively. The $13,383,000 royalty revenue in fiscal 2009 included a $5.0 million initial payment and $1.3 million for sales of Orencia® prior to fiscal 2009, in addition to royalties earned on sales of Orencia® during our fiscal 2009. Revenue earned from Bristol royalties is recorded in the periods when it is earned based on royalty reports sent by Bristol to us. We have no continuing obligations to Bristol as a result of this settlement.
Additionally, during fiscal years 2010 and 2009, we earned and recognized approximately $1,009,000 and $776,000, respectively in royalty revenue from ChiRhoClin for their sales of secretin. Revenue earned from ChiRhoClin royalties was recorded in the periods when it was earned based on royalty reports sent by ChiRhoClin to us. As of December 31, 2009, ChiRhoClin had fulfilled its royalty obligations to us for its sales of secretin. We do not expect to recognize any further royalty revenue from ChiRhoClin.
During fiscal 2011, we recognized approximately $1,346,000 of revenue from sponsored research and development projects under agreements with the Muscular Dystrophy Association, the National Institutes of Health / Scripps Research Institute, Go Friedreich’s Ataxia Research (“GoFar”), and the Friedreich’s Ataxia Research Alliance. In fiscal 2011, we also recognized approximately $733,000 in one-time grants under the Qualifying Therapeutic Discovery Project Program which was created in March 2010 as part of the Patient Protection and Affordability Care Act. In fiscal 2010, we recognized approximately $677,000 of revenue from sponsored research and development projects under agreements with the Muscular Dystrophy Association, the Friedreich’s Ataxia Research Alliance and the National Ataxia Foundation. During fiscal 2009, we recognized approximately $674,000 of revenue from sponsored research and development projects under agreements with the Muscular Dystrophy Association and GoFAR, respectively.
Research revenue is recognized when the expense has been incurred and services have been performed. Determination of which incurred costs qualify for reimbursement under the terms of our contractual agreements and the timing of when such costs were incurred involves the judgment of management. Our calculations are based upon the agreed-upon terms as stated in the arrangements. However, should the estimated calculations change or be challenged by other parties to the agreements, research revenue may be adjusted in subsequent periods. The calculations have not historically changed or been challenged, and we do not anticipate any significant subsequent change in revenue related to sponsored research and development projects.
There have been no material changes to our initial estimates related to revenue recognition in any periods presented in the accompanying financial statements.
Inventories
Inventories relate to our bioprocessing business. We value inventory at cost or, if lower, fair market value using the first-in, first-out method. We review our inventory at least quarterly and record a provision for excess and obsolete inventory based on our estimates of expected sales volume, production capacity and expiration dates of raw materials, work-in process and finished products. Expected sales volumes are determined based on supply forecasts provided by key customers for the next three to twelve months. We write down inventory that has
23
Table of Contents
become obsolete, inventory that has a cost basis in excess of its expected net realizable value, and inventory in excess of expected requirements to cost of product revenue. Manufacturing of bioprocessing finished goods is done to order and tested for quality specifications prior to shipment.
A change in the estimated timing or amount of demand for our products could result in additional provisions for excess inventory quantities on hand. Any significant unanticipated changes in demand or unexpected quality failures could have a significant impact on the value of inventory and reported operating results. During all periods presented in the accompanying financial statements, there have been no material adjustments related to a revised estimate of inventory valuations.
Business Combinations
Amounts paid for acquisitions are allocated to the assets acquired and liabilities assumed, if any, based on their fair values at the dates of acquisition. The fair value of identifiable intangible assets is based on detailed valuations that use information and assumptions determined by management. Any excess of purchase price over the fair value of the net tangible and intangible assets acquired is allocated to goodwill. The fair value of contingent consideration includes estimates and judgments made by management regarding the extent of royalties to be earned in excess of the defined minimum royalties. Management updates these estimates and the related fair value of contingent consideration at each reporting period.
Accrued liabilities
We estimate accrued liabilities by identifying services performed on our behalf, estimating the level of service performed and determining the associated cost incurred for such service as of each balance sheet date. Examples of estimated accrued expenses include:
| • | Fees paid to contract manufacturers in conjunction with the production of clinical materials. These expenses are normally determined through a contract or purchase order issued by us; |
| • | Service fees paid to organizations for their performance in conducting clinical trials. These expenses are determined by contracts in place for those services and communications with project managers on costs which have been incurred as of each reporting date; |
| • | Professional and consulting fees incurred with law firms, audit and accounting service providers and other third party consultants. These expenses are determined by either requesting those service providers to estimate unbilled services at each reporting date for services incurred or tracking costs incurred by service providers under fixed fee arrangements. |
We have processes in place to estimate the appropriate amounts to record for accrued liabilities, which principally involve the applicable personnel reviewing the services provided. In the event that we do not identify certain costs which have begun to be incurred or we under or over-estimate the level of services performed or the costs of such services, the reported expenses for that period may be too low or too high. The date on which certain services commence, the level of services performed on or before a given date, and the cost of such services are often judgmental. We make these judgments based upon the facts and circumstances known at the date of the financial statements.
A change in the estimated cost or volume of services provided could result in additional accrued liabilities. Any significant unanticipated changes in such estimates could have a significant impact on our accrued liabilities and reported operating results. There have been no material adjustments to our accrued liabilities in any of the periods presented in the accompanying financial statements.
Stock-based compensation
We use the Black-Scholes option pricing model to calculate the fair value of share-based awards on the grant date.
24
Table of Contents
The expected term of options granted represents the period of time for which the options are expected to be outstanding and is derived from our historical stock option exercise experience and option expiration data. The expected life of stock options granted is based on the simplified method. Accordingly, the expected term is presumed to be the midpoint between the vesting date and the end of the contractual term. In addition, for purposes of estimating the expected term, we have aggregated all individual option awards into one group as we do not expect substantial differences in exercise behavior among its employees. The expected volatility is a measure of the amount by which our stock price is expected to fluctuate during the expected term of options granted. We determined the expected volatility based upon the historical volatility of our common stock over a period commensurate with the option’s expected term, exclusive of any events not reasonably anticipated to recur over the option’s expected term. The risk-free interest rate is the implied yield available on U.S. Treasury zero-coupon issues with a remaining term equal to the option’s expected term on the grant date. We have never declared or paid any cash dividends on any of our capital stock and do not expect to do so in the foreseeable future. Accordingly, we use an expected dividend yield of zero to calculate the grant-date fair value of a stock option.
We recognize compensation expense on a straight-line basis over the requisite service period based upon options that are ultimately expected to vest, and accordingly, such compensation expense has been adjusted by an amount of estimated forfeitures. Forfeitures represent only the unvested portion of a surrendered option. Forfeitures are estimated at the time of grant and revised, if necessary, in subsequent periods if actual forfeitures differ from those estimates. Based on an analysis of historical data, we have calculated an 8% annual forfeiture rate for non-executive level employees, a 3% annual forfeiture rate for executive level employees, and a 0% forfeiture rate for non-employee members of the Board of Directors, which we believe is a reasonable assumption to estimate forfeitures. However, the estimation of forfeitures requires significant judgment, and to the extent actual results or updated estimates differ from our current estimates, such amounts will be recorded as a cumulative adjustment in the period estimates are revised.
For the years ended March 31, 2011, 2010 and 2009, we recorded stock-based compensation expense of approximately $1,003,000, $1,007,000 and $823,000, respectively, for stock options granted under the Second Amended and Restated 2001 Repligen Corporation Stock Plan (the “2001 Plan”).
As of March 31, 2011, there was $1,961,018 of total unrecognized compensation cost related to unvested share-based awards. This cost is expected to be recognized over a weighted average remaining requisite service period of 3.05 years. We expect 978,818 in unvested options to vest over the next five years.
RESULTS OF OPERATIONS
The following discussion of the financial condition and results of operations should be read in conjunction with the accompanying financial statements and the related footnotes thereto.
Revenues
Total revenues for fiscal 2011, 2010 and 2009 were $27,291,000, $20,971,000, and $29,362,000, respectively, and were primarily comprised of sales of our bioprocessing products and royalties. Our total revenue was comprised of:
| Year ended March 31, | % Change | |||||||||||||||||||
| 2011 | 2010 | 2009 | 2011 vs. 2010 | 2010 vs. 2009 | ||||||||||||||||
| (in thousands, except percentages) | ||||||||||||||||||||
| Bioprocessing |
$ | 14,961 | $ | 10,305 | $ | 14,361 | 45 | % | (28 | %) | ||||||||||
|
SecreFlo® |
— | — | 168 | — | (100 | %) | ||||||||||||||
| Product revenue |
$ | 14,961 | $ | 10,305 | $ | 14,529 | 45 | % | (29 | %) | ||||||||||
| Royalty and other revenue |
12,330 | 10,666 | 14,833 | 16 | % | (28 | %) | |||||||||||||
| Total revenue |
$ | 27,291 | $ | 20,971 | $ | 29,362 | 30 | % | (29 | %) | ||||||||||
25
Table of Contents
Substantially all of our bioprocessing products are based on recombinant Protein A and are sold to customers who incorporate our manufactured products into their proprietary antibody purification systems to be sold directly to the pharmaceutical industry. Monoclonal antibodies are a well-established class of drug with applications in rheumatoid arthritis, asthma and a variety of cancers. Sales of our bioprocessing products are therefore impacted by the timing of large-scale production orders and the regulatory approvals for such antibodies, which may result in significant quarterly fluctuations.
During fiscal 2011, bioprocessing product sales increased by $4,656,000 or 45% as compared to fiscal 2010. Volume increased 49% due to increased demand from certain key customers and other business events, but was offset by a 4% decrease in sales revenue due to changes in the mix of products sold in fiscal 2011 as compared to fiscal 2010. We sell bioprocessing products at various price points. The mix of products sold varies and impacts the fluctuations in total product revenue and cost of product revenues from period to period.
During fiscal 2010, bioprocessing product sales decreased by $4,056,000 or 28% as compared to fiscal 2009. Volume decreased 26% due to decreased demand from certain key customers in reaction to current economic conditions and other business events. Changes in the mix of products sold in fiscal 2010 as compared to fiscal 2009 comprised the remaining 2% decrease.
We anticipate that bioprocessing product sales will increase moderately in fiscal 2012. In addition, our bioprocessing product sales may be subject to quarterly fluctuations due to the timing of large-scale production orders.
Pursuant to the Bristol Settlement, we recognized royalty revenue of approximately $10,251,000, $8,980,000 and $13,383,000 in fiscal years 2011, 2010 and 2009, respectively. The $13,383,000 recognized in fiscal 2009 included an initial $5.0 million royalty payment, $1.3 million in royalties for sales of Orencia® from January 1, 2008 to March 31, 2008, as well as $7.1 million for sales in fiscal year 2009. For fiscal 2012, we expect royalty revenues to increase moderately over fiscal 2011 as Bristol’s Orencia® continues to penetrate the market.
Also, during fiscal years 2010 and 2009, we earned and recognized approximately $1,009,000 and $776,000, respectively, in royalty revenue from ChiRhoClin. As of December 31, 2009, ChiRhoClin had fulfilled its royalty obligations to us for its sales of our secretin. We do not expect to recognize any further royalty revenue from ChiRhoClin.
During fiscal 2011, we recognized approximately $1,346,000 of revenue from sponsored research and development projects under agreements with the Muscular Dystrophy Association, the National Institutes of Health / Scripps Research Institute, Go Friedreich’s Ataxia Research (“GoFar”), and the Friedreich’s Ataxia Research Alliance. In fiscal 2011, we also recognized approximately $733,000 in one-time grants under the Qualifying Therapeutic Discovery Project Program which was created in March 2010 as part of the Patient Protection and Affordability Care Act. In fiscal 2010, we recognized approximately $677,000 of revenue from sponsored research and development projects under agreements with the Muscular Dystrophy Association, the Friedreich’s Ataxia Research Alliance and the National Ataxia Foundation. During fiscal 2009, we recognized approximately $674,000 of revenue from sponsored research and development projects under agreements with the Muscular Dystrophy Association and GoFAR, respectively.
We expect research and license revenues will remain relatively consistent in fiscal 2012 as the MDA grant related effort continues.
26
Table of Contents
Costs and operating expenses
Total costs and operating expenses for fiscal 2011, 2010 and 2009 consist of the following:
| Year ended March 31, | % Change | |||||||||||||||||||
| 2011 | 2010 | 2009 | 2011 vs. 2010 | 2010 vs. 2009 | ||||||||||||||||
| (In thousands) | ||||||||||||||||||||
| Costs and operating expenses: |
||||||||||||||||||||
| Cost of product revenue |
$ | 5,580 | $ | 4,159 | $ | 5,686 | 34 | % | (27 | %) | ||||||||||
| Cost of royalty and other revenue |
1,537 | 1,347 | 1,091 | 14 | % | 23 | % | |||||||||||||
| Research and development |
12,529 | 14,160 | 12,772 | (12 | %) | 11 | % | |||||||||||||
| Selling, general and administrative |
8,019 | 7,072 | 5,933 | 13 | % | 19 | % | |||||||||||||
| Total costs and operating expenses |
$ | 27,665 | $ | 26,738 | $ | 25,482 | 3 | % | 5 | % | ||||||||||
The increase in cost of product revenue of $1,421,000 or 34% in fiscal 2011 as compared to fiscal 2010 is primarily due to a 45% increase in bioprocessing product sales and is partially offset by favorable manufacturing variances.
The decrease in cost of product revenue of $1,527,000 or 27% in fiscal 2010 as compared to fiscal 2009 is primarily due to a 29% decrease in bioprocessing product sales as well as favorable manufacturing variances. This decrease is partially offset by higher depreciation costs of approximately $156,000 related to investments in our manufacturing facilities.
Pursuant to the Bristol Settlement, we must remit 15% of royalty revenue received through the expiration of the agreement in December 2013 to the University of Michigan. For fiscal 2011, 2010 and 2009, this cost of royalty revenue was approximately $1,537,000, $1,347,000 and $1,091,000, respectively. This increase is directly related to the increase in Bristol royalty revenue noted above.
Research and development costs primarily include costs of internal personnel, external pharmacology and toxicology research, clinical trials and the costs associated with the manufacturing and testing of clinical materials. We are currently pursuing regulatory approval of an NDA for RG1068 for MRI imaging of the pancreas and are developing an expansion of our Opus product line. In addition, we are preparing to initiate Phase 1 studies for RG2833 for Friedreich’s ataxia and RG3039 for spinal muscular atrophy, pending regulatory approvals. Due to the small size of the Company and the fact that these various programs share personnel and fixed costs, we do not track all of our expenses or allocate any fixed costs by program, and therefore, have not provided an estimate of historical costs incurred by project.
Each of our therapeutic research and development programs is subject to risks and uncertainties, including the requirement to seek regulatory approvals that are outside of our control. For example, our clinical trials may be subject to delays based on our inability to enroll patients at the rate that we expect to meet the schedule for our planned clinical trials. Moreover, the product candidates identified in these research programs, particularly in our early stage programs must overcome significant technological, manufacturing and marketing challenges before they can be successfully commercialized. For example, results from our preclinical animal models may not be replicated in our clinical trials with humans. As a result of these risks and uncertainties, we are unable to predict with any certainty the period in which material net cash inflows from such projects could be expected to commence or the completion date of these programs.
These risks and uncertainties prevent us from estimating with any certainty the specific timing and future costs of our research and development programs, although historical trends within the industry suggest that expenses tend to increase in later stages of development. Arrangements with commercial vendors and academic researchers accounted for 47%, 51%, and 59% of our research and development expenses for fiscal 2011, 2010, and 2009, respectively. The outsourcing of such services provides us flexibility to discontinue or increase spending depending on the success of our research and development programs.
27
Table of Contents
During fiscal 2011, research and development expenses decreased by $1,631,000 or 12% as compared to fiscal 2010. This decrease is comprised primarily of 1) $1,183,000 related to our secretin program for MRI imaging of the pancreas as the re-analysis of the images obtained from our Phase 3 clinical trial was completed in fiscal 2011 and the clinical trial was ongoing in fiscal 2010, 2) $629,000 related to our uridine program to treat bipolar depression as the Phase 2b trial was completed in March 2011 and 3) $449,000 related to our Friedreich’s ataxia program. These decreases were partially offset by a $548,000 increase related to our DcpS program to develop a drug for the treatment of patients with spinal muscular atrophy.
During fiscal 2010, research and development expenses increased by $1,388,000 or 11% as compared to fiscal 2009. This increase is comprised primarily of 1) $909,000 related to our DcpS program to develop a drug for the treatment of patients with spinal muscular atrophy, 2) $891,000 related to Friedreich’s ataxia as we identified a clinical candidate and began preparing for a Phase 1 clinical trial and 3) $236,000 related to increased personnel expenses primarily due to headcount additions in clinical and regulatory areas. These increases were partially offset by a $746,000 decrease as we approached the end of our Phase 3 clinical trial for RG1068, evaluating the use of human secretin in aiding pancreatic imaging.
Future research and development expenses are dependent on a number of variables, including the cost and design of clinical trials and external costs such as manufacturing of clinical materials. We expect our research and development expenses in fiscal 2012 to increase primarily due to drug manufacturing, regulatory and filing fees associated with the regulatory approval of RG1068 for MRI imaging of the pancreas and to continued development and expansion of our Opus product line. Also in fiscal 2012, we plan to initiate Phase 1 studies for RG2833 for Friedreich’s ataxia and RG3039 for spinal muscular atrophy, pending regulatory approvals. There may be further increases in expenses if we acquire additional product candidates.
Selling, general and administrative (“SG&A”) expenses include the associated costs with selling our commercial products and costs required to support our research and development efforts including legal, accounting, patent, shareholder services, amortization of intangible assets and other administrative functions. In addition, SG&A expenses have historically included costs associated with various litigation matters.
In fiscal 2011, SG&A costs increased by $947,000 or 13% as compared to fiscal 2010. This increase is primarily due to increased personnel expenses of approximately $500,000 due to headcount increases in marketing and business development including salaries, stock-based compensation and recruiting costs, increased investor relations expenses of $150,000, increased patent prosecution costs of $150,000, and increased amortization expense of $150,000 related to the BioFlash acquisition.
In fiscal 2010, SG&A costs increased by $1,139,000 or 19% as compared to fiscal 2009. This increase is primarily due to increased personnel expenses of $1,001,000 primarily due to headcount increases in marketing and business development including salaries and stock-based compensation.
We expect SG&A expenses to increase in fiscal 2012 primarily due to commercialization efforts as we prepare to launch RG1068 for MRI imaging of the pancreas, pending FDA approval, and slightly higher headcount and related personnel expenses.
Investment income
Investment income includes income earned on invested cash balances. Investment income for fiscal 2011, 2010 and 2009 was approximately $357,000, $870,000 and $1,896,000, respectively. The decrease of $513,000 or 59% in fiscal 2011 compared to fiscal 2010 and the decrease of $1,026,000 or 54% in fiscal 2010 compared to fiscal 2009 are primarily attributable to lower interest rates. We expect interest income to vary based on changes in the amount of funds invested and fluctuation of interest rates.
28
Table of Contents
Benefit from income taxes
In fiscal year 2010, we recorded a tax benefit of approximately $835,000 primarily due to the “Worker, Homeownership, and Business Assistance Act of 2009” (the “Act”) that was enacted in November 2009. Among other things, the Act suspended the limitation on the use of net operating losses to offset alternative minimum tax liabilities, which enabled us to recover $835,000 of alternative minimum taxes paid in prior years. As a result, the Company had an effective tax rate of negative 17.0%.
Liquidity and capital resources
We have financed our operations primarily through sales of equity securities, revenues derived from product sales, and research grants, as well as proceeds and royalties from litigation settlements. Our revenue for the foreseeable future will be limited to our bioprocessing product revenue, royalties from Bristol, and research and development grants. Given the uncertainties related to pharmaceutical product development, we are currently unable to reliably estimate when, if ever, our therapeutic product candidates will generate revenue and cash flows.
At March 31, 2011, we had cash and marketable securities of $61,503,000 compared to $59,146,000 at March 31, 2010. A deposit for leased office space of $200,000 is classified as restricted cash and is not included in cash and marketable securities total for either 2011 or 2010.
Cash flows
| (In thousands) | Year ended March 31, | |||||||||||||||||||
| Cash provided by (used in) |
2011 | Increase / (Decrease) |
2010 | Increase / (Decrease) |
2009 | |||||||||||||||
| Operating activities |
$ | 3,232 | $ | 5,680 | $ | (2,448 | ) | $ | (8,755 | ) | $ | 6,307 | ||||||||
| Investing activities |
(1,504 | ) | (11,425 | ) | 9,921 | 42,153 | (32,232 | ) | ||||||||||||
| Financing activities |
(50 | ) | (62 | ) | 12 | 1,608 | (1,596 | ) | ||||||||||||
Operating activities
In fiscal 2011, our operating activities provided cash of $3,232,000 reflecting a net loss of approximately $43,000 which includes non-cash charges totaling approximately $2,683,000 including depreciation, amortization, and stock-based compensation charges. The remaining cash flow used in operations resulted from favorable changes in various working capital accounts.
In fiscal 2010, our operating activities consumed $2,448,000 of cash which reflects a net loss of approximately $4,064,000 and non-cash charges totaling approximately $2,386,000 including depreciation, amortization, and stock-based compensation charges. The remaining cash flow used in operations resulted from unfavorable changes in various working capital accounts.
In fiscal 2009, our operating activities provided cash of $6,307,000 reflecting net income of approximately $5,746,000 which includes non-cash charges totaling approximately $1,907,000 including depreciation, amortization, and stock-based compensation charges. The remaining cash flow used in operations resulted from unfavorable changes in various working capital accounts.
Investing activities
In fiscal 2011, our investing activities consumed $1,504,000 of cash, which is primarily due to net purchases of marketable debt securities of $679,000, a $300,000 milestone payment related to our acquisition of the assets
29
Table of Contents
of BioFlash and $525,000 for capital expenditures. In fiscal 2010, our investing activities generated $9,921,000 of cash, which was primarily due to net maturities of marketable debt securities of $12,299,000 partially offset by $1,780,000 of cash used to acquire the assets of BioFlash and $597,000 for capital expenditures. In fiscal 2009, our investing activities consumed $32,232,000 of cash, which was primarily due to net purchases of marketable debt securities of $30,892,000. Also in fiscal 2009, we spent $1,340,000 on capital expenditures as we continued to upgrade both our research and development and manufacturing capabilities. We place our marketable security investments in high quality credit instruments as specified in our investment policy guidelines.
Financing activities
Exercises of stock options provided cash receipts of $7,000, $54,000 and $402,000 in fiscal 2011, 2010 and 2009, respectively. Fiscal 2009 financing activities also included the repurchase of common stock which consumed $1,954,000.
Off-balance sheet arrangements
We do not have any special purpose entities or off-balance sheet financing arrangements.
Contractual obligations
As of March 31, 2011, we had the following fixed obligations and commitments:
| Payments Due By Period | ||||||||||||||||||||
| (In thousands) | Total | Less than 1 Year |
1 – 3 Years | 3 – 5 Years | More than 5 Years |
|||||||||||||||
| Operating lease obligations |
$ | 467 | $ | 451 | $ | 14 | $ | 2 | $ | — | ||||||||||
| Purchase obligations (1) |
3,850 | 3,850 | — | — | — | |||||||||||||||
| Contractual obligations (2) |
740 | 35 | 135 | 240 | 330 | |||||||||||||||
| Total |
$ | 5,057 | $ | 4,336 | $ | 149 | $ | 242 | $ | 330 | ||||||||||
| (1) | Represents purchase orders for the procurement of raw material for manufacturing as well as clinical materials to support our upcoming trials. |
| (2) | These amounts include obligations for minimum contingent consideration from acquisitions as well as for license, supply and consulting agreements. |
Capital requirements
Our future capital requirements will depend on many factors, including the following:
| • | the success of our clinical studies; |
| • | the scope of and progress made in our research and development activities; |
| • | our ability to acquire additional products or product candidates; |
| • | our ability to establish one or more partnerships for commercialization of RG1068 outside the U.S.; |
| • | the extent of any share repurchase activity; |
| • | the success of any proposed financing efforts; |
| • | the ability to sustain sales and profits of our bioprocessing products; and |
| • | the amount of royalty revenues we receive from Bristol. |
Absent acquisitions of additional products, product candidates or intellectual property, we believe our current cash balances are adequate to meet our cash needs for at least the next twenty-four months. We expect to incur increased expenses in fiscal 2012 compared to fiscal 2011. This is primarily due to commercialization
30
Table of Contents
efforts as we prepare to launch RG1068 for MRI imaging of the pancreas, pending regulatory approval, the development and expansion of our Opus product line, and the initiation of Phase 1 studies for RG2833 for Friedreich’s ataxia and RG3039 for spinal muscular atrophy, pending regulatory approvals. Our future capital requirements include, but are not limited to, continued investment in our research and development programs, the acquisition of additional products and technologies to complement our manufacturing capabilities, capital expenditures primarily associated with purchases of equipment and continued investment in our intellectual property portfolio.
We plan to continue to invest in our bioprocessing business and in key research and development activities. We actively evaluate various strategic transactions on an ongoing basis, including licensing or acquiring complementary products, technologies or businesses that would complement our existing portfolio of development programs. We continue to seek to acquire such potential assets that may offer us the best opportunity to create value for our shareholders. In order to acquire such assets, we may need to seek additional financing to fund these investments. This may require the issuance or sale of additional equity or debt securities. The sale of additional equity may result in additional dilution to our stockholders. Should we need to secure additional financing to acquire a product, fund future investment in research and development, or meet our future liquidity requirements, we may not be able to secure such financing, or obtain such financing on favorable terms because of the volatile nature of the biotechnology marketplace.
Net operating loss carryforwards
At March 31, 2011, we had net operating loss carryforwards of approximately $56,899,000 and business tax credits carryforwards of approximately $2,309,000 available to reduce future federal income taxes, if any. Additionally, at March 31, 2011, we had net operating loss carryforwards of approximately $4,184,000 and business tax credits carryforwards of approximately $3,231,000 available to reduce future state income taxes, if any. The net operating loss and business tax credits carryforwards will continue to expire at various dates through March 2031. Net operating loss carryforwards and available tax credits are subject to review and possible adjustment by the Internal Revenue Service and may be limited in the event of certain changes in the ownership interest of significant stockholders.
In fiscal year 2010, we recorded a tax benefit of approximately ($835,000) primarily due to the “Worker, Homeownership, and Business Assistance Act of 2009” (the “Act”) that was enacted in November 2009. Among other things, the Act suspended the limitation on the use of net operating losses to offset alternative minimum tax liabilities and enabled us to receive a refund of $835,000 for alternative minimum taxes paid in prior years. In fiscal 2009, we utilized our net operating loss carryforwards to reduce our income tax provision.
Effects of inflation
Our assets are primarily monetary, consisting of cash, cash equivalents and marketable securities. Because of their liquidity, these assets are not directly affected by inflation. Since we intend to retain and continue to use our equipment, furniture and fixtures and leasehold improvements, we believe that the incremental inflation related to replacement costs of such items will not materially affect our operations. However, the rate of inflation affects our expenses, such as those for employee compensation and contract services, which could increase our level of expenses and the rate at which we use our resources.
Recent accounting pronouncements
In October 2009, the Financial Accounting Standards Board (“FASB”) issued Accounting Standards Update (“ASU”) No. 2009-13, “Multiple-Deliverable Arrangements—a consensus of the FASB Emerging Issues Task Force” (“ASU 2009-13”). This ASU establishes the accounting and reporting guidance for arrangements under which a vendor will perform multiple revenue-generating activities. Specifically, the provisions of this update address how to separate deliverables and how to measure and allocate arrangement consideration to one or more
31
Table of Contents
units of accounting. This update is effective prospectively for revenue arrangements entered into or materially modified in fiscal years beginning on or after June 15, 2010, and we are therefore required to adopt this ASU on April 1, 2011. We do not currently believe that adoption will have a material impact on our results of operations, financial position or cash flows, but it could impact how we evaluate the accounting treatment on future license and/or collaboration arrangements.
In April 2010, FASB issued ASU No. 2010-17, “Milestone Method of Revenue Recognition—a consensus of the FASB Emerging Issues Task Force” (“ASU 2010-17”). This ASU provides guidance on defining a milestone and determining when it may be appropriate to apply the milestone method of revenue recognition for research and development transactions. ASU 2010-17 is effective on a prospective basis for milestones achieved in fiscal years, and interim periods within those years, beginning on or after June 15, 2010. We adopted ASU 2010-17 in July 2010. The adoption of this update did not have a material impact on our results of operations, financial position or cash flows as our accounting policy was consistent with the provisions of ASU 2010-17.
32
Table of Contents
| Item 7A. | QUANTITATIVE AND QUALITATIVE DISCLOSURES ABOUT MARKET RISK |
Interest rate risk
We have investments in U.S. Government and agency securities, corporate bonds and other debt securities. As a result, we are exposed to potential loss from market risks that may occur as a result of changes in interest rates, changes in credit quality of the issuer or otherwise.
We generally place our marketable security investments in high quality credit instruments, as specified in our investment policy guidelines. A hypothetical 100 basis point decrease in interest rates would result in an approximate $344,000 decrease in the fair value of our investments as of March 31, 2011. We believe, however, that the conservative nature of our investments mitigates our interest rate exposure, and our investment policy limits the amount of our credit exposure to any one issue, issuer (with the exception of U.S. agency obligations) and type of instrument. We do not expect any material loss from our marketable security investments and therefore believe that our potential interest rate exposure is limited. We intend to hold the majority of our investments to maturity, in accordance with our business plans.
| Item 8. | FINANCIAL STATEMENTS AND SUPPLEMENTARY DATA |
Financial statements and supplementary data required by Item 8 are set forth at the pages indicated in Item 15(a) below and are incorporated herein by reference.
| Item 9. | CHANGES IN AND DISAGREEMENTS WITH ACCOUNTANTS ON ACCOUNTING AND FINANCIAL DISCLOSURE. |
None.
| Item 9A. | CONTROLS AND PROCEDURES |
(a) Disclosure Controls and Procedures.
The Company’s management, with the participation of our chief executive officer and principal financial officer, has evaluated the effectiveness of the Company’s disclosure controls and procedures (as defined in Rules 13a-15(e) or 15d-15(e) under the Exchange Act) as of the end of the period covered by this report. Based on such evaluation, our chief executive officer and principal financial officer have concluded that, as of the end of such period, the Company’s disclosure controls and procedures were effective in ensuring that information required to be disclosed by the Company in the reports that it files or submits under the Exchange Act is recorded, processed, summarized and reported, on a timely basis, and is accumulated and communicated to the Company’s management, including the Company’s chief executive officer and principal financial officer, as appropriate to allow timely decisions regarding required disclosure.
(b) Management’s Annual Report on Internal Control Over Financial Reporting.
Management of the Company is responsible for establishing and maintaining adequate internal control over financial reporting. Internal control over financial reporting is defined in Rule 13a-15(f) and 15d-15(f) under the Exchange Act as a process designed by, or under the supervision of, the Company’s principal executive and principal financial officers and effected by the Company’s Board of Directors, management and other personnel to provide reasonable assurance regarding the reliability of financial reporting and the preparation of financial statements for external purposes in accordance with U.S. generally accepted accounting principles and includes those policies and procedures that:
| • | pertain to the maintenance of records that in reasonable detail accurately and fairly reflect the transactions and dispositions of the assets of the Company; |
33
Table of Contents
| • | provide reasonable assurance that transactions are recorded as necessary to permit preparation of financial statements in accordance with generally accepted accounting principles, and that receipts and expenditures of the Company are being made only in accordance with authorizations of management and directors of the Company; and |
| • | provide reasonable assurance regarding prevention or timely detection of unauthorized acquisition, use or disposition of the Company’s assets that could have a material effect on the financial statements. |
Because of its inherent limitations, internal control over financial reporting may not prevent or detect misstatements. Projections of any evaluation of effectiveness to future periods are subject to the risks that controls may become inadequate because of changes in conditions, or that the degree of compliance with the policies or procedures may deteriorate.
Management assessed the effectiveness of the Company’s internal control over financial reporting as of March 31, 2011. In making this assessment, management used the criteria established in Internal Control—Integrated Framework, issued by the Committee of Sponsoring Organizations of the Treadway Commission (COSO). Based on this assessment, our management concluded that, as of March 31, 2011, our internal control over financial reporting is effective based on those criteria. Ernst & Young LLP, the independent registered public accounting firm that audited our financial statements included in this annual report on Form 10-K, has issued an attestation report on our internal control over financial reporting as of March 31, 2011. Please see Item 9A of this Form 10-K.
/s/ REPLIGEN CORPORATION
June 9, 2011
34
Table of Contents
(c) Attestation Report of the Independent Registered Public Accounting Firm.
REPORT OF INDEPENDENT REGISTERED PUBLIC ACCOUNTING FIRM
To the Board of Directors and Stockholders of Repligen Corporation:
We have audited Repligen Corporation’s internal control over financial reporting as of March 31, 2011, based on criteria established in Internal Control—Integrated Framework issued by the Committee of Sponsoring Organizations of the Treadway Commission (the COSO criteria). Repligen Corporation’s management is responsible for maintaining effective internal control over financial reporting, and for its assessment of the effectiveness of internal control over financial reporting included in the accompanying Management’s Annual Report on Internal Control Over Financial Reporting. Our responsibility is to express an opinion on the company’s internal control over financial reporting based on our audit.
We conducted our audit in accordance with the standards of the Public Company Accounting Oversight Board (United States). Those standards require that we plan and perform the audit to obtain reasonable assurance about whether effective internal control over financial reporting was maintained in all material respects. Our audit included obtaining an understanding of internal control over financial reporting, assessing the risk that a material weakness exists, testing and evaluating the design and operating effectiveness of internal control based on the assessed risk, and performing such other procedures as we considered necessary in the circumstances. We believe that our audit provides a reasonable basis for our opinion.
A company’s internal control over financial reporting is a process designed to provide reasonable assurance regarding the reliability of financial reporting and the preparation of financial statements for external purposes in accordance with generally accepted accounting principles. A company’s internal control over financial reporting includes those policies and procedures that (1) pertain to the maintenance of records that, in reasonable detail, accurately and fairly reflect the transactions and dispositions of the assets of the company; (2) provide reasonable assurance that transactions are recorded as necessary to permit preparation of financial statements in accordance with generally accepted accounting principles, and that receipts and expenditures of the company are being made only in accordance with authorizations of management and directors of the company; and (3) provide reasonable assurance regarding prevention or timely detection of unauthorized acquisition, use, or disposition of the company’s assets that could have a material effect on the financial statements.
Because of its inherent limitations, internal control over financial reporting may not prevent or detect misstatements. Also, projections of any evaluation of effectiveness to future periods are subject to the risk that controls may become inadequate because of changes in conditions, or that the degree of compliance with the policies or procedures may deteriorate.
In our opinion, Repligen Corporation maintained, in all material respects, effective internal control over financial reporting as of March 31, 2011, based on the COSO criteria.
We also have audited, in accordance with the standards of the Public Company Accounting Oversight Board (United States), the consolidated balance sheets of Repligen Corporation as of March 31, 2011 and 2010, and the related consolidated statements of operations, stockholders’ equity, and cash flows for each of the three years in the period ended March 31, 2011 of Repligen Corporation and our report dated June 9, 2011 expressed an unqualified opinion thereon.
/s/ Ernst & Young LLP
Boston, Massachusetts
June 9, 2011
35
Table of Contents
(d) Changes in Internal Control Over Financial Reporting.
There have not been any changes in the Company’s internal control over financial reporting (as such term is defined in Rules 13a-15(f) and 15d-15(f) under the Exchange Act) during the quarter ended March 31, 2011 that have material affected, or are reasonably likely to materially affect, the Company’s internal control over financial reporting.
| Item 9B. | OTHER INFORMATION |
None.
36
Table of Contents
PART III
Pursuant to General Instructions G to Form 10-K, the information required for Part III, Items 10, 11, 12, 13 and 14, is incorporated herein by reference from the Company’s proxy statement for the 2011 Annual Meeting of Stockholders.
37
Table of Contents
| Item 15. | EXHIBITS AND FINANCIAL STATEMENT SCHEDULES |
The following documents are filed as part of this Annual Report on Form 10-K:
(a) (1) Financial Statements:
The financial statements required by this item are submitted in a separate section beginning on page 36 of this Report, as follows:
(a) (2) Financial Statement Schedules:
None.
(a) (3) Exhibits:
The Exhibits which are filed as part of this Annual Report or which are incorporated by reference are set forth in the Exhibit Index hereto.
EXHIBIT INDEX
| Exhibit |
Document Description | |
| 3.1 | Restated Certificate of Incorporation dated June 30, 1992 and amended September 17, 1999 (filed as Exhibit 3.1 to Repligen Corporation’s Quarterly Report on Form 10-Q for the quarter ended September 30, 1999 and incorporated herein by reference) (SEC File No. 000-14656). | |
| 3.2 | Certificate of Designation of Series A Junior Participating Preferred Stock dated March 4, 2003 (filed as Exhibit A of Exhibit 1 to Repligen Corporation’s Registration Statement on Form 8-A filed March 4, 2003 and incorporated herein by reference) (SEC File No. 000-14656). | |
| 3.3 | Amended and Restated By-laws (filed as Exhibit 3.2 to Repligen Corporation’s Quarterly Report on Form 10-Q for the quarter ended September 30, 2003 and incorporated herein by reference) (SEC File No. 000-14656). | |
| 4.1 | Specimen Stock Certificate (filed as Exhibit 4.1 to Repligen Corporation’s Annual Report on Form 10-K for the year ended March 31, 2002 and incorporated herein by reference) (SEC File No. 000-14656). | |
| 4.2 | Rights Agreement, dated as of March 3, 2003, between Repligen Corporation and American Stock Transfer & Trust Company (filed as Exhibit 4.1 to Repligen Corporation’s Current Report on Form 8-K filed March 4, 2003 and incorporated herein by reference) (SEC File No. 000-14656). | |
| 10.1* | Consulting Agreement, dated November 1, 1981, between Dr. Alexander Rich and Repligen Corporation. (filed as Exhibit 10.2 to Repligen Corporation’s Annual Report on Form 10-K for the year ended March 31, 2002 and incorporated herein by reference) (SEC File No. 000-14656). | |
38
Table of Contents
| Exhibit |
Document Description | |
| 10.2* | Employment Agreement, dated March 14, 1996, between Repligen Corporation and Walter C. Herlihy (filed as Exhibit 10.3 to Repligen Corporation’s Annual Report on Form 10-K for the year ended March 31, 2002 and incorporated herein by reference) (SEC File No. 000-14656). | |
| 10.3* | Employment Agreement, dated March 14, 1996, between Repligen Corporation and James R. Rusche (filed as Exhibit 10.4 to Repligen Corporation’s Annual Report on Form 10-K for the year ended March 31, 2002 and incorporated herein by reference) (SEC File No. 000-14656). | |
| 10.4* | Employment Agreement, dated March 14, 1996, between Repligen Corporation and Daniel P. Witt (filed as Exhibit 10.5 to Repligen Corporation’s Annual Report on Form 10-K for the year ended March 31, 2002 and incorporated herein by reference) (SEC File No. 000-14656). | |
| 10.5* | Employment Offer Letter dated February 29, 2008 by and between Repligen Corporation and William Kelly (filed as Exhibit 10.20 to Repligen Corporation’s Annual Report on Form 10-K for the year ended March 31, 2008 and incorporated herein by reference). | |
| 10.6* | Repligen Executive Incentive Compensation Plan (filed as Exhibit 10.1 to Repligen Corporation’s Current Report on form 8-K filed on December 14, 2005 and incorporated herein by reference). | |
| 10.7* | The Amended 1992 Repligen Corporation Stock Option Plan, as amended (filed as Exhibit 4.2 to Repligen Corporation’s Quarterly Report on Form 10-Q for the quarter ended September 30, 2000 and incorporated herein by reference) (SEC File No. 000-14656). | |
| 10.8* | The Second Amended and Restated 2001 Repligen Corporation Stock Plan (filed as Exhibit 10.1 to Repligen Corporation’s Current Report on Form 8-K filed on September 18, 2008 and incorporated herein by reference). | |
| 10.8.1* | The Second Amended and Restated 2001 Repligen Corporation Stock Option Plan, Form of Incentive Stock Option Plan (filed as Exhibit 10.14 to Repligen Corporation’s Annual Report on Form 10-K for the year ended March 31, 2005 and incorporated herein by reference). | |
| 10.8.2* | The Amended and Restated 2001 Repligen Corporation Stock Plan, Form of Restricted Stock Agreement (filed as Exhibit 10.1 to Repligen Corporation’s Current Report on Form 8-K filed on January 9, 2006 and incorporated herein by reference). | |
| 10.9 | Common Stock Purchase Warrant dated April 6, 2007 (filed as Exhibit 4.1 to Repligen Corporation’s Quarterly Report on Form 10-Q for the quarter ended June 30, 2007 and incorporated herein by reference). | |
| 10.10# | Manufacturing Transfer Agreement dated as of December 17, 1998 among the Company and Amersham Pharmacia Biotech AB (filed as Exhibit 10.1 to Repligen Corporation’s Quarterly Report on Form 10-Q for the quarter ended December 31, 1998 and incorporated herein by reference) (SEC File No. 000-14656). | |
| 10.11# | License Agreement dated as of July 24, 2000 with University of Michigan (filed as Exhibit 10.1 to Repligen Corporation’s Quarterly Report on Form 10-Q for the quarter ended September 30, 2000 and incorporated herein by reference) (SEC File No. 000-14656). | |
| 10.12 | Lease Between Repligen Corporation as Tenant and West Seyon LLC as Landlord, 35 Seyon Street, Waltham, MA (filed as Exhibit 10.1 to Repligen Corporation’s Quarterly Report on Form 10-Q for the quarter ended December 31, 2001 and incorporated herein by reference) (SEC File No. 000-14656). | |
| 10.13# | Settlement Agreement by and between ChiRhoClin, Inc. and Repligen Corporation, and dated as of May 9, 2005 (filed as Exhibit 10.1 to Repligen Corporation’s Quarterly Report on Form 10-Q for the quarter ended June 30, 2005 and incorporated herein by reference). | |
39
Table of Contents
| Exhibit |
Document Description | |
| 10.14# | License Agreement by and between The Scripps Research Institute and Repligen Corporation dated April 6, 2007 (filed as Exhibit 10.18 to Repligen Corporation’s Annual Report on Form 10-K for the year ended March 31, 2007 and incorporated herein by reference). | |
| 10.15# | Settlement and Release Agreement dated April 7, 2008 by and among Repligen Corporation, The Regents of the University of Michigan and Bristol-Myers Squibb Company (filed as Exhibit 10.1 to Repligen Corporation’s Quarterly Report on Form 10-Q for the quarter ended June 30, 2008 and incorporated herein by reference). | |
| 10.16# | Strategic Supplier Alliance Agreement dated January 28, 2010 by and between Repligen Corporation and GE Healthcare Bio-Sciences AB (filed as Exhibit 10.17 to Repligen Corporation’s Annual Report on Form 10-K for the year ended March 31, 2010 and incorporated herein by reference). | |
| 10.17+ | Letter Agreement, dated March 21, 2011, by and between Repligen Corporation and Walter C. Herlihy. | |
| 10.18+ | Letter Agreement, dated March 21, 2011, by and between Repligen Corporation and James R. Rusche | |
| 10.19+ | Letter Agreement, dated March 21, 2011, by and between Repligen Corporation and Daniel P. Witt. | |
| 23.1+ | Consent of Ernst & Young LLP. | |
| 24.1+ | Power of Attorney (included on signature page). | |
| 31.1+ | Rule 13a-14(a)/15d-14(a) Certification. | |
| 31.2+ | Rule 13a-14(a)/15d-14(a) Certification. | |
| 32.1+ | Certification Pursuant to 18 U.S.C. Section 1350, as adopted pursuant to Section 906 of the Sarbanes-Oxley Act of 2002. | |
| # | Confidential treatment obtained as to certain portions. |
| * | Management contract or compensatory plan or arrangement. |
| + | Filed herewith. |
The exhibits listed above are not contained in the copy of the Annual Report on Form 10-K distributed to stockholders. Upon the request of any stockholder entitled to vote at the 2011 annual meeting, the Registrant will furnish that person without charge a copy of any exhibits listed above. Requests should be addressed to Repligen Corporation, 41 Seyon Street, Waltham, MA 02453.
40
Table of Contents
Pursuant to the requirements of the Securities Exchange Act of 1934, the registrant has duly caused this report to be signed on its behalf by the undersigned thereunto duly authorized.
| REPLIGEN CORPORATION | ||||||
| Date: June 9, 2011 | By: | /S/ WALTER C. HERLIHY | ||||
| Walter C. Herlihy President and Chief Executive Officer | ||||||
POWER OF ATTORNEY
KNOW ALL MEN BY THESE PRESENTS, that each person whose signature appears below hereby makes, constitutes and appoints Walter C. Herlihy and William J. Kelly with full power to act without the other, his true and lawful attorney-in-fact and agent, with full power of substitution and resubstitution, for him and in his name, place and stead, in any and all capacities to sign any or all amendments to this Form 10-K, and to file the same with all exhibits thereto, and other documents in connection therewith, with the Securities and Exchange Commission, granting unto said attorney-in-fact and agents, and each of them, full power and authority to do and perform each and every act and thing requisite and necessary to be done in connection therewith, as fully to all intents and purposes as he might or could do in person, hereby ratifying and confirming all that said attorney-in-fact and agents of any of them, or any substitute or substitutes, lawfully do or cause to be done by virtue hereof.
Pursuant to the requirements of the Securities Exchange Act of 1934, this report has been signed below by the following persons on behalf of the registrant and in the capacities and on the dates indicated.
| Signature |
Title |
Date | ||
| /s/ WALTER HERLIHY Walter C. Herlihy, Ph.D. |
President, Chief Executive Officer and Director (Principal executive officer) |
June 9, 2011 | ||
| /s/ WILLIAM J. KELLY William J. Kelly |
Chief Financial Officer (Principal financial and accounting officer) |
June 9, 2011 | ||
| /s/ ALEXANDER RICH Alexander Rich, M.D. |
Chairman of the Board | June 9, 2011 | ||
| /s/ KAREN DAWES Karen Dawes |
Director | June 9, 2011 | ||
| /s/ ALFRED L. GOLDBERG Alfred L. Goldberg, Ph.D. |
Director | June 9, 2011 | ||
| /s/ EARL W. HENRY Earl W. Henry, M.D. |
Director | June 9, 2011 | ||
| /s/ THOMAS F. RYAN, JR. Thomas F. Ryan, Jr. |
Director | June 9, 2011 | ||
| /s/ GLENN L. COOPER Glenn L. Cooper, M.D. |
Director | June 9, 2011 | ||
41
Table of Contents
EXHIBIT INDEX
| Exhibit |
Document Description | |
| 3.1 | Restated Certificate of Incorporation dated June 30, 1992 and amended September 17, 1999 (filed as Exhibit 3.1 to Repligen Corporation’s Quarterly Report on Form 10-Q for the quarter ended September 30, 1999 and incorporated herein by reference) (SEC File No. 000-14656). | |
| 3.2 | Certificate of Designation of Series A Junior Participating Preferred Stock dated March 4, 2003 (filed as Exhibit A of Exhibit 1 to Repligen Corporation’s Registration Statement on Form 8-A filed March 4, 2003 and incorporated herein by reference) (SEC File No. 000-14656). | |
| 3.3 | Amended and Restated By-laws (filed as Exhibit 3.2 to Repligen Corporation’s Quarterly Report on Form 10-Q for the quarter ended September 30, 2003 and incorporated herein by reference) (SEC File No. 000-14656). | |
| 4.1 | Specimen Stock Certificate (filed as Exhibit 4.1 to Repligen Corporation’s Annual Report on Form 10-K for the year ended March 31, 2002 and incorporated herein by reference) (SEC File No. 000-14656). | |
| 4.2 | Rights Agreement, dated as of March 3, 2003, between Repligen Corporation and American Stock Transfer & Trust Company (filed as Exhibit 4.1 to Repligen Corporation’s Current Report on Form 8-K filed March 4, 2003 and incorporated herein by reference) (SEC File No. 000-14656). | |
| 10.1* | Consulting Agreement, dated November 1, 1981, between Dr. Alexander Rich and Repligen Corporation. (filed as Exhibit 10.2 to Repligen Corporation’s Annual Report on Form 10-K for the year ended March 31, 2002 and incorporated herein by reference) (SEC File No. 000-14656). | |
| 10.2* | Employment Agreement, dated March 14, 1996, between Repligen Corporation and Walter C. Herlihy (filed as Exhibit 10.3 to Repligen Corporation’s Annual Report on Form 10-K for the year ended March 31, 2002 and incorporated herein by reference) (SEC File No. 000-14656). | |
| 10.3* | Employment Agreement, dated March 14, 1996, between Repligen Corporation and James R. Rusche (filed as Exhibit 10.4 to Repligen Corporation’s Annual Report on Form 10-K for the year ended March 31, 2002 and incorporated herein by reference) (SEC File No. 000-14656). | |
| 10.4* | Employment Agreement, dated March 14, 1996, between Repligen Corporation and Daniel P. Witt (filed as Exhibit 10.5 to Repligen Corporation’s Annual Report on Form 10-K for the year ended March 31, 2002 and incorporated herein by reference) (SEC File No. 000-14656). | |
| 10.5* | Employment Offer Letter dated February 29, 2008 by and between Repligen Corporation and William Kelly (filed as Exhibit 10.20 to Repligen Corporation’s Annual Report on Form 10-K for the year ended March 31, 2008 and incorporated herein by reference). | |
| 10.6* | Repligen Executive Incentive Compensation Plan (filed as Exhibit 10.1 to Repligen Corporation’s Current Report on form 8-K filed on December 14, 2005 and incorporated herein by reference). | |
| 10.7* | The Amended 1992 Repligen Corporation Stock Option Plan, as amended (filed as Exhibit 4.2 to Repligen Corporation’s Quarterly Report on Form 10-Q for the quarter ended September 30, 2000 and incorporated herein by reference) (SEC File No. 000-14656). | |
| 10.8* | The Second Amended and Restated 2001 Repligen Corporation Stock Plan (filed as Exhibit 10.1 to Repligen Corporation’s Current Report on Form 8-K filed on September 18, 2008 and incorporated herein by reference). | |
| 10.8.1* | The Second Amended and Restated 2001 Repligen Corporation Stock Option Plan, Form of Incentive Stock Option Plan (filed as Exhibit 10.14 to Repligen Corporation’s Annual Report on Form 10-K for the year ended March 31, 2005 and incorporated herein by reference). | |
42
Table of Contents
| Exhibit |
Document Description | |
| 10.8.2* | The Amended and Restated 2001 Repligen Corporation Stock Plan, Form of Restricted Stock Agreement (filed as Exhibit 10.1 to Repligen Corporation’s Current Report on Form 8-K filed on January 9, 2006 and incorporated herein by reference). | |
| 10.9 | Common Stock Purchase Warrant dated April 6, 2007 (filed as Exhibit 4.1 to Repligen Corporation’s Quarterly Report on Form 10-Q for the quarter ended June 30, 2007 and incorporated herein by reference). | |
| 10.10# | Manufacturing Transfer Agreement dated as of December 17, 1998 among the Company and Amersham Pharmacia Biotech AB (filed as Exhibit 10.1 to Repligen Corporation’s Quarterly Report on Form 10-Q for the quarter ended December 31, 1998 and incorporated herein by reference) (SEC File No. 000-14656). | |
| 10.11# | License Agreement dated as of July 24, 2000 with University of Michigan (filed as Exhibit 10.1 to Repligen Corporation’s Quarterly Report on Form 10-Q for the quarter ended September 30, 2000 and incorporated herein by reference) (SEC File No. 000-14656). | |
| 10.12 | Lease Between Repligen Corporation as Tenant and West Seyon LLC as Landlord, 35 Seyon Street, Waltham, MA (filed as Exhibit 10.1 to Repligen Corporation’s Quarterly Report on Form 10-Q for the quarter ended December 31, 2001 and incorporated herein by reference) (SEC File No. 000-14656). | |
| 10.13# | Settlement Agreement by and between ChiRhoClin, Inc. and Repligen Corporation, and dated as of May 9, 2005 (filed as Exhibit 10.1 to Repligen Corporation’s Quarterly Report on Form 10-Q for the quarter ended June 30, 2005 and incorporated herein by reference). | |
| 10.14# | License Agreement by and between The Scripps Research Institute and Repligen Corporation dated April 6, 2007 (filed as Exhibit 10.18 to Repligen Corporation’s Annual Report on Form 10-K for the year ended March 31, 2007 and incorporated herein by reference). | |
| 10.15# | Settlement and Release Agreement dated April 7, 2008 by and among Repligen Corporation, The Regents of the University of Michigan and Bristol-Myers Squibb Company (filed as Exhibit 10.1 to Repligen Corporation’s Quarterly Report on Form 10-Q for the quarter ended June 30, 2008 and incorporated herein by reference). | |
| 10.16# | Strategic Supplier Alliance Agreement dated January 28, 2010 by and between Repligen Corporation and GE Healthcare Bio-Sciences AB (filed as Exhibit 10.17 to Repligen Corporation’s Annual Report on Form 10-K for the year ended March 31, 2010 and incorporated herein by reference). | |
| 10.17+ | Letter Agreement, dated March 21, 2011, by and between Repligen Corporation and Walter C. Herlihy. | |
| 10.18+ | Letter Agreement, dated March 21, 2011, by and between Repligen Corporation and James R. Rusche | |
| 10.19+ | Letter Agreement, dated March 21, 2011, by and between Repligen Corporation and Daniel P. Witt. | |
| 23.1+ | Consent of Ernst & Young LLP. | |
| 24.1+ | Power of Attorney (included on signature page). | |
| 31.1+ | Rule 13a-14(a)/15d-14(a) Certification. | |
| 31.2+ | Rule 13a-14(a)/15d-14(a) Certification. | |
| 32.1+ | Certification Pursuant to 18 U.S.C. Section 1350, as adopted pursuant to Section 906 of the Sarbanes-Oxley Act of 2002. | |
| # | Confidential treatment obtained as to certain portions. |
| * | Management contract or compensatory plan or arrangement. |
| + | Filed herewith. |
43
Table of Contents
44
Table of Contents
REPORT OF INDEPENDENT REGISTERED PUBLIC ACCOUNTING FIRM
To the Board of Directors and Stockholders of Repligen Corporation:
We have audited the accompanying consolidated balance sheets of Repligen Corporation as of March 31, 2011 and 2010, and the related consolidated statements of operations, stockholders’ equity, and cash flows for each of the three years in the period ended March 31, 2011. These financial statements are the responsibility of the Company’s management. Our responsibility is to express an opinion on these financial statements based on our audits.
We conducted our audits in accordance with the standards of the Public Company Accounting Oversight Board (United States). Those standards require that we plan and perform the audit to obtain reasonable assurance about whether the financial statements are free of material misstatement. An audit includes examining, on a test basis, evidence supporting the amounts and disclosures in the financial statements. An audit also includes assessing the accounting principles used and significant estimates made by management, as well as evaluating the overall financial statement presentation. We believe that our audits provide a reasonable basis for our opinion.
In our opinion, the financial statements referred to above present fairly, in all material respects, the consolidated financial position of Repligen Corporation at March 31, 2011 and 2010, and the consolidated results of its operations, and its cash flows for each of the three years in the period ended March 31, 2011, in conformity with U.S. generally accepted accounting principles.
We also have audited, in accordance with the standards of the Public Company Accounting Oversight Board (United States), Repligen Corporation’s internal control over financial reporting as of March 31, 2011, based on criteria established in Internal Control-Integrated Framework issued by the Committee of Sponsoring Organizations of the Treadway Commission and our report dated June 9, 2011 expressed an unqualified opinion thereon.
/s/ Ernst & Young LLP
Boston, Massachusetts
June 9, 2011
45
Table of Contents
CONSOLIDATED BALANCE SHEETS
| March 31, 2011 | March 31, 2010 | |||||||
| Assets |
||||||||
| Current assets: |
||||||||
| Cash and cash equivalents |
$ | 14,203,544 | $ | 12,526,040 | ||||
| Marketable securities |
35,421,520 | 40,608,710 | ||||||
| Accounts receivable, less reserve for doubtful accounts of $10,000 |
1,259,607 | 570,038 | ||||||
| Royalties receivable |
2,512,602 | 2,296,000 | ||||||
| Inventories |
1,953,976 | 2,201,140 | ||||||
| Prepaid expenses and other current assets |
492,767 | 1,479,107 | ||||||
| Total current assets |
55,844,016 | 59,681,035 | ||||||
| Property, plant and equipment, at cost: |
||||||||
| Leasehold improvements |
3,879,130 | 3,855,616 | ||||||
| Equipment |
4,426,628 | 4,176,281 | ||||||
| Furniture and fixtures |
644,541 | 567,480 | ||||||
| Total property, plant and equipment, at cost |
8,950,299 | 8,599,377 | ||||||
| Less: Accumulated depreciation |
(6,793,984 | ) | (5,466,354 | ) | ||||
| Property, plant and equipment, net |
2,156,315 | 3,133,023 | ||||||
| Long-term marketable securities |
11,878,201 | 6,011,697 | ||||||
| Intangible assets, net |
1,221,458 | 1,400,208 | ||||||
| Goodwill |
994,000 | 994,000 | ||||||
| Restricted cash |
200,000 | 200,000 | ||||||
| Total assets |
$ | 72,293,990 | $ | 71,419,963 | ||||
| Liabilities and stockholders’ equity |
||||||||
| Current liabilities: |
||||||||
| Accounts payable |
$ | 930,601 | $ | 991,005 | ||||
| Accrued liabilities |
3,692,523 | 3,666,135 | ||||||
| Total current liabilities |
4,623,124 | 4,657,140 | ||||||
| Long-term liabilities |
584,162 | 642,447 | ||||||
| Total liabilities |
5,207,286 | 5,299,587 | ||||||
| Commitments and contingencies |
||||||||
| Stockholders’ equity: |
||||||||
| Preferred stock, $.01 par value, 5,000,000 shares authorized, no shares issued or outstanding |
— | — | ||||||
| Common stock, $.01 par value, 40,000,000 shares authorized, 30,812,257 shares at March 31, 2011 and 30,761,807 shares at March 31, 2010 issued and outstanding |
308,123 | 307,618 | ||||||
| Additional paid-in capital |
184,743,195 | 183,733,863 | ||||||
| Accumulated deficit |
(117,964,614 | ) | (117,921,105 | ) | ||||
| Total stockholders’ equity |
67,086,704 | 66,120,376 | ||||||
| Total liabilities and stockholders’ equity |
$ | 72,293,990 | $ | 71,419,963 | ||||
The accompanying notes are an integral part of these consolidated financial statements.
46
Table of Contents
CONSOLIDATED STATEMENTS OF OPERATIONS
| Years ended March 31, | ||||||||||||
| 2011 | 2010 | 2009 | ||||||||||
| Revenue: |
||||||||||||
| Product revenue |
$ | 14,961,397 | $ | 10,304,727 | $ | 14,528,916 | ||||||
| Royalty and other revenue |
12,329,627 | 10,666,342 | 14,832,605 | |||||||||
| Total revenue |
27,291,024 | 20,971,069 | 29,361,521 | |||||||||
| Operating expenses: (1) |
||||||||||||
| Cost of product revenue |
5,579,759 | 4,159,002 | 5,685,577 | |||||||||
| Cost of royalty and other revenue |
1,537,666 | 1,347,168 | 1,091,297 | |||||||||
| Research and development |
12,528,819 | 14,159,721 | 12,771,573 | |||||||||
| Selling, general and administrative |
8,018,851 | 7,071,859 | 5,933,090 | |||||||||
| Total operating expenses |
27,665,095 | 26,737,750 | 25,481,537 | |||||||||
| (Loss) income from operations |
(374,071 | ) | (5,766,681 | ) | 3,879,984 | |||||||
| Investment income |
356,729 | 870,043 | 1,895,706 | |||||||||
| Interest expense |
(26,167 | ) | (1,972 | ) | (2,963 | ) | ||||||
| (Loss) income before income taxes |
(43,509 | ) | (4,898,610 | ) | 5,772,727 | |||||||
| Income tax provision (benefit) |
— | (834,766 | ) | 26,699 | ||||||||
| Net (loss) income |
$ | (43,509 | ) | $ | (4,063,844 | ) | $ | 5,746,028 | ||||
| Earnings (loss) per share: |
||||||||||||
| Basic |
$ | (0.00 | ) | $ | (0.13 | ) | $ | 0.19 | ||||
| Diluted |
$ | (0.00 | ) | $ | (0.13 | ) | $ | 0.18 | ||||
| Weighted average shares outstanding: |
||||||||||||
| Basic |
30,781,881 | 30,752,041 | 30,957,957 | |||||||||
| Diluted |
30,781,881 | 30,752,041 | 31,290,233 | |||||||||
|
|
||||||||||||
| (1) Includes non-cash stock-based compensation as follows: |
||||||||||||
| Cost of product revenue |
$ | 48,547 | $ | 40,941 | $ | 47,686 | ||||||
| Research and development |
225,567 | 209,335 | 172,872 | |||||||||
| Selling, general and administrative |
729,152 | 756,522 | 602,687 | |||||||||
The accompanying notes are an integral part of these consolidated financial statements.
47
Table of Contents
CONSOLIDATED STATEMENTS OF STOCKHOLDERS’ EQUITY
| Common Stock | Additional Paid-in Capital |
Accumulated Deficit |
Stockholders’ Equity |
|||||||||||||||||
| Number of Shares | Amount | |||||||||||||||||||
| Balance, March 31, 2008 |
31,072,934 | $ | 310,729 | $ | 184,372,945 | $ | (120,576,820 | ) | $ | 64,106,854 | ||||||||||
| Share-based compensation expense |
823,245 | 823,245 | ||||||||||||||||||
| Repurchase and retirement of treasury stock |
(492,827 | ) | (4,928 | ) | (2,923,058 | ) | 973,530 | (1,954,456 | ) | |||||||||||
| Exercise of stock options |
161,600 | 1,616 | 400,143 | 401,759 | ||||||||||||||||
| Net income |
5,746,028 | 5,746,028 | ||||||||||||||||||
| Balance, March 31, 2009 |
30,741,707 | $ | 307,417 | $ | 182,673,275 | $ | (113,857,261 | ) | $ | 69,123,431 | ||||||||||
| Share-based compensation expense |
1,006,798 | 1,006,798 | ||||||||||||||||||
| Exercise of stock options |
20,100 | 201 | 53,790 | 53,991 | ||||||||||||||||
| Net loss |
(4,063,844 | ) | (4,063,844 | ) | ||||||||||||||||
| Balance, March 31, 2010 |
30,761,807 | $ | 307,618 | $ | 183,733,863 | $ | (117,921,105 | ) | $ | 66,120,376 | ||||||||||
| Share-based compensation expense |
1,003,266 | 1,003,266 | ||||||||||||||||||
| Exercise of stock options |
50,450 | 505 | 6,066 | 6,571 | ||||||||||||||||
| Net loss |
(43,509 | ) | (43,509 | ) | ||||||||||||||||
| Balance, March 31, 2011 |
30,812,257 | $ | 308,123 | $ | 184,743,195 | $ | (117,964,614 | ) | $ | 67,086,704 | ||||||||||
The accompanying notes are an integral part of these consolidated financial statements.
48
Table of Contents
CONSOLIDATED STATEMENTS OF CASH FLOWS
| Years ended March 31, | ||||||||||||
| 2011 | 2010 | 2009 | ||||||||||
| Cash flows from operating activities: |
||||||||||||
| Net income (loss): |
$ | (43,509 | ) | $ | (4,063,844 | ) | $ | 5,746,028 | ||||
| Adjustments to reconcile net income (loss) to net cash provided by (used in) operating activities: |
||||||||||||
| Depreciation and amortization |
1,674,528 | 1,378,999 | 1,077,347 | |||||||||
| Stock-based compensation expense |
1,003,266 | 1,006,798 | 823,245 | |||||||||
| Loss on disposal of assets |
5,597 | 905 | 6,123 | |||||||||
| Changes in assets and liabilities: |
||||||||||||
| Accounts receivable |
(689,569 | ) | (29,259 | ) | 520,822 | |||||||
| Royalties receivable |
(216,602 | ) | (259,200 | ) | (1,972,600 | ) | ||||||
| Inventories |
247,164 | 212,087 | 391,020 | |||||||||
| Prepaid expenses and other current assets |
986,340 | (545,522 | ) | (226,238 | ) | |||||||
| Accounts payable |
(60,404 | ) | (931,567 | ) | (799,337 | ) | ||||||
| Accrued liabilities |
383,237 | 782,200 | 801,379 | |||||||||
| Long-term liabilities |
(58,285 | ) | 49 | (60,645 | ) | |||||||
| Net cash provided by (used in) operating activities |
3,231,763 | (2,448,354 | ) | 6,307,144 | ||||||||
| Cash flows from investing activities: |
||||||||||||
| Purchases of marketable securities |
(84,329,731 | ) | (47,038,060 | ) | (56,865,473 | ) | ||||||
| Redemptions of marketable securities |
83,650,417 | 59,336,807 | 25,973,235 | |||||||||
| Acquisition of assets of BioFlash Partners, LLC |
(300,000 | ) | (1,780,000 | ) | — | |||||||
| Purchases of property, plant and equipment |
(524,666 | ) | (597,349 | ) | (1,339,999 | ) | ||||||
| Net cash (used in) provided by investing activities |
(1,503,980 | ) | 9,921,398 | (32,232,237 | ) | |||||||
| Cash flows from financing activities: |
||||||||||||
| Exercise of stock options |
6,571 | 53,991 | 401,759 | |||||||||
| Repurchase of common stock |
— | — | (1,954,456 | ) | ||||||||
| Principal payments under capital lease obligations |
(56,850 | ) | (42,405 | ) | (42,938 | ) | ||||||
| Net cash (used in) provided by financing activities |
(50,279 | ) | 11,586 | (1,595,635 | ) | |||||||
| Net increase (decrease) in cash and cash equivalents |
1,677,504 | 7,484,630 | (27,520,728 | ) | ||||||||
| Cash and cash equivalents, beginning of period |
12,526,040 | 5,041,410 | 32,562,138 | |||||||||
| Cash and cash equivalents, end of period |
$ | 14,203,544 | $ | 12,526,040 | $ | 5,041,410 | ||||||
| Supplemental disclosure of non-cash investing activities: |
||||||||||||
| Contingent consideration transferred in acquisition of BioFlash Partners, LLC |
$ | — | $ | 560,000 | $ | — | ||||||
| Supplemental disclosure of cash flow information: |
||||||||||||
| Income taxes (refunded) paid |
$ | — | $ | (135,157 | ) | $ | 166,000 | |||||
The accompanying notes are an integral part of these consolidated financial statements.
49
Table of Contents
NOTES TO CONSOLIDATED FINANCIAL STATEMENTS
| 1. | Organization and Nature of Business |
Repligen Corporation (“Repligen” or the “Company”) is an integrated biopharmaceutical company focused on the development and commercialization of innovative therapies that deliver the benefits of protein therapies to patients and clinicians in the fields of neurology and gastroenterology. The Company is currently conducting a number of drug development programs for diseases such as pancreatitis, Friedreich’s ataxia and spinal muscular atrophy. Repligen also has a bioprocessing business that focuses on the development and commercialization of products that are used in the production of biopharmaceuticals. In addition, the Company has out-licensed certain biologics intellectual property from which we receive royalties from Bristol-Myers Squibb Company (“Bristol”) on their net sales in the United States of their product Orencia®.
The Company is subject to a number of risks typically associated with companies in the biotechnology industry. These risks principally include the Company’s dependence on collaborative arrangements, development by the Company or its competitors of new technological innovations, dependence on key personnel, protection of proprietary technology, compliance with the U.S. Food and Drug Administration and other governmental regulations and approval requirements, as well as the ability to grow the Company’s business and obtain adequate funding to finance this growth.
| 2. | Summary of Significant Accounting Policies |
Use of Estimates
The preparation of financial statements in conformity with accounting principles generally accepted in the United States requires management to make estimates and assumptions that affect the reported amounts of assets and liabilities and disclosure of contingent assets and liabilities at the date of the financial statements and the reported amounts of revenues and expenses during the reporting period. Actual results could differ from those estimates.
Consolidation
The consolidated financial statements include the accounts of the Company and its wholly-owned subsidiary, Repligen Europe Limited. All significant intercompany accounts and transactions have been eliminated in consolidation.
Revenue Recognition
The Company generates product revenues from the sale of bioprocessing products to customers in the pharmaceutical and process chromatography industries. The Company recognizes revenue related to product sales upon delivery of the product to the customer as long as there is persuasive evidence of an arrangement, the sales price is fixed or determinable and collection of the related receivable is reasonably assured. Determination of whether these criteria have been met is based on management’s judgments primarily regarding the fixed nature of the fee charged for product delivered and the collectability of those fees. The Company has a few longstanding customers who comprise the majority of revenue and have excellent payment history and therefore the Company does not require collateral. The Company has had no significant write-offs of uncollectible invoices in the periods presented.
At the time of sale, the Company also evaluates the need to accrue for warranty and sales returns. The supply agreements the Company has with its customers and related purchase orders identify the terms and conditions of each sale and the price of the goods ordered. Due to the nature of the sales arrangements, inventory produced for sale is tested for quality specifications prior to shipment. Since the product is manufactured to order
50
Table of Contents
and in compliance with required specifications prior to shipment, the likelihood of sales return, warranty or other issues is largely diminished. Sales returns and warranty issues are infrequent and have had nominal impact on the Company’s financial statements historically.
In April 2008, the Company settled its outstanding litigation with Bristol and began recognizing royalty revenue in fiscal year 2009 for Bristol’s net sales in the United States of Orencia® which is used in the treatment of rheumatoid arthritis. Pursuant to the Bristol Settlement (see Note 10), the Company recognized royalty revenue of approximately $10,251,000, $8,980,000 and $13,383,000 in fiscal years 2011, 2010 and 2009, respectively. The $13,383,000 recognized in fiscal 2009 included an initial $5.0 million royalty payment, $1.3 million in royalties for sales of Orencia® from January 1, 2008 to March 31, 2008, as well as $7.1 million for sales in fiscal year 2009. Revenue earned from Bristol royalties is recorded in the periods when it is earned based on royalty reports sent by Bristol to the Company. The Company has no continuing obligations to Bristol as a result of this settlement.
Additionally, the Company earned and recognized approximately $1,009,000 and $776,000 in fiscal years 2010 and 2009, respectively, in royalty revenue from ChiRhoClin for their sales of secretin. Revenue earned from ChiRhoClin royalties was recorded in the periods when it was earned based on royalty reports sent by ChiRhoClin to the Company. In December 2009, ChiRhoClin fulfilled its royalty obligations to the Company for its sales of secretin. The Company does not expect to recognize any further royalty revenue from ChiRhoClin.
In fiscal years 2011, 2010 and 2009, the Company recognized approximately $594,000, $552,000 and $564,000, respectively, of revenue from a sponsored research and development project under an agreement with the Muscular Dystrophy Association. Also in fiscal 2011, the Company recognized approximately $364,000, $194,000 and $194,000, respectively, of revenue from sponsored research and development projects under agreements with the National Institutes of Health / Scripps Research Institute, Go Friedreich’s Ataxia Research (“GoFar”), and the Friedreich’s Ataxia Research Alliance, respectively. In fiscal 2011, the Company also recognized approximately $733,000 in one-time grants under the Qualifying Therapeutic Discovery Project Program which was created in March 2010 as part of the Patient Protection and Affordability Care Act. The Company also recognized approximately $125,000 and $110,000 in fiscal years 2010 and 2009, respectively, under other sponsored research and development projects.
Research revenue is recognized when the expense has been incurred and services have been performed. Determination of which costs incurred qualify for reimbursement under the terms of the Company’s contractual agreements and the timing of when such costs were incurred involves the judgment of management. The Company’s calculations are based upon the agreed-upon terms as stated in the arrangements. However, should the estimated calculations change or be challenged by other parties to the agreements, research revenue may be adjusted in subsequent periods. The calculations have not historically changed or been challenged and the Company does not anticipate any subsequent change in its revenue related to sponsored research and development projects.
There have been no material changes to the Company’s initial estimates related to revenue recognition in any periods presented in the accompanying consolidated financial statements.
Risks and Uncertainties
The Company evaluates its operations periodically to determine if any risks and uncertainties exist that could impact its operations in the near term. The Company does not believe that there are any significant risks which have not already been disclosed in the financial statements. A loss of certain suppliers could temporarily disrupt operations, although alternate sources of supply exist for these items. The Company has mitigated these risks by working closely with key suppliers, identifying alternate sources and developing contingency plans.
51
Table of Contents
Comprehensive Income (Loss)
Comprehensive income is defined as the change in equity of a business enterprise during a period resulting from transactions and other events and circumstances from non-owner sources. The Company’s comprehensive income (loss) is equal to the reported net income (loss) for all periods presented.
Cash, Cash Equivalents and Marketable Securities
At March 31, 2011, the Company’s investments included money market funds as well as short-term and long-term marketable securities, which are classified as held-to-maturity investments as the Company has the positive intent and ability to hold the investments to maturity. These investments are therefore recorded on an amortized cost basis. Marketable securities are investments with original maturities of greater than 90 days. Long-term marketable securities are securities with maturities of greater than one year. The average remaining maturity of marketable securities at March 31, 2011 is approximately 8.7 months.
Management reviewed the Company’s investments as of March 31, 2011 and concluded that there are no securities with other than temporary impairments in the investment portfolio. The Company does not intend to sell any investments and it is not more likely than not that the Company will be required to sell the investments before recovery of their amortized cost bases at maturity.
Investments in held-to-maturity debt securities consist of the following at March 31, 2011:
| March 31, 2011 | ||||||||||||||||
| Amortized Cost |
Gross Unrealized Gain |
Gross Unrealized Loss |
Fair Value | |||||||||||||
| Marketable securities: |
||||||||||||||||
| U.S. Government and agency securities |
$ | 17,727,581 | $ | 9,189 | $ | (852 | ) | $ | 17,735,918 | |||||||
| Corporate and other debt securities |
17,693,939 | 17,417 | (4,578 | ) | 17,706,778 | |||||||||||
| 35,421,520 | 26,606 | (5,430 | ) | 35,442,696 | ||||||||||||
| Long-term marketable securities: |
||||||||||||||||
| U.S. Government and agency securities |
9,257,798 | 235 | (15,613 | ) | 9,242,420 | |||||||||||
| Corporate and other debt securities |
2,620,403 | 2,731 | (1,744 | ) | 2,621,390 | |||||||||||
| 11,878,201 | 2,966 | (17,357 | ) | 11,863,810 | ||||||||||||
| Total |
$ | 47,299,721 | $ | 29,572 | $ | (22,787 | ) | $ | 47,306,506 | |||||||
At March 31, 2011, the Company’s investments included 18 held-to-maturity debt securities in unrealized loss positions with a total unrealized loss of approximately $23,000 and a total fair market value of approximately $19,281,000. All investments with gross unrealized losses have been in unrealized loss positions for less than 12 months. The unrealized losses were caused by a temporary change in the market for the securities. There was no change in the credit risk of the securities. The Company does not intend to sell the securities and it is not more likely than not that the Company will be required to sell the securities before the expected recovery of their amortized cost bases. There were no realized gains or losses on the investments for the years ended March 31, 2011, 2010 and 2009.
52
Table of Contents
Investments in held-to-maturity debt securities consisted of the following at March 31, 2010:
| March 31, 2010 | ||||||||||||||||
| Amortized Cost |
Gross Unrealized Gain |
Gross Unrealized Loss |
Fair Value | |||||||||||||
| Marketable securities: |
||||||||||||||||
| U.S. Government and agency securities |
$ | 23,009,237 | $ | 25,883 | $ | (1,748 | ) | $ | 23,033,372 | |||||||
| Corporate and other debt securities |
17,599,473 | 82,760 | — | 17,682,233 | ||||||||||||
| 40,608,710 | 108,643 | (1,748 | ) | 40,715,605 | ||||||||||||
| Long-term marketable securities: |
||||||||||||||||
| U.S. Government and agency securities |
3,261,524 | 10,849 | (8,546 | ) | 3,263,827 | |||||||||||
| Corporate and other debt securities |
2,750,173 | 28,105 | — | 2,778,278 | ||||||||||||
| 6,011,697 | 38,954 | (8,546 | ) | 6,042,105 | ||||||||||||
| Total |
$ | 46,620,407 | $ | 147,597 | $ | (10,294 | ) | $ | 46,757,710 | |||||||
The contractual maturities of held-to-maturity debt securities at March 31, 2011 were as follows:
| Amortized Cost |
Fair Value | |||||||
| Due in 1 year or less |
$ | 35,421,520 | $ | 35,442,696 | ||||
| Due in 1 to 2 years |
11,878,201 | 11,863,810 | ||||||
| $ | 47,299,721 | $ | 47,306,506 | |||||
Fair Value Measurement
In determining the fair value of its assets and liabilities, the Company uses various valuation approaches. The Company employs a hierarchy for inputs used in measuring fair value that maximizes the use of observable inputs and minimizes the use of unobservable inputs by requiring that observable inputs be used when available. Observable inputs are inputs that market participants would use in pricing the asset or liability based on market data obtained from sources independent of the Company. Unobservable inputs are inputs that reflect the Company’s assumptions about the inputs that market participants would use in pricing the asset or liability and are developed based on the best information available in the circumstances. The fair value hierarchy is broken down into three levels based on the source of inputs as follows:
| Level 1 | — | Valuations based on unadjusted quoted prices in active markets for identical assets or liabilities that the Company has the ability to access | ||
| Level 2 | — | Valuations based on quoted prices for similar assets or liabilities in active markets, quoted prices for identical or similar assets or liabilities in markets that are not active and models for which all significant inputs are observable, either directly or indirectly | ||
| Level 3 | — | Valuations based on inputs that are unobservable and significant to the overall fair value measurement |
The availability of observable inputs can vary among the various types of financial assets and liabilities. To the extent that the valuation is based on models or inputs that are less observable or unobservable in the market, the determination of fair value requires more judgment. In certain cases, the inputs used to measure fair value may fall into different levels of the fair value hierarchy. In such cases, for financial statement disclosure purposes, the level in the fair value hierarchy within which the fair value measurement is categorized is based on the lowest level input that is significant to the overall fair value measurement.
53
Table of Contents
The Company’s held-to-maturity securities, which are fixed income investments, are comprised of obligations of U.S. government agencies, corporate debt securities and other interest bearing securities. These held-to-maturity securities are recorded at amortized cost and are therefore not included in the Company’s market value measurement disclosure. Money market funds are valued using quoted market prices with no valuation adjustments applied. Accordingly, these securities are categorized in Level 1.
The Company has no other assets or liabilities for which fair value measurement is either required or has been elected to be applied, other than the liability for contingent consideration recorded in connection with the acquisition of BioFlash Partners, LLC (“BioFlash”). The contingent consideration is valued using management’s estimates of royalties to be paid to the former shareholders of BioFlash based on sales of the acquired assets. This valuation is a Level 3 valuation as the primary inputs are unobservable. The following table provides a roll forward of the fair value of the contingent consideration:
| Balance at March 31, 2010 |
$ | 560,000 | ||
| Payments |
(15,000 | ) | ||
| Changes in Fair Value |
13,484 | |||
| Balance at March 31, 2011 |
$ | 558,484 | ||
The following fair value hierarchy table presents information about each major category of the Company’s assets and liabilities measured at fair value on a recurring basis as of March 31, 2011:
| Fair value measurement at reporting date using: | ||||||||||||||||
| Quoted prices in active markets for identical assets (Level 1) |
Significant other observable inputs (Level 2) |
Significant unobservable inputs (Level 3) |
Total | |||||||||||||
| Assets: |
||||||||||||||||
| Money market funds |
$ | 9,167,926 | $ | 9,167,926 | ||||||||||||
There were no remeasurements to fair value during the year ended March 31, 2011 of financial assets and liabilities that are not measured at fair value on a recurring basis.
Inventories
Inventories relate to the Company’s bioprocessing business. The Company values inventory at cost or, if lower, fair market value using the first-in, first-out method. The Company reviews its inventories at least quarterly and records a provision for excess and obsolete inventory based on its estimates of expected sales volume, production capacity and expiration dates of raw materials, work-in process and finished products. Expected sales volumes are determined based on supply forecasts provided by key customers for the next three to twelve months. The Company writes down inventory that has become obsolete, inventory that has a cost basis in excess of its expected net realizable value, and inventory in excess of expected requirements to cost of product revenue. Manufacturing of bioprocessing finished goods is done to order and tested for quality specifications prior to shipment.
A change in the estimated timing or amount of demand for the Company’s products could result in additional provisions for excess inventory quantities on hand. Any significant unanticipated changes in demand or unexpected quality failures could have a significant impact on the value of inventory and reported operating results. During all periods presented in the accompanying financial statements, there have been no material adjustments related to a revised estimate of inventory valuations.
54
Table of Contents
Work-in-process and finished products inventories consist of material, labor, outside processing costs and manufacturing overhead. Inventories consist of the following:
| As of March 31, | ||||||||
| 2011 | 2010 | |||||||
| Raw Materials |
$ | 944,259 | $ | 1,067,823 | ||||
| Work-in-process |
518,374 | 395,088 | ||||||
| Finished products |
491,343 | 738,229 | ||||||
| Total |
$ | 1,953,976 | $ | 2,201,140 | ||||
Accrued Liabilities
The Company estimates accrued liabilities by identifying services performed on the Company’s behalf, estimating the level of service performed and determining the associated cost incurred for such service as of each balance sheet date. Examples of estimated accrued expenses include: 1) Fees paid to contract manufacturers in conjunction with the production of clinical materials. These expenses are normally determined through a contract or purchase order issued by the Company; 2) Service fees paid to organizations for their performance in conducting clinical trials. These expenses are determined by contracts in place for those services and communications with project managers on costs which have been incurred as of each reporting date; 3) Professional and consulting fees incurred with law firms, audit and accounting service providers and other third party consultants. These expenses are determined by either requesting those service providers to estimate unbilled services at each reporting date for services incurred or tracking costs incurred by service providers under fixed fee arrangements.
The Company has processes in place to estimate the appropriate amounts to record for accrued liabilities, which principally involve the applicable personnel reviewing the services provided. In the event that the Company does not identify certain costs which have begun to be incurred or the Company under or over-estimates the level of services performed or the costs of such services, the reported expenses for that period may be too low or too high. The date on which certain services commence, the level of services performed on or before a given date, and the cost of such services are often judgmental. The Company makes these judgments based upon the facts and circumstances known at the date of the financial statements.
Depreciation
Depreciation is calculated using the straight-line method over the estimated useful life of the asset as follows:
| Classification |
Estimated Useful Life | |
| Leasehold improvements |
Shorter of the term of the lease or estimated useful life | |
| Equipment |
Three to five years | |
| Furniture and fixtures |
Three years |
For depreciation of property and equipment, the Company expensed approximately $1,496,000, $1,349,000, and $1,077,000 in fiscal 2011, 2010, and 2009, respectively. These amounts include depreciation of assets recorded under capitalized lease agreements of approximately $82,000, $34,000, and $38,000 in 2011, 2010, and 2009, respectively.
Earnings (Loss) Per Share
Basic earnings (loss) per share for the years ended March 31, 2011, 2010 and 2009 was computed on the basis of the weighted average number of shares of common stock outstanding during the period. Diluted earnings
55
Table of Contents
(loss) per share is computed on the basis of the weighted average number of shares of common stock plus the effect of dilutive potential common shares outstanding during the period using the treasury stock method. Dilutive potential common shares include outstanding stock options, restricted stock and warrants.
Basic and diluted weighted average shares outstanding were as follows:
| Year Ended March 31, | ||||||||||||
| 2011 | 2010 | 2009 | ||||||||||
| Weighted average common shares |
30,781,881 | 30,752,041 | 30,957,957 | |||||||||
| Dilutive common stock options |
— | — | 332,276 | |||||||||
| Weighted average common shares, assuming dilution |
30,781,881 | 30,752,041 | 31,290,233 | |||||||||
Diluted weighted average shares outstanding for the years ended March 31, 2011 and 2010 do not include the impact of 2,580,600 and 2,320,150 outstanding potential common shares for stock options, respectively, as they would be anti-dilutive. Accordingly, basic and diluted net loss per share are the same for years ended March 31, 2011 and 2010.
For the year ended March 31, 2009, options to purchase 938,000 shares were excluded from the calculation of diluted earnings per share because the exercise prices of the stock options were greater than or equal to the average price of the common shares.
Segment Reporting
The Company views its operations, makes decisions regarding how to allocate resources and manages its business as one operating segment. As a result, the financial information disclosed herein represents all of the material financial information related to the Company’s principal operating segment.
The following table represents the Company’s total revenue by geographic area (based on the location of the customer):
| Year ended March 31, | ||||||||||||
| 2011 | 2010 | 2009 | ||||||||||
| United States |
50 | % | 57 | % | 60 | % | ||||||
| Sweden |
42 | % | 36 | % | 36 | % | ||||||
| Other |
8 | % | 7 | % | 4 | % | ||||||
| Total |
100 | % | 100 | % | 100 | % | ||||||
The following table represents the Company’s total revenue by product type:
| Year ended March 31 | ||||||||||||
| 2011 | 2010 | 2009 | ||||||||||
| Bioprocessing |
$ | 14,961,397 | $ | 10,304,727 | $ | 14,361,025 | ||||||
|
SecreFlo® |
— | — | 167,891 | |||||||||
| Product revenue |
$ | 14,961,397 | $ | 10,304,727 | $ | 14,528,916 | ||||||
| Royalty and other revenue |
12,329,627 | 10,666,342 | 14,832,605 | |||||||||
| Total revenue |
$ | 27,291,024 | $ | 20,971,069 | $ | 29,361,521 | ||||||
All of the Company’s assets are located in the United States for fiscal years ended March 31, 2011, 2010 and 2009.
56
Table of Contents
Concentrations of Credit Risk and Significant Customers
Financial instruments that subject the Company to significant concentrations of credit risk primarily consist of cash and equivalents, marketable securities and accounts receivable. Per the Company’s investment policy, cash equivalents and marketable securities are invested in financial instruments with high credit ratings and credit exposure to any one issue, issuer (with the exception of U.S. treasury obligations) and type of instrument is limited. At March 31, 2011, 2010 and 2009, the Company had no investments associated with foreign exchange contracts, options contracts or other foreign hedging arrangements.
Concentration of credit risk with respect to accounts receivable is limited to customers to whom the Company makes significant sales. While a reserve for the potential write-off of accounts receivable is maintained, the Company has not written off any significant accounts to date. To control credit risk, the Company performs regular credit evaluations of its customers’ financial condition.
Revenue from significant customers as a percentage of the Company’s total revenue is as follows:
| Years Ended March 31, | ||||||||||||
| 2011 | 2010 | 2009 | ||||||||||
|
Orencia® Royalties from Bristol |
38 | % | 43 | % | 46 | % | ||||||
| Bioprocessing Customer A |
42 | % | 36 | % | 36 | % | ||||||
Significant accounts receivable balances as a percentage of the Company’s total trade accounts receivable and royalties receivable balances are as follows:
| As of March 31, | ||||||||
| 2011 | 2010 | |||||||
|
Orencia® Royalties from Bristol |
56 | % | 80 | % | ||||
| Bioprocessing Customer A |
21 | % | — | |||||
| Bioprocessing Customer B |
— | 13 | % | |||||
Goodwill, Other Intangible Assets and Acquisitions
Acquisitions
Amounts paid for acquisitions are allocated to the assets acquired and liabilities assumed, if any, based on their fair values at the dates of acquisition. The fair value of identifiable intangible assets is based on detailed valuations that use information and assumptions determined by management. Any excess of purchase price over the fair value of the net tangible and intangible assets acquired is allocated to goodwill. The fair value of contingent consideration includes estimates and judgments made by management regarding the extent of royalties to be earned in excess of the defined minimum royalties. Management updates these estimates and the related fair value of contingent consideration at each reporting period.
Goodwill
Goodwill is not amortized and is reviewed for impairment at least annually. There was no evidence of impairment to goodwill for fiscal year 2011.
Other Intangible Assets
| As of March 31, 2011 |
Gross Carrying Amount |
Accumulated Amortization |
Useful Life (in years) |
|||||||||
| Technology – developed |
$ | 760,000 | $ | (110,834 | ) | 8 | ||||||
| Patents |
240,000 | (35,000 | ) | 8 | ||||||||
| Customer relationships |
430,000 | (62,708 | ) | 8 | ||||||||
| $ | 1,430,000 | $ | (208,542 | ) | ||||||||
57
Table of Contents
| As of March 31, 2010 |
Gross Carrying Amount |
Accumulated Amortization |
Useful Life (in years) |
|||||||||
| Technology – developed |
$ | 760,000 | $ | (15,834 | ) | 8 | ||||||
| Patents |
240,000 | (5,000 | ) | 8 | ||||||||
| Customer relationships |
430,000 | (8,958 | ) | 8 | ||||||||
| $ | 1,430,000 | $ | (29,792 | ) | ||||||||
On January 29, 2010, the Company acquired the assets of BioFlash including a technology platform for the production of pre-packed, “plug and play” chromatography columns for total consideration transferred of $2.6 million. This patented technology enables economical production of chromatography columns in a format that is ready for use in the production of a broad range of biopharmaceuticals including monoclonal antibodies, vaccines and recombinant proteins. The terms of the acquisition included an upfront payment of $1.8 million, a $300,000 payment made in November 2010, and future royalties based on product sales.
Amortization expense for amortized intangible assets was approximately $179,000 in fiscal 2011. The Company expects to record amortization expense of approximately $179,000 in each of the next five years.
Intangible assets are amortized over their useful lives using the estimated economic benefit method, as applicable, and the amortization expense is recorded within selling, general and administrative expense in the statements of operations. Intangible assets and their related useful lives are reviewed at least annually to determine if any adverse conditions exist that would indicate the carrying value of these assets may not be recoverable. More frequent impairment assessments are conducted if certain conditions exist, including: a change in the competitive landscape, any internal decisions to pursue new or different technology strategies, a loss of a significant customer, or a significant change in the market place including changes in the prices paid for our products or changes in the size of the market for our products. An impairment results if the carrying value of the asset exceeds the estimated fair value of the asset based on the sum of the future undiscounted cash flows expected to result from the use and disposition of the asset. If the estimate of an intangible asset’s remaining useful life is changed, the remaining carrying amount of the intangible asset is amortized prospectively over the revised remaining useful life. There were no indicators of impairment in fiscal year 2011.
Stock Based Compensation
The Company uses the Black-Scholes option pricing model to calculate the fair value of share-based awards on the grant date. The following assumptions are used in calculating the fair value of share-based awards:
Expected term—The expected term of options granted represents the period of time for which the options are expected to be outstanding and is derived from the Company’s historical stock option exercise experience and option expiration data. The expected term is presumed to be the midpoint between the vesting date and the end of the contractual term. In addition, for purposes of estimating the expected term, the Company has aggregated all individual option awards into one group as the Company does not expect substantial differences in exercise behavior among its employees.
Expected volatility—The expected volatility is a measure of the amount by which the Company’s stock price is expected to fluctuate during the expected term of options granted. The Company determines the expected volatility based primarily upon the historical volatility of the Company’s common stock over a period commensurate with the option’s expected term, exclusive of any events not reasonably anticipated to recur over the option’s expected term.
Risk-free interest rate—The risk-free interest rate is the implied yield available on U.S. Treasury zero-coupon issues with a remaining term equal to the option’s expected term on the grant date.
58
Table of Contents
Expected dividend yield—The Company has never declared or paid any cash dividends on any of its capital stock and does not expect to do so in the foreseeable future. Accordingly, the Company uses an expected dividend yield of zero to calculate the grant-date fair value of a stock option.
Estimated forfeiture rates—The Company has applied, based on an analysis of its historical forfeitures, annual forfeiture rates of 8% for awards granted to non-executive level employees and 3% for awards granted to executive level employees to all unvested stock options as of March 31, 2011. The Company reevaluates this analysis periodically and adjusts these estimated forfeiture rates as necessary. Ultimately, the Company will only recognize expense for those shares that vest.
Recent Accounting Pronouncements
In October 2009, the Financial Accounting Standards Board (“FASB”) issued Accounting Standards Update (“ASU”) No. 2009-13, “Multiple-Deliverable Arrangements—a consensus of the FASB Emerging Issues Task Force” (“ASU 2009-13”). This ASU establishes the accounting and reporting guidance for arrangements under which a vendor will perform multiple revenue-generating activities. Specifically, the provisions of this update address how to separate deliverables and how to measure and allocate arrangement consideration to one or more units of accounting. This update is effective prospectively for revenue arrangements entered into or materially modified in fiscal years beginning on or after June 15, 2010, and the Company is therefore required to adopt this ASU on April 1, 2011. The Company does not currently believe that adoption will have a material impact on its results of operations, financial position or cash flows, but it could impact how the Company evaluates the accounting treatment on future license and/or collaboration arrangements.
In April 2010, FASB issued ASU No. 2010-17, “Milestone Method of Revenue Recognition—a consensus of the FASB Emerging Issues Task Force” (“ASU 2010-17”). This ASU provides guidance on defining a milestone and determining when it may be appropriate to apply the milestone method of revenue recognition for research and development transactions. ASU 2010-17 is effective on a prospective basis for milestones achieved in fiscal years, and interim periods within those years, beginning on or after June 15, 2010. The Company adopted ASU 2010-17 in July 2010. The adoption of this update did not have a material impact on the Company’s results of operations, financial position or cash flows as its accounting policy was consistent with the provisions of ASU 2010-17.
| 3. | Income Taxes |
For the year ended March 31, 2011, the Company has no current provisions for federal or state income taxes. For the year ended March 31, 2010, the tax benefit of ($834,766) is comprised of a current benefit for federal income taxes of ($834,766). The benefit for federal income taxes is due to the “Worker, Homeownership, and Business Assistance Act of 2009” (the “Act”) that was enacted in November 2009. Among other things, the Act suspended the limitation on the use of net operating losses to offset alternative minimum tax liabilities. The Company paid a total of approximately $835,000 of alternative minimum taxes in the fiscal years ended March 31, 2009 and 2008 combined. During the current year, the Company received a refund of approximately $835,000 upon filing its tax return for the year ended March 31, 2010 and related carry-back claim. This refundable tax amount is included in prepaid expenses and other current assets on the balance sheet at March 31, 2010. For the year ended March 31, 2009, the tax provision of $26,699 is comprised of a current provision for federal income taxes of $29,557 and a current benefit for state income taxes of ($2,858).
At March 31, 2011, the Company had net operating loss carryforwards of approximately $56,899,000 and business tax credits carryforwards of approximately $2,309,000 available to reduce future federal income taxes, if any. Additionally, at March 31, 2011, the Company had net operating loss carryforwards of approximately $4,184,000 and business tax credits carryforwards of approximately $3,231,000 available to reduce future state income taxes, if any. The net operating loss and business tax credits carryforwards will continue to expire at various dates through March 2031. The net operating loss and business tax credit carryforwards are subject to review and possible adjustment by the Internal Revenue Service and may be limited in the event of certain changes in the ownership interest of significant stockholders.
59
Table of Contents
Our deferred tax assets consist of the following:
| As of March 31, | ||||||||
| 2011 | 2010 | |||||||
| Temporary timing differences |
$ | 4,520,000 | $ | 4,700,000 | ||||
| Net operating loss carryforwards |
19,587,000 | 21,919,000 | ||||||
| Tax business credits carryforwards |
4,442,000 | 4,157,000 | ||||||
| Total deferred tax assets |
28,549,000 | 30,776,000 | ||||||
| Valuation allowance |
(28,549,000 | ) | (30,776,000 | ) | ||||
| Net deferred tax asset |
$ | — | $ | — | ||||
At March 31, 2011 and 2010, a full valuation allowance has been provided against the deferred tax assets, as it is uncertain if the Company will realize the benefits of such deferred tax assets. The valuation allowance increased $2,227,000 for the year ended March 31, 2011.
The reconciliation of the federal statutory rate to the effective income tax rate for the years ended March 31, 2011, 2010 and 2009 is as follows:
| Years Ended March 31, | ||||||||||||||||||||||||
| 2011 | 2010 | 2009 | ||||||||||||||||||||||
| (Loss) income before income taxes |
$ | (43,509 | ) | % | $ | (4,898,610 | ) | % | $ | 5,772,727 | % | |||||||||||||
| Expected tax (recovery) at statutory rate |
(14,793 | ) | (34.0 | )% | (1,665,527 | ) | (34.0 | )% | 1,962,727 | 34.0 | % | |||||||||||||
| Adjustments due to: |
||||||||||||||||||||||||
| State income and franchise taxes |
96,141 | 221.0 | % | (80,151 | ) | (1.6 | )% | 287,822 | 5.0 | % | ||||||||||||||
| Utilization of loss carryforwards and business tax credits |
(66,126 | ) | (152.0 | )% | (934,659 | ) | (19.1 | )% | (1,891,597 | ) | (32.8 | )% | ||||||||||||
| Alternative minimum tax |
— | — | — | — | 96,540 | 1.7 | % | |||||||||||||||||
| Permanent differences |
250,483 | 575.7 | % | 255,766 | 5.2 | % | 207,508 | 3.6 | % | |||||||||||||||
| Change in valuation allowance |
(265,706 | ) | (610.7 | )% | 1,589,805 | 32.5 | % | (636,301 | ) | (11.0 | )% | |||||||||||||
| (Benefit) provision for income taxes |
$ | — | (0.0 | )% | $ | (834,766 | ) | (17.0 | )% | $ | 26,699 | 0.5 | % | |||||||||||
At March 31, 2011, 2010 and 2009, the Company had no material unrecognized tax benefits.
The Company recognizes interest and penalties related to uncertain tax positions in income tax expense. No interest and penalties have been recognized by the Company to date.
Fiscal years 2006 through 2011 are subject to examination by the federal and state taxing authorities. There are no income tax examinations currently in process.
| 4. | Stockholders’ Equity |
Common Stock and Warrants
At March 31, 2011, the Company has reserved 2,843,409 shares of common stock pursuant to the Plans, as described below. On April 6, 2007, the Company issued warrants to an individual at Scripps to purchase up to 150,000 shares of common stock at $0.01 per share, as discussed in Note 11. The warrants have a 7-year term and are exercisable based on performance criteria as detailed in the warrant agreement. At this time, the Company does not believe that the performance criteria are probable of being achieved in the near future.
60
Table of Contents
Shareholder Rights Plan
In March 2003, the Company adopted a Shareholder Rights Agreement (the “Rights Agreement”). Under the Rights Agreement, the Company distributed certain rights to acquire shares of the Company’s Series A junior participating preferred stock (the “Rights”) as a dividend for each share of common stock held of record as of March 17, 2003. Each share of common stock issued after the March 17, 2003 record date has an attached Right. Under certain conditions involving an acquisition by any person or group of 15% or more of the common stock (20% in the case of a certain stockholder) (“the 15% holder”), each Right permits the holder (other than the 15% holder) to purchase common stock having a value equal to twice the exercise price of the Right, upon payment of the exercise price of the Right. In addition, in the event of certain business combinations after an acquisition by a person or group of 15% or more of the common stock (20% in the case of a certain stockholder), each Right entitles the holder (other than the 15% holder) to receive, upon payment of the exercise price, common stock having a value equal to twice the exercise price of the Right. The Rights have no voting privileges and, unless and until they become exercisable, are attached to, and automatically trade with, the Company’s common stock. The Rights will terminate upon the earlier of the date of their redemption or March 2013.
Stock Based Compensation
For fiscal years ended March 31, 2011, 2010 and 2009, the Company recorded stock-based compensation expense of approximately $1,003,000, $1,007,000 and $823,000, respectively, for stock options granted under the Second Amended and Restated 2001 Repligen Corporation Stock Plan (the “2001 Plan”).
The 2001 Plan allows for the granting of incentive and nonqualified options and restricted stock and other equity awards to purchase shares of common stock. Incentive options granted to employees under the 2001 Plan generally vest over a four to five-year period, with 20%-25% vesting on the first anniversary of the date of grant and the remainder vesting in equal yearly installments thereafter. Nonqualified options issued to non-employee directors and consultants under the 2001 Plan generally vest over one year. Options granted under the 2001 Plan have a maximum term of ten years from the date of grant and generally, the exercise price of the stock options equals the fair market value of the Company’s common stock on the date of grant. At March 31, 2011, options to purchase 2,580,600 shares were outstanding under the 2001 Plan and the 1992 Repligen Corporation Stock Option Plan (collectively with the 2001 Plan, the “Plans”). At March 31, 2011, 262,809 shares were available for future grant under the 2001 Plan.
The Company uses the Black-Scholes option pricing model to calculate the fair value of share-based awards on the grant date. The fair value of share-based awards granted during the fiscal years ended March 31, 2011, 2010 and 2009 were calculated using the following estimated weighted-average assumptions:
| Years Ended March 31, | ||||||
| 2011 | 2010 | 2009 | ||||
| Expected term (years) |
6.5 | 6.5 | 6.5 | |||
| Volatility |
55.94% - 63.60% | 58.12% - 65.14% | 60.47% - 64.07% | |||
| Risk-free interest rate |
1.81% - 2.83% | 2.54% - 3.14% | 1.88% - 3.71% | |||
| Expected dividend yield |
— | — | — | |||
The Company recognizes stock-based compensation expense on a straight-line basis over the requisite service period based upon options that are ultimately expected to vest, and accordingly, such compensation expense has been adjusted by an amount of estimated forfeitures.
61
Table of Contents
Information regarding option activity for the year ended March 31, 2011 under the Plans is summarized below:
| Options Outstanding |
Weighted- Average Exercise Price Per Share |
Weighted- Average Remaining Contractual Term (in years) |
Aggregate Intrinsic Value |
|||||||||||||
| Options outstanding at April 1, 2010 |
2,320,150 | $ | 4.37 | |||||||||||||
| Granted |
580,000 | 3.56 | ||||||||||||||
| Exercised |
(50,450 | ) | 1.88 | |||||||||||||
| Forfeited/cancelled |
(269,100 | ) | 5.21 | |||||||||||||
| Options outstanding at March 31, 2011 |
2,580,600 | $ | 4.15 | 6.48 | $ | 903,862 | ||||||||||
| Options exercisable at March 31, 2011 |
1,457,900 | $ | 4.09 | 4.97 | $ | 667,488 | ||||||||||
| Vested and expected to vest at March 31, 2011 (1) |
2,436,718 | $ | 4.13 | 6.38 | $ | 879,944 | ||||||||||
| (1) | This represents the number of vested options as of March 31, 2011 plus the number of unvested options expected to vest as of March 31, 2011 based on the unvested outstanding options at March 31, 2011 adjusted for estimated forfeitures. |
The aggregate intrinsic value in the table above represents the total pre-tax intrinsic value (the difference between the closing price of the common stock on March 31, 2011 of $3.74 and the exercise price of each in-the-money option) that would have been received by the option holders had all option holders exercised their options on March 31, 2011.
The weighted average grant date fair value of options granted during the fiscal years ended March 31, 2011 and 2010 was $2.11 and $2.71, respectively. The total fair value of stock options that vested during fiscal years ended March 31, 2011, 2010 and 2009 was approximately $993,000, $1,067,000 and $655,000, respectively. The total intrinsic value of options exercised during the years ended March 31, 2011, 2010 and 2009 was approximately $95,000, $44,000 and $418,000, respectively, determined as of the date of exercise. The Company received approximately $7,000, $54,000 and $402,000 from stock option exercises during the years ended March 31, 2011, 2010 and 2009, respectively.
As of March 31, 2011, there was $1,961,018 of total unrecognized compensation cost related to unvested share-based awards. This cost is expected to be recognized over a weighted average remaining requisite service period of 3.05 years. The Company expects 978,818 in unvested options to vest over the next five years.
| 5. | Commitments and Contingencies |
Lease Commitments
In 2001, the Company entered into a ten-year lease agreement for approximately 25,000 square feet of space located in Waltham, Massachusetts to be used for its corporate headquarters, manufacturing, research and development, and marketing and administrative operations. In connection with this lease agreement, the Company issued a letter of credit in the amount of $200,000 to the lessor. The letter of credit is collateralized by a certificate of deposit held by the bank that issued the letter of credit. The certificate of deposit is classified as restricted cash in the accompanying balance sheet as of March 31, 2011 and 2010. In 2007, the Company entered into a five-year lease agreement for approximately 2,500 square feet of space in Waltham, Massachusetts to provide for expanded manufacturing operations. Adjacent to this space, the Company entered into a two-year lease in 2008 for approximately 7,350 square feet of additional space to be used for expanded manufacturing and administrative operations.
62
Table of Contents
In fiscal 2005 and 2006, Repligen entered into capital lease agreements to provide the Company with manufacturing and office equipment over a three to five-year period. As of March 31, 2011, the Company has no remaining capital lease obligations.
Obligations under non-cancelable operating leases, including the facility leases discussed above, as of March 31, 2011 are approximately as follows:
| Years Ending |
Operating Leases | |||
| March 31, 2012 |
$ | 451,000 | ||
| March 31, 2013 |
7,000 | |||
| March 31, 2014 |
7,000 | |||
| March 31, 2015 |
2,000 | |||
| Minimum lease payments |
$ | 467,000 | ||
Rent expense charged to operations under operating leases was approximately $686,000, $689,000 and $631,000 for the years ended March 31, 2011, 2010 and 2009, respectively. As of March 31, 2011, 2010 and 2009, the Company had deferred rent liabilities of $27,000, $64,000 and $100,600, respectively, related to the escalating rent provisions for the Waltham headquarters.
Licensing and Research Agreements
The Company licenses certain technologies that are, or may be, incorporated into its technology under several agreements and also has entered into several clinical research agreements which require the Company to fund certain research projects. Generally, the license agreements require the Company to pay annual maintenance fees and royalties on product sales once a product has been established using the technologies. The Company has recorded research and development expenses associated with license agreements of approximately $374,000, $643,000, and $326,000 for fiscal years 2011, 2010 and 2009, respectively.
In October 2009, the Company entered into an exclusive worldwide commercial license agreement with Families of Spinal Muscular Atrophy (see Note 12). The initial license fee of $500,000 and a related sublicense fee of $175,000 were charged to research and development expenses in fiscal 2010. A related sublicense fee of $65,000 was charged to research and development expenses in fiscal 2011.
Purchase Orders, Supply Agreements and Other Contractual Obligations
In the normal course of business, the Company has entered into purchase orders and other agreement with manufacturers, distributors and others. Outstanding obligations at March 31, 2011 of approximately $3,850,000 are expected to be completed within one year.
| 6. | Prepaid Expenses and Other Current Assets |
Prepaid expenses and other current assets consist of the following:
| As of March 31, | ||||||||
| 2011 | 2010 | |||||||
| Equipment and services |
$ | 179,153 | $ | 109,358 | ||||
| Interest receivable |
103,695 | 223,290 | ||||||
| Prepaid insurance |
95,233 | 169,829 | ||||||
| Clinical and research expenses |
57,630 | 80,031 | ||||||
| Prepaid taxes |
— | 882,439 | ||||||
| Other |
57,056 | 14,160 | ||||||
| Total |
$ | 492,767 | $ | 1,479,107 | ||||
63
Table of Contents
| 7. | Accrued Liabilities |
Accrued liabilities consist of the following:
| As of March 31, | ||||||||
| 2011 | 2010 | |||||||
| Employee compensation |
$ | 1,466,225 | $ | 1,285,172 | ||||
| Research and development |
759,450 | 787,267 | ||||||
| Unearned revenue |
660,624 | 306,794 | ||||||
| Royalty and license fees |
410,591 | 881,900 | ||||||
| Professional fees |
87,634 | 216,086 | ||||||
| Other accrued expenses |
307,999 | 188,916 | ||||||
| Total |
$ | 3,692,523 | $ | 3,666,135 | ||||
| 8. | Employee Benefit Plan |
The Repligen Corporation 401(k) Savings and Retirement Plan (the “401(k) Plan”) is a qualified defined contribution plan in accordance with Section 401(k) of the Internal Revenue Code. All employees over the age of 21 are eligible to make pre-tax contributions up to a specified percentage of their compensation. Under the 401(k) Plan, the Company may, but is not obligated to match a portion of the employees’ contributions up to a defined maximum. The match is calculated on a calendar year basis. The Company matched approximately $108,000, $117,000, and $85,000 for the fiscal years ended March 31, 2011, 2010, and 2009 respectively.
| 9. | Related Party Transactions |
In fiscal year 2009, the Company paid Dr. Alexander Rich, Chairman of the Board of Directors, $47,400 per a consulting agreement that automatically extended for successive one-year terms unless terminated by either party at least 90 days prior to the next anniversary date. Effective January 2009, this consulting agreement was terminated and Dr. Rich is now paid a monthly retainer similar to the Company’s other directors. Dr. Rich received no additional cash compensation for attendance at Board of Directors meetings or otherwise as director.
| 10. | Legal Proceedings |
Bristol-Myers Squibb Company (“Bristol”)
In January 2006, Repligen and the University of Michigan jointly filed a complaint against Bristol in the United States District Court for the Eastern District of Texas for infringement of U.S. Patent No. 6,685,941 (“the ‘941 patent”) for the commercial sale of Orencia®. The ‘941 patent, entitled “Methods of Treating Autoimmune Disease via CTLA4-Ig,” covers methods of using CTLA4-Ig to treat rheumatoid arthritis as well as other therapeutic methods. Repligen has exclusive rights to this patent from its owners, the University of Michigan and the U.S. Navy. In February 2006, Bristol answered the complaint and counterclaimed seeking a declaratory judgment that the ‘941 patent is invalid and unenforceable and that Bristol does not infringe the patent.
On April 7, 2008, Repligen and the University of Michigan entered into a settlement agreement (the “Bristol Settlement”) with Bristol relating to the lawsuit against Bristol for infringement of the ‘941 patent. Pursuant to the Bristol Settlement, Bristol made an initial payment of $5 million to Repligen. The settlement further provides for Bristol to pay royalties on the United States net sales of Orencia® for any clinical indication at a rate of 1.8% for the first $500 million of annual net sales, 2.0% for the next $500 million of annual net sales and 4% of annual net sales in excess of $1 billion for each year from January 1, 2008 until December 31, 2013. The Bristol Settlement served as the basis for Repligen and the University of Michigan to dismiss the lawsuit against Bristol and for Repligen and the University of Michigan to grant to Bristol an exclusive worldwide license to the ‘941 patent and certain other intellectual property.
64
Table of Contents
Pursuant to the Bristol Settlement, the Company recognized royalty revenue in fiscal years 2011, 2010 and 2009 of approximately $10,251,000, $8,980,000 and $13,383,000, respectively. The $13,383,000 recognized in fiscal 2009 included an initial $5.0 million royalty payment, $1.3 million in royalties for sales of Orencia® from January 1, 2008 to March 31, 2008, as well as $7.1 million for sales in fiscal year 2009 (see Note 2).
Repligen must also remit to the University of Michigan 15% of all royalty revenue received from Bristol. Royalty expense for fiscal years 2011, 2010 and 2009 was approximately $1,537,000, $1,347,000 and $1,091,000, respectively. This operating expense is included on the statements of operations under the line item “Cost of royalty and other revenue.”
| 11. | Scripps License Agreement |
On April 6, 2007, the Company entered into an exclusive worldwide commercial license agreement (“License Agreement”) with The Scripps Research Institute (“Scripps”). Pursuant to the License Agreement, the Company obtained a license to use, commercialize and sublicense certain patented technology and improvements thereon, owned or licensed by Scripps, relating to compounds which may have utility in treating Friedreich’s ataxia, an inherited neurodegenerative disease. Research in tissues derived from patients, as well as from mice, indicates that the licensed compounds increase production of the protein frataxin, which suggests potential utility of these compounds in slowing or stopping progression of the disease. There are currently no approved treatments for Friedreich’s ataxia in the U.S.
Pursuant to the License Agreement, the Company agreed to pay Scripps an initial license fee of $300,000, certain royalty and sublicense fees and, in the event that the Company achieves specified developmental and commercial milestones, certain additional milestone payments. Total future milestone payments, if all milestones were achieved, would be approximately $4.3 million. In addition, the Company issued Scripps and certain of its designees 87,464 shares of the Company’s common stock which had a value of $300,000 on the date of issuance. The Company recorded the initial license payment and the value of the shares issued as research and development costs in the statements of operations in fiscal 2008.
In connection with the License Agreement, the Company issued warrants to an individual at Scripps to purchase up to 150,000 shares of common stock. The warrants have a 7-year term and are exercisable based on performance criteria as detailed in the warrant agreement. No expense has been recorded related to these warrants through March 31, 2011, as none of the performance criteria have been achieved. At this time, the Company does not believe that the performance criteria are probable of being achieved in the near future.
The License Agreement with Scripps expires or may be terminated (i) when all of the royalty obligations under the License Agreement expire; (ii) at any time by mutual written consent; (iii) by Scripps if the Company (a) fails to make payments under the License Agreement, (b) fails to achieve certain developmental and commercial objectives, (c) becomes insolvent, (d) is convicted of a felony relating to the manufacture, use or sale of the licensed technology, or (e) defaults in its performance under the License Agreement; or (iv) by the Company upon 90 days written notice.
| 12. | FSMA License Agreement |
On October 22, 2009, the Company entered into an exclusive worldwide commercial license agreement (“FSMA License Agreement”) with Families of Spinal Muscular Atrophy (“FSMA”). Pursuant to the FSMA License Agreement, the Company obtained an exclusive license to develop and commercialize certain patented technology and improvements thereon, owned or licensed by FSMA, relating to compounds which may have utility in treating spinal muscular atrophy (“SMA”). SMA is an inherited neurodegenerative disease in which a defect in the survival motor neuron gene (“SMN”) results in low levels of the protein SMN and leads to progressive damage to motor neurons, loss of muscle function and, in many patients, early death.
65
Table of Contents
Pursuant to the License Agreement, the Company paid FSMA an initial license fee of $500,000 and a related sublicense fee of $175,000 in fiscal 2010. These license fees were recorded as research and development expense in the statements of operations. If all milestones are achieved, total financial obligations under this agreement, including milestone payments, sublicense fees, and other charges, could total approximately $16,000,000. Given the uncertain nature of such a development program, the likelihood that products or services will result from the research program is not known at this time. The Company has therefore ascribed no value to the license or the related liability.
The License Agreement with FSMA expires or may be terminated (i) on the later of: (a) when all related patents have expired or been abandoned, or (b) 10 years following the first commercial sale of a licensed product; (ii) by FSMA if the Company (a) fails to make payments under the License Agreement, (b) fails to use commercially reasonable efforts towards development and commercial objectives, (c) fails to maintain the required insurance or becomes insolvent, or (d) defaults in its performance under the License Agreement.
| 13. | BioFlash Acquisition |
On January 29, 2010, the Company acquired the assets of BioFlash including a technology platform for the production of pre-packed, “plug and play” chromatography columns for total consideration transferred of $2.6 million. This patented technology enables economical production of chromatography columns in a format that is ready for use in the production of a broad range of biopharmaceuticals including monoclonal antibodies, vaccines and recombinant proteins. The terms of the acquisition included an upfront payment of $1.8 million, a milestone payment of $300,000 payable the earlier of (i) the date on which Repligen receives an acknowledgment executed by a specific customer or (ii) the second anniversary of the acquisition date, and future royalties based on product sales. The milestone payment was made to BioFlash in November 2010.
The Company will manufacture and sell these pre-packed columns under the brand name Opus. Opus pre-packed chromatography columns have the potential to improve manufacturing efficiencies by reducing time for column packing, set-up and cleaning.
Consideration Transferred
The Company accounted for the acquisition of the assets of BioFlash as the purchase of a business under U.S. Generally Accepted Accounting Principles. Under the acquisition method of accounting, the assets of BioFlash were recorded as of the acquisition date, at their respective fair values, and consolidated with those of Repligen. The purchase price was based upon estimates of the fair value of assets acquired. The preparation of the valuation required the use of significant assumptions and estimates. Critical estimates included, but were not limited to, future expected cash flows, including projected revenues and expenses, and the applicable discount rates. These estimates were based on assumptions that the Company believes to be reasonable. However, actual results may differ from these estimates. The Company incurred transaction costs of $90,707 associated with the acquisition of the assets of BioFlash.
The total consideration transferred follows:
| Cash consideration |
$ | 1,780,000 | ||
| Liability for additional payment |
300,000 | |||
| Estimated fair value of contingent consideration |
560,000 | |||
| Total consideration transferred |
$ | 2,640,000 | ||
The fair value of contingent consideration was determined based upon a probability weighted analysis of expected future royalty payments (and the fair value of a time-based additional payment) to be made to former shareholders of BioFlash. The liability for contingent consideration is included in long-term liabilities on the balance sheets and will be remeasured at each reporting period until the contingency is resolved.
66
Table of Contents
Allocation of Consideration Transferred
The following chart summarizes the allocation of consideration transferred:
| Intangible assets subject to amortization |
$ | 1,430,000 | ||
| Goodwill |
994,000 | |||
| Equipment |
216,000 | |||
| Total |
$ | 2,640,000 | ||
The excess of the consideration transferred over the fair value of net tangible assets acquired was allocated to specific intangible asset categories as follows:
| Amount Assigned |
Amortization Period |
|||||||
| Amortizable intangible assets |
||||||||
| Technology – developed |
$ | 760,000 | 8 years | |||||
| Patents |
240,000 | 8 years | ||||||
| Customer relationships |
430,000 | 8 years | ||||||
| $ | 1,430,000 | |||||||
| Goodwill |
994,000 | |||||||
The Company believes that the intangible assets were recorded at fair value at the date of acquisition and do not exceed the amount a third party would pay for the assets. The Company used the income approach to determine the fair value of the amortizable intangible assets.
Various factors contributed to the establishment of goodwill, including the expected business plans and opportunities to introduce future products to BioFlash’s customer base.
67
Table of Contents
| 14. | Selected Quarterly Financial Data (Unaudited) |
The following table contains consolidated statements of operations information for each quarter of fiscal 2011 and 2010. The Company believes that the following information reflects all normal recurring adjustments necessary for a fair presentation of the information for the periods presented. The operating results for any quarter are not necessarily indicative of results for any future period.
| Q4 FY11 | Q3 FY11 | Q2 FY11 | Q1 FY11 | Q4 FY10 | Q3 FY10 | Q2 FY10 | Q1 FY10 | |||||||||||||||||||||||||
| (in thousands, except per share amounts) | ||||||||||||||||||||||||||||||||
| Revenue: |
||||||||||||||||||||||||||||||||
| Product revenue |
$ | 3,150 | $ | 3,126 | $ | 4,416 | $ | 4,269 | $ | 2,225 | $ | 2,865 | $ | 2,742 | $ | 2,473 | ||||||||||||||||
| Royalty and other revenue |
2,756 | 3,942 | 2,891 | 2,741 | 2,647 | 2,752 | 2,679 | 2,588 | ||||||||||||||||||||||||
| Total revenue |
5,906 | 7,068 | 7,307 | 7,010 | 4,872 | 5,617 | 5,421 | 5,061 | ||||||||||||||||||||||||
| Operating expenses: |
||||||||||||||||||||||||||||||||
| Cost of product revenue |
1,393 | 1,449 | 1,472 | 1,266 | 885 | 1,085 | 918 | 1,271 | ||||||||||||||||||||||||
| Cost of royalty and other revenue |
376 | 412 | 377 | 372 | 345 | 343 | 341 | 318 | ||||||||||||||||||||||||
| Research and development |
3,785 | 2,930 | 3,119 | 2,695 | 3,453 | 3,845 | 3,479 | 3,383 | ||||||||||||||||||||||||
| Selling, general and administrative |
2,438 | 1,980 | 1,813 | 1,788 | 1,952 | 1,714 | 1,889 | 1,517 | ||||||||||||||||||||||||
| Total operating expenses |
7,992 | 6,771 | 6,781 | 6,121 | 6,635 | 6,987 | 6,627 | 6,489 | ||||||||||||||||||||||||
| (Loss) income from operations |
(2,086 | ) | 297 | 526 | 889 | (1,763 | ) | (1,370 | ) | (1,206 | ) | (1,428 | ) | |||||||||||||||||||
| Investment income |
69 | 92 | 97 | 99 | 134 | 187 | 227 | 322 | ||||||||||||||||||||||||
| Interest expense |
(13 | ) | (13 | ) | — | — | — | (1 | ) | (1 | ) | — | ||||||||||||||||||||
| (Loss) income before income taxes |
(2,030 | ) | 376 | 623 | 988 | (1,629 | ) | (1,184 | ) | (980 | ) | (1,106 | ) | |||||||||||||||||||
| Income tax (benefit) provision |
— | — | — | — | — | (835 | ) | — | — | |||||||||||||||||||||||
| Net (loss) income |
$ | (2,030 | ) | $ | 376 | $ | 623 | $ | 988 | $ | (1,629 | ) | $ | (349 | ) | $ | (980 | ) | $ | (1,106 | ) | |||||||||||
| Earnings (loss) per share: |
||||||||||||||||||||||||||||||||
| Basic |
$ | (0.06 | ) | $ | 0.01 | $ | 0.02 | $ | 0.03 | $ | (0.05 | ) | $ | (0.01 | ) | $ | (0.03 | ) | $ | (0.04 | ) | |||||||||||
| Diluted |
$ | (0.06 | ) | $ | 0.01 | $ | 0.02 | $ | 0.03 | $ | (0.05 | ) | $ | (0.01 | ) | $ | (0.03 | ) | $ | (0.04 | ) | |||||||||||
| Weighted average shares outstanding: |
||||||||||||||||||||||||||||||||
| Basic |
30,782 | 30,787 | 30,780 | 30,768 | 30,752 | 30,759 | 30,746 | 30,742 | ||||||||||||||||||||||||
| Diluted |
30,782 | 31,005 | 30,920 | 30,926 | 30,752 | 30,759 | 30,746 | 30,742 | ||||||||||||||||||||||||
68