Attached files
| file | filename |
|---|---|
| 8-K - FORM 8-K - Simplicity Bancorp, Inc. | t70913_8k.htm |
Exhibit 99.1
 |
June 2011
Dustin Luton, Chief Financial Officer, KFFG
President/COO, Kaiser Federal Bank
|
 |
FINANCIAL HIGHLIGHTS
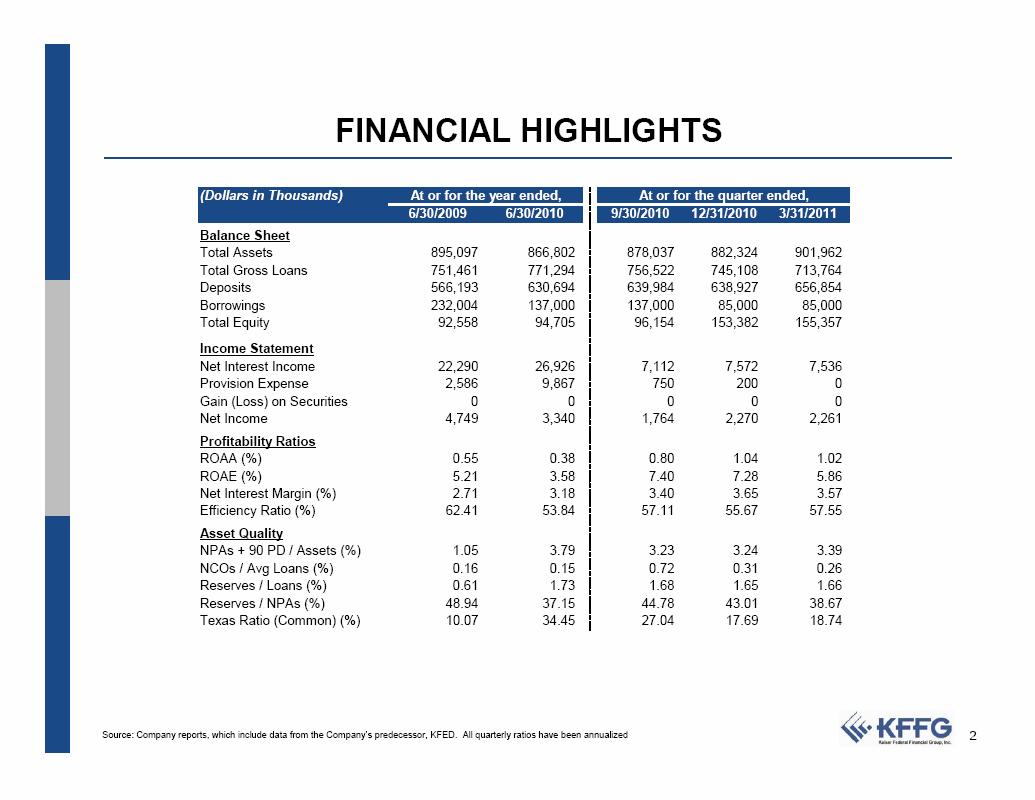
(Dollars in Thousands) At or for the year ended, 6/30/2009 6/30/2010 At or for the quarter ended, 9/30/2010 12/31/2010 3/31/2011 Balance Sheet Total Assets 895,097 866,802 878,037 882,324 901,962 Total Gross Loans 751,461 771,294 756,522 745,108 713,764 Deposits 566,193 630,694 639,984 638,927 656,854 Borrowings 232,004 137,000 137,000 85,000 85,000 Total Equity 92,558 94,705 96,154 153,382 155,357 Income Statement Net Interest Income 22,290 26,926 7,112 7,572 7,536 Provision Expense 2,586 9,867 750 200 0 Gain (Loss) on Securities 0 0 0 0 0 Net Income 4,749 3,340 1,764 2,270 2,261 Profitability Ratios ROAA (%) 0.55 0.38 0.80 1.04 1.02 ROAE (%) 5.21 3.58 7.40 7.28 5.86 Net Interest Margin (%) 2.71 3.18 3.40 3.65 3.57 Efficiency Ratio (%) 62.41 53.84 57.11 55.67 57.55 Asset Quality NPAs + 90 PD / Assets (%) 1.05 3.79 3.23 3.24 3.39 NCOs / Avg Loans (%) 0.16 0.15 0.72 0.31 0.26 Reserves / Loans (%) 0.61 1.73 1.68 1.65 1.66 Reserves / NPAs (%) 48.94 37.15 44.78 43.01 38.67 Texas Ratio (Common) (%) 10.07 34.45 27.04 17.69 18.74 Source: Company reports, which include data from the Company’s predecessor, KFED. All quarterly ratios have been annualized
|
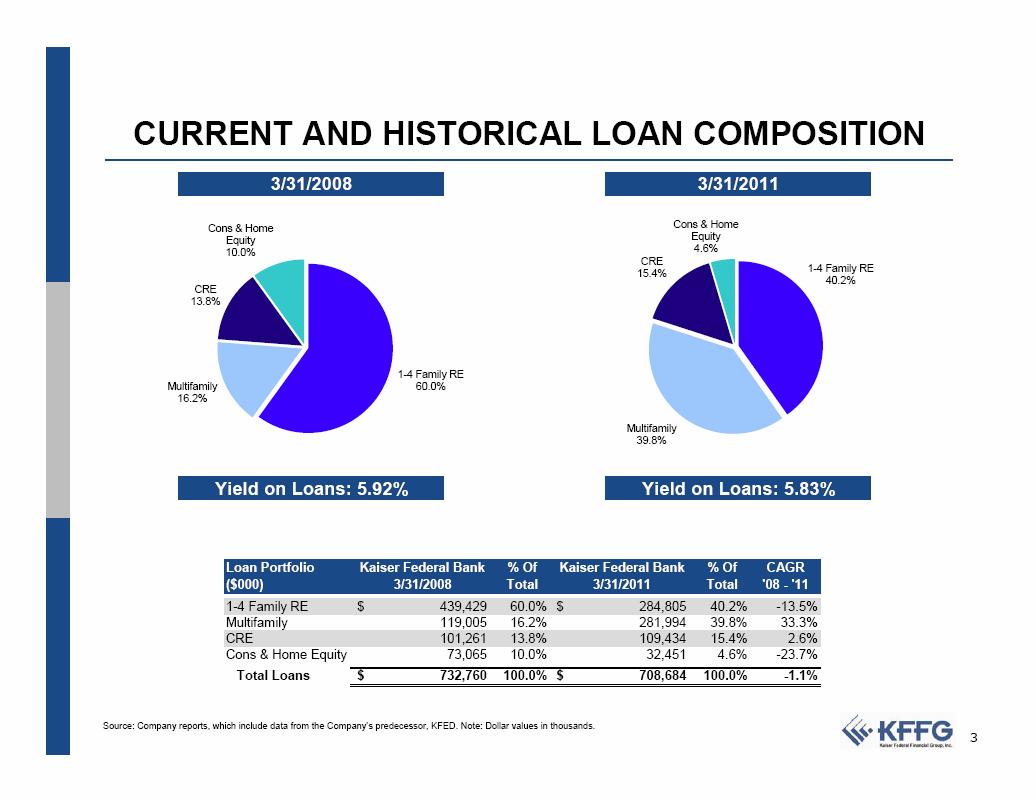 |
CURRENT AND HISTORICAL LOAN COMPOSITION 3/31/2008 3/31/2011 Cons & Home Cons & Home Equity Equity10.0% 4.6% CRE 15.4% 1-4 Family RE 40.2% CRE 13.8% 1-4 Family RE Multifamily 60.0% 16.2% Multifamily 39.8% Yield on Loans: 5.92% Yield on Loans: 5.83% Loan Portfolio Kaiser Federal Bank % Of Kaiser Federal Bank % Of CAGR ($000) 3/31/2008 Total 3/31/2011 Total '08 - '11 1-4 Family RE Multifamily CRE Cons & Home Equity $ 439,429 119,005 101,261 73,065 60.0% 16.2% 13.8% 10.0% $ 284,805 281,994 109,434 32,451 40.2% 39.8% 15.4% 4.6% -13.5% 33.3% 2.6% -23.7% Total Loans $ 732,760 100.0% $ 708,684 100.0% -1.1% Source: Company reports, which include data from the Company’s predecessor, KFED. Note: Dollar values in thousands.
|
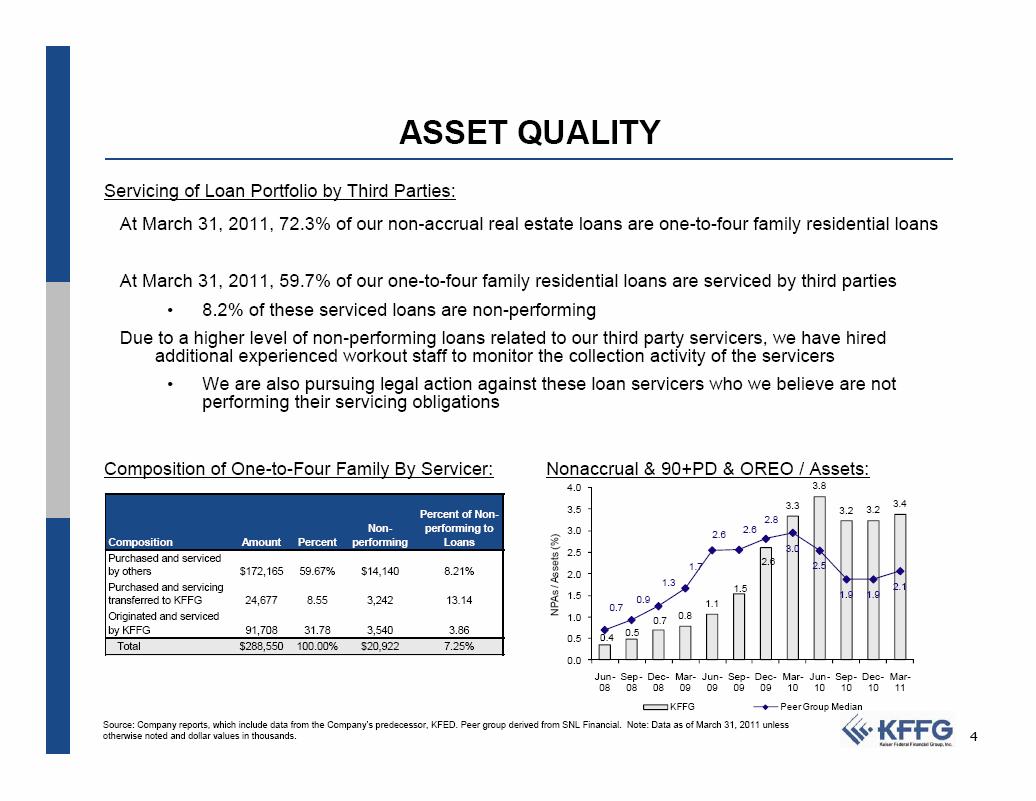 |
ASSET QUALITY Servicing of Loan Portfolio by Third Parties: At March 31, 2011, 72.3% of our non-accrual real estate loans are one-to-four family residential loans At March 31, 2011, 59.7% of our one-to-four family residential loans are serviced by third parties • 8.2% of these serviced loans are non-performing Due to a higher level of non-performing loans related to our third party servicers, we have hired additional experienced workout staff to monitor the collection activity of the servicers• We are also pursuing legal action against these loan servicers who we believe are not performing their servicing obligations Composition of One-to-Four Family By Servicer: Nonaccrual & 90+PD & OREO / Assets: 4.0 3.5 3.0 2.5 2.0 1.5 1.0 0.5 0.0 Jun-Sep-Dec-Mar-Jun-Sep-Dec-Mar-Jun-Sep-Dec-Mar 0.4 0.5 0.7 0.8 1.1 1.5 2.6 1.7 2.1 3.3 3.2 3.2 3.4 3.8 0.7 0.9 1.9 1.9 1.3 2.6 2.6 2.8 3.0 2.5 08 08 08 09 09 09 09 10 10 10 10 11 KFFG Peer Group Median Source: Company reports, which include data from the Company’s predecessor, KFED. Peer group derived from SNL Financial. Note: Data as of March 31, 2011 unless otherwise noted and dollar values in thousands. Percent of Non-Non-performing to Composition Amount Percent performing Loans Purchased and serviced by others $172,165 59.67% $14,140 8.21% Purchased and servicing transferred to KFFG 24,677 8.55 3,242 13.14 Originated and serviced by KFFG 91,708 31.78 3,540 3.86 Total $288,550 100.00% $20,922 7.25% NPAs / Assets (%)
|
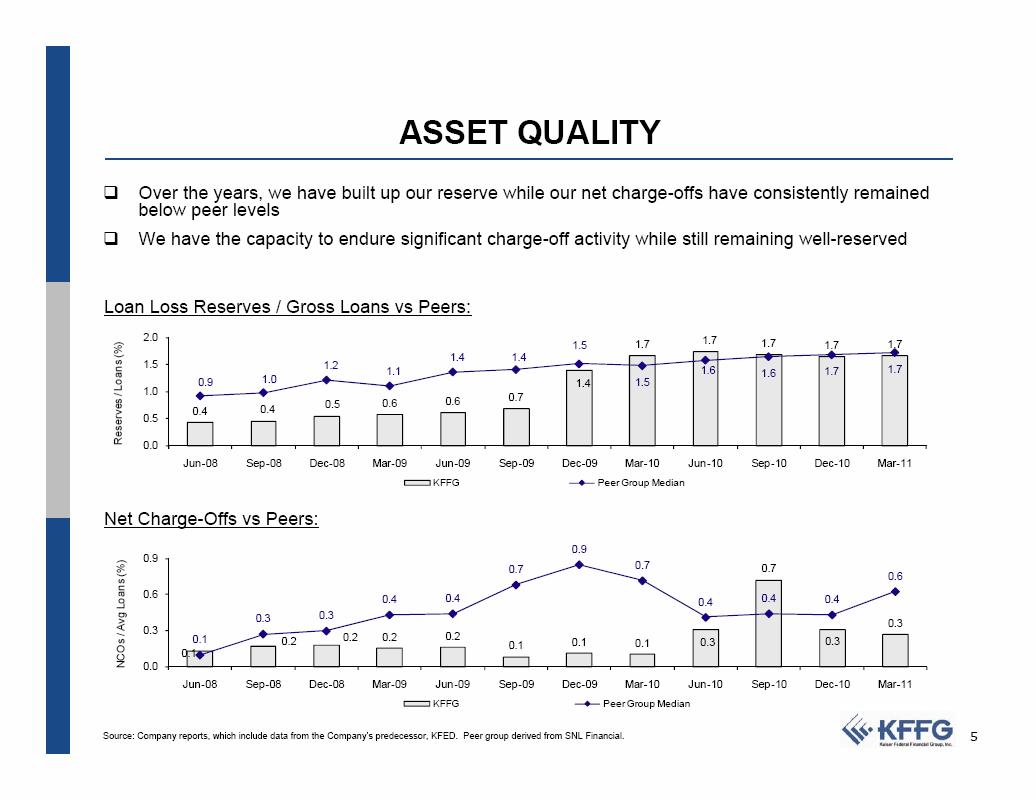 |
ASSET QUALITY . Over the years, we have built up our reserve while our net charge-offs have consistently remained below peer levels . We have the capacity to endure significant charge-off activity while still remaining well-reserved Loan Loss Reserves / Gross Loans vs Peers: Reserves / Loans (%) 1.5 1.2 1.1 0.9 1.0 1.0 0.5 0.6 0.6 0.7 0.4 0.4 0.5 0.0 1.4 KFFG Peer Group Median 2.0 1.5 1.7 1.7 1.7 1.7 1.7 1.4 1.4 1.5 1.6 1.6 1.7 1.7 Jun-08 Sep-08 Dec-08 Mar-09 Jun-09 Sep-09 Dec-09 Mar-10 Jun-10 Sep-10 Dec-10 Mar-11 Net Charge-Offs vs Peers: 0.9 NCOs / Avg Loans (%) 0.9 0.6 0.3 0.0 0.1 0.2 0.2 0.2 0.2 0.1 0.1 0.1 0.3 0.7 0.3 0.3 0.1 0.3 0.3 0.4 0.4 0.7 0.7 0.4 0.4 0.4 0.6 Jun-08 Sep-08 Dec-08 Mar-09 Jun-09 Sep-09 Dec-09 Mar-10 Jun-10 Sep-10 Dec-10 Mar-11 KFFG Peer Group Median Source: Company reports, which include data from the Company’s predecessor, KFED. Peer group derived from SNL Financial.
|
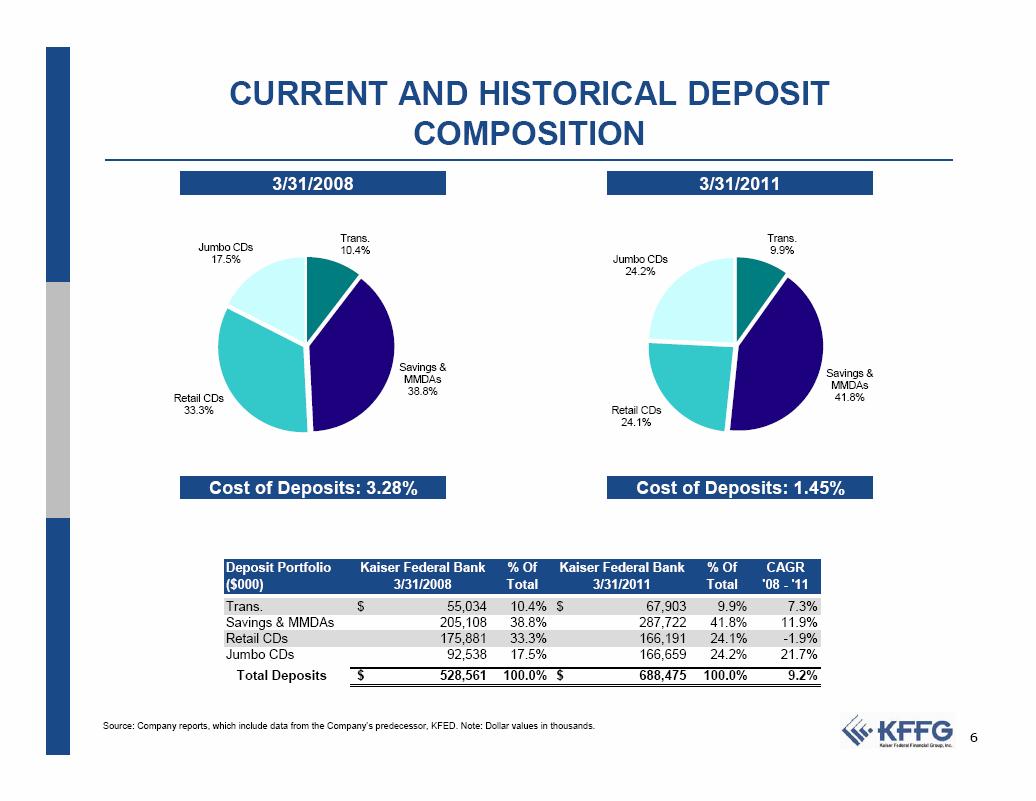 |
CURRENT AND HISTORICAL DEPOSIT COMPOSITION 3/31/2008 3/31/2011 Trans. Trans.Jumbo CDs 10.4% 9.9%17.5% Jumbo CDs 24.2% Savings & Savings & MMDAs MMDAs 38.8% 41.8% 33.3% Retail CDs Retail CDs 24.1% Cost of Deposits: 3.28% Cost of Deposits: 1.45% Deposit Portfolio Kaiser Federal Bank % Of Kaiser Federal Bank % Of CAGR ($000) 3/31/2008 Total 3/31/2011 Total '08 - '11 Trans. Savings & MMDAs Retail CDs Jumbo CDs $ 55,034 205,108 175,881 92,538 10.4% 38.8% 33.3% 17.5% $ 67,903 287,722 166,191 166,659 9.9% 41.8% 24.1% 24.2% 7.3% 11.9% -1.9% 21.7% Total Deposits $ 528,561 100.0% $ 688,475 100.0% 9.2% Source: Company reports, which include data from the Company’s predecessor, KFED. Note: Dollar values in thousands.
|
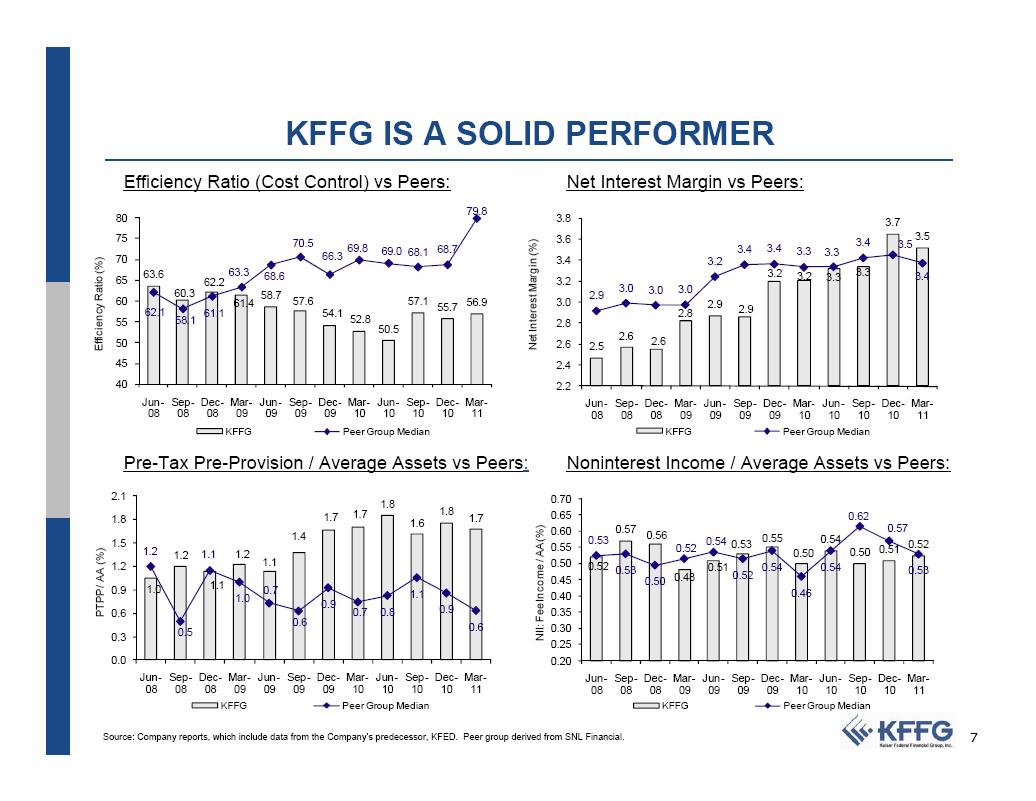 |
KFFG IS A SOLID PERFORMER Efficiency Ratio (%) PTPP / AA (%) Efficiency Ratio (Cost Control) vs Peers: Net Interest Margin vs Peers: 79.8 80 63.6 63.3 68.6 60.3 62.2 61.4 58.7 57.6 57.1 55.7 56.9 62.1 58.1 61.1 70.5 69.8 69.0 68.1 68.766.33.8 3.7 3.5 54.1 52.8 50.5 40 45 Jun-08 Sep-08 Dec-08 Mar-09 Jun-09 Sep-09 Dec-09 Mar-10 Jun-10 Sep-10 Dec-10 Mar-11 KFFG Peer Group Median Pre-Tax Pre-Provision / Average Assets vs Peers: Noninterest Income / Average Assets vs Peers: 1.7 1.7 1.8 1.6 1.8 1.71.8 2.1 0.620.65 0.70 2.8 2.9 2.9 3.2 3.2 3.3 3.3 2.9 3.0 3.0 3.0 3.2 3.4 3.4 3.3 3.3 3.5 3.4 2.2 2.4 Jun-08 Sep-08 Dec-08 Mar-09 Jun-09 Sep-09 Dec-09 Mar-10 Jun-10 Sep-10 Dec-10 Mar-11 Net Interest Margin (%) KFFG Peer Group Median 75 3.6 3.4 70 3.4 65 3.2 60 3.0 55 2.8 2.6 2.6 2.6 50 2.5 1.0 1.2 1.1 1.2 1.1 1.2 0.5 1.1 1.0 0.7 0.6 0.9 0.7 0.8 1.1 0.9 0.6 0.52 0.57 0.56 0.48 0.51 0.53 0.55 0.50 0.54 0.50 0.51 0.52 0.53 0.53 0.50 0.52 0.54 0.52 0.54 0.46 0.54 0.57 0.53 NII: Fee Income / AA (%) 0.60 0.55 0.50 0.45 0.40 0.35 0.30 1.4 1.5 1.2 0.9 0.6 0.3 0.25 0.20 Jun-Sep-Dec-Mar-Jun-Sep-Dec-Mar-Jun-Sep-Dec-Mar-Jun-Sep-Dec-Mar-Jun-Sep-Dec-Mar-Jun-Sep-Dec-Mar 08 0808090909091010101011 080808090909091010101011 KFFG Peer Group Median KFFG Peer Group Median Source: Company reports, which include data from the Company’s predecessor, KFED. Peer group derived from SNL Financial.
|
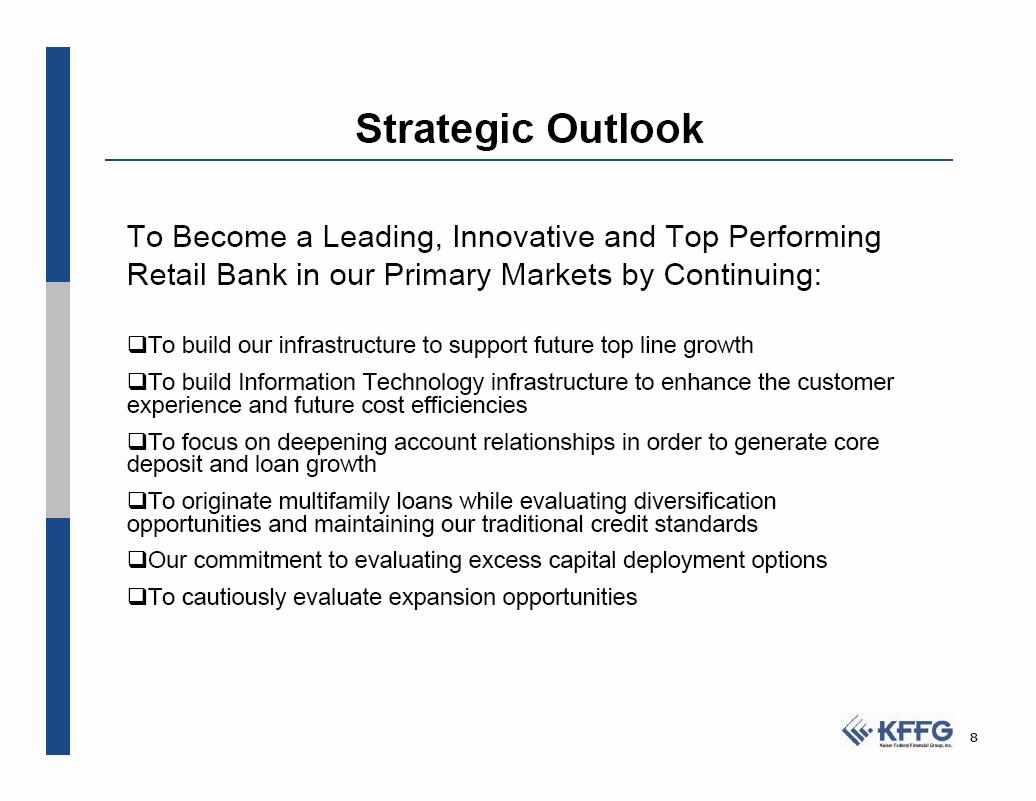 |
Strategic Outlook
To Become a Leading, Innovative and Top Performing
Retail Bank in our Primary Markets by Continuing:
..To build our infrastructure to support future top line growth
..To build Information Technology infrastructure to enhance the customer experience and future cost efficiencies
..To focus on deepening account relationships in order to generate core deposit and loan growth
..To originate multifamily loans while evaluating diversification opportunities and maintaining our traditional credit standards
..Our commitment to evaluating excess capital deployment options
..To cautiously evaluate expansion opportunities
|
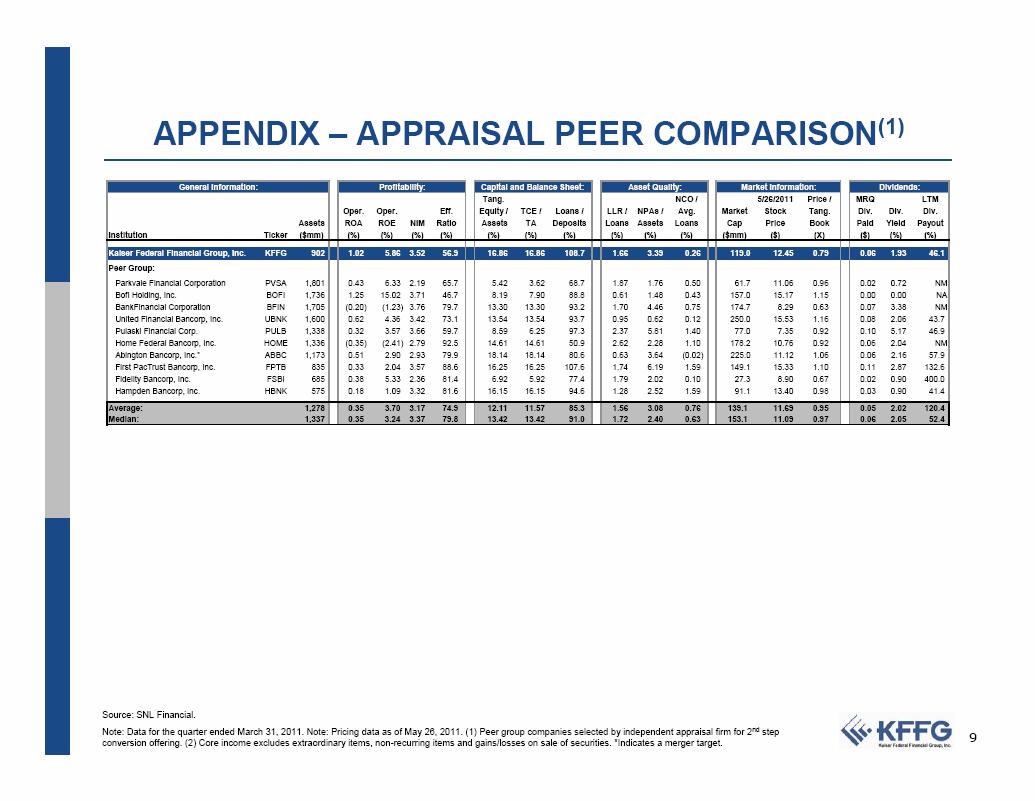 |
APPENDIX – APPRAISAL PEER COMPARISON(1) General Information: Profitability: Capital and Balance Sheet: Asset Quality: Market Information: Dividends: Tang. NCO / 5/26/2011 Price / MRQ LTM Oper. Oper. Eff. Equity / TCE / Loans / LLR / NPAs / Avg. Market Stock Tang. Div. Div. Div. Institution Ticker Assets ($mm) ROA (%) ROE NIM (%) (%) Ratio(%) Assets TA Deposits (%) (%) (%) Loans Assets Loans (%) (%) (%) Cap Price Book ($mm) ($) (X) Paid ($) Yield Payout (%) (%) Kaiser Federal Financial Group, Inc. KFFG 902 1.02 5.86 3.52 56.9 16.86 16.86 108.7 1.66 3.39 0.26 119.0 12.45 0.79 0.06 1.93 46.1 Peer Group: Parkvale Financial Corporation PVSA 1,801 0.43 6.33 2.19 65.7 5.42 3.62 68.7 1.87 1.76 0.50 61.7 11.06 0.96 0.02 0.72 NM BofI Holding, Inc. BOFI 1,736 1.25 15.02 3.71 46.7 8.19 7.90 88.8 0.61 1.48 0.43 157.0 15.17 1.15 0.00 0.00 NA BankFinancial Corporation BFIN 1,705 (0.20) (1.23) 3.76 79.7 13.30 13.30 93.2 1.70 4.46 0.75 174.7 8.29 0.63 0.07 3.38 NM United Financial Bancorp, Inc. UBNK 1,600 0.62 4.36 3.42 73.1 13.54 13.54 93.7 0.95 0.62 0.12 250.0 15.53 1.16 0.08 2.06 43.7 Pulaski Financial Corp. PULB 1,338 0.32 3.57 3.66 59.7 8.59 6.25 97.3 2.37 5.81 1.40 77.0 7.35 0.92 0.10 5.17 46.9 Home Federal Bancorp, Inc. HOME 1,336 (0.35) (2.41) 2.79 92.5 14.61 14.61 50.9 2.62 2.28 1.10 178.2 10.76 0.92 0.06 2.04 NM Abington Bancorp, Inc.* ABBC 1,173 0.51 2.90 2.93 79.9 18.14 18.14 80.6 0.63 3.64 (0.02) 225.0 11.12 1.06 0.06 2.16 57.9 First PacTrust Bancorp, Inc. FPTB 835 0.33 2.04 3.57 88.6 16.25 16.25 107.6 1.74 6.19 1.59 149.1 15.33 1.10 0.11 2.87 132.6 Fidelity Bancorp, Inc. FSBI 685 0.38 5.33 2.36 81.4 6.92 5.92 77.4 1.79 2.02 0.10 27.3 8.90 0.67 0.02 0.90 400.0 Hampden Bancorp, Inc. HBNK 575 0.18 1.09 3.32 81.6 16.15 16.15 94.6 1.28 2.52 1.59 91.1 13.40 0.98 0.03 0.90 41.4 Average: 1,278 0.35 3.70 3.17 74.9 12.11 11.57 85.3 1.56 3.08 0.76 139.1 11.69 0.95 0.05 2.02 120.4 Median: 1,337 0.35 3.24 3.37 79.8 13.42 13.42 91.0 1.72 2.40 0.63 153.1 11.09 0.97 0.06 2.05 52.4 Source: SNL Financial. Note: Data for the quarter ended March 31, 2011. Note: Pricing data as of May 26, 2011. (1) Peer group companies selected by independent appraisal firm for 2nd step conversion offering. (2) Core income excludes extraordinary items, non-recurring items and gains/losses on sale of securities. *Indicates a merger target.
|