Attached files
| file | filename |
|---|---|
| 8-K - FORM 8-K - HOPFED BANCORP INC | d8k.htm |
 INVESTKentucky
Churchill Downs, Louisville, KY
John E. Peck,
President & Chief Executive Officer
Billy C. Duvall,
Senior Vice President & Chief Financial Officer
June 9, 2011
1
Exhibit 99.1 |
 Certain statements contained herein are forward-looking statements,
within the meaning of Section 27A of the Securities Act of 1933
and Section 21E of the Securities Exchange Act of 1934 and are subject to the safe
harbor provisions of the Private Securities Litigation Reform Act of
1995, that involve risks and uncertainties. Actual results may
differ materially from the results in these forward-looking statements.
Factors that might cause such a difference include, among other
matters, changes in interest rates, economic conditions,
governmental regulation and legislation, credit quality and competition affecting the Company’s
business; the risk of natural disasters and future catastrophic events
including terrorist related incidents; and other factors
discussed in the Company’s Annual Report on Form 10-K for the year ended December 31,
2010 and in subsequent reports filed on Form 10-Q and Form 8-K.
We can give no assurance that any of the events anticipated by
the forward-looking statements will occur or, if any of them
does, what impact they will have on our results of operations and financial condition. We
disclaim any intent or obligation to publicly update or revise any
forward-looking statements, regardless of whether new
information becomes available, future developments occur or otherwise, except as required by
law.
2
Cautionary and Forward Looking Statements |
 3
Headquarters:
Hopkinsville, Kentucky
18 branches: 11 in Kentucky; 7
in Tennessee
Total Assets:
$1.07 billion
Common
Stockholders’
Equity:
$108.3 million
Total Loans:
$594.7 million
Total Deposits:
$833.9 million
Source: SNL Financial LC and Company reports
Financials as of March 31, 2011
Company Profile |
 4
Experienced Management
Our management team has over 125 years of combined industry
experience and strong ties to the Western Kentucky and Middle
Tennessee markets
Years with
Industry
Name
Position
HFBC
Experience
Previous experience
John Peck
President & CEO
11
30
President and CEO of United Commonwealth Bank
President of Firstar Bank-Calloway County
Mike Woolfolk
Chief Operating Officer
11
39
President of Firstar Bank-Marshall County
Senior Vice President of Operations of Citizens Bank
Billy Duvall
Chief Financial Officer
10
21
Auditor with Rayburn, Betts & Bates, P.C.
Examiner with National Credit Union Administration
Michael Stalls
SVP & Chief Credit Officer
8
37
Senior Lending Officer at Regions Bank (Southern TN)
|
 5
Business Strategy
Focus on relationship banking
We operate our franchise in a manner that provides local decision
making in our retail offices We have a local market president
and a local market advisory board within our larger markets Focus
on our existing market footprint Our markets are ideal for a
community bank as they provide both stability and growth Ft.
Campbell military base, located within our markets, is a major source of stability
Considerable population growth is projected for both the Clarksville
and Nashville MSAs Take advantage of our unique position as a
middle market player Our primary competitors are either large
regional banks or smaller community banks We are small enough
to present ourselves to our customers as a locally-based community bank, yet
large enough to attract businesses that require a larger capital
base to service their needs
Continue to reposition our balance sheet
In the last ten years we have transformed our Bank from a traditional
mutual savings bank into a highly diversified financial
institution We believe that the continued diversification of our
loan portfolio and improved
deposit mix will result in improved operating results
We distinguish our self from our competition by offering comprehensive
banking services to businesses and individuals in our markets with
personalized service |
 Summary
Rationale
Pricing date: June 16, 2010
Gross proceeds: $32.4 million (including
overallotment)
Price per share: $9.00
Shares issued: 3,583,334
Shares issued / total shares: 49.9%
Price/ pro forma tang. book value: 69.0%
2% Stock Dividend September 30, 2010
Further strengthens our balance sheet and
regulatory capital ratios
Supports ongoing and future growth
Eventual redemption of our TARP preferred
capital
Current Pricing Multiples
Stock Price (as of 6/05/11):
$9.37
TBV ($12.17):
68.6%
Source: SNL Financial LC and Company reports
6
2010 Common Stock Offering |
 Balance Sheet Strength
Consolidated Capital Ratios
Asset Quality as of March 31, 2011
Tier 1 Capital Ratio
(1)
:
10.94%
RBC Ratio
(1)
:
19.27%
TCE / TA:
8.47%
Non-accrual loans / Loans:
1.02%
Performing TDRs / Loans:
1.38% NPAs / Total assets:
Including TDRs:
2.17%
Excluding TDRs:
1.41%
LLR / Non-accrual loans:
229%
LLR / Total loans:
2.35%
(1) Includes $18..4 million in TARP preferred equity
7 |
 Market Areas –
Clarksville/Hopkinsville
8 Offices in 4 counties
Clarksville, TN is ninth fastest
growing city in United States
Entire market area home to Ft.
Campbell Army Base with 22,000
active personnel –
largest employer
in TN and KY
“Green Energy Corridor”
–
future
home of Hemlock Semiconductor
Diverse agricultural production –
corn, wheat, soybeans, cattle and
tobacco
Strong retail and service industries
Home to Austin Peay State
University with 10,000+ students
Recognized for growth potential,
talented labor pool and affordable
living
Clarksville/Hopkinsville MSA Market Share
(1)
(1) Source: FDIC Summary of Deposit data as of June 30, 2010
Institution Name
Number
Deposits
Market
Market
Of
In
Share
Rank
State
Offices
Market
Percent
1
PLANTERS BANK INC
KY
8
422,909
13.13%
2
F&M BANK
TN
9
410,122
12.74%
3
HERITAGE BANK
KY
7
364,325
11.32%
4
REGIONS BANK
AL
7
343,073
10.66%
5
BRANCH BANKING&TRUST CO
NC
6
257,748
8.01%
6
LEGENDS BANK
TN
6
249,970
7.76%
7
U S BANK NATIONAL ASSN
MN
12
245,376
7.62%
8
FIRST FEDERAL SAVINGS BANK
TN
5
218,468
6.79%
9
BANK OF AMERICA NA
NC
6
203,812
6.33%
10
GREENBANK
TN
5
122,550
3.81%
11
CUMBERLAND BANK&TRUST
TN
5
120,076
3.73%
12
UNITED SOUTHERN BANK
KY
4
117,757
3.66%
13
BANK OF CADIZ&TRUST CO
KY
4
72,992
2.27%
14
INTEGRA BANK NATIONAL ASSN
IN
2
69,995
2.17%
15
FORT SILL NATIONAL BANK
OK
1
645
0.02%
TOTALS
87
3,219,818
100.00%
8 |
 Market Areas –
Western Kentucky
6 Offices in 3 counties
Significant agricultural base
with prominent wheat, corn
and soybean production
Light manufacturing
Tourism focused on
Kentucky Lake and Land
Between the Lakes
Home to Murray State with
10,000+ students
Market Share
Fulton, Marshall and Calloway Counties
(1)
(1) Source: FDIC Summary of Deposit data as of June 30,
2010 Market
Number of
In Market
Market
Ranking
Institution Name
State
Offices
Deposits
Share
1
CFSB
KY
6
361,920
23.47%
2
HERITAGE BANK
KY
6
359,921
23.34%
3
BB&T
NC
4
207,650
13.46%
4
REGIONS BANK
KY
5
189,480
12.29%
5
MURRAY BANK
KY
2
177,834
11.53%
6
U.S. BANK N/A
OH
3
108,332
7.02%
7
CITIZENS BANK
KY
2
77,530
5.03%
8
REELFOOT BANK
KY
1
32,938
2.14%
9
FIRST KENTUCKY BANK
KY
2
16,772
1.09%
10
FNB BANK
KY
1
7,757
0.50%
11
BANK OF CADIZ
KY
1
1,475
0.10%
12
WOODFOREST BANK
TX
1
545
0.04%
GRAND TOTAL
34
1,542,154
100.00%
9 |
 10
Market Areas –
Middle Tennessee
3 Offices in Cheatham County
and 1 in Houston County
Cheatham County is in
Nashville MSA and currently
serves as a Nashville bedroom
community
Light manufacturing
Management values good
deposit mix, long term growth
prospects and proximity to
Nashville
Nashville MSA Market Share
(1)
(1) Source: FDIC Summary of Deposit data as of June 30, 2010
Number
Deposits
Market
Offices
in
Market
Rank
Institution Name
State
In Market
Market
Share
1
REGIONS BANK
AL
66
6,610,975
17.79%
2
BANK OF AMERICA NA
NC
38
5,940,444
15.98%
3
SUNTRUST BANK
GA
56
4,332,099
11.66%
4
PINNACLE NATIONAL BANK
TN
30
3,557,595
9.57%
5
FIRST TENNESSEE BANK NA
TN
48
1,975,700
5.32%
6
FIFTH THIRD BANK
OH
30
1,466,635
3.95%
7
WILSON BANK&TRUST
TN
20
1,248,176
3.36%
8
TENNESSEE COMMERCE BANK
TN
1
1,244,551
3.35%
9
U S BANK NATIONAL ASSN
OH
52
1,066,240
2.87%
10
WELLS FARGO BANK NA
SD
12
833,982
2.24%
48
HERITAGE BANK
KY
3
61,537
0.17%
60
Grand Total
564
37,169,372
100.00% |
 Over the last 10 years, we have transformed our franchise from traditional
mutual to a vibrant community bank
Dec. 2000
Dec. 2008
Mar.2011
(Dollars in Thousands)
Non-interest bearing
3,828
2.3%
57,134
8.0%
$72,503
8.7%
Interest bearing
checking
9,527
5.7%
89,549
12.6%
135,785
16.3%
Total checking
13,355
8.0%
146,683
20.6%
208,288
25.0%
MMDA & Savings
34,371
20.8%
58,374
8.2%
67,012
8.0%
Time Deposits
Retail < 100K
103,446
62.5%
289,063
40.5%
349,269
41.9%
Retail > 100K
14,432
8.7%
218,885
30.7%
121,962
14.6%
Brokered
---
---
---
---
87,372
10.5%
Total time deposits
117,878
71.2%
507,948
71.2%
558,603
67.0%
Total deposits
165,604
100.0%
713,005
100.0%
$833,903
100.0%
Franchise Transformation -
Funding
11 |
 Deposit Portfolio
Total Deposit Growth ($M)
Marketing campaign focused
on increasing our market share
of checking accounts that
began in 2008 has netted 4,000
new noninterest bearing
checking accounts in each of
the last three years
Our base of core deposits has
been a driver of our net interest
margin and profitability
throughout our recent history
Company is reducing
outstanding balances of
brokered deposits and FHLB
borrowings.
Source: SNL Financial LC and company reports
12 |
 Deposits at March 31, 2011
Cost of Deposits
1
st
Qtr. 2010 Overall Cost of Deposits: 2.27%
1
st
Qtr. 2011 Overall Cost of Deposits: 1.86%
13 |
 Dec.2000
Dec.2008
Mar.2011
(Dollars in Thousands)
Loans:
1-4 family
$93,147
71.1%
$223,598
35.3%
$227,137
38.2%
Multi-family
2,841
2.2%
36,857
5.8%
28,664
4.8%
Non-residential real estate
21,695
16.6%
162,980
25.7%
191,673
32.3%
Construction & Development
5,729
4.4%
122,500
19.3%
79,578
13.4%
Commercial
946
0.7%
64,595
10.2%
50,076
8.4%
Franchise Transformation -
Lending
14 |
 15
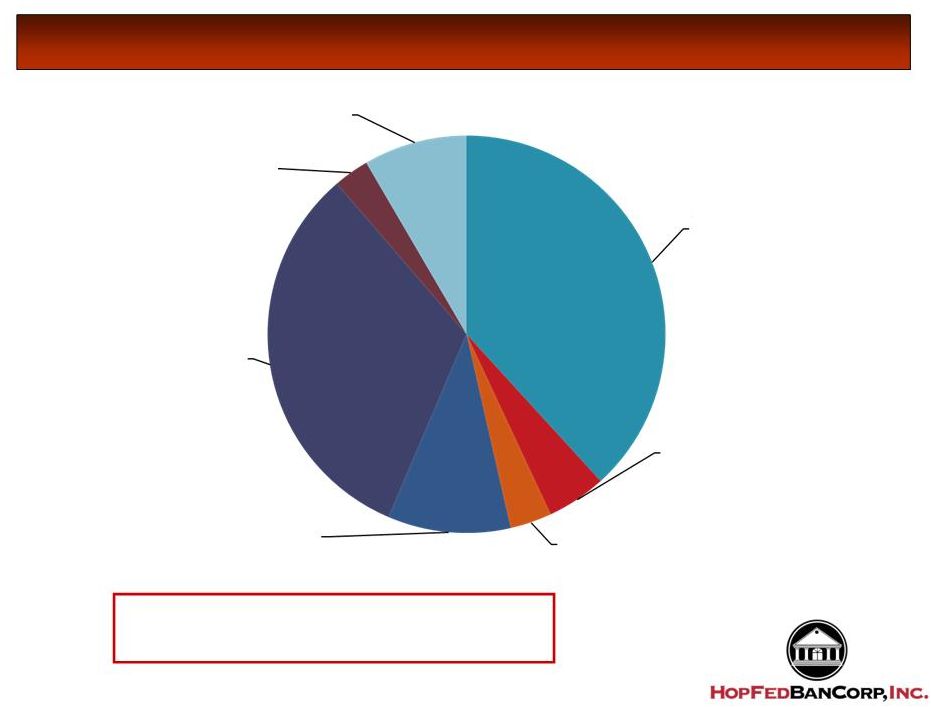
Loans at March 31, 2011
Total Loans:
$594.3 million
Weighted Average
Yield:
5.73%
1 -
4 family
38%
5%
Constr.
3%
Land
10%
CRE
32%
Consumer
3%
C&I
9%
Multi-family |
 Loan Concentrations / Risk Based Capital
(Dollars in Thousands)
Outstanding
% of Total
% of Risk
Balance
Loans
Based Capital
Consumer
$17,218
2.9%
13.8%
RE - 1 - 4 family
227,137
38.3%
182.0%
Multi-family
28,664
4.8%
23.0%
CRE (investor)
28,402
4.8%
22.8%
CRE (owner occupied)
163,271
27.5%
130.8%
Construction
20,164
3.4%
16.2%
Land & land development
59,414
10.0%
47.6%
C&I
50,076
8.4%
40.1%
Total
$594,346
100.0%
518.4%
Consolidated Risk Based Capital
$124,816
16 |
 Loans Past Due 30 -
89 Days
17 |
 Non-Performing Loans / Total Loans
18 |
 Non-Performing Assets/ Total Assets
19 |
 Allowance / Total Loans
20 |
 Net Interest Margin
21 |
 (1) Excludes goodwill impairment and foreclosed property expense.
(2) KY Banks & Thrifts include all banks and thrifts headquartered in
Kentucky that are listed on a major stock exchange. 0.69%
0.56%
0.53%
0.55%
0.74%
0.09%
0.00%
0.25%
0.50%
0.75%
1.00%
1.25%
1.50%
2005
2006
2007
2008
2009
YTD
61.95%
70.66%
73.30%
69.84%
66.88%
62.58%
40.00%
50.00%
60.00%
70.00%
80.00%
2005
2006
2007
2008
2009
YTD
2.61%
2.71%
2.89%
3.06%
2.97%
3.28%
0.00%
1.00%
2.00%
3.00%
4.00%
5.00%
2005
2006
2007
2008
2009
YTD
9.24%
8.33%
7.65%
7.84%
8.08%
1.18%
0.00%
2.50%
5.00%
7.50%
10.00%
12.50%
15.00%
2005
2006
2007
2008
2009
YTD
Return on Average Equity
Net Interest Margin
Efficiency Ratio
(1)
Return on Average Assets
HopFed Bancorp, Inc.
KY Banks & Thrifts
(2)
Source: SNL Financial LC and company reports
22
Historical Performance |
 Why Invest in HopFed Bancorp, Inc.
History of strong financial performance
We have remained profitable during the recent economic downturn and
believe that we are positioned to take advantage of future
growth opportunities Strong Asset Quality
Our asset quality metrics have remained superior to our peers
Experienced Management Team
We
have
an
experienced
and
energetic
management
team
with
strong
relationships
in
our market areas
Disciplined approach to internal and external growth
We
are
confident
in
our
ability
to
successfully
integrate
future
branch
or
whole
bank
acquisitions as well as grow through de novo branches
Attractive Entry Point
Opportunity to invest in a high quality franchise with a proven track
record and at a significant discount to tangible book value and
peer trading multiples We believe there will be exceptional
opportunities for responsible strategic growth in our market
areas 23 |
 Appendix: Company History
1879:
The Bank was founded under the name Hopkinsville Building and Loan
Association 1940:
The Bank converted to a savings association and began insuring
deposits 1983:
The Bank became a federal mutual savings bank
1997:
HopFed Bancorp, Inc. was incorporated under the laws of Delaware
1998:
The Bank converted from a federal mutual savings bank to a federal
stock savings bank and the Company became listed on the
NASDAQ 2000:
John E. Peck named President and Chief Executive Officer
2002:
Bank
changed
name
from
Hopkinsville
Federal
Savings
Bank
to
Heritage
Bank
2002:
Acquired two branch offices in Fulton, Kentucky from Old National
Bancorp 2006:
Acquired four branch offices in Middle Tennessee from AmSouth
Bancorp 2006:
Opened first of three branch offices in Clarksville, Tennessee
2008:
Issued $18.4 million of Series A Preferred Stock under
CPP to the Treasury
June 2010:
Completed sale of 3,583,334 shares of common stock
We
are
a
Kentucky-based
unitary
savings
and
loan
holding
company.
Our
wholly-owned savings bank subsidiary is Heritage Bank.
24 |
 John E. Peck
Billy C. Duvall
President & Chief Executive Officer
SVP & Chief Financial Officer
(270) 887-8401
(270) 887-8404
john.peck@bankwithheritage.com
billy.duvall@bankwithheritage.com
25 |