Attached files
| file | filename |
|---|---|
| 8-K - FORM 8-K - ENCORE CAPITAL GROUP INC | d8k.htm |
 2011 Investor Day
June 9, 2011
Exhibit 99.1 |
 CAUTIONARY NOTE ABOUT FORWARD-LOOKING STATEMENTS
2
FORWARD-LOOKING STATEMENTS
The statements in this presentation that are not historical facts, including, most
importantly, those statements preceded by, or that include, the words “may,”
“believe,” “projects,” “expects,” “anticipates” or the
negation thereof, or similar expressions, constitute “forward-looking statements”
within the meaning of the Private Securities Litigation Reform Act of 1995 (the “Reform
Act”). These statements may include, but are not limited to, statements
regarding our future operating results and growth. For all “forward-looking
statements,” the Company claims the protection of the safe harbor for forward-looking
statements contained in the Reform Act. Such forward-looking statements involve
risks, uncertainties and other factors which may cause actual results, performance or
achievements of the Company and its subsidiaries to be materially different from any future
results, performance or achievements expressed or implied by such forward-looking
statements. These risks, uncertainties and other factors are discussed in the reports filed by
the Company with the Securities and Exchange Commission, including the most recent reports on
Forms 10-K, 10-Q and 8-K, each as it may be amended from time to time. The
Company disclaims any intent or obligation to update these forward-looking
statements.
|
 INVESTMENT HIGHLIGHTS
3
•
Investments made over the past few years have driven
significant improvements in collections, cash flow and earnings
•
Difficult regulatory environment being managed proactively
•
Expanding presence in India, combined with new strategic
initiatives, are expected to continue increasing cash flow from
operations
•
Demonstrated ability to raise and profitably deploy capital in
favorable and unfavorable business cycles |
 PRESENTING TODAY
4
Brandon Black
President and Chief Executive Officer
Paul Grinberg
EVP, Chief Financial Officer
Amy Anuk
VP, Business Development
Manu Rikhye
Managing Director, India Operations |
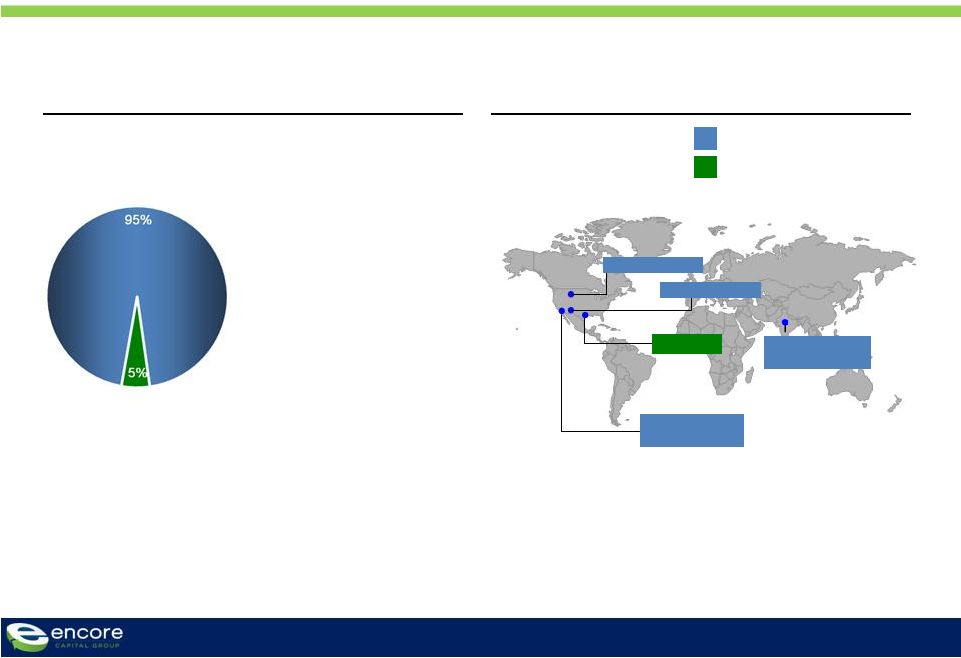 ENCORE
IS A LEADER IN THE CONSUMER DEBT BUYING AND RECOVERY INDUSTRY
5
Revenue Composition
As of March 31, 2011
Global Capabilities
Debt Purchasing & Collections
Bankruptcy Servicing
•
Purchase and collection
of
charged-off unsecured
consumer receivables
(primarily credit card)
•
Robust business model
emphasizing consumer
intelligence and
operational
specialization
•
Invested ~$1.9 billion to
acquire receivables with a face
value of ~$58 billion since
inception
•
Acquired ~34 million consumer
accounts since
inception
•
Process secured consumer bankruptcy accounts for leading
auto
lenders and other financial institutions
•
Proprietary software dedicated to bankruptcy servicing
•
Operational platform that integrates lenders, trustees,
and
consumers
St Cloud, MN
Arlington, TX
Phoenix, AZ
Delhi, India
Call Center /
Technology Site
Call Center Site
Ascension
Call Center Site
San Diego, CA
Headquarters/
Call Center Site
Debt Purchasing & Collections
Bankruptcy Servicing |
 THE
COMPANY’S FINANCIAL RESULTS OVER THE PAST TWO YEARS HAVE BEEN STRONG
6
2010
2009
YOY Growth
Annual Variance
$605
$117
24%
$488
Collections
$381
$65
21%
$316
Revenue
$347
$82
31%
$265
Adjusted EBITDA*
$362
$105
41%
$257
Purchases
$1.95
$0.58
42%
$1.37
EPS
($ millions, except EPS and ratios)
*
Adjusted EBITDA is a non-GAAP number. The Company considers Adjusted EBITDA to
be a meaningful indicator of operating performance and uses it as a measure
to assess the operating performance of the Company. See Reconciliation of Adjusted EBITDA to GAAP Net Income at the end
of this presentation.
Q1 11
$191
$110
$116
$91
$0.54
Q1 10
$141
$87
$83
$82
$0.44 |
 WE HAVE
GENERATED STRONG RESULTS DESPITE THE MACROECONOMIC DOWNTURN
7
($ millions)
*
Adjusted EBITDA is a non-GAAP number. The Company considers Adjusted EBITDA to
be a meaningful indicator of operating performance and uses it as a measure to
assess the operating performance of the Company. See Reconciliation of Adjusted
EBITDA to GAAP Net Income at the end of this presentation **
LTM data as of 03/31/2011
Adjusted EBITDA* and Gross Collections by Year |
 STRATEGIC DECISIONS MADE OVER THE PAST DECADE
DEMONSTRATE OUR ABILITY TO FORESEE AND ADAPT TO CHANGES
8
•
Established our operating
center in India
•
Created an activity-level cost
database
•
Built and implemented the
industry’s first known ability-to-
pay (capability) model
Overconfidence and
Irrational Pricing
2005
2007
2006
2008
•
Created first generation
consumer-level underwriting
models
An Emerging
Market
Demand
Supply
2001
2002
2003
2004
Attractive
Opportunities
2009
2010
2011
•
Expanded access to
capital |
 WE HAVE
ALSO POSITIONED OURSELVES TO ADDRESS REGULATORY CHALLENGES AS THEY EMERGE
Building a consumer intelligence platform, focused on
financially distressed consumers, that can inform policy
discussions and identify strategies to promote financial
recovery
Revamped our consumer relations process and introduced
a Consumer Bill of Rights
Met with leadership of the CFPB and the staff of key federal
and state legislators
Hired a government relations firm and lobbyists in key
states
9
Consumer
Alignment
Regulatory
Outreach
Advisors
Analytics |
 OUR
BUSINESS MODEL IS CRITICALLY IMPORTANT, AS IT PROVIDES THE CONSUMER WITH TIME
TO RECOVER 10
Timeframe
Process and
relationship
with consumers
Outcome
•
Charge-off threshold
extends a maximum of
6 months
Transactional
•
Attempt immediate
resolution during
delinquency cycle
(days 30 –
180)
•
Consumer is “charged-
off”
by issuer on day 181
•
Issuer offers to sell
unsecured, charged-off
debt or service through
3rd party agencies
ORIGINAL
CREDITOR
•
Four-to-six month
collection cycle
Pressured
•
Artificial deadlines
•
Multiple collection
companies
•
Counterproductive
incentive structure
•
Consumer is
confused and
frustrated
CONTINGENCY
COLLECTION
AGENCY
•
Consumer has 84 months
to recover financially
Partnership
•
Create partnership strategy
and set goals
•
Tailor work strategies to
individual circumstances,
giving them time for a
consumer to recover
•
Maximizes likelihood of
repayment, creates
consistency, and ensures
that consumers are treated
fairly |
 OUR
LONG-TERM MODEL HAS ALLOWED MORE THAN TWO MILLION CONSUMERS TO MOVE
TOWARD FINANCIAL RECOVERY 11
Consumers with Whom We Have Partnered to Retire Their Debt (Cumulative)
|
 WE
HAVE TAKEN A LEADERSHIP STANCE BY OUTLINING OUR CORE PRINCIPLES IN AN
INDUSTRY-FIRST CONSUMER BILL OF RIGHTS 12 |
 A
Closer Look at Our Consumers and Our Financial Results
|
 OUR
BUSINESS MODEL DEPENDS UPON A VERY SMALL PERCENTAGE OF PAYERS
14
Portfolio Face Amount
$15,000,000
Average Balance
$3,000
Number of Accounts
5,000
Purchase Factor
$0.05
Purchase Price
$750,000
Projected Return (2.5x)
$1,875,000
As a result, we only need 19% of all consumers to
pay us two-thirds of what they owe, over a seven
year period, to achieve significant returns
ILLUSTRATIVE |
 TRYING
TO UNDERSTAND AND PREDICT BEHAVIOR IS EVEN MORE DIFFICULT WHEN IT OCCURS
INFREQUENTLY 15
5% -
9%
(350 consumers)
Purchased portfolio
(5,000 consumers)
Payers in
year 1
2% -
3%
(125 consumers)
Payers in
year 3
Payers in
year 5
~1%
(50 consumers) |
 Metric
Recent trend
•
Payer rates
•
Upward
•
Average payment size
•
Stable
•
Payment style
•
More payment plans
•
Broken payer rates
•
Mild improvement
•
Settlement rates
•
Stable
16
OUR CONSUMERS HAVE SHOWN THAT THEY ARE RESILIENT DESPITE
THE MACROECONOMIC ENVIRONMENT |
 17
Overall Payer Rate For All Active Inventory
PAYER RATES HAVE ACTUALLY INCREASED OVER THE PAST FEW
YEARS
2008
2009
2010
2011 |
 AVERAGE PAYMENT SIZE REMAINS CONSISTENT, EVEN AS PAYMENT
PLANS CONTINUE TO BE THE NORM
18
Average Payment Size For All Paying Accounts
2009
2010
2011
2008
Single Settlement Payers as a Percentage of
Total Payers
2009
2010
2011
2008 |
 OUR
CONSUMERS ARE HONORING THEIR OBLIGATIONS AND SETTLING THEIR ACCOUNTS AT RATES
CONSISTENT WITH PAST PERIODS Overall
“Broken”
Payer
Rate,
Excluding
Settled Accounts Through Time
19
Legal Settlement Rate
2009
2010
2011
2008
2009
2010
2011
2008 |
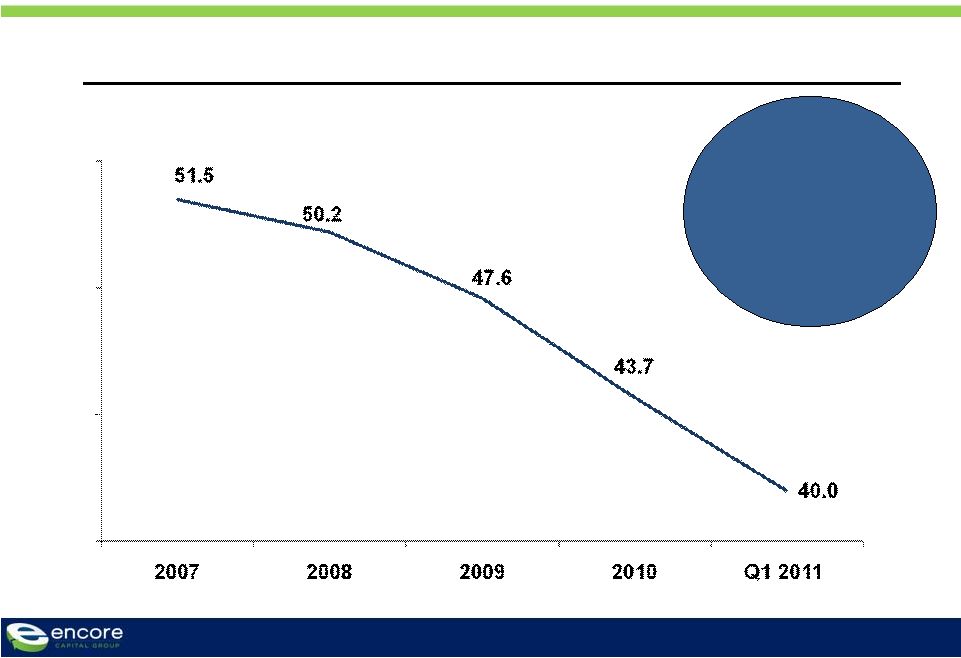 WE
HAVE
FUNDAMENTALLY
CHANGED
THE
COST
STRUCTURE
OF
THE COMPANY OVER THE PAST FOUR YEARS
20
Overall Cost-to-Collect
(%)
An 1150 basis point
reduction in cost-to-
collect translated into
$22 million in cost
savings in Q1 2011 |
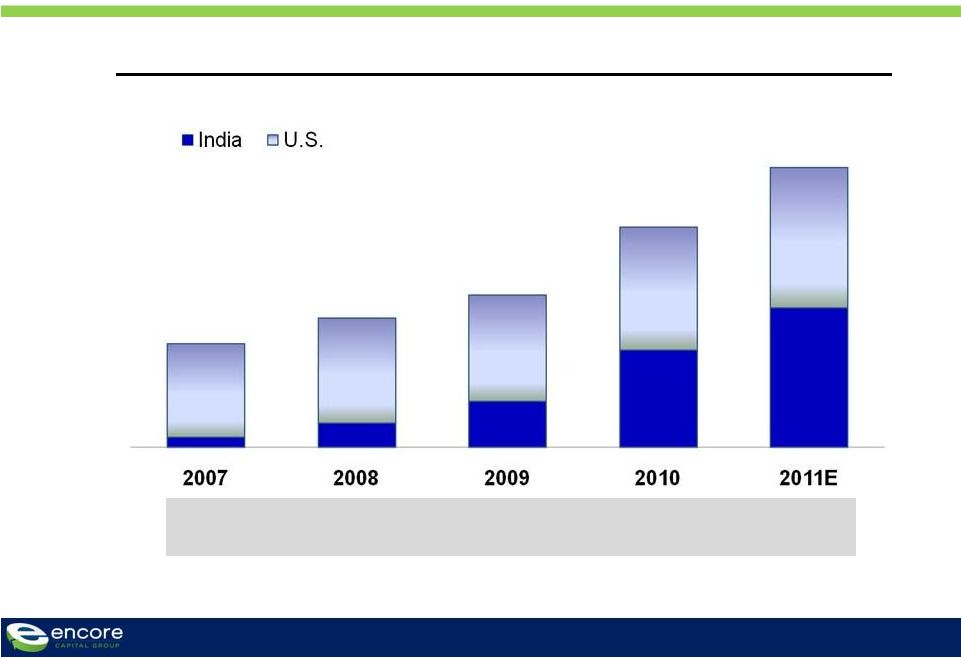 LED BY
OUR INDIA CENTER, WHICH IS EXPECTED TO PRODUCE HALF OF ALL 2011 CALL CENTER
COLLECTIONS 21
Collections from all Call Centers
($ millions)
$126
$157
$186
$268
Percent
of Total:
10%
19%
30%
44%
~$340
50% |
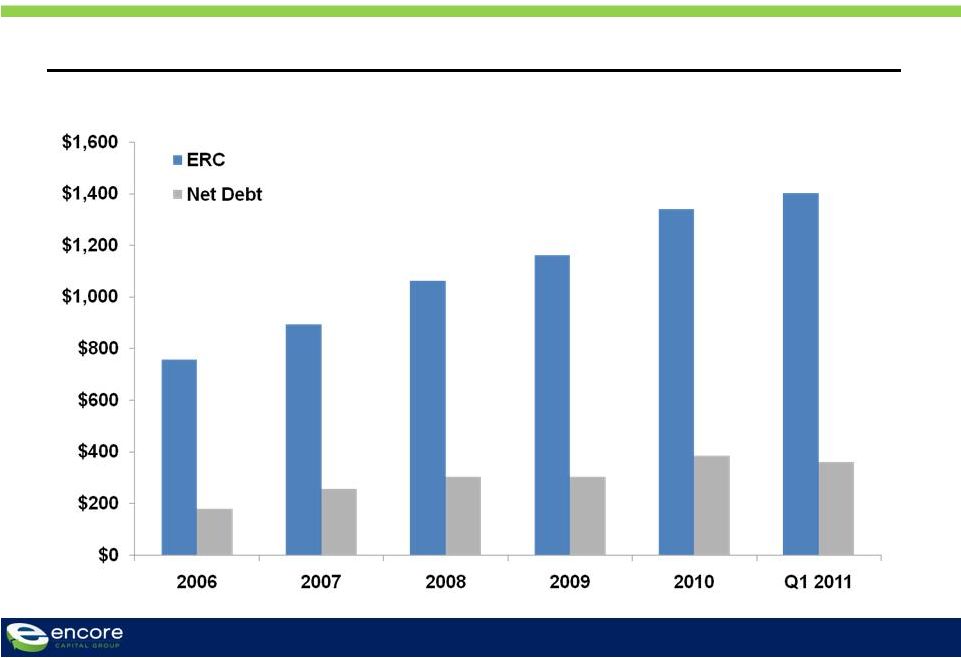 WE
CONTINUE TO BUILD A SUBSTANTIAL RESERVOIR FOR THE FUTURE
22
Annual Estimated Remaining Gross Collection (ERC) and Total Debt
($ millions, at end of period) |
 WE
BELIEVE THAT OUR CURRENT ESTIMATE OF REMAINING COLLECTIONS IS
CONSERVATIVE 23
Cumulative Collections (initial expectation vs. actual)
($ millions, March 01 –
March 11)
Actual cash
collections
Initial
projections |
 WE
ADJUST IRRS OVER TIME TO REFLECT OVER-PERFORMANCE 24
Purchase Period
Q1 2009
Q2 2009
Q3 2009
Q4 2009
IRR at purchase
4.2%
4.4%
4.4%
4.4%
Current IRR*
5.8%
6.0%
8.0%
7.3%
Average life-to-date IRR*
4.9%
5.2%
6.2%
6.3%
*As of 3/31/2011 |
 FROM A
CAPITAL PERSPECTIVE, WE HAVE SIGNIFICANT ROOM TO GROW THE BUSINESS
($ millions)
Cash flow leverage ratio
Debt
Trailing 4-quarter adjusted EBITDA*
Debt/Adj. EBITDA [Maximum 2.0x]
Minimum net worth
Total stockholders' equity
Minimum net worth
Excess room
Interest coverage ratio
Trailing 4-quarter EBIT
Trailing 4-quarter consolidated interest expense
EBIT/Interest expense [Minimum 2.0x]
303.1
264.6
1.15
243.1
183.0
60.1
69.9
16.2
4.3
2010
385.3
346.7
1.11
302.7
207.6
95.1
97.0
19.3
5.0
Q1 2011
382.4
380.4
1.01
318.8
214.4
104.4
103.1
20.4
5.1
2009
Based on our
cash flow and
LTM Adj.
EBITDA, our
leverage ratio
would allow us
to increase total
debt to $761
million, nearly
double the
present level
Covenant Analysis
25
Aggregate Revolving Loan Commitment
Drawn on Line of Credit
300.0
410.5
327.0
360.5
260.0
327.5
*
Adjusted EBITDA is a non-GAAP number. See Reconciliation of Adjusted EBITDA to
GAAP Net Income at the end of this presentation |
 We
Continue to Invest in the Future |
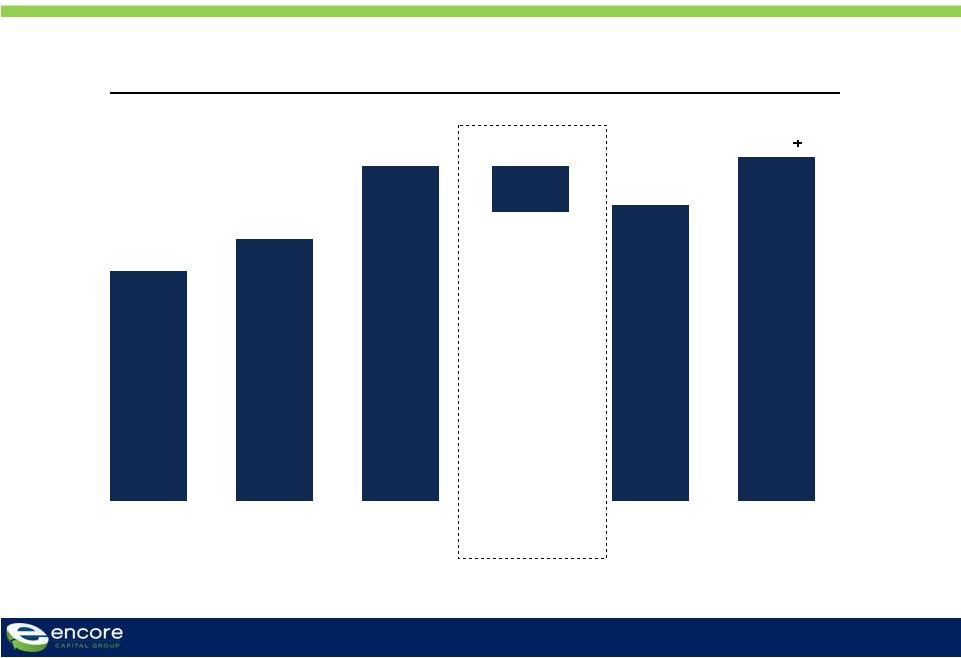 Full Year Purchases for 2008 –
2010, 2011 Estimate
WE ARE EXPECTING 2011 TO BE ANOTHER YEAR OF STRONG
PURCHASING GROWTH
27
$62
2011E
$380
($ millions)
2008
$230
2009
$257
2010
$362
2010 Adj.
$316
Large December
Purchase
($46) |
 OUR
ABILITY TO INCREASE PURCHASES IS A RESULT OF NOT BEING LIMITED TO A PARTICULAR
ASSET CLASS OR AGE OF RECEIVABLE 28
Historical Purchase Mix by Year, 2011 Estimate
($ millions) |
 TELECOM RECEIVABLES WILL BE AN AREA OF PURCHASING FOCUS IN
2011, WHICH WE HAVE EVOLVED INTO A COMPETITIVE STRENGTH
29
•
Historical telecom challenges
–
U.S. based servicing inflated
cost-to-collect
–
Long-term liquidation was over-
estimated
–
Prices were higher
•
As a result, our early investments
yielded lower-than-expected IRRs
Historical Telecom Cost-to-Collect
2005 -
2007 Purchases |
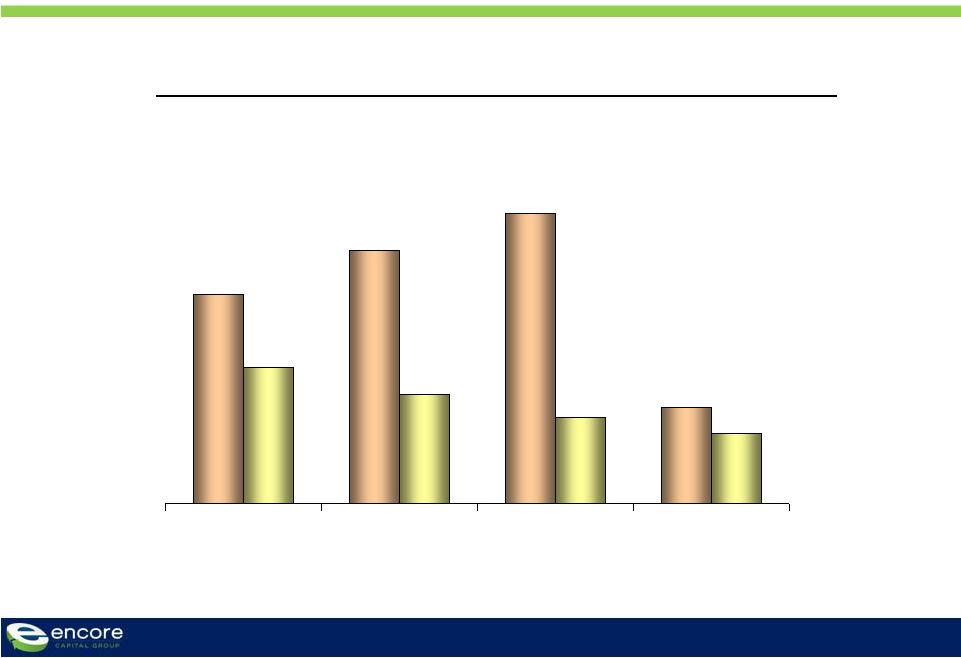
 LOWER
SERVICING COSTS AND TARGETED COLLECTION EFFORTS HAVE DRAMATICALLY IMPROVED
TELECOM PROFITABILITY Telecom Servicing Costs
Cost-to-collect
Telecom IRRs
%
30
2005-2007
2011
> 20%
Shorter collection curve duration
Servicing in India
Better operational models
Expect to deploy $30 million in 2011 |
 Our
India Operation Continues to be a Competitive Advantage
|
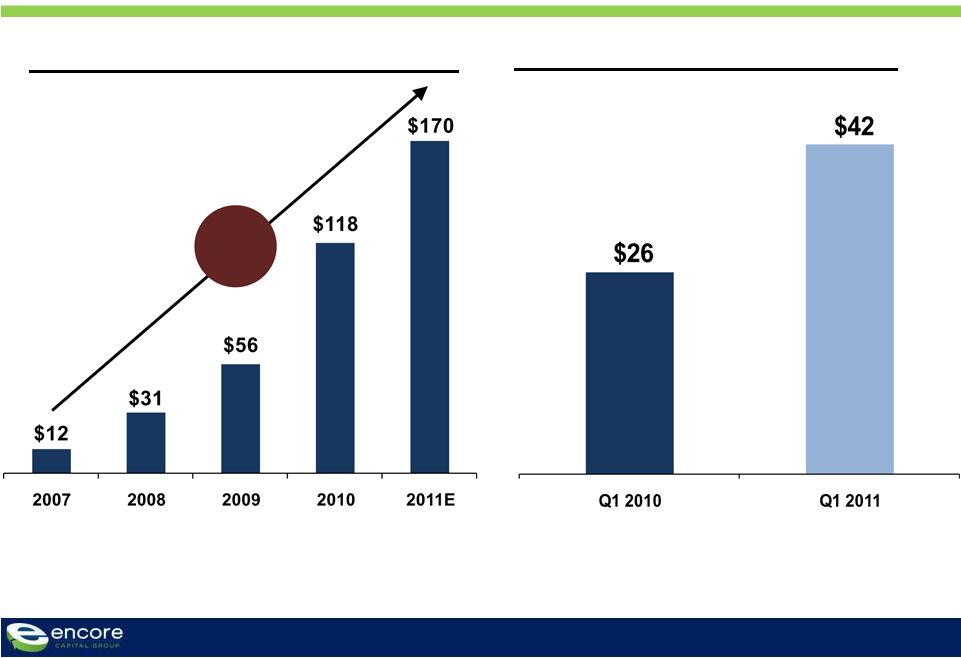 32
India Collections*
($ Millions)
* Includes all collections on accounts maintained by the India site
QoQ India Collections
($ millions)
2011 IS SHAPING UP TO BE ANOTHER YEAR OF SUBSTANTIAL
COLLECTIONS GROWTH FOR OUR OPERATIONS IN INDIA
93%
CAGR |
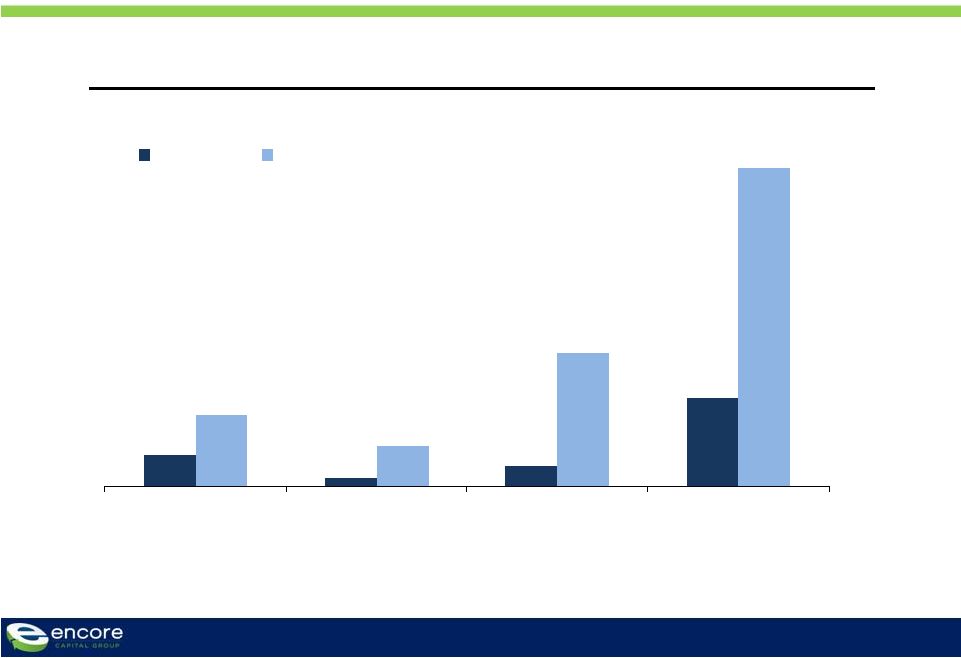
 Encore India Account Manager Headcount and Indicative Cash Average
Headcount (number); Cash average (indicative)
MUCH OF THE GROWTH IS DRIVEN BY OUR MATURING WORKFORCE
33
0
5
10
15
20
25
30
50
100
150
200
250
300
350
400
0-3 Months
4-6 Months
7-15 Months
15+ Months
Dec 2010
Mar 2011
Indicative cash average
- |
 34
DESPITE
LOCAL
WAGE
INFLATION,
WE
HAVE
BEEN
ABLE
TO
MAINTAIN
OUR TOTAL COST PER EMPLOYEE
* Cost per FTE includes all India site costs
Monthly Cost per Account Manager (FTE)*
($) |
 35
11
3
7
31
25
14
47
113
Customer Support
MIS/ Analytics
IT
Bankruptcy
Servicing
Dec 2007
Mar 2011
Encore India Non-Collection Headcount Growth
(Count )
TODAY, INDIA IS MUCH MORE THAN A CALL CENTER |
 36
2007
2009
2011
Local Support
Global Support
7
9
9
47
•
Only supporting the India site
•
First programmers hired in 2008
•
Added server administrators,
telecommunications’
specialists
and software quality assurance
team
•
All helpdesk functionality for
Encore handled in India
AND IS SUPPORTING OUR TECHNOLOGY NEEDS IN BOTH THE U.S.
AND INDIA
India IT Diversification
(Count )
Our India IT
staff provides
similar cost
savings to their
AM
counterparts |
 37
WE ASPIRE TO BECOME ONE OF INDIA’S LEADING EMPLOYERS, AS
DEFINED BY THE GREAT PLACE TO WORK INSTITUTE (GPTW)
Trust
Relationship
between
employees and
management
Pride
Relationship
between
employees and
Encore
Camaraderie
Relationship
between
employees
themselves |
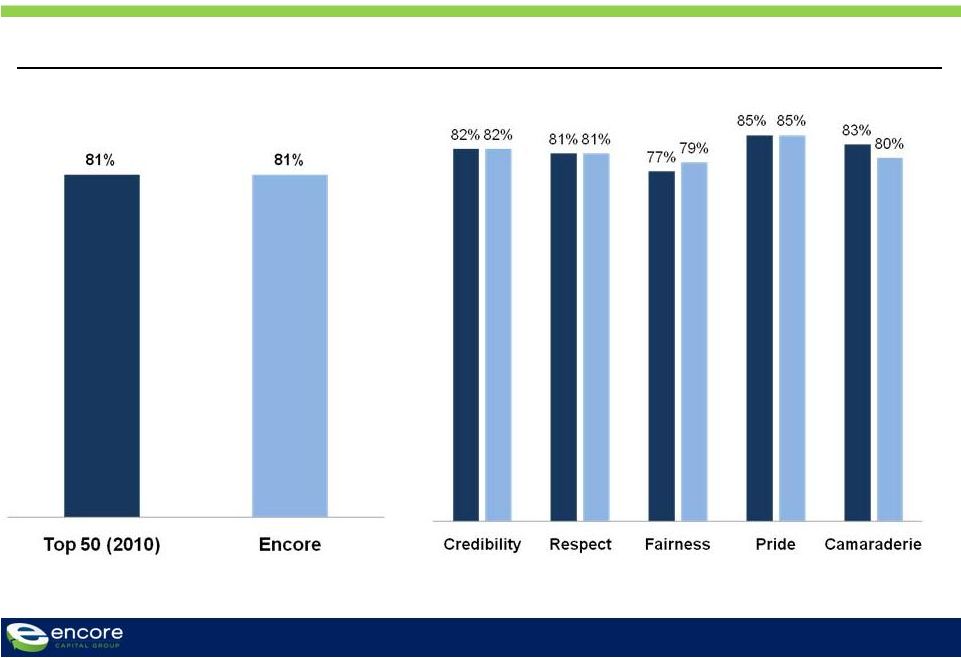 38
WHILE THE RESULTS HAVE NOT BEEN ANNOUNCED, OUR SCORES
COMPARE FAVORABLY TO THE TOP 50 EMPLOYERS
GPTW Survey Results Comparing Encore’s 2011 Results to the 2010 Winners
(% favorable) |
 Analytic-based Insights Driving
Performance |
 WE
BELIEVE LONG-TERM PROFITABILITY IN THIS INDUSTRY WILL BE DRIVEN BY
EXCELLENCE IN THREE KEY AREAS 40
Consumer-
level
underwriting
Superior
collection
approach
Low-cost
collection
platform |
 TO SUCCEED IN THOSE
AREAS, YOU MUST UNDERSTAND THE CONSUMER
41
Strong partnership
opportunities
with
willing
and
able
consumers
Our attempts to contact or
work with consumers are
typically ignored,
and
the
legal
option becomes necessary
Hardship
strategies
Offer
significant
discounts
and plans
that accommodate
many small payments
Remind consumers of their
obligation
through
legal
communications
Focus
on
payment
plans
and
opportunities to build longer
relationships
with
consumers
Willingness to pay
Is the debtor willing to resolve the debt on fair terms?
HIGH
HIGH
LOW
LOW |
 OUR
STRONG PORTFOLIO PURCHASING TRACK RECORD IS DRIVEN BY AN UNDERWRITING MODEL
FOCUSED ON INDIVIDUAL CONSUMERS 42
Deal Accuracy Since 2000
858
Total purchase
transactions
809
Total
profitable
deals
(39)
Principal not
fully recovered
(Count based on actual results plus forecast)
Principal recovered,
but not all servicing
costs
(10)
Since 2000, 94%
of our portfolio
purchases have
been profitable |
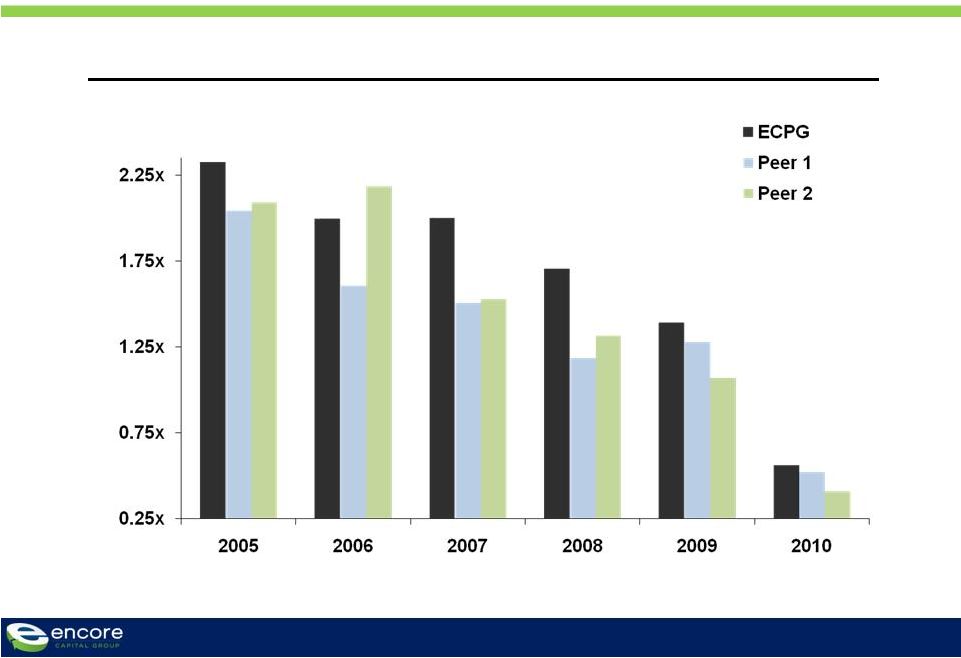 PURCHASING ACCURACY AND OUR ANALYTIC OPERATING MODEL
HAVE LED US TO CONSISTENTLY OUTPERFORM OUR PEERS
43
Cumulative Actual Collection Multiples by Vintage Year as of March 31, 2011
(Total Collections / Purchase Price)
Source: SEC Filings, Encore Capital Group Inc. |
 New
Strategic Initiatives That Will Leverage Our Strengths
|
 WE ARE
IN THE PROCESS OF BUILDING UPON OUR PRIOR SUCCESSES WITH POWERFUL STRATEGIC
INITIATIVES 45
Drive a meaningful portion of our legal
collections through internal resources
1.
Diversify our legal
platform
Create a world class near-shore facility
2.
Capture incremental
value through
increased offshore
activities
Collaborate with accomplished academics to
extend our deep consumer knowledge
3.
Develop new insights
about our consumers |
 WE
HAVE CONSISTENTLY ENHANCED OUR LEGAL COLLECTION INFRASTRUCTURE
46
2006
2007
2008
2009
2010
Strengthened firm
management processes
and operational support
to firms
Further strengthened
infrastructure and
governance
Began process of
building an internal legal
collection process
Dramatically increased
volumes to adapt to
changing consumer
behavior
Implemented new
placement models to
better optimize returns
2011
Considered, but rejected,
the idea of building an
internal process |
 THESE
IMPROVEMENTS HAVE DRAMATICALLY IMPROVED BOTH COLLECTIONS AND COST TO
COLLECT 47
$193.2
$232.7
$266.8
$88.5
2008
2009
2010
2011 Q1
Legal Collections and Costs as a Percentage of Legal Collections
($ millions)
45.4%
48.4%
41.3%
49.8% |
 48
SEVERAL FACTORS DURING LATE 2009 AND EARLY 2010 DROVE THE
DECISION TO BUILD AN INTERNAL LEGAL CAPABILITY
Legal/regulatory
environment
Rationale
for
internal
legal
•
Increased control over consumer
and court interaction
•
Reduced risk from firm failures
•
Ability to deploy our account-level
analytics against legal workflows
•
Champion / challenger approach to
improve performance
•
A 5% collection increase will
generate an incremental $15 million
in annual collections
•
We gain $0.06 in EPS for every 1%
reduction in overall cost
•
•
•
•
State-level legal requirements
changing rapidly
Limited number of firms who are
able to scale their operations
Flaws exposed in the traditional
model, including limited oversight
of service providers
Financial instability led to the
failure of some firms, including the
largest firm at the time |
 SINCE
THEN, WE HAVE MADE SIGNIFICANT PROGRESS 49
Hired dedicated legal
teams in 4 states
Developed and deployed
a customized litigation
technology platform
We plan to
operate in 6
states by the
end of 2011
Built a reliable service
provider network
Launched back-office
and collections teams |
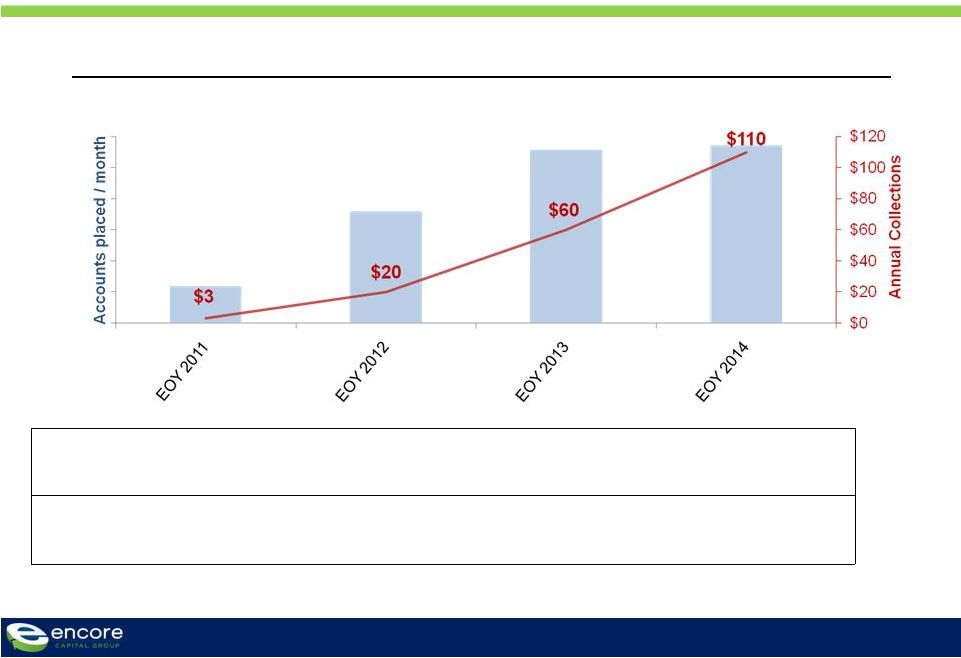 IT
WILL TAKE SOME TIME BEFORE THIS INITIATIVE CONTRIBUTES TO THE BOTTOM LINE
50
Number of
states
6
16
25
25
EoY
headcount
80-90
225-250
350-375
350-400
Placements, Collections
(#, $ millions) |
 51
Spanish Account Inventory
(in thousands)
WE ARE ALSO ADDRESSING OUR GROWING POPULATION OF
SPANISH-SPEAKING CONSUMERS
Our presence in San
Diego and Phoenix
provides us with a
natural hiring pool, but
hiring cannot keep pace
with inventory growth
US-based Spanish
servicing is challenging
because of labor
availability and cost |
 THE
SOLUTION IS BUILDING A NEAR-SHORE CALL CENTER BY LEVERAGING INSIGHTS FROM
OUR SUCCESS IN INDIA 52
We expect this site to increase overall call center capacity by as
many as 300 AMs, at a cost-to-collect under 20%
We are focused on Costa Rica and Panama because of their
proven ability to effectively address the U.S. marketplace
We expect to have the facility up and running in early 2012
|
 FINALLY, WE ARE CREATING A CENTER OF EXCELLENCE DEDICATED
TO UNDERSTANDING FINANCIALLY DISTRESSED CONSUMERS
53
A new demographic
segment has emerged
It has unique features, is
growing, and has needs that
are only marginally served
by existing business models
Unique consumer
demographics
Focus on broader
population confounds
efforts to understand
and respond to new
population
Confusing policy
environment
Consumer decisions are
poorly understood, many
voices confuse the
issues, and discussions
often substitute
anecdotes for data
Accelerating industry
maturation
Leading companies now
capable of making
investments in R&D and
integrating their discoveries
Clear educational
opportunities
Strengthen personal finance,
planning, and credit skills
through focused outreach
and expert instruction |
 ENCORE’S DEBT RESEARCH INSTITUTE WILL SERVE MULTIPLE
CONSTITUENCIES
54
Create and manage a
tailored suite of programs
that provide significant,
measureable benefit to
consumers
Promote
financial literacy
Conduct research to
understand financially
distressed consumers’
choice, consumptive, and
financial behaviors
Enhance consumer
intelligence
Integrate experimental
psychology and
behavioral finance into
collection practices
Increase collection
efficacy
DEBT
RESEARCH
INSTITUTE |
 SUMMARY
55
•
Investments made over the past few years have driven
significant improvements in collections, cash flow and earnings
•
Difficult regulatory environment being managed proactively
•
Expanding presence in India, combined with new strategic
initiatives, are expected to continue increasing cash flow from
operations
•
Demonstrated ability to raise and profitably deploy capital in
favorable and unfavorable business cycles |
 APPENDIX |
 APPENDIX A: CUMULATIVE COLLECTIONS BY PORTFOLIO VINTAGE
57
Cumulative Collections through March 31, 2011 (000’s)
Year
of
Purchase
Purchase
Price
<2005
2005
2006
2007
2008
2009
2010
2011
Total
CCM
<2005
$385,479
$749,791
$224,620
$164,211
$85,333
$45,893
$27,708
$19,986
$4,352
$1,321,894
3.4
2005
192,585
66,491
129,809
109,078
67,346
42,387
27,210
5,510
447,831
2.3
2006
141,029
42,354
92,265
70,743
44,553
26,201
5,316
281,432
2.0
2007
204,114
68,048
145,272
111,117
70,572
13,460
408,469
2.0
2008
227,885
69,049
165,164
127,799
26,645
388,657
1.7
2009
253,449
96,529
206,773
49,738
353,040
1.4
2010
359,843
125,853
77,752
203,605
0.6
2011
90,355
8,262
8,262
0.1
Total
$1,854,739
$749,791
$291,111
$336,374
$354,724
$398,303
$487,458
$604,394
$191,035
$3,413,190
1.8 |
 APPENDIX B: RECONCILIATION OF ADJUSTED EBITDA
58
Reconciliation of Adjusted EBITDA to GAAP Net Income
(Unaudited, In Thousands)
Three Months Ended
Note: The periods 3/31/07 through 12/31/08 have been adjusted to reflect the retrospective application
of ASC 470-20 3/31/07
6/30/07
9/30/07
12/31/07
3/31/08
6/30/08
9/30/08
12/31/08
3/31/09
6/30/09
9/30/09
12/31/09
3/31/10
6/30/10
9/30/10
12/31/10
3/31/11
GAAP net income, as reported
4,991
(1,515)
4,568
4,187
6,751
6,162
3,028
(2,095)
8,997
6,641
9,004
8,405
10,861
11,730
12,290
14,171
13,679
Interest expense
4,042
4,506
4,840
5,260
5,200
4,831
5,140
5,401
4,273
3,958
3,970
3,959
4,538
4,880
4,928
5,003
5,593
Contingent interest expense
3,235
888
-
-
-
-
-
-
-
-
-
-
-
-
-
-
-
Pay-off of future contingent interest
-
11,733
-
-
-
-
-
-
-
-
-
-
-
-
-
-
-
Provision for income taxes
3,437
(1,031)
1,315
2,777
4,509
4,225
2,408
(1,442)
5,973
4,166
5,948
4,609
6,490
6,749
6,632
9,075
8,601
Depreciation and amortization
869
840
833
810
722
766
674
652
623
620
652
697
673
752
816
958
1,053
Amount applied to principal on receivable portfolios
28,259
29,452
26,114
29,498
40,212
35,785
35,140
46,364
42,851
48,303
49,188
47,384
58,265
64,901
63,507
53,427
85,709
Stock-based compensation expense
801
1,204
1,281
1,001
1,094
1,228
860
382
1,080
994
1,261
1,049
1,761
1,446
1,549
1,254
1,765
Adjusted EBITDA
45,634
46,077
38,951
43,533
58,488
52,997
47,250
49,262
63,797
64,682
70,023
66,103
82,588
90,458
89,722
83,888
116,400 |