Attached files
| file | filename |
|---|---|
| 8-K - FORM 8-K - VIRTUS INVESTMENT PARTNERS, INC. | d8k.htm |
 Keefe, Bruyette & Woods
Investment Management & Specialty Finance Conference
June 8, 2011
Exhibit 99.1 |
 Important Disclosures
2 |
 Speakers
George R. Aylward
President and
Chief Executive Officer
Michael A. Angerthal
Executive Vice President
and Chief Financial Officer
3 |
 Introduction
LISTING
NASDAQ: VRTS
COMMENCED TRADING
January 2, 2009
FIRST TRADE
$9.00
CLOSING PRICE, JUNE 6, 2011
$57.01
COMMON SHARES
OUTSTANDING (DILUTED)
6.9 million
SERIES B CONVERT. PREF.
35,217 (Convertible to 1.3MM Common)
MARKET CAPITALIZATION
1
$471 million
1
Fully converted, as of June 6, 2011
4 |
 Virtus
Value Proposition Business Model
•
Multi-boutique manager, multi-strategy model
•
Broad investment capabilities from affiliates and subadvisers
•
Shared distribution and support services
•
Platform model that allows for new teams and firms
Products
•
Diversified and balanced product set
•
Active product management
•
Strong relative performance
•
Competitive mutual fund offerings
Distribution
•
Multi-market distribution
•
Broad and balanced retail distribution reach
•
Well-defined value proposition
•
Experienced retail sales force and effective strategy
Financial and Operating
Attributes
•
Significant growth in assets, sales and net flows
•
Bottom-line growth and margin expansion
•
Solid balance sheet and capital flexibility
•
Significant tax attributes
5 |
 Business Model
Product
Distribution
Financial and Operating
Attributes
Multi-boutique manager,
multi-strategy model
Broad investment
capabilities from affiliates
and subadvisers
Shared distribution and
support services
Platform model that allows
for new teams and firms
Business Model
Products
Distribution
Financial and Operating
Attributes
6 |
 Virtus
Brand We are unconstrained by a single investment approach.
Rather, we
provide access to independent, specialized investment philosophies
through our multi-discipline, multi-strategy approach.
We have the flexibility, agility and responsiveness of a boutique
asset
management
firm
with
the
product
breadth,
distribution
reach,
and investment talent similar to some larger firms.
Virtus is committed to thoughtfully providing investment solutions,
adhering to the highest standards of product quality, operational
excellence and fiduciary responsibility.
We are a distinctive partnership of boutique investment managers
singularly committed to the long-term success
of individual and institutional investors.
7 |
 Multi-Boutique, Multi-Strategy Model
Affiliates that comprise Virtus
External subadvisers
8 |
 Business Model
Products
Distribution
Financial and Operating
Attributes
Diversified and balanced
product set
Active product management
Strong relative performance
Competitive mutual fund
offerings
9 |
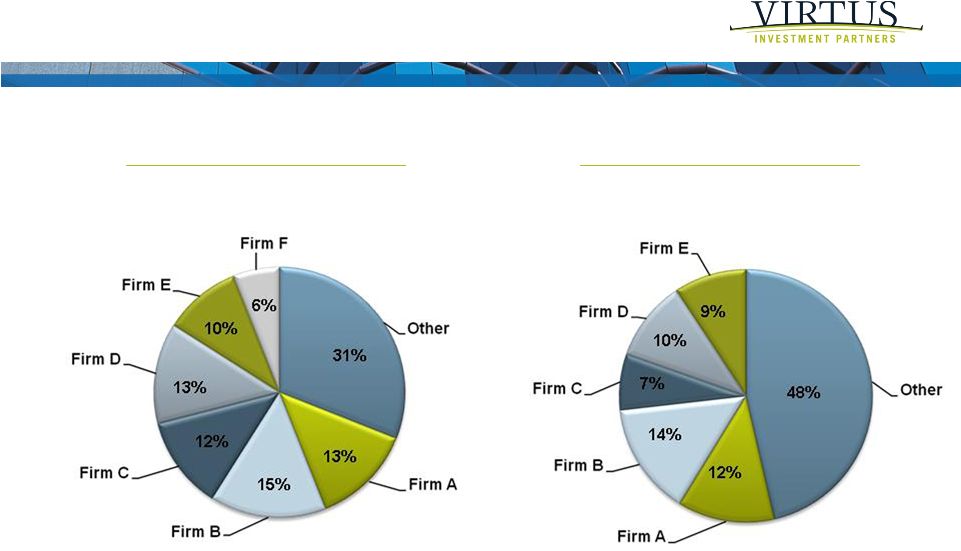
 Diversified Product Set
Total AUM $31.9 billion
$ in billions
As of March 31, 2011
10 |
 Active Product Management
Monitor performance and change or replace managers when needed
Identify investment needs of clients and introduce new offerings
Identify
strong
performing
product
capabilities
that
can
benefit
from
our distribution
Enhance and expand capabilities through fund adoptions
11 |
 Strong Relative Performance
PERFORMANCE AS OF MARCH 31, 2011
1
Mutual funds and institutional products
All analysis excludes closed-end funds and money market products
% of AUM Exceeding Benchmarks
% of AUM in Top Half of Peer Category
1
12 |
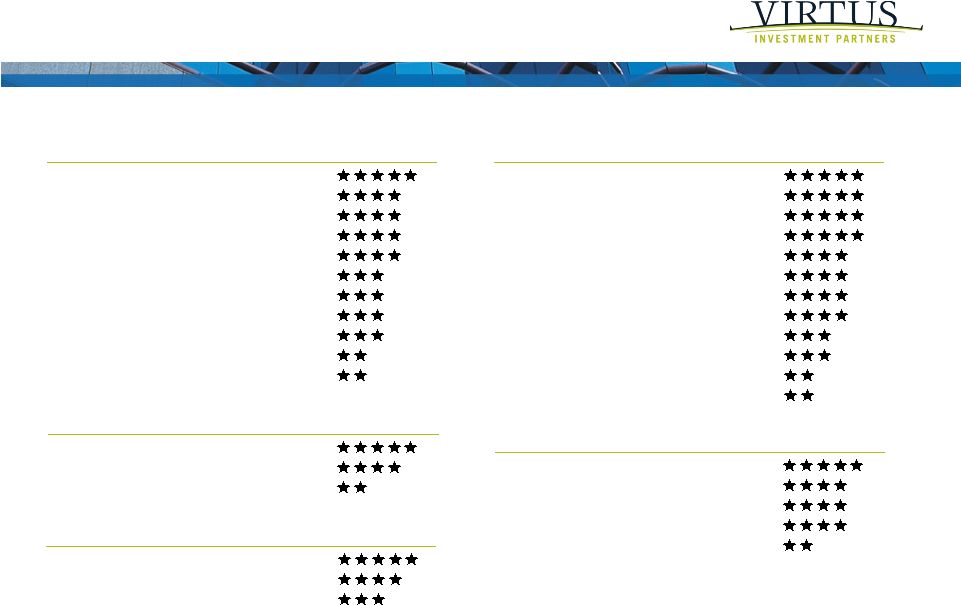 Competitive Mutual Fund Offerings
Load Waived Morningstar as of May 31, 2011
U.S. EQUITY
Quality Small-Cap
AlphaSector™
Rotation
Core Equity
Small-Cap Core
Value Equity
Growth & Income
Mid-Cap Value
Quality Large-Cap Value
Small-Cap Sustainable Growth
Strategic Growth
Mid-Cap Growth
ASSET ALLOCATION FUNDS
Tactical Allocation
Balanced Allocation
Balanced
FIXED INCOME
Multi-Sector Short-Term Bond
Senior Floating Rate Fund
Short/Intermediate Bond
Tax-Exempt Bond
Intermediate Tax-Exempt Bond
Institutional Bond
Bond
CA Tax-Exempt Bond
Multi-Sector Fixed Income
Intermediate Government Bond
High Yield
High Yield Income
ALTERNATIVE
International REIT
Global Infrastructure
REIT
Alternatives Diversifier
Market Neutral
INTERNATIONAL EQUITY
Emerging Mkts Opportunities
Foreign Opportunities
Global Opportunities
13 |
 Business Model
Products
Distribution
Financial and Operating
Attributes
Multi-market distribution
Broad and balanced retail
distribution reach
Well-defined value
proposition
Experienced retail sales
force and effective strategy
14 |
 ATTRIBUTES
CHANNELS
RETAIL
Segmentation
Well-defined value proposition
Diagnostic sales approach
Metric driven accountability
Wirehouse
Regional
Planners
RIA
DCIO / VIT
INSTITUTIONAL
Affiliate-centric
Consultative approach
Consultants
Direct
Multi-Market Distribution
15 |
 Broad
and Balanced Reach As of March 31, 2011
* Figures include both long-term mutual funds and sponsored managed
accounts AUM BY FIRM*
YTD SALES BY FIRM*
$15.3 billion
$2.3 billion
16 |
 Well-Defined Value Proposition
One point access to a number of differentiated and diverse high quality
boutique managers
Assist financial advisors to gather, place and retain assets
Utilize a consultative approach to help financial advisors better manage their
book of business
17 |
 Business Model
Products
Distribution
Financial and Operating
Attributes
Significant growth in assets,
sales and net flows
Bottom-line growth and
margin expansion
Solid balance sheet and
capital flexibility
Significant tax attributes
18 |
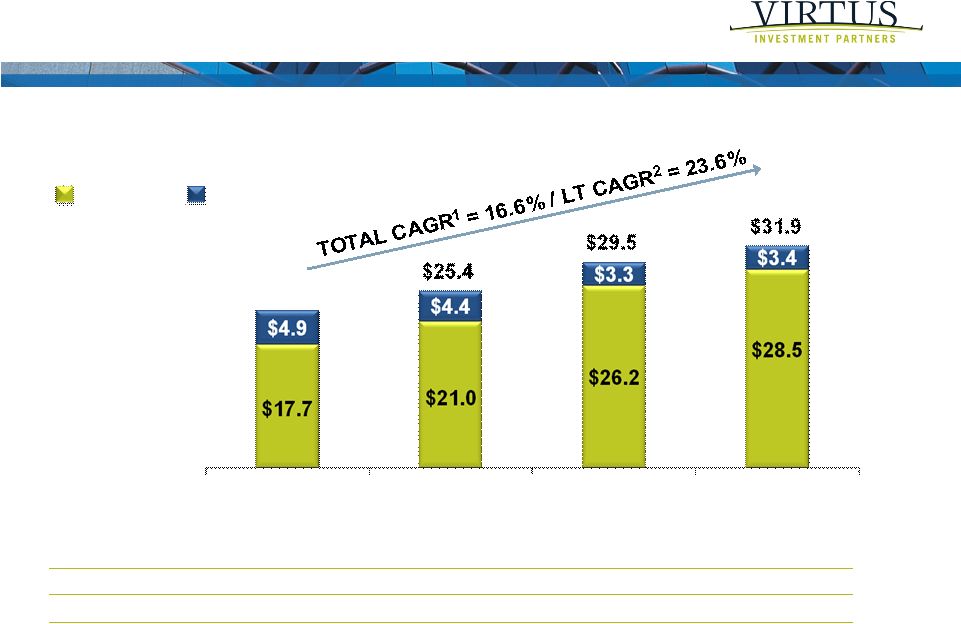 ASSETS UNDER MANAGEMENT
$ in billions
1
TOTAL CAGR –
Reflects compound annual growth rate for Long-Term and Cash AUM from
12/31/08 to 3/31/11 2
LT CAGR –
Reflects compound annual growth rate for Long-Term AUM from 12/31/08 to
3/31/11 Financial and Operating Attributes
AUM DRIVERS
Sales
-
$3.9
$5.8
$2.6
Net Flows
-
$0.1
$1.6
$1.4
Market Appreciation
-
$3.0
$2.3
$0.9
12/31/08
12/31/09
12/31/10
3/31/11
Long-Term
Cash
$22.6
19 |
 $
in millions 1
Annualized
Financial and Operating Attributes
20 |
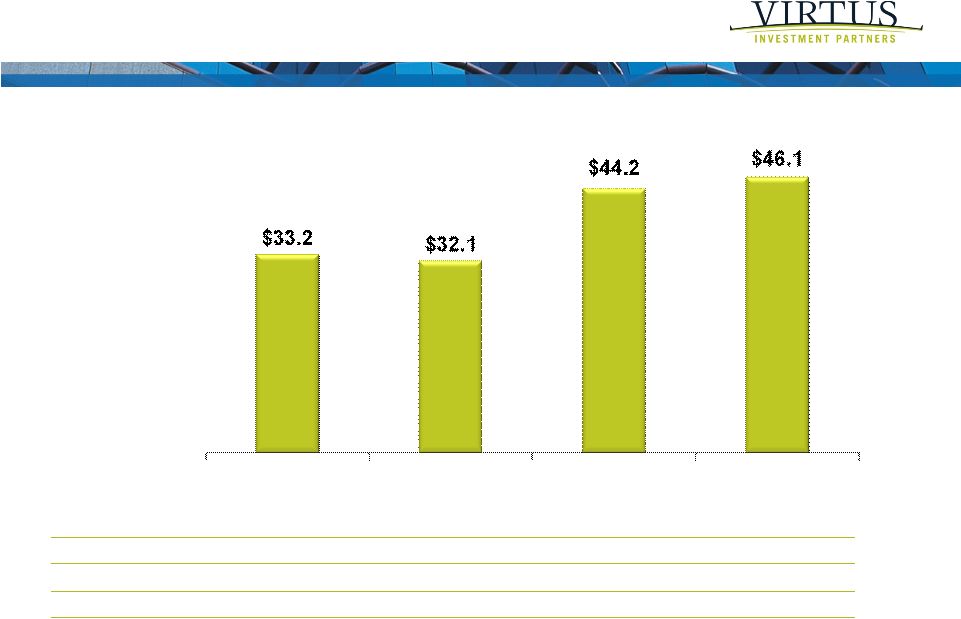
 Financial and Operating Attributes
OPERATING INCOME, AS ADJUSTED
$ in millions
1
See Appendix for Reconciliation from GAAP to Non-GAAP Reporting.
2
Percentage of Revenues, as adjusted
21
1 |
 Financial and Operating Attributes
1
Working Capital divided by annualized quarterly operating expenses
$ in millions
WORKING CAPITAL TREND
12/31/08
12/31/09
12/31/10
3/31/11
% of Spend
1
27%
25%
28%
27%
Cash
$51.1
$28.6
$43.9
$33.0
Debt
$20.0
$15.0
$15.0
$15.0
Stockholders’
equity
$36.6
$29.7
$48.3
$50.6
22 |
 Financial and Operating Attributes
$ in millions
FEDERAL DEFERRED TAX ASSET INVENTORY
COMPONENTS
DEFERRED
TAX ASSETS
ORDINARY INCOME
TAX SHIELD
Net Operating Losses
$10.4
$29.6
Intangible Assets
60.0
192.1
Subtotal-Ordinary Income Attributes
$70.4
$221.7
Capital Losses
$81.5
-
Subtotal-Capital Income Attributes
$81.5
-
TOTAL
$151.9
$221.7
Note:
Amounts are reduced by Section 382 limitations;
substantially all assets have a full valuation allowance recorded
23 |
 Financial and Operating Attributes
KEY ATTRIBUTES
AUM (5/31/11)
$5.2B
Q1 2011 organic growth rate
1
49.0%
Fee rate on internalized AUM
25 bps
Run rate incremental revenue
$12.8M
Team members
13
1
Annualized
MULTI-SECTOR TEAM
24 |
 Growth Opportunities
Product offerings
–
New strategies from existing managers
–
New products from existing strategies
–
New affiliated subadvisers and teams
Distribution capabilities
–
Institutional market
–
Further retail penetration outside of wirehouses
–
Selective resource expansion
Operational and infrastructure enhancements
25 |
 Virtus Value Proposition
Multi-boutique manager, multi-strategy model
Diversified and balanced product set
Distribution through multiple channels with broad retail access
Sales and profitability momentum
Improved profitability by leveraging business model
26 |
 ********************************************************
*****************************************************
27 |
 Appendix
Q1:09
Q2:09
Q3:09
Q4:09
Q1:10
Q2:10
Q3:10
Q4:10
Q1:11
Revenues, GAAP Basis
$26,251
$27,181
$30,395
$33,325
$33,447
$34,788
$35,582
$40,739
$44,121
Less:
Distribution and administration expenses
6,838
7,449
7,510
8,142
7,344
7,786
8,217
9,858
11,077
Revenues, as adjusted
$19,413
$19,732
$22,885
$25,183
$26,103
$27,002
$27,365
$30,881
$33,044
Operating Expenses, GAAP Basis
$30,722
$30,003
$31,017
$32,033
$32,740
$33,571
$32,685
$36,289
$39,678
Less:
Distribution and administrative expenses
6,838
7,449
7,510
8,142
7,344
7,786
8,217
9,858
11,077
Depreciation and amortization
2,268
2,217
2,436
2,070
2,024
1,793
1,588
1,524
1,535
Stock-based compensation
333
1,203
949
1,035
845
1,163
988
898
841
Restructuring and severance charges
437
193
450
22
30
1,100
228
277
147
Operating Expenses, as adjusted
$20,846
$18,941
$19,672
$20,764
$22,497
$21,729
$21,664
$23,732
$26,078
Operating Income (Loss), as adjusted
($1,433)
$791
$3,213
$4,419
$3,606
$5,273
$5,701
$7,149
$6,966
Operating margin, GAAP basis
(17%)
(10%)
(2%)
4%
2%
3%
8%
11%
10%
Operating margin, as adjusted
(7%)
4%
14%
18%
14%
20%
21%
23%
21%
$ in thousands
Reconciliation from GAAP to Non-GAAP Reporting
28 |
 Appendix
Notes for Reconciliation to GAAP Reporting
1)
Revenues, as adjusted, is a non-GAAP financial measure calculated by netting
distribution and administration expenses from GAAP revenues.
Management believes revenues, as adjusted, provides useful information to investors because distribution and administrative
expenses are costs that are generally passed directly through to
external parties. Effective with the 2010 first quarter, the company no
longer pays outside service providers for certain fund administration and
transfer agency services from the fees it collects for open-end funds it
manages. These amounts are now paid by the funds directly to the
third-party service providers and, as a result, the revenue and expense
previously recorded by the company for these services are no longer
reflected. These payments were reported in the above reconciliation of
GAAP to non-GAAP revenue and expenses for the 2009 period.
2)
Operating expenses, as adjusted, is a non-GAAP financial measure that
management believes provides investors with additional information because
of the nature of the specific excluded operating expenses. Specifically, management adds back amortization and impairments
attributable to acquisition related intangible assets as this is
useful to an investor to consider our operating results with the results of other
asset management firms that have not engaged in significant acquisitions. In
addition, we add back restructuring and severance charges as we believe that
operating expenses exclusive of these costs will aid comparability of the
information to prior reporting periods. We believe that because of the
variety of equity awards used by companies and the varying methodologies for determining stock-based compensation
expense, excluding stock-based compensation enhances the ability of management
and investors to compare financial results over periods. Distribution and
administrative expenses are excluded for the reason set forth above.
3)
Operating income (loss), as adjusted, and operating margin, as adjusted, are
calculated using the basis of revenues, as adjusted, and operating expenses,
as adjusted, as described above. The above measures should not be considered
as substitutes for any measures derived in accordance with GAAP and may not be
comparable to similarly titled measures of other companies. Exclusion of
items in our non-GAAP presentation should not be considered as an
inference that these items are unusual, infrequent or non-recurring.
Virtus Investment Partners reports its financial results on a Generally Accepted
Accounting Principles (GAAP) basis; however management believes that
evaluating
the
company's
ongoing
operating
results
may
be
enhanced
if
investors
have
additional
non-GAAP
financial
measures.
Management
reviews
non-GAAP
financial
measures
to
assess
ongoing
operations
and
considers
them
only
to
be
additional
metrics
for
both
management
and
investors
to
consider
the
company's
financial
performance
over
time,
as
noted
in
the
footnotes
below.
Management
does
not
advocate
that
investors
consider
such
non-GAAP
financial
measures
in
isolation
from,
or
as
a
substitute
for,
financial
results
prepared
in
accordance
with
GAAP.
29 |