Attached files
| file | filename |
|---|---|
| 8-K - FORM 8-K - Kraton Corp | d8k.htm |
 Kraton Overview
Macquarie Capital
June 2011
Exhibit 99.1 |
 Forward-Looking
Statement Disclaimer 2
This presentation may include “forward-looking statements” that reflect our plans, beliefs,
expectations and current views with respect to, among other things, future events and financial
performance. Forward-looking statements are often characterized by the use of words
such as “believes,” “estimates,” “expects,” “projects,”
“may,” “intends,” “plans” or “anticipates,” or by discussions of
strategy, plans or intentions. All forward- looking statements in this presentation are made
based on management's current expectations and estimates, which involve risks, uncertainties and
other factors that could cause actual results to differ materially from those expressed in
forward-looking statements. Readers are cautioned not to place undue reliance on forward-
looking statements. These risks and uncertainties are more fully described in “Part I. Item 1A.
Risk Factors” contained in our Annual Report on 10-K, as filed with the Securities and
Exchange Commission and as subsequently updated in our Quarterly Reports on Form 10-Q, and
include risks related to: conditions in the global economy and capital markets; our reliance on
LyondellBasell Industries for the provision of significant operating and other services; the
failure of our raw materials suppliers to perform their obligations under long- term supply
agreements, or our inability to replace or renew these agreements when they expire; limitations in
the availability of raw materials we need to produce our products in the amounts or at the prices
necessary for us to effectively and profitably operate our business; competition in our
end-use markets, by other producers of SBCs and by producers of products that can be
substituted for our products; our ability to produce and commercialize technological innovations;
our ability to protect our intellectual property, on which our business is substantially
dependent; infringement of our products on the intellectual property rights of others;
seasonality in our Paving and Roofing business; financial and operating constraints related to our
substantial level of indebtedness; product liability claims and other lawsuits arising from
environmental damage or personal injuries associated with chemical manufacturing; political and
economic risks in the various countries in which we operate; the inherently hazardous nature of
chemical manufacturing; health, safety and environmental laws, including laws that govern our
employees’ exposure to chemicals deemed harmful to humans; regulation of our customers,
which could affect the demand for our products or result in increased compliance costs;
international trade, export control, antitrust, zoning and occupancy and labor and employment
laws that could require us to modify our current business practices and incur increased costs; our
relationship with our employees; loss of key personnel or our inability to attract and retain new
qualified personnel; fluctuations in currency exchange rates ; the fact that we do not enter into
long-term contracts with our customers; a decrease in the fair value of our pension assets,
which could require us to materially increase future funding of the pension plan; and
concentration of ownership among our principal stockholder, which may prevent new investors from
influencing significant corporate decisions. We assume no obligation to update such information.
Further information concerning issues that could materially affect financial performance related
to forward looking statements can be found in our periodic filings with the Securities and
Exchange Commission. |
 GAAP Disclaimer
3
This presentation includes the use of both GAAP (generally accepted accounting
principles) and non-GAAP financial measures. The non-GAAP financial measures are
EBITDA and Adjusted EBITDA. The most directly comparable GAAP financial measure
is net income/loss. A reconciliation of the non-GAAP financial measures used in this
presentation to the most directly comparable GAAP measure is included herein. We
consider EBITDA and Adjusted EBITDA important supplemental measures of our
performance and believe they are frequently used by investors and other interested
parties in the evaluation of companies in our industry. EBITDA and Adjusted EBITDA
have limitations as analytical tools and should not be considered in isolation or as a
substitute for analysis of our results under GAAP in the United States. |
 37%
21%
42%
4
Kraton Overview
We invented and commercialized Styrenic Block
Copolymer (SBC) technology nearly 50 years ago.
We believe that we hold #1 market share positions in
each of our end-use markets providing industrial,
consumer and geographical diversification that is second
to none.
We design and manufacture customized SBC polymer
and compound solutions to meet our leading customers’
specific innovation needs.
We produce the following:
Unhydrogenated Styrenic Block Copolymers (USBCs).
Hydrogenated Styrenic Block Copolymers (HSBCs).
Isoprene Rubber and Isoprene Rubber Latex.
We currently offer approximately 800 products to more
than 700 customers, in over 60 countries.
We employ approximately 880 people in 9 locations in all
major regions of the world.
2010
revenue
of
$1,228
million
and
Adjusted
EBITDA
(1)
of
$195 million; 16% margin.
(1)
Adjusted EBITDA is GAAP EBITDA excluding management fees, restructuring and related charges,
non-cash expenses, and the gain on extinguishment of debt.
(2)
Management estimates.
2010 Revenue by End-Use
(2)
2010 Revenue by Geography
(2)
North and
South
America
Europe,
Middle
East &
Africa
Asia Pacific
32%
28%
31%
7%
2%
Paving and
Roofing
Adhesives,
Sealants and
Coatings
Other
Emerging
Businesses
Advanced
Materials
Clear SBC Market Leader Globally |
 5
Investment Highlights
Leadership
Clear leader in the fast growing, attractive SBC market
More
than
1.6x
the
size
of
our
largest
competitor
in
each
of
our
end-use
markets
The only producer with a global footprint and service capabilities
Innovation-
Driven Top-
Line Growth
Most-productive innovator of new SBC polymers
Successfully leveraging product knowledge and technical expertise to commercialize
next generation of innovative solutions
Earnings
Growth
Driven by compelling organic growth platforms, expanding presence in Asia, sustained
volume growth and new product introductions
Margin
enhancement
through
continued
“Smart
Pricing”
strategy
and
innovation
Created meaningful operating leverage through significant improvement in cost structure
Investing
capital
in
high-return
projects
–
driving
profitable
growth
in
key
products
and
geographies
Experience
Strong leadership team demonstrating continuous improvement in productivity,
innovation and margin improvement
High
Barriers to
Entry
Patented technology, custom designed product, process excellence, global reach
and customer relationships create strong competitive position that cannot be
matched by existing or potential competitors
Competitive position allows for price leadership
Best-in-class service levels: 100% of products delivered on-demand on-time
|
 6
SBCs Enhance Performance Attributes
Durability
Elasticity
Impact
Soft Touch
Clarity
Adhesion
We are a Highly Engineered, Performance Materials Business
Recyclable |
 7
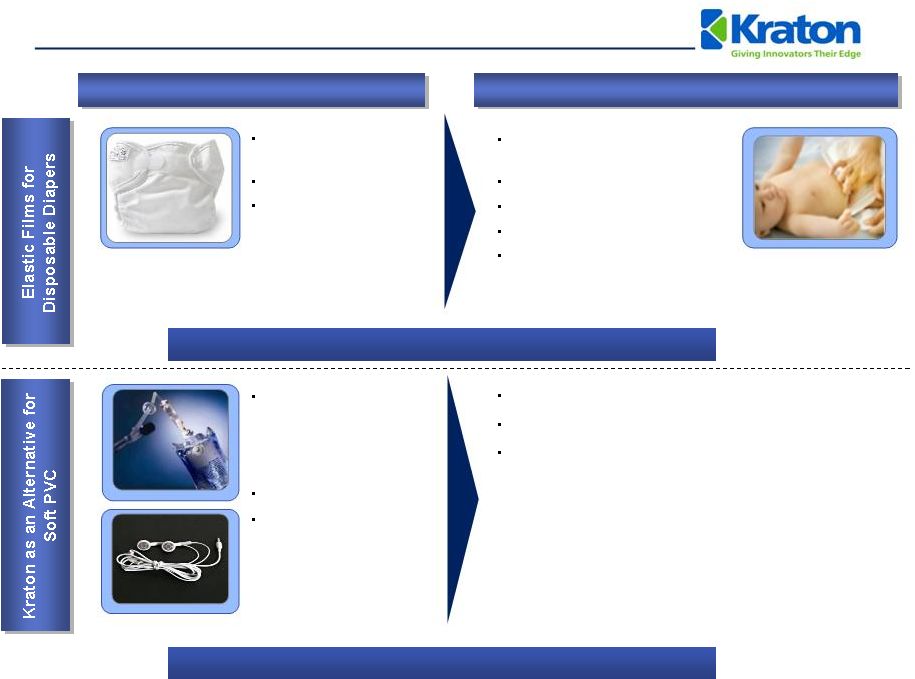
Before Kraton
After Kraton
Kraton Makes Products Better
Stretch in legs only
(Spandex)
Not a fitted garment
High leakage rate
Overall improvement in stretch
(where it’s needed)
Better fit
Low leakage rate
Kraton market share: 50%
2001
–
2009
CAGR:
11.5%
Kraton material as % of Diaper cost: <2%
Phthalate plasticizers are
used to make PVC soft
but they can leach from
finished products and
create health concerns
Limited recyclability
PVCs are unsafe when
burned or incinerated
improperly
Environmentally
friendly
–
100%
recyclable
Kraton imparts softness, toughness and clarity
Plasticizer & chlorine free
Kraton material as % of finished product cost: <5% |
 8
SBCs Are a Growth Industry
SBC Industry Volume (kT)
(1)
SBCs Grow Faster Than GDP
Adoption and penetration of SBCs into
new applications and end-markets lead to
industry growth of ~2x global GDP
Growing demand from emerging
economies
Innovation and new SBC product
introductions
End use application growth (e.g.,
PVC alternatives for wire & cable
and medical applications such as IV
bags, etc.)
Growing demand for
environmentally friendly and greener
alternatives in electronics, medical,
automotive and baby care markets
Low cost relative to value added /
performance with limited substitution risk
(1)
Management Estimates. Excludes footwear end-use in which Kraton does not actively compete
675
1,112
1,599
2001
2009
2014 |
 9
Clear Leader in Attractive Markets
#1
~77%
Adhesives, Sealants,
and Coatings
Advanced Materials
#1
~74%
Paving and Roofing
#1
~63%
Emerging Businesses
(4)
#1
100%
32%
30%
28%
7%
1.9x
2.0x
1.6x
N/A
Source:
Management estimates.
(1)
Based on 2010 sales of $1,228 million.
(2)
Industry volume growth from 2001-2009, Emerging Businesses growth rate refers to Kraton’s
Isoprene Rubber (“IR”) and Isoprene Rubber Latex (“IRL”) growth from 2005-2009.
(3)
Management’s estimates vs. next largest competitor based on 2009 sales.
(4)
The Emerging Businesses end use market includes our IR and IRL business. We believe that we are the
only major third-party supplier of IR and IRL, and therefore end use market share metrics
are not meaningful. #1 Market Position and More than 1.6x the Size of Our Closest
Competitors Top 4 Market
Share
5.9%
7.4%
6.5%
26.8%
2010 Revenue
(1)
Growth
(2)
Market Position
Kraton Market
Share Relative To
#2 Competitor
(3) |
 10
Unparalleled Global Manufacturing and Service
Capability
Belpre, Ohio U.S.
Manufacturing Facility
Global Headquarters
Houston, Texas U.S.
Innovation Center
Paulinia, Brazil
Manufacturing Facility
Innovation Center
Mont St. Guibert,
Belgium
Technical Service Office
Wesseling, Germany
Manufacturing Facility
Kashima, Japan
Innovation Center
Manufacturing
Joint Venture
Berre, France
Manufacturing Facility
Amsterdam,
Innovation Center
Netherlands
Shanghai, China
Customer Service and
Technical Center |
 20%
14%
13%
12%
14%
13%
11%
5%
2005
2006
2007
2008
2009
2010
Q1'11
TTM
Target
11
Profit Growth Through Innovation
Approximately 1,053 patents
granted and 349 pending
Innovation continuously
repositions sales mix, improves
margins and drives growth
Step-change advancement of
Big 6 Innovation Priorities
Wire and cable solutions
Elastic nonwovens
NEXAR™
membrane
technology
Oilfield service applications
Protective films
Automotive soft skin solutions
Innovation
Share
of
Total
Revenue
(%)
(1)
(1)
Innovation revenue defined as revenues of new products (e.g., new polymer, new application of an
existing polymer or new step out production technology) introduced within the last 5
years Vision 20/20: 20% of revenue at 20% margin premium
Increased in Period of
Strong Volume
Growth in Base
Business |
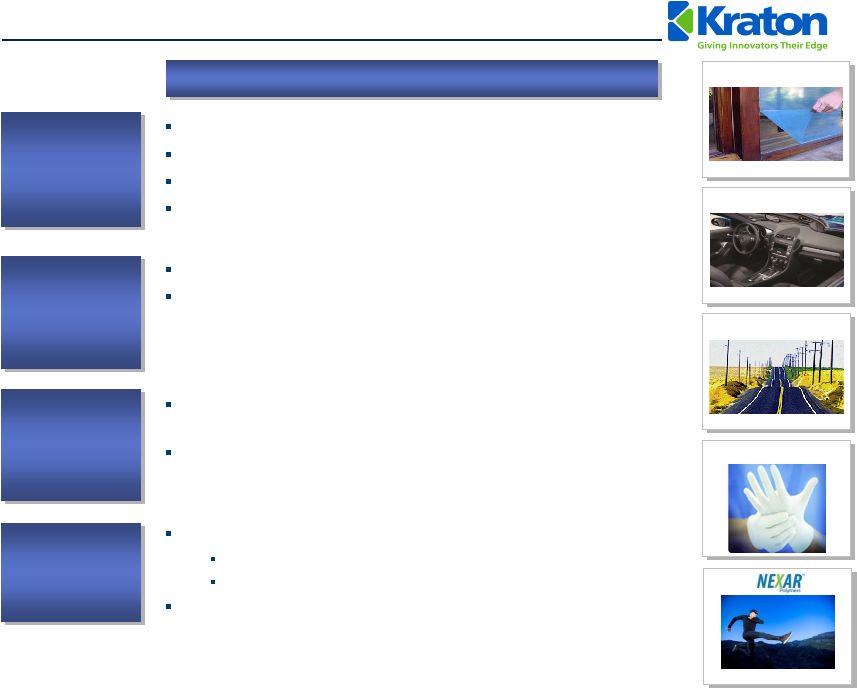 Compelling Organic
Growth Platforms 12
Advanced
Materials
Adhesives,
Sealants &
Coatings
Paving and
Roofing
Emerging markets growth.
Expansion into new and differentiated markets, such as
white elastomeric roof coatings, protective films, oilfield
service applications, spray and extrusion coatings, hot melt
adhesives, elastic adhesives, labels and sealant
applications.
Superior performing SBS modified emulsions for asphalt
modification.
Low VOC roof coating formulations for superior water
resistance, improved adhesion and reduced installation cost.
“Green”
PVC alternatives for the wire and cable industry.
Enabling technology for high performance fabric solutions.
“Soft Touch”
solutions for the automotive industry.
Co-extrusion technology for protective films.
Applications
Cariflex™
Isoprene
Rubber and
Isoprene
Rubber Latex
CariflexTM Isoprene Rubber and Isoprene Rubber Latex
Medical
applications
–
surgical
gloves,
medical
components.
Material
substitution
–
condoms.
NEXAR
®
–
high-end
membrane
technology
HiMA
Protective Films
Soft Skins
IRL Gloves |
 Innovation-led Top
Line Growth Tremendous growth
Rapidly capture share from $2.2 billion
natural rubber latex industry
Margins well in excess of rest of business
Kraton maintains ~86% market share
Challenging process technology to replicate
for competitors and new entrants
IR line conversion at Belpre, Ohio will be
complete second quarter 2011
IRL capacity expansion of Paulinia, Brazil
facility completed May 2011
Increased IRL capacity by approximately
33%
Case
Study:
IR
and
IR
Latex
Revenue
Growth
13
Key Attributes
$15
$22
$23
$35
$86
$79
$61
2005
2006
2007
2008
2009
2010
TTM
Q1'11
(US$ in millions) |
 27
62
149
2001
2009
2014
Investing for Growth In Asia
14
Asia
Pacific
SBC
market
–
53%
of
global SBC consumption by volume in
2009
(1)
In 2010 Asia Pacific accounted for
21% of our total revenue, with 43%
derived from higher margin HSBC
products
In 2010 relocated Shanghai, China
office to a new facility (double the size
of the previous location)
Expanded warehouse capacity in
Shanghai Waigaoqiao Free Trade
Zone
Proposed HSBC expansion in Asia
Forecast strong worldwide growth in HSBC
driven by innovation
Initiated project assessment for a new 30 kT
per year HSBC plant in Asia
Site selection expected Q2 2011 with start-
up as early as second half of 2013
Asia is an important component of Kraton’s growth strategy
(1)
Management estimates. Includes SBC consumption for footwear, a market in which Kraton does not
actively compete. Asian HSBC Industry Demand Trends (kT) |
 15
$151
$176
$255
$301
2007
2008
2009
2010
Historical Financial
Summary
$1,066
$920
$1,171
$1,228
2007
2008
2009
2010
$91
$152
$68
$195
2007
2008
2009
2010
358
313
260
307
2007
2008
2009
2010
Volume (kT)
Revenue
(1)
Gross Profit
Adjusted EBITDA
(2)
Margin:
14.2%
21.8%
18.1%
24.5%
Margin:
6.4%
13.0%
9.9%
15.8%
(1)
Excludes by-product revenue.
(2)
Adjusted EBITDA is GAAP EBITDA excluding management fees, restructuring and related charges,
non-cash expenses, and the gain on extinguishment of debt.
US $ in millions |
 Impact of Monomer
Volatility 16
Kraton has demonstrated its core competence of managing volatility in monomer costs by raising
prices and passing through costs
We
have
implemented
44
price
increases
since
our
IPO
in
December
2009,
including
24
year-to-date
$568
$537
$805
$976
$918
$632
$707
$781
$849
$864
$1,046
$970
$810
Q1 08
Q2 08
Q3 08
Q4 08
Q1 09
Q2 09
Q3 09
Q4 09
Q1 10
Q2 10
Q3 10
Q4 10
Q1 11
Gross
Profit
per
Ton
@
LIFO
$636
$664
$1,054
$932
$190
$501
$865
$998
$949
$1,034
$1,024
$885
$1,068
Q1 08
Q2 08
Q3 08
Q4 08
Q1 09
Q2 09
Q3 09
Q4 09
Q1 10
Q2 10
Q3 10
Q4 10
Q1 11
Gross Profit per Ton @ FIFO
-
-$34.3
-$9.3
-$1.7
-$8.1
Quarterly
Impact
of
LIFO
to
FIFO
Adjustment
$5.2
$11.9
$22.3
$12.8
$13.3
$7.3
$14.7
$21.0
Q1 08
Q2 08
Q3 08
Q4 08
Q1 09
Q2 09
Q3 09
Q4 09
Q1 10
Q2 10
Q3 10
Q4 10
Q1 11
$2.3 |
 17
Drivers of Free Cash Flow
$195
million
2010
Adjusted
EBITDA
(1)
Meaningful
operating
leverage
–
$50
million
of
annualized
net
cost
reduction
since 2008
Favorable demand drivers are expected to drive strong volume growth
Attractive
Earnings
Power
Historical
annual
maintenance
capex
of
$16
-
$22
million
Low Level of
Maintenance
Capex
$36 million of cash at March 31, 2011
Net Debt-to-Cap ratio of 41.5% at March 31, 2011, with Net Debt to Adjusted
EBITDA of 1.7x
Refinanced
balance
sheet
February
2011
–
No
significant
debt
maturities
until
2015
Capital Structure
2011 full-year tax rate of approximately 9%
$282 million NOL balance as of December 31, 2010
Low Cash
Tax Rate
Reduced quantity of finished goods inventory by nearly 20% excluding isoprene
rubber build, since year end 2006, with minimal impact on service levels
Target working capital (excl. cash) at 25%-27% of revenue
Moderate
Working Capital
Needs
(1)
Adjusted EBITDA is GAAP EBITDA excluding sponsor fees, restructuring and related charges, non-cash
expenses, and the gain on extinguishment of debt |
 Expertise in market
and application development, high quality manufacturing, customer service offering, and core
end-use focus Provide
application-based
solutions
to
meet
customers’
needs
Commercialize
next
generation
of
innovations,
e.g.,
Nexar™
non-woven
and
industrial
fibers,
oilfield service applications, automotive soft skins, etc.
Margin enhancement by improving or eliminating marginally profitable products
Extract value for complexity
Continue to identify opportunities to contract with key customers
Proactively manage raw material price volatility
Evaluating options for additional HSBC capacity in Asia
Complete Polyisoprene rubber (IR) expansion at Belpre, Ohio and Isoprene rubber latex (IRL)
capacity expansion at Paulinia, Brazil
Evaluate options for future expansion of isoprene rubber latex capacity
Identify / pursue additional opportunities for cost reduction and productivity improvement
Execute on new IR manufacturing capacity at Belpre
Leverage
Leadership
Position
Drive Growth
Through
Innovation
Continue
Smart Pricing
Invest in
Growth and
Infrastructure
Continuous
Productivity
Improvement
Go-Forward Business Strategy
18 |
 Appendix
19 |
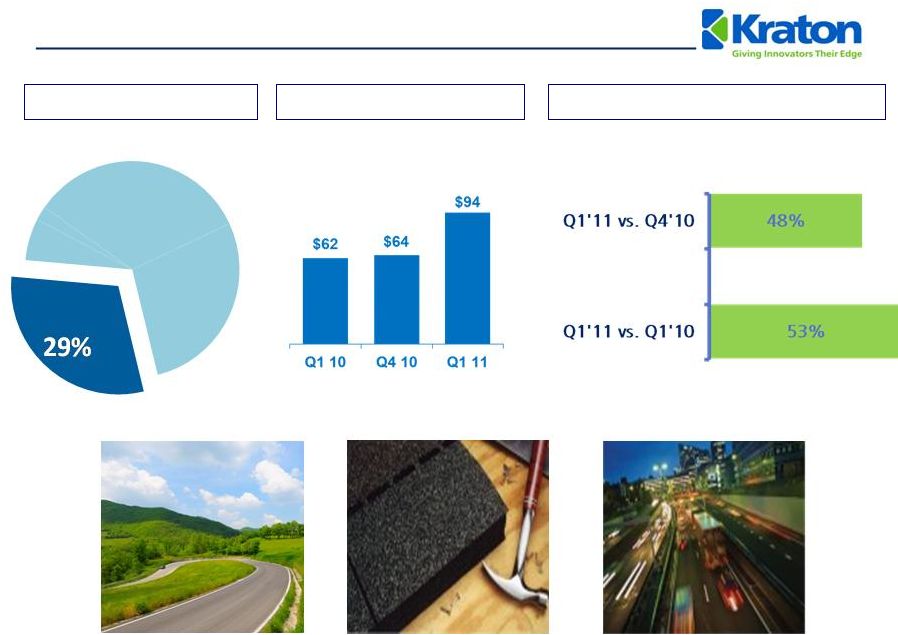
 Advanced Materials End
Use Review 20
TTM Revenue Profile
Change in Sales Revenue
End Use Revenue
Change in Sales Revenue
US $ in millions
AM |
 Adhesives, Sealants and
Coatings End Use Review TTM Revenue Profile
Change in Sales Revenue
21
End Use Revenue
US $ in millions
ASC |
 Paving and Roofing
End-Use Review 22
TTM Revenue Profile
Change in Sales Revenue
End Use Revenue
Change in Sales Revenue
US $ in millions
P&R |
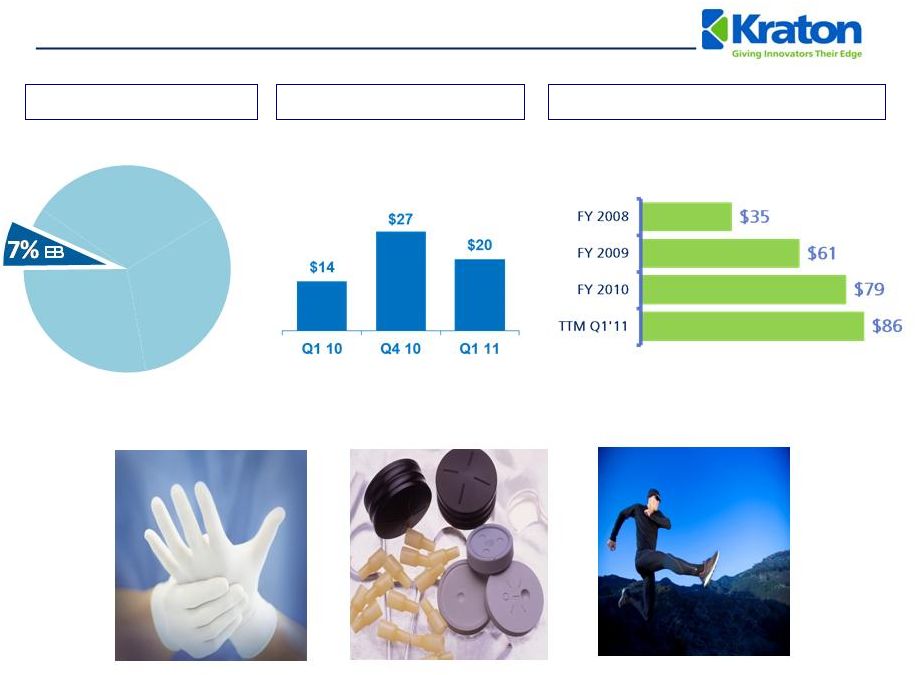 Emerging Businesses End
Use Review 23
TTM Revenue Profile
Sales Revenue
End Use Revenue
US $ in millions
US $ in millions |
 2010 Operating Revenue
and Adjusted EBITDA (1)
Walk
Operating Revenue
Adjusted EBITDA
US $ in millions
24
(1)
Adjusted EBITDA is GAAP EBITDA excluding management fees, restructuring and related charges,
non- cash expenses, and the gain on extinguishment of debt.
$968
$1,228
$167
$160
$(19)
$(48)
FY 2009
Volume
Price
FX
By-Product
FY 2010
$91
$195
$74
$160
$(111)
$(13)
$(6)
2009
Volume
Price
COGS
R&D/SG&A
FX/Other
2010 |
 Volume (kT)
Selected Financial Trends –
Q1 2011
(1)
Adjusted EBITDA is GAAP EBITDA excluding restructuring and related charges, non-cash
compensation expenses, and loss on the extinguishment of debt.
25
Revenue
(US $ in Millions)
Gross Profit and Gross Margin
(US $ in Millions)
$69
$59
$87
25.3%
20.6%
25.2%
0
20
40
60
80
100
120
Q1 10
Q4 10
Q1 11
$273
$288
$345
$0
$50
$100
$150
$200
$250
$300
$350
Q1 10
Q4 10
Q1 11
Adjusted EBITDA
(1)
(US $ in Millions)
$43
$34
$56
15.6%
11.9%
16.2%
0
10
20
30
40
50
60
70
80
Q1 10
Q4 10
Q1 11
Adjusted
EBITDA
Margin |
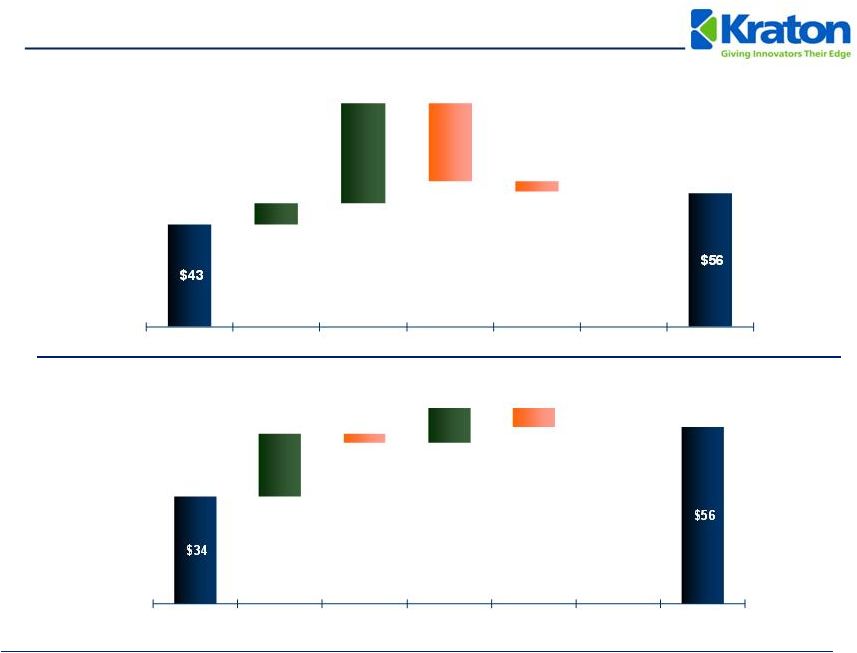 Q1 2011 Adjusted
EBITDA (1)
Walk
Q1 2011 vs. Q4 2010
Q1 2011 vs. Q1 2010
US $ in millions
(1)
Adjusted EBITDA is GAAP EBITDA excluding restructuring and related charges, non-cash
compensation expenses, and loss on the extinguishment of debt.
26
Q1 2010
Volume
Price
COGS
R&D/SG&A
FX/Other
Q1 2011
Q1 2011
Volume
Price
COGS
R&D/SG&A
FX/Other
Q1 2011
$9
$42
$(33)
$-
$(4)
$20
$(3)
$11
$-
$(6) |
 Selected 2011
Estimates Working capital (excluding cash) as a % of
revenue
25% to 27%
Capital spending
$80 to $85 million
Interest expense
(1)
~$31 million
Research & development
~$27 million
SG&A
~ $100 million
Depreciation and amortization
~$61 million
Book tax rate
~9%
27
(1)Includes accelerated write-off of deferred financing costs associated with the debt
refinancing of $5 million. |