Attached files
UNITED STATES
SECURITIES AND EXCHANGE COMMISSION
Washington, D.C. 20549
FORM 10-K
(Mark One)
|
x
|
Annual Report Pursuant to Section 13 or 15(d) of the Securities Exchange Act of 1934
|
For the fiscal year ended March 25, 2011.
OR
|
¨
|
Transition Report Pursuant to Section 13 or 15(d) of the Securities Exchange Act of 1934
|
For the transition period from ___________________ to ___________________.
Commission File Number 001-10255
NETWORK EQUIPMENT TECHNOLOGIES, INC.
(Exact name of registrant as specified in its charter)
|
Delaware
|
94-2904044
|
|
|
(State of incorporation)
|
(I.R.S. Employer Identification Number)
|
|
6900 Paseo Padre Parkway Fremont, CA
|
(510) 713-7300
|
94555-3660
|
|
(Address of principal executive offices)
|
(Telephone number)
|
(Zip code)
|
Securities registered pursuant to Section 12(b) of the Act:
|
Common Stock, $0.01 Par Value
(Title of each class)
|
The NASDAQ Stock Market LLC
(Name of each exchange on which registered)
|
Securities registered pursuant to Section 12(g) of the Act:
7 1/4% Convertible Subordinated Debentures
(Title of class)
3 3/4% Convertible Senior Notes
(Title of class)
Indicate by check mark if the registrant is a well-known seasoned issuer as defined in Rule 405 of the Securities Act. ¨ Yes x No
Indicate by check mark if the registrant is not required to file reports pursuant to Section 13 or Section 15(d) of the Act. ¨ Yes x No
Indicate by check mark whether the registrant (1) has filed all reports required to be filed by Section 13 or 15(d) of the Securities Exchange Act of 1934 during the preceding 12 months (or for such shorter period that the registrant was required to file such reports) and (2) has been subject to such filing requirements for the past 90 days. x Yes ¨ No
Indicate by check mark whether the registrant has submitted electronically and posted on its corporate Web site, if any, every Interactive Data File required to be submitted and posted pursuant to Rule 405 of Regulation S-T during the preceding 12 months (or for such shorter period that the registrant was required to submit and post such files). ¨ Yes ¨ No (Not applicable)
Indicate by check mark if disclosure of delinquent filers pursuant to Item 405 of Regulation S-K is not contained herein, and will not be contained, to the best of registrant’s knowledge, in definitive proxy or information statements incorporated by reference in Part III of this Form 10-K or any amendment to this Form 10-K. x
Indicate by check mark whether the registrant is a large accelerated filer, an accelerated filer, a non-accelerated filer or a smaller reporting company. See definitions of “large accelerated filer”, “accelerated filer” and “smaller reporting company” in Rule 12b-2 of the Exchange Act.
| Large accelerated filer ¨ | Accelerated filer x | Non-accelerated filer ¨ | Smaller reporting company ¨ |
Indicate by check mark whether the registrant is a shell company (as defined in Rule 12b-2 of the Exchange Act):¨ Yes x No
The aggregate market value of voting and non-voting common stock held by non-affiliates of the registrant (based on the closing price for the common stock on the NASDAQ Stock Market, LLC on September 24, 2010, which is the last business day of the registrant’s most recently completed second fiscal quarter) was approximately $51,550,000.
The number of shares outstanding of the registrant's Common Stock, par value $0.01, as of May 20, 2011 was 30,398,000.
DOCUMENTS INCORPORATED BY REFERENCE:
Portions of the registrant’s definitive Proxy Statement for the Annual Meeting of Stockholders to be held on or about August 9, 2011 are incorporated by reference in Part III of this Form 10-K to the extent stated herein.
NETWORK EQUIPMENT TECHNOLOGIES, INC.
|
PART I.
|
||||
|
Item 1.
|
1 | |||
|
Item 1A.
|
11 | |||
|
Item 1B.
|
19 | |||
|
Item 2.
|
19 | |||
|
Item 3.
|
19 | |||
|
PART II.
|
||||
|
Item 5.
|
20 | |||
|
Item 6.
|
22 | |||
|
Item 7.
|
22 | |||
|
Item 7A.
|
34 | |||
|
Item 8.
|
35 | |||
|
Item 9.
|
62 | |||
|
Item 9A.
|
62 | |||
|
Item 9B.
|
64 | |||
|
PART III.
|
||||
|
Item 10.
|
64 | |||
|
Item 11.
|
64 | |||
|
Item 12.
|
64 | |||
|
Item 13.
|
64 | |||
|
Item 14.
|
64 | |||
|
PART IV.
|
||||
|
Item 15.
|
65 | |||
| 67 | ||||
PART I
Forward-Looking Statements
Statements contained in this Form 10-K that are not historical facts are forward-looking statements within the meaning of the federal securities laws that relate to future events or our future financial performance. A forward-looking statement may contain words such as “plans,” “hopes,” “believes,” “estimates,” “will,” “continue to,” “expect to,” “anticipate that,” “to be,” or “can affect.” Forward-looking statements are based upon management expectations, forecasts and assumptions that involve risks and uncertainties that may cause actual results to differ materially from those expressed or implied in the forward-looking statements. Many factors may cause actual results to vary including, but not limited to, the factors discussed in this Form 10-K. We expressly disclaim any obligation or undertaking to revise or publicly release any updates or revisions to any forward-looking statement contained in this Form 10-K, except as required by law. Investors should carefully review the risk factors described in this Form 10-K along with other documents the Company files from time to time with the Securities and Exchange Commission (SEC).
ITEM 1. BUSINESS
Overview
Network Equipment Technologies, Inc. (NET), founded in 1983, develops and sells high performance networking equipment optimized for real-time communications. For more than a quarter of a century, NET has delivered solutions for multi-service networks requiring high degrees of versatility, security and performance. Today, the company is focused on providing secure real-time communications for unified communications (UC), session-initiation protocol (SIP) trunking, enterprise mobility, and IP-based multi-service networking. In 2007, in order to enhance our lineup of voice over IP (VoIP) offerings, we acquired Quintum Technologies and its Tenor product line.
Our enterprise customer base includes large enterprises adopting UC and small- to mid-sized businesses (SMBs) implementing real-time communications. Our government customers include a variety of federal and international agencies and organizations, including civilian and defense agencies and resellers to such entities. In addition to our direct sales capabilities, we have developed relationships with integrators, resellers, and vendors of related technologies in order to help drive our enterprise business. Our global support and service organization, along with third-party service organizations, provides installation and other professional services, a variety of maintenance programs, technical assistance, and customer training.
Today, our solutions are focused on enabling our enterprise and government customers to cost-effectively migrate to next-generation IP networks utilizing real-time communications, including unified communications platforms, cloud-based voice, secure voice applications, and high-speed multiservice wide area networking (WAN) transport networks. Our newest product offering, the UX Series, was purpose-built for the unified communications and enterprise “session border controller” (SBC) markets to enable adoption of new communication technologies and services. Our voice solutions include the VX Series and the Tenor product lines of switching media gateways. Our legacy multi-service solutions include the Promina platform and the NX Series high speed multi-service network exchange platform.
The UX Series is an enhanced gateway with an embedded server that acts a survivable branch appliance (SBA), which is a key component for remote-site survivability. The UX Series interoperates with our VX Series and Tenor products and was specifically designed to support upstream deployments with advanced features that give customers high levels of flexibility, scalability, quality of experience, and investment protection through interoperability. The VX Series and Tenor product lines provide enterprise customers with voice interoperability solutions that enable existing private branch exchange (PBX) and IP-PBX systems to work together with new UC platforms and IP-based service provider networks offering SIP trunking services. The VX Series also provides IP-based solutions to government agencies requiring high bandwidth efficiency and call performance for secure voice communications. The Tenor product line also provides traditional VoIP switching gateway solutions for SMBs and smaller branch offices within large enterprises.
Our legacy multi-service solutions include the Promina, NX1000 and NX5010 platforms. The Promina product line has been serving government agencies and large enterprises for many years, providing industry-leading network reliability and security. The NX Series products are high-performance networking platforms that provide high-grade data transfer and enable secure grid computing. Our NX1000 platform provides an extensive, compact, wide-area network (WAN) switching solution that enables applications to integrate and aggregate into IP-based networks. The NX5010 platform enables high-speed, secure interconnection and extension of geographically distributed grid computing clusters and SANs.
Our consolidated financial information for the last three fiscal years is set forth under Item 8 – Financial Statements and Supplementary Data. We use consolidated financial information in determining how to allocate resources and assess performance. For this reason, we have determined that we are engaged in a single reportable segment.
Industry Background
Telecommunications networks have evolved rapidly over the past few decades. Initially, there was a shift away from public networks and application-specific networks to integrated private networks. Circuit-switching technologies, such as time-division multiplexing (TDM), were used to achieve cost savings while maintaining high reliability. Later, higher bandwidths were achieved using switched digital services such as Integrated Services Digital Network (ISDN) and frame relay. Demand grew for equipment to support multiple technologies, application types, and services on a single communications platform, leading to the development of multi-service platforms. Today, the rapid expansion in use of the Internet and the growth of data services as an increasing portion of telecommunications traffic has resulted in tremendous demand for broadband solutions using cell or packet switching, as contrasted with narrowband circuit-switched approaches.
Despite significant advances in packet-switching technology, circuit-switched networks continue to offer certain advantages for networks requiring the most secure and reliably deterministic communications. There is still currently a small market for circuit-switched products, particularly in environments with low bandwidth requirements, though due to inherent bandwidth limitations use of circuit-switched networking has been declining for a number of years.
With the advent of IP-based technologies, traditionally separate voice and data environments have converged. VoIP offers both cost savings and added functionality, and its use by consumers, enterprises, telecommunication service providers and others has grown significantly in recent years. This growth has been aided by technological advances that have improved the quality and reliability of VoIP connections to rival that of traditional telephone circuit service. Recent innovations also allow IP-based connections to include services not available on traditional voice-only networks, such as instant messaging (IM) and video conferencing. Encryption and other security enhancements can now mitigate the risks of using open packet-routed networks.
The adoption of new technologies has led to a proliferation of communications equipment and devices such as PBXs, mobile phones, and desktop-PC clients, along with a multitude of communications tools such as e-mail, voicemail, calendaring, as well as IM and conferencing, which are increasingly combined as unified communications. Enterprises face significant challenges to enable their workforces to efficiently manage their communications. To address this complexity, a number of large companies including Microsoft, HP and IBM have developed strategies and platforms aimed at integrating these various forms of communication.
Enterprise businesses adopting these new communications technologies face various challenges in the migration of their existing telephony technologies without disrupting existing operations. In performing the migration, they must address not only internal connections but also the myriad forms of contact with customers and other external business partners. Any solution must be able to access the hardware of existing telephony networks as well as new wired and wireless IP telephony services and devices. For unified communications to work effectively, the communication connectivity must be device-, application-, and network-independent. In addition, businesses will typically require capabilities for remote office support and survivability, security, high call-processing performance, and the ability to handle special routing and administration needs.
Business Strategy
Our strategy is to provide customers with intelligent, multi-service network and VoIP platforms for the secure session mediation of voice, video, and data traffic that are designed to:
|
|
·
|
enable unified communications;
|
|
|
·
|
support intelligent connectivity of new and legacy communications equipment;
|
|
|
·
|
support a broad array of communication protocols and new communications technologies, including SIP trunking and session border control;
|
|
|
·
|
extend the viability of legacy communications systems and facilitate network evolution;
|
|
|
·
|
reduce the risks associated with introducing new network technologies into customers’ operations.
|
The following are key elements of our strategy:
Align with partner-driven UC strategies. We are focused on expanding our network of global partners with the scale and expertise to address UC market opportunities. Microsoft, IBM, HP and other large hardware and software vendors are pursuing strategies and products for the UC market. As a technology enabler of their strategies, we have worked and will continue to work closely with these companies. Microsoft has been a customer of ours for several years. This relationship has helped us to align our product development and resources to support Microsoft’s unified communications strategy and, as a result, we believe we are positioned to partner with other Microsoft solution providers. Through alliances with well-respected systems integrators and resellers, we are establishing channels for our products into the enterprise and government markets.
Leverage our incumbent position in the government market. We were a pioneer of the concept of multi-service networking and have been delivering these mission-critical capabilities for more than 25 years. The installed base and revenue contribution from our Promina product line, sold primarily to government entities in recent years, are declining, but Promina continues to generate a significant portion of our revenue. We intend to leverage our installed customer base, particularly government entities, for future sales of our new platforms, enabling the transition to VoIP while continuing to support legacy traffic and applications.
Design and develop industry leading communications equipment. We consider technological and product leadership to be critical to our future success. We have broad experience with mixed-service and multi-protocol networks, enabling us to develop solutions for a wide range of applications. We have extensively refined the features and technologies of our more mature products over their long product lifecycles. We strive to leverage this technological background to develop new products and additional functionality for existing products to meet our customers’ escalating requirements, specifically for VoIP conversion and secure voice applications. We believe that our newer products are helping accelerate the communications industry's rapid transition to software.
Leverage relationships with distribution partners and key technology providers. In addition to direct sales to large enterprise and government customers, we are expanding our relationships with resellers, distributors, and other vendors. We enter agreements with technology suppliers to supplement our internal development efforts and may enter agreements with original equipment manufacturers for penetration into specific markets. We also seek relationships with systems integrators, software solutions providers, and large incumbent vendors globally that can facilitate success in global enterprise networks, expansion of our sales channel, and participation in major government projects.
Provide value-added service and system integration capabilities. Since our inception, we have viewed customer service and support as a key element of our overall strategy and a critical component for our long-term relationship with customers. Customers around the world turn to us not only for the reliability and performance of our products but also for our comprehensive support services that optimize the value of those products.
Products
Voice and Mobility Products
Our voice and mobility platforms include our VX Series switches, our Tenor gateways, our SmartSIP software, and our UX Series mediation platform.
The VX Series – our voice exchange platform:
The VX Series enables high-performance, secure VoIP communications. The VX Series is a fully-integrated multi-service voice switch, which can be deployed to integrate unified communications, SIP Trunking services, VoIP and VoIP-based systems into legacy voice network infrastructures. With its remote survivability features, the VX Series provides continuous, local call service and intelligent trunk routing in the event of network connectivity failures. It can also be integrated into existing mission critical networks as well as deployed as the primary solution in greenfield applications.
The VX Series product line consists of the VX1800, VX1200, VX900, VX900T, and the VX400. The VX platform supports from 1 to 32 T1 or E1 ports, 6 Ethernet ports (2 Gig-Ethernet ports on VX1800), making it a compelling solution for enterprises, government entities and service providers looking to deploy IP-based voice networks. The VX Series combines the functionality of a Session Border Controller (SBC), media gateway, call control component, SS7/C7 signaling point, and H.323/SIP inter-working device in a single compact chassis. The VX Series supports a wide range of voice and call routing features. All of these are backed by key components that ensure the platform and the calls moving across it are secure. Conformance to the latest VoIP signaling and call control standards, such as SIP and H.323, guarantees interoperability within multivendor VoIP deployments. The VX Series provides scalable, high-performance IPSEC, SRTP & TLS encryption for VoIP communications.
To address the needs of the U.S. federal government, the VX Series provides a VoIP-based secure voice solution with high bandwidth efficiency and call performance. A high bandwidth utilization rate is particularly important in expensive, limited bandwidth situations such as satellite links. The VX Series also enables the use of secure calls on IP networks and end-to-end tactical-to-fixed site connectivity. Key features that enable high-quality secure voice calls include data compression, forward error correction, echo cancellation and jitter correction – all critical factors when operating in tactical, high-latency or unpredictable network environments. For tactical deployment, the VX Series is available in form factors small enough to fit into a backpack.
The VX Series (VX900, VX1200 and VX1800) is a JITC-certified Deployed Network Element (D-NE) and provides advanced MLPP, SCIP relay, and security features that are in line with the new AS-SIP UCR definition. Additionally, the VX Series offers a robust implementation of V.150 Universal Modem Relay that communicates between newly deployed secure IP phones and secure analog communications devices. The VX Series has been proven by use in DoD, NATO, and first responder deployments. The VX Series product line has been selected by the federal government to enable next-generation voice features and to continue to capitalize on existing voice assets while assuring the strict security and reliability standards required in DoD voice systems.
The VX Series switches have been qualified under the Microsoft Unified Communications Open Interoperability Program for Microsoft Exchange Unified Messaging, Microsoft Office Communications Server 2007, and Microsoft Office Communications Server 2007 Release 2, and Microsoft Lync Server 2010. The VX Series is also interoperable with Broadsoft Broadworks R16.SP1, which enables service providers to offer scalable SBC and media gateway solutions for enterprises seeking carrier hosted VoIP cloud services.
The VXe software release offers enhanced value to enterprise voice customers by reducing the network infrastructure footprint and lowering the operational and capital costs for UC deployments. This solution is suited to large enterprises with multi-site locations such as banks, retail stores, and professional services firms that typically have multi-site requirements.
In fiscal 2011, 2010, and 2009, our VX Series and predecessor products accounted for 35.3%, 22.3% and 19.8% of product revenue, respectively.
Tenor product line – our multipath VoIP gateways:
The Tenor product line provides basic gateway support for Microsoft's unified communications (UC) platforms. The Tenor gateways have been qualified under the Microsoft Unified Communications Open Interoperability Program for Microsoft Exchange Unified Messaging, Microsoft Office Communications Server 2007 and Microsoft Office Communications Server 2007 Release 2. In addition, for Microsoft Lync small, medium and large enterprise deployments, the Tenor AF & AX Series products are used as Lync analog station gateways to provide Lync connectivity to analog endpoints. Tenor products support applications of other major VoIP system and services vendors including Nortel, Avaya, NEC Sphere, Skype (Tenor products are Skype Connect certified), and others.
Having similar architecture to the VX Series products, Tenor products support general business VoIP applications where there is no need for premium VX Series product features such as high speed signaling and media security, extreme call processing speed, programmable call processing, integrated SBC functions, or Microsoft Active Directory-based integration and call routing. Like the VX Series, Tenor products support any-to-any multipath switching, provide branch office survivability, and are designed to simplify deploying VoIP applications into existing legacy voice networks. The Tenor product line also has a broad set of interfaces and configurations that allow them to be integrated into nearly any type of existing voice network, supporting as few as two analog ports and as many as 32 T1/E1 trunks or 960 VoIP calls.
The Tenor AF and AX Series VoIP gateways offer enterprises using analog ports an easy, cost-effective way to capitalize on the power of VoIP. These highly adaptable solutions work with traditional PBXs, legacy analog equipment, IP PBXs and IP phones, and SIP-based communications environments. For enterprises using ISDN lines, the Tenor BX integrates VoIP gateway functionality with unique intelligent call routing, multipath architecture, and QoS support all in one solution. Enterprises can benefit from a variety of valuable applications such as PBX extension, remote office connectivity, long distance consolidation and call centers. With the Tenor DX VoIP gateways, enterprises and service providers can also deploy numerous VoIP applications such as SIP trunking, wholesale VoIP termination, calling cards, tandem switching and least cost routing. The Tenor DX product scales from a fractional T1/E1, with 8 simultaneous VoIP channels up to a full 8 span multipath switch supporting 120 simultaneous VoIP calls.
In fiscal 2011, 2010, and 2009, Tenor products accounted for 18.6%, 16.6% and 23.5% of product revenue, respectively.
SmartSIP software – SIP for OCS:
Our SmartSIP application will support the new direction of collaboration in the workplace where real-time, integrated communications are driving increased productivity throughout the enterprise. SmartSIP allows wireless, DECT, and standard SIP phones to be provisioned and used as extensions in a Microsoft Lync Server 2010 deployment. The SmartSIP application is built using Microsoft Unified Communications Managed API (UCMA) to address the interoperability of Wireless, DECT and legacy SIP endpoints with Microsoft unified communications. SmartSIP reduces operating expenses by automatically provisioning the endpoints.
We acquired the SmartSIP software and customer base from Evangelyze Communications late in fiscal 2010. We expect general availability of the SmartSIP product in fiscal 2012.
UX Series - our new high performance mediation platform:
Last September, we introduced our next generation, high-performance mediation platform, with the general availability of the first product in the series, our UX2000, for unified communications and enterprise border controller markets. The UX2000 is a modular rack unit system that was purpose-built for unified communications, enterprise SBC, and multi-service business gateway applications. The UX2000 is equipped with up to six high performance DSPs and two telecom card slots with a choice of 2, 4, or 8 port DS1 cards, offering the industry’s best mediation processing for IP-to-TDM, IP-to-IP, or TDM-to-TDM solutions. An optional server-class application solutions module (ASM) with a high-performance processor can also be added for third-party application support. The UX2000 core features a 24Gbps, non-blocking, IP-core backplane capable of routing more than 35 million packets per second.
The UX2000 is architected to meet the demands of any size branch office and can scale to up to 1000 users. Its design flexibility provides unique capabilities for an invest-as-you-grow model and allows for future growth both in terms of the number of users supported as well as in the number of applications deployed. The modular architecture is designed to support scaling up of digital signal processing capacity and Time Division Multiplexing (TDM) interconnections providing deployment flexibility. Enterprises can now deploy a single device for all networking and communication needs and save both capital and operational expenses. In contrast to media gateways, which can have severely degraded call capacities during high complexity media processing operations, the UX2000 can support up to 600 simultaneous transcoded and encrypted calls. By supporting a variety of protocols, advanced security, and codec transcoding, the UX2000 enables a distributed enterprise to cost-effectively implement unified communications across the enterprise.
The initial software release for the UX2000 offers powerful quality of experience features, industry leading voice quality, intelligent call routing, call forking, and comprehensive PBX interoperability. As with the VX Series, directory-based call routing is built directly into the UX Series platform. The UX2000 is fully managed using a Web-based management interface with remote management capability, providing a solution for remote sites/branch offices that have minimal IT support. The UX2000 is qualified for Microsoft Lync Server 2010 as an Enhanced gateway and acts as a Survivable Branch Appliance – a key component of the Microsoft Lync Server topology. The UX2000 connects Microsoft Lync Server 2010 to SIP Trunking service providers as well as to legacy PBX and IP-PBX equipment. In the event WAN network failure occurs, the UX2000 provides survivability through the PSTN. The Survivable Branch Appliance application on the UX2000 ensures that local unified communication services are available so that the branch office continues to operate even when the IP network to the headquarters/datacenter is unavailable.
When deployed as a SBC, the UX2000 provides defense against malicious attacks in addition to providing transcoding, service assurance, data routing, WAN access, and survivability.
Multi-service Networking Products
Our multi-service networking platforms include Promina and the NX Series network exchange platforms.
Promina – our established multi-service access platform:
Our Promina family of multi-service access products integrates voice, data, image and video traffic across a single network infrastructure. The Promina platform, tailored to circuit-switched networks, provides mission-critical support for a wide variety of communications applications and traffic types, including ATM, frame relay, IP, and ISDN signaling. Promina products offer a broad range of user-side interfaces, enabling standards-based connection of communications equipment, whether located at a service provider’s switching facility or at an enterprise or government customer’s premises.
The Promina platform features advanced network management services, which provide a high degree of visibility into network operations. For fault tolerance and high network reliability, our Promina products can be configured with redundant power, common logic, and trunk interfaces. These products incorporate distributed network intelligence that allows the network to quickly and automatically reroute traffic in the event of failure of a component.
The Promina product family includes a range of systems for various node sizes, with various processor, application, and interface modules. We offer a broadband aggregation mechanism for Promina customers with the Promina Broadband Shelf, providing government customers with a broad range of ATM and IP technology. Our Promina networks are monitored and controlled by netMS, an integrated network management solution. We also offer an IP trunk interface for Promina, enabling direct IP connections to the Promina platform.
In fiscal 2011, 2010, and 2009, our Promina products, including the Promina Broadband Shelf, accounted for 33.8%, 38.6% and 44.9% of product revenue, respectively.
The NX1000 Series – our IP-enabled multi-service platform:
The NX1000, an extension of our Promina product line, provides a flexible, cost-effective IP aggregation solution that facilitates migration of legacy traffic to IP. It is fully interoperable with the existing Promina product line, delivering an all-new architecture and built-in capability to converge legacy applications onto an IP-based network while also providing four times the bandwidth of similarly sized Promina models. The NX1000 adds multi-service aggregation capabilities to the NX Series’ product line-up and is housed in a field-deployable, compact and lightweight chassis. It fits well into tactical and first-responder applications as well as supporting applications for high speed serial or legacy migration to IP, IP-based satellite transport, and tactical to fixed-site connectivity. The NX1000 also offers higher speed data interfaces, diskless data storage, and an optional rubidium atomic clock module to provide a high level of accuracy and synchronization for bit synchronous applications over IP.
The NX5000 Series – our high speed multi-service network exchange platform:
The NX5000 Series products are high-performance networking platforms that provide high-grade data transfer between SANs and WANs and secure grid computing. Responding to increasing demand for secure, high speed, multi-service networking and LAN/SAN virtualization, NET partnered with Bay Microsystems, Inc. to develop an agile, high-speed exchange platform. This platform, the NX5000 Series, has speeds of 10 Gbps and the product architecture is scalable to much higher speeds. The first product in our NX5000 Series, the NX5010 platform, is a next-generation, high speed multi-service aggregation and switching platform for mission-critical communications. This platform enables customers with geographically distributed computing and storage resources to connect as if they were co-located within the same LAN or data center and makes it possible to collapse into a single integrated system the multiple switches currently required to perform SAN to WAN communications. The NX5010 significantly improves our customers’ ability to transfer large amounts of data throughout disparate networks on a single switch. Initially targeted at government and financial customers, the NX5010 also addresses our customers’ increasing need for secure, high speed, versatile networking. It is scalable and compact, with a very small footprint only two rack units high. The NX5010 has been tested in customer field trials using a variety of protocols, including InfiniBand, IP, Ethernet, and multiprotocol label switching.
In fiscal 2011, 2010 and 2009, NX Series product sales accounted for 8.6%, 21.9% and 11.4% of product revenue, respectively.
Customers and Markets
NET is focused on the UC and secure communication markets, providing sophisticated network communications solutions to enterprises and government organizations worldwide. We pioneered multi-service networking and have been delivering this capability for more than 25 years. Our expertise is supporting the most demanding communications applications such as those that require high security, field reliability, high bandwidth or advanced features. Our customers are information and communication-intensive organizations, who may be local, national, or global in their operations. We identify our markets as two primary groups: government and enterprises. Our government customers include a variety of federal and international agencies and organizations, including civilian and defense agencies and resellers to such entities. Our enterprise customer base includes large enterprises adopting unified communications and small- to mid-sized businesses implementing new VOIP technologies. We target enterprise customers in a variety of sectors such as financial services, manufacturing, transportation, and retail. In recent fiscal years, commercial sales of our Promina-based solutions have mostly been sales in emerging markets such as Eastern Europe or upgrades to our installed base in Western Europe.
Sales to the government sector represented 71.1%, 78.6% and 72.8% of NET’s revenue in fiscal 2011, 2010, and 2009, respectively. We do business with the government sector both as a direct contractor and as a subcontractor. A substantial portion of the revenue generated from our government customers is based on our contract with the General Services Administration (GSA), as well as through direct contracts such as with the Department of Defense and NATO. A new U.S. General Services Administration Schedule contract was issued to our NET Federal subsidiary in July 2010, providing an ongoing contracting vehicle for sales to the U.S. government. Some of these contracts may also be used by other government agencies.
In fiscal 2011 and fiscal 2009, no single customer accounted for more than 10% of the Company’s revenue. In fiscal 2010, General Dynamics Corporation accounted for 22.7% of the Company’s revenue. Excluding aggregate orders from a variety of government agencies, no other single customer accounted for more than 10% of the Company’s revenue in fiscal 2011, 2010, or 2009.
Our commercial revenue from international customers accounted for 17.8%, 13.8% and 9.8% of total revenue for fiscal years 2011, 2010, and 2009, respectively. Going forward, we believe our revenue growth in the enterprise markets will largely be driven by the acceptance of UC and other enterprise secure voice applications. As an incumbent supplier into Microsoft’s internal voice network, we are working closely with Microsoft and its key partners as they introduce new enterprise-focused unified communications and unified messaging products, of which our UX Series is a key enabler.
Competition
The market for telecommunications equipment is highly competitive and dynamic, has been characterized by rapid changes to and the convergence of technologies, and has seen a worldwide migration from existing circuit technology to packet-based IP technologies. We compete directly, both internationally and domestically, with many different companies, some of which are large established suppliers of end-to-end solutions such as Alcatel-Lucent, Avaya, Cisco Systems, Juniper Networks and Siemens. In addition to these large suppliers, a number of other companies are targeting the same markets as we do. Particularly, Audiocodes Limited and Dialogic Corporation provide competitive solutions in the UC market, and Acme Packet provides competitive solutions in the SBC market. We believe our long operating history gives us some of the advantages of larger businesses, while our small size and targeted focus give us some of the advantages of smaller companies. Our larger competitors, however, have greater overall financial, marketing and technical resources than we do and offer a wider range of networking products than we offer and can often provide customers a complete network solution. They often can compete favorably on price because their sales volume and broad product lines can allow them to make discounted sales while maintaining acceptable overall profit margins. Conversely, our smaller competitors may have more ability than we do to focus their resources on a particular product development unencumbered by the requirements to support an existing product line, allowing greater flexibility in their market strategies.
Sales
We sell our products and services through both direct and indirect sales channels worldwide, including large government systems integrators. We support the sales force effort with systems engineers who provide customers with pre-sale technical assistance which allows us to gain more in-depth knowledge of customers’ network requirements. Our business is generally not seasonal, though we have been affected by delays in adoption of government entity budgets and spending patterns of the federal government at its September fiscal year end.
Our international sales, other than those made to foreign ministries of defense, are made through indirect channels that are augmented by the efforts of a local sales force. In addition to the marketing and sale of products, international resellers provide system installation and technical support. International resellers have non-exclusive agreements to resell NET products within particular geographic areas. Resale agreements do not contain a sales commitment or required sales quota.
Backlog
We manufacture our products based upon our forecast of customer demand, and we often build products in advance of receiving firm orders from our customers. Backlog is generated upon receipt of a valid customer purchase order. Orders for NET’s products are generally placed by customers on an as-needed basis, and we typically have been able to ship these products within 30 to 90 days after the customer submits a firm purchase order. As a U.S.-based company, we are required to give priority to federal government rated “defense-expedite” orders, which may cause the backlog of other customers’ orders to become delinquent. Because of the possibility of customer changes in delivery schedules or cancellation of orders, NET’s backlog as of any particular date may not be indicative of sales in any future period.
Customer Service
The markets, customers and complex challenges of the networking industry described above require support, service and other assistance in the development, operation and expansion of a customer network. We provide a wide range of global service and support options to customers and resellers of our products. Service offerings include product installation and other professional services, a choice of different hardware and software maintenance programs designed to meet the varying needs of our customers, parts repair, remote and on-site technical assistance, and customer training. In addition, NET provides web-based services to assist the self-directed efforts of more technically capable customers and partners.
Our Technical Assistance Center (TAC), which is staffed by engineers trained in networking products, is set up to assist customers remotely over the telephone. TAC engineers have the ability to replicate customer problems and test proposed solutions prior to implementation. Maintenance support from TAC, whether provided over the web or over the telephone, is fee-based under either an annual fee contract or on a time-and-materials basis. TAC costs are charged to either sales and marketing expense or to cost of service and other revenue, based upon the nature of TAC services provided.
Customer training on our products is provided to both end-users and resellers worldwide. We provide training both at NET facilities and at customer and reseller sites. Our training services can be customized to meet the special requirements of our customers. Customers are charged per person per class for training. We also offer a portfolio of computer-based training sessions for our products, which are licensed on an individual or site basis.
Through a contractual arrangement with our company, CACI International Inc. had certain rights to provide maintenance and other services to our federal government customers, until the expiration of the arrangement on December 1, 2010. Under this arrangement, both companies sold services for NET products, other than the Tenor products, and each company was responsible for various aspects of service delivery. Revenue from maintenance services was shared between both companies, regardless of which company sold the services. Since the expiration of this arrangement, the Company has performed these services itself and has retained all revenue associated with these services.
Our Tenor product line is in large part sold through distributors, who generally perform service and support to the end customers.
In fiscal 2011, 2010, and 2009, service and support revenue accounted for 23.7%, 22.0% and 22.2%, respectively, of NET’s revenue.
Manufacturing
We outsource our product manufacturing. For the Promina, NX Series and VX Series, we outsource our manufacturing, including assembly and structural test, to our primary contract manufacturer, Plexus Corp. (Plexus). For the new UX Series, we outsource our manufacturing to CTS Corporation (CTS). Both Plexus and CTS are located in the U.S. For the Tenor product line, some manufacturing is performed by contract manufacturers in Asia and we perform final assembly and test at our own facilities in the U.S., China and Hong Kong. Each of our contract manufacturers is the sole vendor with whom we have contracted for the assemblies and finished goods they manufacture for us.
Under our agreement with Plexus, which runs through December 31, 2011, we maintain a level of control over parts procurement, design, documentation, and selection of approved suppliers. We are generally liable for any termination or cancellation of product orders, as well as excess and obsolete material, which can result, for example, from an engineering change, product obsolescence, or inaccurate component forecasting. Under the agreement, Plexus is to procure raw materials and begin manufacturing of products in accordance with our forecasts. If certain purchased raw materials or certain work-in-process items are held for greater than 90 days, we must make deposits on the aging inventory, although Plexus must make efforts to minimize our liability for the aging inventory, including returning materials to suppliers, canceling orders with suppliers, or using materials to manufacture product for its other customers. If raw material or in-process inventories are still unused and have been held for more than nine months, we must pay a management fee for Plexus to retain such inventory. If there is no forecasted demand for all or any portion of such inventory in the forward-looking one year time period, then we must instead take ownership of, and pay for, that portion of the aged inventory without any demand. This activity may increase our owned inventories.
At March 25, 2011, our deposit on inventory held by Plexus was $4.2 million, of which $1.3 million had been charged to a reserve for excess inventory. The deposit, including the related reserve, is included in prepaid expenses and other assets in the consolidated balance sheets.
The Company regularly evaluates its inventory for lower of cost or market valuation, including inventory held by Plexus and the amount on deposit with Plexus as well as inventory classified as non-current assets. As a result of these evaluations, we recorded charges of $550,000, $1.9 million and $5.2 million to cost of revenue in fiscal 2011, 2010 and 2009, respectively.
Several key components of our products are available only from a single source, including certain integrated circuits and power supplies. Depending upon the component, there may or may not be alternative sources or substitutes. Some of these components are purchased through purchase orders without an underlying long-term supply contract. Any delay or difficulty in obtaining needed components could seriously impact our ability to ship products.
We attempt to maintain sufficient inventory to ship products quickly, normally within 30 to 90 days after receipt of an order. Scheduling of production and inventory supply is based on internal sales forecasts. Generally, our customer contracts allow the customers to reschedule delivery dates or cancel orders within certain time frames before shipment without penalty and outside those time frames with a penalty. Because of these and other factors, there are risks that excess or inadequate inventory levels could occur.
We are focused on continually enhancing the quality of products and services delivered to customers worldwide. This includes improving the quality of supplied components, subassemblies and internal processes. As part of this continuing process, NET is ISO 9001:2008 registered.
Research and Development
We believe that our long-term success depends on our ability to maintain product and technology leadership. The networking equipment industry is characterized by rapid technological change, evolving industry standards, frequent new product introductions, enhancements to products currently in the market and constantly changing customer requirements. To compete effectively, NET must be able to bring new products to market in a timely and cost-effective manner and provide existing customers an attractive migration path to our newer products. Along with making continued investments in our internal research and development, we also enter into development agreements with other technology suppliers and may make strategic acquisitions to obtain needed technology and resources.
We continually monitor relevant markets and our customers’ businesses and technology developments in order to develop products that proactively address customer needs. The majority of our research and development activity is focused on packet-based technologies, particularly VoIP and high-speed networking.
While most product development activity is undertaken by NET employees, we enter into license and technology agreements to accelerate development of new products or expand the scope of development efforts, as well as outsource some of our product development activities.
In fiscal 2011, 2010, and 2009, NET’s research and development expenditures were $19.2 million, $19.2 million and $21.8 million, respectively.
Working Capital Practices
Information about our working capital practices is included in Item 7 — “Management’s Discussion and Analysis of Financial Condition and Results of Operations” under the heading “Liquidity and Capital Resources” and is incorporated herein by reference.
Employees
As of March 25, 2011, we had 234 employees. None of our employees are represented by a labor union. We consider our employee relations to be good.
Geographic Information
See Note 14 to our consolidated financial statements.
Intellectual Property
We believe that the development of our intellectual property portfolio is central to our success and ability to compete effectively. We devote considerable resources to invent and develop new technologies and then to protect these technologies from unauthorized use. We have a program to seek protection of our proprietary technology under various protection frameworks such as patent, trade secret, trademarks and copyright protection. We seek protection in the United States and in select foreign countries where we believe filing for such protection is appropriate. We believe that ownership of patents, trade secrets, trademarks and copyrights is central to our ability to defend ourselves against intellectual property infringement allegations. We also seek to protect our inventions, trade secrets and other confidential information by non-disclosure policies. All of our employees and contractors sign confidentiality and invention disclosure agreements. Any person outside NET receiving NET confidential information either signs a non-disclosure agreement prior to receiving proprietary technology information, is a licensee of NET, or is bound by a professional duty of confidentiality.
Over the past twenty years, a number of patents have been issued to NET in the United States, Europe and Japan. In fiscal 2011, we were granted eight U.S. patents, and now hold a total of 74 U.S. patents. These patents will expire between June 2011 and September 2027. We expect to continue filing patent applications as we develop new products and technologies. We have not historically pursued claims against other companies based on possible infringements of our patent portfolio, but we believe that our investment in intellectual property protection can offer defenses to claims against us and may provide an additional source of future revenue.
For each of our product lines, we license some of our technology from third parties. Some of these licenses contain limitations on distribution of the licensed technology, are limited in duration, require royalty payments, or provide for expiration upon certain events such as a change in control of the company. The platform for our NX5000 Series product line was developed in partnership with a third party and includes key components manufactured by the third party. We paid a license acquisition fee for the technology and also pay a royalty on units sold pursuant to a license agreement with the third party. We are currently funding additional development of the platform under an amendment to the license agreement.
Executive Officers
The executive officers of NET and their ages at May 20, 2011 are as follows:
| Name | Age | Position |
| C. Nicholas Keating, Jr. | 69 | President, Chief Executive Officer and Director |
| Karen C. Carte | 46 | Vice President and Chief Accounting Officer |
| James T. Fitzpatrick | 57 | Vice President of NET and President of NET Federal |
| Talbot A. Harty | 47 | Vice President and Chief Development Officer |
| Francois P. Le | 57 | Vice President, Global Sales |
| Pete Patel | 58 | Vice President, Global Operations |
| Frank Slattery | 50 | Vice President and General Counsel |
| David Wagenseller | 54 | Vice President and Chief Financial Officer |
C. Nicolas Keating, Jr. has served as NET’s President and CEO since July 2005 and as a Director of the Company since November 2001. From October 2000 to February 2004, Mr. Keating was President and CEO of IP Infusion, a software developer and licensor of advanced networking software for enhanced IP services. Previously, he was President and CEO of US SEARCH.com, a Web-based provider of on-line information services to individual, corporate and professional users. From 1993 to 1998, he was an advisor to a number of worldwide organizations, including AT&T and Lucent Technologies. From 1987 to 1993, he was a Vice President and corporate officer of NET. Mr. Keating is a member of the Board of Trustees of the Asian Art Museum Foundation of San Francisco and is a San Francisco City Commissioner. He is also on the Board of Trustees of American University in Washington, D.C. Mr. Keating received his BA and MA from American University and was a Fulbright Scholar to Mexico. Prior to his business career, Mr. Keating worked in the State and Commerce Departments in international positions and served as a First Lieutenant in the United States Army.
Karen C. Carte joined NET in August 2010 and was named Vice President and Chief Accounting Officer in October 2010. For the seven years prior to joining the Company, she was an independent consultant providing high-level financial management and advisory services, with a focus on start-up ventures. Previously, she held executive positions in finance at Intella Interventional Systems and Alpine Microsystems. Prior to that, she was an accountant at Ernst & Young LLP. Ms. Carte holds a bachelor’s degree in business administration from the University of San Diego, and is a CPA.
James T. Fitzpatrick joined NET in April 2009. Prior to joining the Company, he was Vice President of Federal Sales for Ericsson Federal (formerly Marconi Federal). At Marconi Federal, he oversaw channel sales and partner programs and was in charge of business development. Mr. Fitzpatrick previously held senior management positions at NCR and AT&T, in the areas of sales, marketing, business development and large scale program management, along with legal, financial and contract management. Mr. Fitzpatrick earned a bachelor’s degree from Marquette University and a law degree from the University of Baltimore, and did additional graduate studies in Information Technology at Johns Hopkins University.
Talbot A. Harty joined NET in November 2003 and assumed his current role in October 2005. He previously served as Sr. Director of the Company’s Information Technology organization. From 2002 until he joined NET, Mr. Harty was Vice President of Product Development at Perfect Commerce, a provider of on-demand supplier relationship management solutions. From 2000 to 2001, he served as Vice President of Product Marketing at Mobileum (now Roamware), a provider of value-added voice and data roaming services. Prior to that, he held senior positions in information technology, operations, and research and development at a number of high-technology companies. He also sits on technology advisory boards for a number of start-up companies.
Francois P. Le joined NET in 2008. Prior to joining the Company, he was Vice President of Carriers and International Sales at Tropos Networks, the market leader in delivering metro-scale Wi-Fi mesh networks. Previously, Mr. Le was Vice President of Worldwide Sales for Aperto Networks, a supplier of WiMAX broadband wireless networks, where he started sales and extended the customer base into more than 50 countries and 150 operators. Prior to that, Mr. Le was Director of Product Marketing and Business Development for WAN access products at 3Com Corporation and Vice President of International Sales with Multipoint Networks. Earlier, he held Sales Director responsibilities at NET for Europe and later Asia-Pacific and Latin America. Mr. Le holds an MBA from the Stanford Graduate School of Business and an engineering diploma from the National Institute of Applied Sciences in Lyon, France.
Pete Patel joined NET in April 2008. Prior to joining the Company, Mr. Patel held a senior management position at Xirrus, Inc., a provider of next generation wireless LAN architecture. Previously, at Occam Networks, Advanced Fibre Communications, and Ericsson, Mr. Patel held various senior management positions including Vice President of Operations, Director of Operations, Director of Design Verification and Test Engineering, and Senior Test Engineering Manager. Mr. Patel holds an F.Y.B.Sc. in science from Gujarat University, India and a B.V.Sc. and A.H. from Gujarat Agricultural University, India.
Frank Slattery joined NET in February 2003. In addition to serving as General Counsel, he is the Corporate Secretary and oversees corporate governance matters. Mr. Slattery has been a business lawyer for technology companies since 1989, when he began his legal career at the firm of Wilson, Sonsini, Goodrich & Rosati. Prior to joining NET, he served in legal and senior management positions for a number of computer software and internet services companies, including SiteSmith, an internet infrastructure services provider, which was acquired by Metromedia Fiber Networks; USWeb, an internet services company; and ParcPlace Systems, a software tools developer. Mr. Slattery holds a BA in Economics and a JD from the University of California, Davis.
David Wagenseller joined NET in 1986 through its acquisition of ComDesign, Inc. He became Vice President of Finance in 2006, became the Company’s principal financial officer in November 2009, and was named Chief Financial Officer in April 2010. He previously held responsibility for controllership, treasury and financial planning. Mr. Wagenseller earned a Bachelor’s degree in Business Administration from California State University, Dominquez Hills.
Where You Can Find More Information
We make our annual report on Form 10-K, quarterly reports on Form 10-Q, current reports on Form 8-K, and all amendments to such reports filed pursuant to Section 13(a) or 15(d) of the Exchange Act, available free of charge on or through our Internet website located at www.net.com or the SEC’s website located at www.sec.gov. You may also read and copy any document we file at the SEC’s public reference room located at 100 F Street, N.E., Room 1580, Washington, D.C. 20549. Please call the SEC at (800) SEC-0330 for further information on the public reference room. Stockholders may also access and download free of charge our corporate governance documents, including our Corporate Governance Guidelines, Audit Committee, Compensation Committee and Nominating/Corporate Governance Committee Charters, and Code of Business Conduct, on or through this Internet website. In addition, any stockholder who wishes to obtain a printed copy of any of these documents should write to: Investor Relations, NET, 6900 Paseo Padre Parkway, Fremont, California 94555.
ITEM 1A. RISK FACTORS
We have incurred net losses in the past and may incur losses in the future.
With the exception of fiscal 2008, we have incurred net losses since fiscal 1998, including in fiscal 2011. Our circuit-switched product line, Promina, currently provides a substantial portion of our revenue, and the market for that product line is declining. In order for the Company to be profitable in future periods, we need our newer products to achieve commercial success. Any shortfall in revenue compared to our annual financial plan would likely require that we reduce spending, though many of our costs are fixed in the short term making it difficult to reduce spending rapidly. Reductions in research and development spending will impede the development of new products and product enhancements, which would in turn negatively affect future revenue.
Our operating results may continue to fluctuate.
Our operating results vary significantly from quarter to quarter. These fluctuations may result from a number of factors, including:
|
|
•
|
changes in demand for our products, which may result from changes in customer needs, features available in our products, competition, changes in industry standards, and other factors;
|
|
|
•
|
the timing of orders from, and shipments to, our customers;
|
|
|
•
|
the timing of the introduction of, and market acceptance for, new products and services;
|
|
|
•
|
variations in the mix of products and services we sell;
|
|
|
•
|
the timing and level of certain expenses, such as joint venture and development arrangements, acquisition-related costs, prototype costs, legal fees, write-offs of obsolete inventory;
|
|
|
•
|
the timing of revenue recognition, which depends on numerous factors, such as contractual acceptance provisions and separability of arrangements involving multiple elements, including some factors that are out of our control, such as assurance as to collectability;
|
|
|
•
|
the timing and amounts of stock-based awards to employees;
|
|
|
•
|
the timing and size of federal government budget approvals and spending, and timing of government deployment schedules;
|
|
|
•
|
the timing of gain and loss related to our investment portfolio, retirement of debt, or foreign currency transactions; and
|
|
|
•
|
economic conditions in the networking industry, including the overall capital expenditures of our customers.
|
Due to the foregoing factors, we believe that quarter-to-quarter comparisons of our operating results are not necessarily a good indication of our future performance. Any shortfall in revenue may adversely affect our business, results of operations, and financial condition. Investors should not rely on our results or growth for one quarter as any indication of our future performance.
Our stock price is volatile and could decline substantially.
The market price of our common stock has fluctuated significantly in the past, will likely continue to fluctuate in the future and may decline. Fluctuations or a decline in our stock price may occur regardless of our performance. Among the factors that could affect our stock price, in addition to our performance, are:
|
|
•
|
variations between our operating results and either the guidance we have furnished to the public or the published expectations of securities analysts;
|
|
|
•
|
changes in financial estimates or investment recommendations by securities analysts following our business;
|
|
|
•
|
announcements by us or our competitors of significant contracts, new products or services, acquisitions, or other significant transactions;
|
|
|
•
|
the issuance by us of common stock or other securities in the future;
|
|
|
•
|
the inclusion or exclusion of our stock in various indices or investment categories;
|
|
|
•
|
changes in the stock prices of other telecommunications equipment companies, to the extent that some investors tend to buy or sell our stock based on segment trends;
|
|
|
•
|
the trading volume of our common stock; and
|
|
|
•
|
repurchases we make of our common stock or early retirement of debt.
|
Our future capital needs are uncertain and we may need to raise additional funds in the future.
We believe our existing cash, cash equivalents, and short term investments will be sufficient to fund our operations for at least the next twelve months. However, in light of our intention to maintain or increase funding for research and development and for expansion of our sales capabilities, combined with our recent history of net losses, we may need to raise additional capital to fund our operations. Such financing may not be available on terms that we consider acceptable or may not be available to us at all. If we raise capital by selling equity securities, our existing securityholders may suffer dilution. If we raise capital by debt financing, we could be subject to covenants restricting our operations in ways that may prove detrimental to us. If additional capital is needed and we are unable to raise it on acceptable terms, we may have to delay, reduce the scope of, or eliminate some or all of our research and development programs or other operations, which may include delaying further development of our products; or reduce marketing, customer support or other resources devoted to our products or operations. Any of these developments could harm our business, results of operations, or financial condition.
We may engage in acquisitions or similar transactions that could disrupt our operations, cause us to incur substantial expenses, result in dilution to our stockholders and harm our business if we cannot successfully integrate the acquired business, products, technologies or personnel.
Our growth is dependent upon market growth and our ability to enhance our existing products and introduce new products on a timely basis. We have addressed and are likely to continue to address the need to introduce new products through both internal development and through acquisitions of other companies and technologies that would complement our business or enhance our technological capability.
Acquisitions involve numerous risks, including the following:
|
|
•
|
adverse effects on existing customer relationships, such as cancellation of orders or the loss of key customers;
|
|
|
•
|
difficulties in integrating or retaining key employees of the acquired company;
|
|
|
•
|
difficulties in integrating the operations of the acquired company, such as information technology resources, manufacturing processes, and financial and operational data;
|
|
|
•
|
entering markets in which we have no or limited prior experience;
|
|
|
•
|
difficulties in assimilating product lines or integrating technologies of the acquired company into our products;
|
|
|
•
|
disruptions to our operations;
|
|
|
•
|
diversion of our management’s attention;
|
|
|
•
|
potential incompatibility of business cultures;
|
|
|
•
|
potential dilution to existing stockholders if we issue shares of common stock or other securities as consideration in an acquisition or to finance acquisitions;
|
|
|
•
|
limitations on the use of net operating losses;
|
|
|
•
|
negative market perception, which could negatively affect our stock price;
|
|
|
•
|
the assumption of debt and other liabilities, both known and unknown; and
|
|
|
•
|
additional expenses associated with the amortization of intangible assets or impairment charges or write-offs, if any, related to purchased intangibles and goodwill, recorded as a result of the acquisition.
|
We are dependent on revenue from the Promina product line.
Currently, we derive a significant portion of our product revenue from our Promina product line, a circuit-based narrowband technology. The market for our Promina product is declining as networks increasingly employ packet-based broadband technology. This technology migration has resulted in a significant drop in sales of our Promina products over the last several years. If we are unable to develop substantial revenue from our newer packet-based broadband product lines, our business and results of operations will suffer. Although we have developed a migration path to broadband technology and have entered and expect to enter into development agreements with third parties to expand our broadband offerings, this strategy may not materially mitigate this decline.
A significant portion of our revenue is generated from sales to governmental agencies.
A significant portion of our total revenue from product sales comes from contracts with governmental agencies, most of which do not include long-term purchase commitments. Historically, the government has been slower to adopt new technology, such as packet-based technology, which has had the effect of extending the product life of our Promina product. While the government has purchased and is evaluating some of our new products for broader deployment, this new business may not develop quickly or be sufficient to offset future declines in sales of our Promina product. If the government accelerated adoption of new technology and replaced the Promina product line in their networks with products other than ours, our product revenue would decline further. We face significant competition in obtaining future contracts with the government. If we fail in developing new products and successfully selling them to our government customers, our revenue will suffer and we may not be profitable. The federal government has issued specific requirements for IP networking products to incorporate a technology referred to as “IPv6” and requires products destined for use in military applications be certified by the Joint Interoperability Test Command (JITC). If we are unable to complete development efforts necessary to support IPv6 within the timeframes required by the federal government or are unable to obtain JITC certifications as needed, our government sales, and hence our revenue and results of operations, may suffer.
A substantial portion of the revenue generated from our government customers is based on our contract with the GSA. This contract imposes significant compliance and reporting obligations on us. The contract also establishes a fixed price under which government customers may purchase our products and provides for automatic mandatory price reductions upon certain events. In addition, the GSA can impose financial penalties for non-compliance.
Our success depends on our ability to develop new products and product enhancements that will achieve market acceptance.
Our operating results will depend on the successful design, development, testing, introduction, marketing, and broad commercial distribution of our newer IP-based products, as well as successful evolution of our Promina product line incorporating packet-based technology. The success of these products is dependent on several factors, including proper product definition, competitive pricing, timely completion and introduction to the market, differentiation from competitors’ products, and broad market acceptance. Successful introduction of new products also requires the development of relevant expertise in our product support organization. The markets for our products are characterized by rapidly changing technology, evolving industry standards, frequent new product introductions and evolving methods of building and operating networks. We may not successfully identify new product opportunities, develop and bring new products to market in a timely manner, or achieve market acceptance of our products. Our products and product enhancements are increasingly designed as elements of a solution involving products and technologies being developed by third parties, and the success of our products will therefore be affected by the availability and success of the third party products. At the same time, products and technologies developed by others may render our products or technologies obsolete or non-competitive, which in turn could adversely affect our ability to achieve profitability.
Gross margins could decline over future periods.
Gross margins may be adversely affected in the future due to increases in material and labor costs, increases in subcontractor charges, changes in the mix of products and services we sell, increased sales through resellers, increased warranty costs, or pressure on pricing and margins due to competition. As we introduce new products, our overall gross margins may decline, as new products typically have lower gross margins than established products, as a result of customary discounting for early customers and higher per-unit costs associated with low purchase volumes of components. A decline in our gross margins could have a material adverse effect on our business, results of operations, and financial condition.
Litigation may materially adversely affect our business.
Existing and future litigation may result in monetary damages, injunctions against future product sales and substantial unanticipated legal costs and may divert the efforts of management personnel, any and all of which could have a material adverse effect on our business, results of operations and financial condition.
Our operations in foreign countries are subject to political, economic and regulatory risks.
We conduct sales and customer support operations in countries outside of the United States and depend on non-U.S. operations of our subsidiaries and distribution partners. As a general rule, international sales tend to have risks that are difficult to foresee and plan for, including political and economic instability, possible expropriation, regulatory changes, changes in currency exchange rates, difficulties in protecting our intellectual property, changes in tax rates and structures, and collection of accounts receivable. Further, our international markets are served primarily by non-exclusive resellers and distributors who themselves may be severely affected by economic or market changes within a particular country or region. Our international sales are subject to the requirements of the U.S. Foreign Corrupt Practices Act, and similar laws of other countries. For sales within the European Union, our products must comply with the Restriction on Hazardous Substances Directive (RoHS) and Waste from Electrical and Electronic Equipment (WEEE) requirements, any failure of which could result in fines, product seizures, or injunctions against sale.
Our products are subject to export controls and shipments of our products sometimes require a license from the U.S. government.
We are subject to U.S. laws and regulations governing international trade and exports, including, but not limited to the Export Administration Regulations (EAR), International Traffic in Arms Regulations (ITAR), and trade sanctions against embargoed countries and destinations administered by the Office of Foreign Assets Control (OFAC) of the U.S. Department of the Treasury. Under these laws and regulations, we are responsible for obtaining all necessary licenses or other approvals, if required, for exports of hardware, software and technology, as well as the provision of service. For some of our products subject to EAR, the requirement for a license is dependent on the type and end use of the product, the final destination, the identity of the end user, and whether a license exception might apply. Obtaining export licenses can be difficult and time-consuming, and in some instances a license may not be available on a timely basis or at all. A determination by the U.S. government that we have failed to comply with one or more export control laws or trade sanctions, could result in civil or criminal penalties, including the imposition of significant fines, denial of export privileges, loss of revenues from certain customers, and debarment from participation in U.S. government contracts. Any one or more of these sanctions or a change in law or regulations could have a material adverse effect on our business, financial condition and results of operations.
We are conducting an internal investigation regarding our compliance with U.S. export laws.
We have learned that some of our products may have been exported or re-exported in violation of U.S. export laws. Consequently, we have launched an internal investigation of our export-related activities, which is being performed by outside counsel. We will report the results of the investigation to the U.S. government. Certain issues subject to the investigation have already been reported to the U.S. government, and the U.S. government has closed a limited portion of the matter with the issuance of a warning letter. The results of the rest of the internal investigation will be reported to the U.S. government in due course. If the U.S. government determines that we have failed to comply with one or more export control laws or trade sanctions, we could be subject to various civil or criminal penalties. By statute, these penalties can include but are not limited to fines of up to $250,000 for each violation, denial of export privileges, and debarment from participation in U.S. government contracts. Such a determination could also result in the loss of sales to certain customers. Any one or more of these sanctions could have a material adverse effect on our business, financial condition and results of operations.
The market for our products is highly competitive and many of our competitors have greater resources than we do.
The market for networking equipment is highly competitive and dynamic, has been characterized by rapid technological changes and shifting customer requirements, and has seen a worldwide migration from existing circuit technology to the new packet-based technologies. We compete directly, both internationally and domestically, with many different companies, some of which are large, established suppliers of end-to-end solutions, such as Alcatel-Lucent, Avaya, Cisco Systems, Juniper Networks, and Siemens AG. In addition to some of these large suppliers, a number of other smaller companies are targeting the same markets as we are. Particularly, in the unified communications market, Audiocodes Limited and Dialogic Corporation provide competitive solutions and are also partners with Microsoft.
Our larger competitors have significantly greater financial, marketing and technical resources than we have, offer a wider range of networking products than we offer, and can often provide a complete network solution. They are often able to devote greater resources to the development, marketing and sale of their products and to use their equity or significant cash reserves to acquire other companies with technology and/or products that compete directly with ours. They often can compete favorably on price because their sales volume and broad product lines can allow them to make discounted sales while maintaining acceptable overall profit margins. The smaller companies have more ability than we do to focus their resources on a particular product development unencumbered by the requirements to support an existing product line. As a result of the flexibility of their market strategies, our competitors may be able to obtain strategic advantages that may adversely affect our business, financial condition or results of operations.
In addition, the networking equipment market has seen the constant introduction of new technologies that have reduced the value of older technology solutions. This has created pricing pressure on older products while increasing the performance expectations of newer networking equipment. Moreover, broadband technology standards are constantly evolving, and alternative technologies or technologies with greater capability are constantly introduced and sought by our customers. It is possible that the introduction of other technologies will either supplant our current technologies and technologies we have in development, or will require us to significantly lower our prices in order to remain competitive. To remain competitive, we must continue to evolve our product lines to meet the ever-changing technology needs of the networking market while ensuring that they can be sold at a competitive price. We also must enhance our Promina product line to provide needed features that increase its overall value for the customer while keeping the price competitive. Due to the competitive nature of the market and the relative age of our Promina product offerings as well as the competitive pressure affecting all our products, we may not be able to maintain prices for them at levels that will achieve profitability. Also, we may not be successful in completing the development of, or commercializing, products under development.
If we are unable to sign competitive resale partners, our future product and service revenue will be adversely affected.
Our international sales, other than those made to foreign ministries of defense (MoDs), are made through indirect channels that include distributors and resellers worldwide, and our business strategy includes leveraging resale partners in the United States. In addition, many of our target customers, including the government, rely on systems integrators to incorporate new equipment or services into their networks. While we have begun the process of identifying and signing software application, system integrator and OEM or resale partners, more partners are necessary in these areas for us to be successful. We may also need to pursue strategic partnerships with vendors who have broader technology or product offerings in order to compete with the end-to-end solution providers. In addition, many of the enterprise markets we are pursuing require a broad network of resale partners in order to achieve effective distribution. Failure to sign up new reseller and strategic partners, or to implement business processes and services needed to adequately support the distribution channel, could affect our ability to grow overall revenue.
Our sales through systems integrators typically involve the use of our products as components of a larger solution being implemented by the systems integrator. In these instances, the purchase and sale of our product is dependent on the systems integrator, who typically controls the timing, prioritization, and implementation of the project. Project delays, changes in priority, or solution re-design decisions by the systems integrator can adversely affect our product sales.
Our products have long sales cycles, making it difficult to predict when a customer will place an order and when to forecast revenue from the related sale.
Many of our products are complex and represent a significant capital expenditure to our customers. The purchase of our products can have a significant effect on how a customer designs its network and provides services either within its own organization or to an external customer. Consequently, our customers often engage in extensive testing and evaluation of products before purchase. There are also numerous financial and budget considerations and approvals that a customer often must obtain before it will issue a purchase order. As a result, the length of our sales cycle can be quite long, extending beyond twelve months in some cases. We have little visibility into the sales pipelines of resellers, which adds to the difficulty of accurately forecasting revenue. In addition, our customers, including resellers, often have the contractual right to delay scheduled order delivery dates with minimal penalties and to cancel orders within specified time frames without penalty, which makes it difficult to predict whether or not an order may actually ship. We often must incur substantial sales and marketing expense to ensure a purchase order is placed. If orders are not placed in the quarter forecasted, our sales may not meet forecast and revenue may be insufficient to meet expenses.
Because it is difficult for us to accurately forecast sales, particularly within a given time frame, we face a risk of having too much or too little inventory.
Typically, the majority of our revenue in each quarter has resulted from orders received and shipped in that quarter. While we do not believe that backlog is necessarily indicative of future revenue levels, our customers’ ordering patterns and the possible absence of backlogged orders create a significant risk that we could carry too much or too little inventory if orders do not match forecasts. Rather than base forecasts on orders received, we have been forced to schedule production and commit to certain expenses based more upon forecasts of future sales, which are difficult to predict. We are generally liable for excess component inventory and unsold product assemblies that our contract manufacturer orders or assembles based on our forecasts. If large orders do not close when forecasted or if near-term demand weakens for the products we have available to ship, we will have expenses with no corresponding revenue and our operating results for that quarter or subsequent quarters would be materially adversely affected. At the same time, we may face shortages that preclude us from fulfilling orders that are not in our forecast, as a result of lead times for component procurement and manufacturing. If there is an unexpected decrease in demand for certain products or there is an increased risk of inventory obsolescence, which can happen relatively quickly due to rapidly changing technology and customer requirements, adjustments may be required to write down or write off certain inventory, which would adversely affect our operating results.
Delays in government programs or other customer ordering could cause products or product versions to become obsolete sooner than forecasted, which could result in substantial write-downs.
We maintain inventory of various products and components in order to compensate for lead times in parts ordering and product manufacturing, as well as to avoid shortages of parts that are difficult to procure or no longer available. Due to our long sales cycle, customer orders may span release schedules for new versions of our products, particularly if there are delays in customer ordering. As a result, orders we expected to fulfill with one version may become orders for the next version, which could result in us holding obsolete inventory for the earlier version. We have significant unreserved inventory balances on hand, including inventory that is owned by our contract manufacturer but for which we are responsible if it is unused. Substantial charges for the write-down or write-off of obsolete inventory would adversely affect our operating results.
If we are unable to attract, recruit and retain key personnel, then we may not be able to successfully manage our business.
Our success continues to be dependent on our being able to attract and retain highly skilled engineers, managers and other key employees. In most cases, we face significant competition for the most qualified personnel for new positions and to replace departing employees. If we are not able to continue to attract, recruit and retain key personnel, particularly in engineering and sales and marketing positions, we may be unable to meet important company objectives such as product delivery deadlines and sales targets.
Over the past several years, we have restructured our organization which may cause disruptions to our business.
In fiscal 2011, we reorganized a number of functions and continue to seek additional ways to reduce costs and improve efficiencies, such as changes to our internal business processes, transitions to different vendors or service providers, and outsourcing of certain functions. These activities are subject to a number of risks, such as diversion of management time and resources; diminished ability to respond to customer requirements, both as to products and services; and disruption of our engineering and manufacturing processes. Further, despite our efforts, the savings we expect from these actions may not be achieved, or may be achieved only after an initial increase in costs. Problems resulting from these reorganization activities, such as potential challenges maintaining our business systems and operating infrastructure, could have a material adverse effect on our business, results of operations, and financial condition, particularly if coupled with a failure to achieve the expected cost savings. In addition, changes to our business processes may require revisions to our internal controls, and may make it more difficult for us to achieve certification of our internal control over financial reporting.
Our ability to ship our products in a timely manner is dependent on the availability of component parts and other factors.
Several key components of our products are available only from a single source, including certain integrated circuits and power supplies. Depending upon the component, there may or may not be alternative sources or substitutes. Some components are purchased through purchase orders without an underlying long-term supply contract, and some components are in short supply generally throughout the industry. If a required component were no longer available, we might have to significantly reengineer the affected product. Further, variability in demand and cyclical shortages of capacity in the semiconductor industry have caused lead times for ordering parts to increase from time to time. Delays may occur as a result of factors beyond our control, including weather-related delays and other events. For example, in 2011 availability of some components may be affected by the earthquake and tsunami in Japan earlier in the year. If we encounter shortages or delays in receiving ordered components or if we are not able to accurately forecast our ordering requirements, we may be unable to ship ordered products in a timely manner, resulting in decreased revenue. In some instances, our product development efforts are based on component parts, such as integrated circuits, still under development by third-parties. Any delay or failure by the third-party provider to complete and release such a component, which is generally beyond our control, would cause delays or an inability for us to complete and ship the product that is based on the component, which would adversely affect our revenue.
Generally, our customer contracts allow the customers to reschedule delivery dates or cancel orders within certain time frames before shipment without penalty and outside those time frames with a penalty. Because of these and other factors, there are risks of excess or inadequate inventory that could negatively affect our expenses, revenue and earnings. Additionally, defense expedite (DX)-rated orders from the federal government, which by law receive priority, can interrupt scheduled shipments to our other customers.
We outsource our product manufacturing.
We outsource our product manufacturing, including most assembly and structural test, as well as functional test, systems integration, and order fulfillment functions, though we generally remain liable for inventory of components and finished material.
Any difficulties or failures to perform by our contract manufacturers could cause delays in customer product shipments or otherwise negatively affect our results of operations. We also share responsibility for inventory management and production planning with our contract manufacturers, which may increase the risks of carrying too much or too little inventory of either component parts or manufactured product. We have agreed to compensate our contract manufacturers in the event of termination or cancellation of orders, discontinuance of product, or excess material. Also, should our principal contract manufacturer in some future period decide not to renew our contract with it, or should we experience any failure to perform or other difficulties with our principal contract manufacturer, it would be difficult for us to quickly transfer our manufacturing requirements to another vendor, likely causing substantial delays in customer product shipments and adversely affecting our revenue and results of operations.
As inventory ages, we may be required to make substantial deposits with or purchases from our contract manufacturer.
As part of our arrangement with our principal contract manufacturer, we are required to make deposits on certain purchased raw materials held for greater than 90 days and certain work-in-process items held for greater than 60 days, although the contract manufacturer must make efforts to minimize our liability for this inventory, including returning materials to suppliers, canceling orders with suppliers or using materials to manufacture product for its other customers. Raw material and in-process inventories that are unused and have been held for more than nine months require us to take ownership, or, at a minimum, pay a management fee assuming there is future forecasted demand for those inventories. Further, if anticipated demand for inventories does not materialize in future periods, we are required to take ownership of those associated inventories. We have substantial amounts of inventory at our principal contract manufacturer, and have already made significant deposits on some of the inventory. Additional deposits may be required in the future and if the inventory continues to remain on hand, we may be required to purchase the inventory underlying the deposit and adjustments may be required to write down or write off this inventory, any of which would adversely affect our operating results.
Our intellectual property rights may not be adequate to protect our business.
Our future success depends in part upon our proprietary technology. Although we attempt to establish and maintain rights in proprietary technology and products through patents, copyrights, and trade secrets laws, we cannot predict whether such protection will be adequate or whether our competitors can develop similar technology independently without violating our proprietary rights. As competition in the communications equipment industry increases and the functionality of the products in this industry further overlap, we believe that companies in the communications equipment industry may become increasingly subject to infringement claims. We have received and may continue to receive notice from third parties, including some of our competitors, claiming that we are infringing their patents or their other proprietary rights. To settle such claims, we may enter into licensing arrangements requiring us to pay a royalty to the third party. We cannot predict whether we will prevail in any litigation over third-party claims or that we will be able to license any valid and infringed patents on commercially reasonable terms. Any of these claims, whether with or without merit, could result in costly litigation, divert our management’s time, attention and resources, delay our product shipments or require us to enter into royalty or licensing agreements. In addition, a third party may not be willing to enter into a royalty or licensing agreement on acceptable terms, if at all. If a claim of product infringement against us is successful and we fail to obtain a license or develop or license non-infringing technology, we may be unable to market the affected product.
Although we have a number of patent applications pending, we cannot guarantee that any will result in the issuance of a patent. Even if issued, the patent may later be found to be invalid or may be infringed without our knowledge. Our issued patents might not be enforceable against competitive products in every jurisdiction, and it is difficult to monitor unauthorized use of our proprietary technology by others. Regardless of our efforts to protect our intellectual property, the rapidly changing technologies in the networking industry make our future success primarily a function of the skill, expertise and management abilities of our employees. Nonetheless, others may assert property rights to technologies that are relevant to our currently marketed products or our products under development. If our protected proprietary rights are challenged, invalidated or circumvented, it could have a material adverse effect on our competitive position and sales of our products. Conversely, if other parties are infringing our patents, we may pursue claims against them in order to yield value attributable to our technology. Such claims could involve costly litigation, could divert our management’s time and resources, and could result in counterclaims challenging rights to other technology used by us.
We rely on technologies licensed from third parties.
For each of our product lines, we license some of our technology from third parties. Some of these licenses contain limitations on distribution of the licensed technology, are limited in duration, or provide for expiration upon certain events, such as a change in control of the company. If the relevant licensing agreement expires or is terminated without our being able to renew that license on commercially reasonable terms or if we cannot obtain a license for our products or enhancements on our existing products, we may be unable to market the affected products or may be liable for monetary damages. Our license arrangements are generally not exclusive to us. Our license for a third-party technology, or any exclusivity thereto, may be limited in territory or scope. We generally pay an ongoing royalty for licensed technology, which can restrict our ability to manage costs of the product, leaving us more vulnerable to competition from others, including potentially the licensor itself. For many of these technologies, we rely on the third-party providers to update and maintain the technology, fixing errors and adding new features. If the third-party providers do not adequately update and maintain these technologies, whether due to changes in their product direction, their own financial difficulties, or other reasons, we would need to seek alternative means to fulfill the ongoing requirements for our products that incorporate the third-party technology. If we are unable to find alternative means of fulfilling the ongoing requirements, we may be unable to market the affected products.
We outsource some of our product development activities, which carries inherent risks such as reduced ability to control the timing and quality of the work product, uncertain continuity and availability of skills and knowledge, difficulties of managing and integrating the third-party development, and potential disputes over intellectual property. To the extent we use parties located in overseas jurisdictions, the intellectual property provided to or developed by the third party may, depending on the laws of the jurisdiction, be subject to weaker or significantly different intellectual property protection. In using third parties for product development, we must share with them and will receive from them various intellectual property, which increases the risk of misuse of our intellectual property, as well as the risk that the resulting product might contain items that infringe the intellectual property rights of others.
Many of our sales depend on our achieving third-party certifications for our products.
In several markets for our products, we must achieve various certifications from third parties in order to obtain sales of those products. For example, sales of unified communications products often require certification of interoperability with other vendors’ products; sales to the federal government of products destined for use in military applications must be certified by the JITC; and international sales may depend on standards established by telecommunications authorities in various countries. These certification processes can be lengthy and often require the commitment of another vendor’s or agency’s personnel and test equipment, and we compete with other suppliers for these resources. Even after achieving a particular certification, we may be required to re-certify our products as technologies evolve and other vendors’ products are updated. Any delays in obtaining these certifications or failure to obtain these certifications could adversely affect our ability to sell our products.
The market for some of our products depends on the availability and demand for other vendors’ products.
Some of our products, particularly those addressing the unified communications market, are designed to function with other vendors’ products. In these cases, demand for our products is dependent upon the availability, demand for, and sales of the other vendors’ products, as well as the degree to which our products successfully interoperate with the other vendors’ products and add value to the solution being provided to the customer. If the other vendors change the design of their products, delay the issuance of new releases, fail to adequately market their products, or are otherwise unsuccessful in building a market for their products, the demand for our products will be adversely affected.
We face risks associated with changes in regulations and tariffs, including regulation of the Internet.
Changes in domestic and international telecommunications equipment requirements could affect the sales of our products. In the United States, our products must comply with various FCC requirements and regulations. In countries outside of the United States, our products must sometimes meet various requirements of local telecommunications authorities. Changes in tariffs or failure by us to obtain timely approval of products could affect our ability to market the affected products.
New restrictions on trade, such as in response to transfers of jobs from the United States to lower-cost foreign locations, could limit our ability to purchase components from, or outsource functions to, foreign entities, which would likely make it more difficult to maintain competitiveness in the global market. As a result of our current concentration of business to the federal government, we are more sensitive to these trade restrictions, whether tariffs, incentives, or government purchasing requirements such as the “Buy American Act,” than we would be with a more diversified customer base.
Changes in other laws and regulations, or changes in their interpretation or enforcement, such as confidentiality requirements under the federal privacy laws, California’s state wage and hour laws, or employment regulations in foreign jurisdictions, impose additional costs and potential liabilities on us.
We are exposed to fluctuations in the exchange rates of foreign currency.
As a global concern, we face exposure to adverse movements in foreign currency exchange rates. These exposures may change over time as business practices evolve and could have a material adverse affect on our financial results. We use foreign exchange contracts to hedge significant accounts receivable and intercompany account balances denominated in foreign currencies. Although we have established foreign exchange contracts for non-dollar denominated sales and operating expenses in the United Kingdom, France, and Japan, exposures remain for non-dollar denominated operating expenses in Asia and Latin America. We will continue to monitor our exposure and may hedge against these or any other emerging market currencies as necessary. Market value gains and losses on hedge contracts are substantially offset by fluctuations in the underlying balances being hedged.
We are exposed to fluctuations in the market values of our investment portfolio.
Although we have not experienced any material losses on our cash, cash equivalents and short-term investments, future declines in their market values could have a material adverse effect on our financial condition and operating results. Our investment policy requires our investments to have a credit rating of single-A or better, with asset backed securities rated triple A. If any of these issuers default on their obligations, or their credit ratings are negatively affected by liquidity, credit deterioration or losses, financial results, or other factors, the value of our cash equivalents and short-term investments could decline and result in a material impairment.
The location of our facilities subjects us to the risk of earthquake and floods.
Our corporate headquarters, including most of our research and development operations, are located in the Silicon Valley area of Northern California, a region known for seismic activity. These facilities are located near the San Francisco Bay where the water table is quite close to the surface and where tenants in nearby facilities have experienced water intrusion problems. A significant natural disaster, such as an earthquake or flood, could have a material adverse affect on our business, operating results, and financial condition.
Any material weakness or significant deficiency identified in our internal controls could have an adverse effect on our business.
Section 404 of the Sarbanes-Oxley Act of 2002 requires that companies evaluate and report on their internal control structure and procedures over financial reporting. Material weaknesses could arise that would be required to be reported in the future. In addition, the evaluation process and any required remediation, if applicable, may increase our accounting, legal and other costs, and may divert management resources from other business objectives and concerns.
ITEM 1B. UNRESOLVED STAFF COMMENTS
Not applicable.
ITEM 2. PROPERTIES
NET is headquartered in Fremont, California. In December 2001, we entered into a ten-year lease for two buildings totaling 185,790 square feet for our headquarters, including one building dedicated for administrative activities and one building dedicated for manufacturing operations. We outsourced manufacturing during fiscal 2006 and ceased use of the building used for manufacturing operations at the end of fiscal 2007, incurring a restructure charge of $10.1 million. In fiscal 2009, we recorded restructure cost of $1.1 million to reflect a change in estimate of the remaining liability for lease and other exit costs for this building. In fiscal 2011, we executed a five-year extension of the facility lease for the building dedicated to administrative activities, which totals 97,747 square feet.
NET and our subsidiaries lease facilities in Illinois, primarily for research and development, and in New Jersey, China, and Hong Kong, for sales and final assembly and test of products. We also lease offices, primarily for sales and service, at other locations in the United States, the United Kingdom, France, China, Australia, Japan and Dubai.
ITEM 3. LEGAL PROCEEDINGS
A subsidiary of the Company, Quintum Technologies, LLC (Quintum), is party, by interpleader, to three related lawsuits in Greece filed by Lexis SA, a former distributor of Quintum products in Greece. The initial interpleader lawsuit was filed October 26, 2006, at the Multimember First Instance Court of Athens. The first two of these lawsuits were initially filed against Lexis by one of its customers, Advanced Telecom Systems (“ATS”), alleging that a set of hardware and software products acquired for ATS by Lexis failed to perform as a system. The products include Quintum’s hardware product and a software product by another vendor, Ipercom. In these first two lawsuits, the customer (ATS) seeks damages from the distributor (Lexis), and the distributor has interpleaded the product vendors, Quintum and Ipercom, asking them to pay any amounts that Lexis may be ordered to pay to ATS, who seeks a refund of amounts paid for the purchase of the hardware and software, totaling €78,215, and compensation for real and moral damages, totaling €4,054,893. The third lawsuit was initiated by one of ATS’ customers for non delivery of services, which were to be delivered through the system ATS purchased from Lexis. In this lawsuit, the ATS customer seeks various monetary damages totaling €2,859,847. ATS filed an interpleader lawsuit against Lexis and Lexis has filed the same against Quintum and Ipercom. Hearings on all the lawsuits and interpleader lawsuits are currently scheduled for February 2012. The Company has not accrued any amounts related to the claim, as it believes that a negative outcome is not probable.
In addition to the above, we are involved in various legal proceedings from time to time in the normal course of our business.
PART II
ITEM 5. MARKET FOR REGISTRANT’S COMMON EQUITY, RELATED STOCKHOLDER MATTERS AND ISSUER PURCHASES OF EQUITY SECURITIES
For a discussion of securities authorized for issuance under equity compensation plans, see notes 10 and 11 to the consolidated financial statements. At May 20, 2011, there were approximately 564 registered stockholders of record of NET.
(c) Issuer Purchases of Equity Securities:
|
Issuer Purchases of Equity Securities during the quarter ended March 25, 2011:
(in thousands, except shares and per share amounts)
|
||||||||||||||||
|
Fiscal Period
|
Total Number of Shares Purchased (1)
|
Average
Price
Paid Per Share
|
Total Number of
Shares Purchased as Part of Publicly Announced Plans or Programs
|
Approximate Dollar Value of Shares That May Yet Be Purchased Under Plans or Programs
|
||||||||||||
|
December 25, 2010-January 21, 2011
|
— | — | — | $ | — | |||||||||||
|
January 22-February 18, 2011
|
— | — | — | $ | — | |||||||||||
|
February 19-March 25, 2011
|
— | — | — | $ | — | |||||||||||
| — | — | — | $ | — | ||||||||||||
|
(1)
|
During the quarter ended March 25, 2011, 74,182 shares were acquired directly from employees as payment of tax withholding obligations upon vesting of restricted stock awards.
|
Market Price
NET’s common stock is traded on The NASDAQ Stock Market, LLC under the symbol “NWK.” Until April 23, 2009, NET’s common stock was listed on the New York Stock Exchange. The following table sets forth, for the quarterly periods indicated, the high and low sale prices of our common stock:
|
Fiscal 2011
|
Low
|
High
|
||||||
|
First quarter
|
$
|
3.63
|
$
|
6.10
|
||||
|
Second quarter
|
$
|
2.53
|
$
|
4.50
|
||||
|
Third quarter
|
$
|
3.04
|
$
|
5.50
|
||||
|
Fourth quarter
|
$
|
3.10
|
$
|
5.40
|
||||
|
Fiscal 2010
|
Low
|
High
|
||||||
|
First quarter
|
$
|
3.12
|
$
|
4.56
|
||||
|
Second quarter
|
$
|
3.76
|
$
|
7.45
|
||||
|
Third quarter
|
$
|
3.09
|
$
|
7.23
|
||||
|
Fourth quarter
|
$
|
3.70
|
$
|
5.65
|
||||
NET has never declared or paid dividends on our capital stock and does not intend to pay dividends in the foreseeable future. Our convertible debt trades in the over-the-counter market.
Information regarding equity compensation plans will be contained in the Proxy Statement in the section captioned “Equity Compensation Plan Information” and is incorporated herein by reference.
Stock Performance Graph
The graph depicted below shows NET’s stock price as an index assuming $100 invested over the five year period beginning on March 26, 2006, along with the composite prices of companies listed in the S&P 500 Index and NASDAQ Telecommunications Index. All values assume reinvestment of the full amount of all dividends.
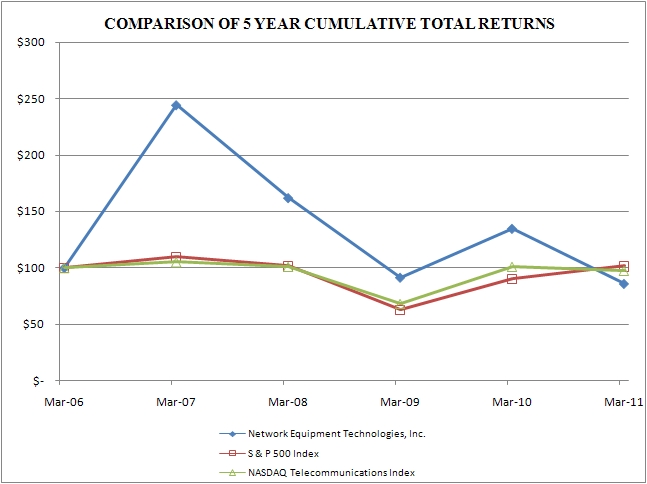
|
Fiscal year ended
|
2006
|
2007
|
2008
|
2009
|
2010
|
2011
|
|
||||||||||||||
|
Network Equipment Technologies, Inc.
|
100.00 | 244.33 | 161.96 | 91.44 | 134.76 | 85.89 | |||||||||||||||
|
S&P 500 Index
|
100.00 | 109.73 | 101.57 | 63.01 | 90.09 | 101.46 | |||||||||||||||
|
NASDAQ Telecommunications Index
|
100.00 | 105.17 | 101.02 | 67.84 | 101.05 | 97.52 | |||||||||||||||
ITEM 6. SELECTED FINANCIAL DATA
The following selected financial information has been derived from the audited consolidated financial statements. The information set forth below is not necessarily indicative of results of future operations and should be read in conjunction with “Management’s Discussion and Analysis of Financial Condition and Results of Operations” and the consolidated financial statements and related notes thereto included elsewhere in this Form 10-K.
The information presented below reflects the impact of certain significant transactions, including the acquisition of Quintum in fiscal 2008, and the adoption of certain accounting pronouncements, which makes a direct comparison difficult between each of the last five fiscal years.
(in thousands, except per share amounts)
|
Fiscal year ended
|
2011
|
2010
|
2009
|
2008
|
2007
|
|||||||||||||||
|
Total revenue
|
$ | 60,147 | $ | 74,494 | $ | 65,788 | $ | 116,144 | $ | 84,094 | ||||||||||
|
Net income (loss)
|
$ | (26,298 | ) | $ | (17,843 | ) | $ | (53,503 | ) | $ | 7,145 | $ | (16,194 | ) | ||||||
|
Basic net income (loss) per share
|
$ | (0.88 | ) | $ | (0.61 | ) | $ | (1.85 | ) | $ | 0.26 | $ | (0.65 | ) | ||||||
|
Diluted net income (loss) per share
|
$ | (0.88 | ) | $ | (0.61 | ) | $ | (1.85 | ) | $ | 0.25 | $ | (0.65 | ) | ||||||
|
Total assets
|
$ | 89,371 | $ | 117,686 | $ | 133,433 | $ | 269,333 | $ | 134,019 | ||||||||||
|
3 ¾% convertible senior notes
|
$ | 10,500 | $ | 10,500 | $ | 13,000 | $ | 85,000 | $ | — | ||||||||||
|
7 ¼% convertible subordinated debentures
|
$ | 23,704 | $ | 23,704 | $ | 23,704 | $ | 24,706 | $ | 24,706 | ||||||||||
|
Other long-term liabilities
|
$ | 1,234 | $ | 2,161 | $ | 4,568 | $ | 6,295 | $ | 3,886 | ||||||||||
ITEM 7. MANAGEMENT'S DISCUSSION AND ANALYSIS OF FINANCIAL CONDITION AND RESULTS OF OPERATIONS
This discussion and analysis should be read in conjunction with the consolidated financial statements and the accompanying notes included in this Form 10-K. Statements contained in this discussion that are not historical facts are forward-looking statements within the meaning of the federal securities laws that relate to future events or our future financial performance. A forward-looking statement may contain words such as “plans,” “hopes,” “believes,” “estimates,” “will,” “continue to,” “expect to,” “anticipate that,” “to be,” or “can affect.” Forward-looking statements are based upon management expectations, forecasts and assumptions that involve risks and uncertainties that may cause actual results to differ materially from those expressed or implied in the forward-looking statements. Many factors may cause actual results to vary including, but not limited to, the factors identified in this discussion. The Company expressly disclaims any obligation or undertaking to revise or publicly release any updates or revisions to any forward-looking statement contained in this discussion except as required by law. Investors should carefully review the risk factors described in this document along with other documents the Company files from time to time with the Securities and Exchange Commission (SEC).
Critical Accounting Policy Judgments and Estimates
The preparation of financial statements in conformity with accounting principles generally accepted in the United States of America requires that we make estimates and assumptions that affect the reported amounts of assets and liabilities and disclosure of contingent assets and liabilities at the date of the financial statements and the reported amounts of revenue and expenses during the reporting period. Such estimates and assumptions, which we evaluate on an on-going basis, include, but are not limited to: assumptions related to contracts that have multiple elements, the allowances for sales returns and potentially uncollectible accounts receivable, the valuation of inventory, warranty costs, the valuation allowance on deferred tax assets, certain reserves and accruals, estimated lives of depreciable assets, and assumptions related to stock-based compensation. We base our estimates on historical experience and other assumptions that we believe are reasonable under the circumstances. Actual results could differ from those estimates.
Management has discussed the development and selection of these critical accounting estimates with the Audit Committee of our Board of Directors and the Audit Committee has reviewed the foregoing disclosure. Changes in estimates used in these and other items could have a material effect on our financial statements.
We believe the following critical accounting policies affect the more significant judgments and estimates used in the preparation of our financial statements:
Revenue Recognition: We recognize product revenue when all four of the following criteria are met:
1) we have a contract with our customer,
2) the product has been shipped as required by the contract and risk of loss has passed to the customer,
3) the price is fixed or determinable, and
4) collection of payment is probable.
If the customer has a right of acceptance and we have not yet obtained acceptance, revenue is deferred until the terms of acceptance are satisfied. When product revenue is deferred, we also defer the associated cost of goods until the revenue is recognized. We recognize service revenue upon completion of the service or, for ongoing services such as maintenance, ratably over the period of the contract. For sales arrangements that involve multiple elements to be delivered at different times, such as a sale of equipment together with post-contract support services, we assign revenue to each element based on its fair value and recognize revenue for each element as the criteria for recognition are met. Fair value for each element is determined by vendor-specific objective evidence, if available, such as the sales price charged when the same element is sold separately, or otherwise by the residual method, whereby the value of delivered elements is determined by subtracting the fair value of the undelivered elements from the total value of the arrangement. If vendor-specific objective evidence of fair value of one or more undelivered elements does not exist, revenue on the entire arrangement is deferred and is recognized only upon delivery of those elements or when fair value has been established.
For a contract related to funded research and development activities, we recognized revenue and related costs in accordance with the provisions of the Financial Accounting Standards Board (FASB) Accounting Standards Codification (ASC) Topic 605, Revenue Recognition. We accounted for this contract using the completed contract method because we determined that reasonable estimates of gross profit and percentage of completion were not available. All revenues and related costs were deferred until the contract was completed. Because the completed contract method precludes recognition of performance under the contract as the work progresses, it does not reflect current financial performance when the contract extends beyond one accounting period, and it therefore may result in uneven recognition of revenue, related cost of revenues and gross margin.
Through a contractual arrangement with NET, CACI International Inc. (CACI) had certain rights to provide maintenance and other services to our federal government customers. Under this arrangement, both companies sold services for NET products, other than the Tenor products, and each company was responsible for various aspects of service delivery. CACI was responsible for maintenance support for first-level calls and on-site repairs, NET provided spares logistics and bug fixes and both companies provided training services. Under a revenue-sharing arrangement, revenue from maintenance services was shared between both companies, regardless of which company sold the services. The receipts from sales of these services were shared based on a pre-determined percentage, which was 37% for us and 63% for CACI at the time of the termination of the agreement. Therefore, 63% of our receipts that were subject to the agreement were remitted to CACI, and conversely, 37% of CACI’s receipts that were subject to the agreement were remitted to us. Receipts from sales of training services were shared based on sales volumes but training services revenues were not significant for either NET or CACI. We recorded amounts derived from sales by us as gross revenue and we recorded amounts remitted to us by CACI as net revenue. This arrangement expired December 1, 2010, and since then, we have performed these services ourselves and retained all the revenue associated with these services.
Revenue on sales through resellers is recognized upon transfer of title to the reseller. Many of the sales to our resellers are based upon firm commitments from their end customer; as a result, these resellers carry little or no NET stock. For our Promina, VX, NX, and UX products, our customers generally do not have the right to return the equipment. For our Tenor product line, our customers are subject to agreements allowing for limited rights of return and price protection. Accordingly, revenues are reduced for our estimates of liability related to these rights. The estimate for returns is recorded at the time the related sale is recognized and is adjusted periodically based on historical rates of returns and other related factors. The reserves for price protection are recorded at the time these programs are offered. Price protection is estimated based on specific programs, expected usage and historical experience.
Allowance for Sales Returns: A reserve for sales returns is established primarily for our reseller and distributor customers, based on actual historical product returns. If the actual future returns differ from historical levels, our revenue could be adversely affected.
Allowance for Doubtful Accounts: The allowance for doubtful accounts receivable is based on our assessment of the collectability of specific customer accounts and the aging of accounts receivable. If there is a deterioration of a major customer’s credit worthiness or actual defaults are higher than our historical experience, we may have to increase our allowance for doubtful accounts receivable, and our operating expenses could be adversely affected. Credit losses have historically been within our expectations and the allowances for doubtful accounts receivable that were established.
Inventory and Contract Manufacturer Liabilities: Under an agreement with our primary contract manufacturer, Plexus Corp. (Plexus), which runs through December 31, 2011, we maintain a level of control over parts procurement, design, documentation, and selection of approved suppliers. We are generally liable for any termination or cancellation of product orders, as well as excess and obsolete material, which can result, for example, from an engineering change, product obsolescence, or inaccurate component forecasting. Under the agreement, Plexus is to procure raw materials and begin manufacturing of products in accordance with our forecasts. If certain purchased raw materials or certain work-in-process items are held for greater than 90 days, we must make deposits on the aging inventory, although Plexus must make efforts to minimize our liability for the aging inventory, including returning materials to suppliers, canceling orders with suppliers, or using materials to manufacture product for its other customers. If raw material or in-process inventories are still unused and have been held for more than nine months, we must take ownership and pay for the aged inventory. Alternatively, if there is forecasted demand for such inventory, we must pay a management fee for Plexus to retain such inventory. If the forecasted demand does not materialize we must take ownership and pay for such inventory. This activity may increase our owned inventories.
At March 25, 2011, our deposit on inventory held by Plexus was $4.2 million, of which $1.3 million had been charged to a reserve for excess inventory. The deposit, including the related reserve, is included in prepaid expenses and other assets in the consolidated balance sheets.
We value inventory at the lower of cost (first-in, first-out) or market. If we believe that demand no longer allows us to sell our inventory above cost, or at all, we establish reserves to write down inventory to market value or write off excess or obsolete inventory. To the extent that a severe decline in forecasted demand occurs, or we experience a higher incidence of inventory obsolescence due to rapidly changing technology and customer requirements, we may incur significant charges for excess inventory. We use estimates to allocate manufacturing overhead to inventory which is expensed when the inventory is sold to the end customer.
Goodwill and indefinite-lived intangible assets: Goodwill and intangible assets with indefinite useful lives are not amortized, but instead are tested for impairment annually, or more frequently if impairment indicators arise. Impairment indicators arise when events or changes in circumstances indicate that the carrying value of the asset may not be recoverable, such as a significant downturn in industry or economic trends with a direct impact on the business, an expectation that a reporting unit will be sold or otherwise disposed of for less than the carrying value, loss of key personnel, or a significant decline in the market price of an asset or asset group. Impairment of goodwill is tested at a reporting unit level using a two-step process. Impairment of indefinite-lived intangible assets is tested at the unit of accounting level by comparing fair value to its carrying value. Goodwill was fully impaired in fiscal 2009 as part of the Company’s impairment analysis.
Long-lived assets: The Company reviews long-lived assets, including intangible assets with finite lives, property and equipment, and other assets for impairment whenever events or changes in circumstances indicate that the carrying amount of an asset may not be recoverable. Conditions that would necessitate an impairment assessment include a significant decline in the market price of an asset or asset group, a significant adverse change in the extent or manner in which an asset or asset group is being used, the loss of legal ownership or title to the asset, significant negative industry or economic trends or the presence of other factors that would indicate that the carrying amount of an asset or asset group is not recoverable. We consider a long-lived asset to be impaired if the estimated undiscounted future cash flows resulting from the use of the asset and its eventual disposition are not sufficient to recover the carrying value of the asset. If we deem an asset to be impaired, the amount of the impairment loss represents the excess of the asset’s carrying value compared to its estimated fair value. Intangible assets were fully impaired in fiscal 2009 as part of the Company’s impairment analysis.
At March 25, 2011 and at March 26, 2010, our balance sheets included no goodwill or intangible assets.
Warranty Accruals: We warrant hardware product, generally for twelve months, and software, generally for 90 days. The software warranty entitles the customer to bug fixes but not software upgrades during the warranty period. Our methodology is to accrue warranty expense based on historical expense trends calculated as a percentage of product sales. Actual expenses are charged against the accrual in the period they are incurred. On a quarterly basis, the warranty accrual is analyzed for adequacy based on actual trends and subsequent adjustments are made as necessary.
Vacated Facilities: In fiscal 2007, we recorded a charge of $10.1 million of which $4.6 million related to estimated future net costs of our former manufacturing facility. In determining the amount of this charge, we made certain estimates, including future sublease rents to be received, future rent increases to be paid to our current landlord, allocation of original construction costs, and future operating costs. We executed a sublease for a portion of the facility in fiscal 2008, on financial terms consistent with the estimates. In fiscal 2009, we recorded additional restructuring cost of $1.1 million due to a change in our estimate of the cost to vacate our former manufacturing facility. We will adjust the liability over the remaining term of the lease, which expires in December 2011, for future changes in terms, estimates used, or actual costs incurred and sublease revenues received.
Stock-based Compensation: We recognize stock-based compensation expense for all share-based payment awards including employee stock options and restricted stock awards. We value stock-based compensation expense for expected-to-vest stock-based awards under the single-option approach and we amortize stock-based compensation expense on a straight-line basis, net of estimated forfeitures. We recognize the value of the portion of the award that is ultimately expected to vest over the requisite service periods in our consolidated statements of operations.
We estimate the fair value of stock options granted using the Black-Scholes option-pricing formula and a single option award approach. The fair value is amortized on a straight-line basis over the requisite service periods of the awards, which is generally the vesting period. Our computation of expected volatility is based on historical volatility commensurate with the expected term of the options. The risk-free interest rate used in the Black-Scholes option-pricing formula is based on the implied yield currently available on U.S. Treasury securities with an equivalent remaining term commensurate with the expected term of the options. The expected dividend assumption is based on our current expectation that we will not pay out cash dividends in the foreseeable future. We estimated the expected term of options granted in fiscal 2011, 2010 and 2009 using vesting periods of awards and historical data such as past experience and post-vesting cancellations. We believe these calculations provide reasonable estimates of expected life for stock–based awards to employees.
Deferred Taxes: We determine our income taxes in each of the jurisdictions in which we operate which involves estimating our actual current tax expense together with assessing temporary differences resulting from recognition of items for income tax and accounting purposes. These differences result in deferred tax assets and liabilities. We must then assess the likelihood that our deferred tax assets will be recovered from taxable income during the carryback period or in the future, and to the extent we believe that recovery is not likely, we must establish a valuation allowance. Our most significant deferred tax assets are net operating losses, for which we provide a valuation allowance based on our estimation of the likelihood of recovery. FASB ASC Topic 740, Income Taxes, provides for the recognition of deferred tax assets if realization of such assets is more likely than not to occur. Based upon the weight of available evidence, which included the Company’s historical operating performance and reported cumulative net losses, we provided a full valuation allowance against our U.S. and most of our foreign net deferred tax assets. There is no valuation allowance against our UK deferred tax assets. We reassess the need for our valuation allowance on a quarterly basis.
Tax years from 1998 in the U.S. and 2004 in our primary foreign jurisdictions remain open for examination. Although the timing of resolution and closure of audits is highly uncertain, we do not believe it is reasonably possible that the unrecognized tax benefits would materially change in the next twelve months.
Results of Operations
The following table sets forth selected data derived from our consolidated statements of operations expressed as a percentage of revenue for the periods presented:
|
Year Ended
|
||||||||||||
|
March 25,
|
March 26,
|
March 27,
|
||||||||||
|
2011
|
2010
|
2009
|
||||||||||
|
Percent of revenue
|
||||||||||||
|
Product
|
76.3
|
%
|
78.0
|
%
|
77.8
|
%
|
||||||
|
Service and other
|
23.7
|
22.0
|
22.2
|
|||||||||
|
Total revenue
|
100.0
|
100.0
|
100.0
|
|||||||||
|
Product gross margin
|
46.9
|
52.0
|
39.9
|
|||||||||
|
Service and other gross margin
|
22.7
|
14.6
|
1.2
|
|||||||||
|
Total gross margin (1)
|
41.1
|
43.8
|
16.0
|
|||||||||
|
Sales and marketing
|
32.6
|
26.4
|
32.2
|
|||||||||
|
Research and development
|
31.9
|
25.8
|
33.2
|
|||||||||
|
General and administrative
|
17.4
|
15.9
|
19.9
|
|||||||||
|
Impairment of goodwill and long-lived assets
|
—
|
—
|
52.0
|
|||||||||
|
Restructure and other costs (recoveries)
|
0.5
|
—
|
3.6
|
|||||||||
|
Total operating expenses
|
82.4
|
68.1
|
140.9
|
|||||||||
|
Loss from operations
|
(41.3
|
)
|
(24.3
|
)
|
(124.9
|
)
|
||||||
|
Interest income
|
1.5
|
2.0
|
5.6
|
|||||||||
|
Interest expense
|
(3.7
|
)
|
(3.1
|
)
|
(5.9
|
)
|
||||||
|
Other income, net
|
—
|
1.5
|
44.0
|
|||||||||
|
Loss before taxes
|
(43.5
|
)
|
(23.9
|
)
|
(81.2
|
)
|
||||||
|
Income tax provision
|
0.2
|
0.1
|
0.1
|
|||||||||
|
Net loss
|
(43.7
|
)%
|
(24.0
|
)%
|
(81.3
|
)%
|
||||||
|
|
(1)
|
Total gross margin includes effect of impairment of long-lived assets of $10.1 million in fiscal 2009.
|
Overview and highlights
|
|
•
|
Total revenue declined in fiscal 2011 due to lower sales to government customers, particularly for our Promina and other multi-service products. Revenue from government customers was $15.8 million lower in fiscal 2011 than in fiscal 2010. Our sales to the government sector continue to account for a majority of our revenue, but fluctuate from quarter to quarter, as they are dependent upon the size of budget allocations, the timely passage of the annual federal budget, and the timing of specific programs. In addition, government customers may purchase large quantities of equipment from us in a single quarter, making quarterly comparisons difficult. For example, over the course of fiscal 2010, we achieved quarterly revenue ranging from a low of $84,000 to a high of $6.2 million for NX1000 sales from a single government program.
|
|
|
•
|
Sales of our VoIP-based product lines increased in the aggregate in fiscal 2011. Product revenue from our VX Series was $16.2 million in fiscal 2011, compared to $13.0 million in fiscal 2010, representing a 25% increase. This increase was due principally to greater sales of our VX Series to commercial customers for UC implementations and to government customers for secure communications applications. Product revenue from enterprise customers for our VX Series was up 28.9% in fiscal 2011 over fiscal 2010. Revenue from Tenor products decreased by 11.1% in fiscal 2011, compared to fiscal 2010, as demand continued to shift to more-advanced products. The first product in the UX Series, our new VoIP and unified communications platform, became generally available early in the third quarter of fiscal 2011.
|
|
|
•
|
Sales of our multi-service networking products declined from the prior year. In fiscal 2011, combined sales of our Promina and NX1000 products were down 49.7% from fiscal 2010. The reduction is primarily from lower sales of the NX1000, which are largely concentrated to a specific customer. Promina products, which are based on time division multiplexing, continue to function well for certain applications. The NX1000 product is an extension of our Promina product line and allows Promina customers to add IP capabilities to their networks. Given the installed base for Promina and the addition of the NX1000 product, we expect to see continuing orders for Promina and NX1000 products for the next few years, but at a declining rate.
|
|
|
•
|
Our sector mix and our mix of product sales fluctuate quarter to quarter. We expect our customers to move to IP-based communications, at varying speeds. Also, spending by government customers fluctuates for the reasons noted above. The following table shows elements of our sector mix and our mix of product sales:
|
|
(in thousands, except percentages)
|
Year Ended
|
|||||||||||
|
March 25, 2011
|
March 26, 2010
|
March 27, 2009
|
||||||||||
|
Sector mix:
|
||||||||||||
|
Revenue from government customers
|
$
|
42,752
|
$
|
58,580
|
$
|
47,906
|
||||||
|
% of total revenue
|
71.1
|
%
|
78.6
|
%
|
72.8
|
%
|
||||||
|
Mix of product sales:
|
||||||||||||
|
Promina product revenue
|
$
|
14,913
|
$
|
21,165
|
$
|
21,731
|
||||||
|
% of product revenue
|
32.5
|
%
|
36.4
|
%
|
42.4
|
%
|
||||||
|
IP-based product revenue
|
$
|
26,137
|
$
|
22,611
|
$
|
22,151
|
||||||
|
% of product revenue
|
56.9
|
%
|
38.9
|
%
|
43.3
|
%
|
||||||
|
Other product revenue
|
$
|
4,545
|
$
|
13,999
|
$
|
7,074
|
||||||
|
% of product revenue
|
9.9
|
%
|
24.1
|
%
|
13.8
|
%
|
||||||
|
|
•
|
Our arrangement with CACI International Inc. (CACI) for maintenance and other services provided to our federal government customers expired December 1, 2010. We now perform these services ourselves and retain all revenue associated with these services with a relatively small increase in expense, which will benefit service revenue and gross margin. Retaining all of the subject revenue beginning December 1, 2010 helped service revenue and margins in the third and fourth quarters of fiscal 2011.
|
|
|
•
|
Expense levels were generally consistent with prior periods. We continue to manage expenses and cash closely, and operating expense in fiscal 2011 decreased 2.2%. In fiscal 2011, the effect of cost control measures upon operating expenses was partially offset by legal costs incurred mostly in the second quarter of fiscal 2011 for an internal investigation regarding compliance with U.S. export laws. In fiscal 2010 and fiscal 2011, most of our domestic employees took a 7.5% salary reduction, and executives took reductions of 10% to 15%. The salary reductions were offset by grants of restricted stock. These salary reductions with offsetting grants of equity reduced cash consumption, while having a neutral effect upon compensation expense.
|
Revenue
|
(in thousands, except percentages)
|
Year Ended
|
Year Ended
|
||||||||||||||||||
|
March 25, 2011
|
March 26, 2010
|
FY11 vs FY10
|
March 27, 2009
|
FY10 vs FY09
|
||||||||||||||||
|
Product
|
$ | 45,909 | $ | 58,142 | (21.0 | )% | $ | 51,202 | 13.6 | % | ||||||||||
|
Service and other
|
14,238 | 16,352 | (12.9 | ) | 14,586 | 12.1 | ||||||||||||||
|
Total revenue
|
$ | 60,147 | $ | 74,494 | (19.3 | )% | $ | 65,788 | 13.2 | % | ||||||||||
Fiscal 2011 compared to fiscal 2010
Total revenue decreased in fiscal 2011, driven by declines in product revenue caused by lower sales to government customers.
Product revenue decreased, principally due to decreased sales, by $17.4 million, of NX1000 and Promina products to government customers, offset in part by higher sales, by $3.3 million, of VX Series products, to both government and commercial customers and, to a lesser extent, by sales to commercial customers of UX Series products, which were introduced mid-year. Also, sales associated with the basic VoIP applications that were a large part of the traditional Quintum business have continued to decline as we shift our focus to more-advanced unified communications, Session Initiation Protocol (SIP) trunking, and other applications supported by our UX and VX Series products.
We expect our mix of product sales and our sector mix to fluctuate quarter to quarter, as our customers continue to move to IP-based communications. Spending by government customers is dependent on the size of budget allocations and the passage of the annual federal budget. Sales to our government customers also fluctuate based upon the timing of specific government programs.
Service and other revenue decreased in fiscal 2011, principally due to the effect of $1.3 million of previously deferred service and other revenue that we recognized in the second quarter of fiscal 2010 with no similar deferred revenue in fiscal 2011.
Significant fluctuations in our service and other revenue can occur as a result of factors affecting the timing of the recognition of revenue, including customer deployment schedules, contractual acceptance provisions and renewal of annual support agreements.
Fiscal 2010 compared to fiscal 2009
Total revenue was higher in fiscal 2010 compared to fiscal 2009, primarily due to increased product revenue from government customers, and from the recognition of $1.5 million of revenue for funded research and development, which had been previously deferred and was recognized upon achievement of certain milestones.
Product revenue was higher in fiscal 2010 as a result of greater NX1000 and VX revenue, partially offset by declines in Promina and Tenor revenue. The increased revenue for the NX1000 was primarily from the U.S. Army Win-T program that uses the product in the Defense Information Systems Network. Sales associated with the basic VoIP applications that were a large part of the traditional Quintum business have declined as we shift our focus to more-advanced UC, SIP trunking, and other applications supported by our UX and VX Series products.
Service and other revenue increased in fiscal 2010, primarily as a result of the recognition of the $1.3 million of previously deferred service and other revenue in the second quarter.
Gross margin
|
Year Ended
|
||||||||||||
|
March 25, 2011
|
March 26, 2010
|
March 27, 2009
|
||||||||||
|
Product gross margin
|
46.9
|
%
|
52.0
|
%
|
39.9
|
%
|
||||||
|
Service and other gross margin
|
22.7
|
14.6
|
1.2
|
|||||||||
|
Total gross margin (1)
|
41.1
|
%
|
43.8
|
%
|
16.0
|
%
|
||||||
|
|
(1)
|
Total gross margin includes effect of impairment of long-lived assets of $10.1 million in fiscal 2009.
|
Fiscal 2011 compared to fiscal 2010
Total gross margin decreased in fiscal 2011 as lower product margins outweighed improvements in service and other margins.
Product margins were down primarily due to a lower amount of product revenues available to absorb manufacturing overhead, as well as slightly higher fixed manufacturing costs. The effects of lower revenues upon product margins were partially offset by the effect of freight/duty refunds of $432,000 received by our United Kingdom subsidiary in the second quarter of fiscal 2011 and credited to product cost of revenue. These refunds related to overpayments of duty tax for certain sales transactions which occurred over a period from 1995 to 1999. Also, product margins benefited by lower inventory reserves recorded in fiscal 2011. As part of our arrangement with our principal contract manufacturer, we are required to make deposits on certain raw materials purchased by the contract manufacturer. We have substantial amounts of inventory at our principal contract manufacturer, and have already made significant deposits on some of the inventory. Additional deposits may be required in the future and if the inventory continues to remain on hand, we may be required to purchase the inventory underlying the deposit and adjustments may be required to write down or write off this inventory. Inventory reserve charges for fiscal 2011 were $550,000,whereas in fiscal 2010, inventory reserve charges, which principally related to reduced demand for our NX5010 product, were $1.9 million.
Service and other gross margin improved in fiscal 2011. The improvement was due to the termination of the revenue sharing arrangement with our former service partner, CACI, in December 2010. We no longer receive a portion of CACI’s service revenue but, more significantly, we no longer remit any of our service revenue to CACI. This cost reduction was partially offset by additional costs relating to an expansion of our support staff, through increased headcount and by re-assigning some existing personnel from our sales organization.
Fiscal 2010 compared to fiscal 2009
Total gross margin increased in fiscal 2010 compared to fiscal 2009 as a result of increased product and service gross margins.
Product gross margin was higher in fiscal 2010 primarily because we recorded impairment charges of $10.1 million in fiscal 2009 and we had no such charges in fiscal 2010. Also, fixed manufacturing costs declined to $5.1 million in fiscal 2010 compared to $6.1 million in fiscal 2009, as a result of various cost reduction programs. Inventory reserve charges were $1.9 million in fiscal 2010 compared to $5.2 million in fiscal 2009. The largest portion of our inventory reserves, including those taken in fiscal 2009, were in response to reduced product sales of our NX5010 product. Also, product gross margin benefited from an absence of amortization charges on developed technology, whereas in fiscal 2009 we recorded charges of $592,000 for amortization of developed technology acquired from Quintum, which was charged to product cost. These amortization charges ended in the second quarter of fiscal 2009, when we recorded an asset impairment charge for the full carrying value of the developed technology.
Service and other gross margin increased, primarily a result of the recognition of the $1.3 million of previously deferred service and other revenue, as well as generally higher revenues and lower costs. Also, service margins in fiscal 2009 were affected by non-recurring additional service cost associated with the acquisition of the Tenor product line from Quintum.
Operating expenses
| (in thousands, except percentages) |
Year Ended
|
Year Ended
|
||||||||||||||
|
March 25, 2011
|
March 26, 2010
|
FY11 vs FY10
|
March 27, 2009
|
FY10 vs FY09
|
||||||||||||
|
Sales and marketing
|
$
|
19,582
|
$
|
19,647
|
(0.3
|
)%
|
$
|
21,161
|
(7.2
|
)%
|
||||||
|
Research and development
|
19,212
|
19,229
|
(0.1
|
)
|
21,817
|
(11.9
|
)
|
|||||||||
|
General and administrative
|
10,514
|
11,824
|
(11.1
|
)
|
13,120
|
(9.9
|
)
|
|||||||||
|
Impairment of goodwill and long-lived assets
|
—
|
—
|
—
|
34,197
|
(100.0
|
)
|
||||||||||
|
Restructure and other costs (recoveries)
|
281
|
17
|
1,552.9
|
2,423
|
(99.3
|
)
|
||||||||||
|
Total operating expenses
|
$
|
49,589
|
$
|
50,717
|
(2.2
|
)%
|
$
|
92,718
|
(45.3
|
)%
|
||||||
Fiscal 2011 compared to fiscal 2010
Total operating expenses were slightly lower in fiscal 2011 due principally to the effect of cost control measures and reduced facilities costs. In the second quarter of fiscal 2011, we executed a five-year extension of our headquarters facility lease at rental rates favorable to those in the original lease. These cost savings were partially offset by legal costs incurred for an internal investigation regarding compliance with U.S. export laws.
Sales and marketing expense:
Sales and marketing expense was slightly lower in fiscal 2011. The decrease was due to reduced compensation costs partially offset by increases in other operating costs.
Employee compensation costs in sales and marketing were down $569,000. A principal reason for the difference is that in fiscal 2010 we incurred employee separation costs of $714,000 in connection with the retirement of our former federal sales executive, and had no similar charges in fiscal 2011. Also, sales commissions were lower by $220,000 due to reduced bookings as well as reduced costs for consultants and temporary employees, which were $93,000 lower than in fiscal 2010. Also contributing to the reduction in compensation costs, some technical sales support staff were moved to our service organization following termination of the CACI arrangement. Offsetting these decreases, stock compensation expense, direct payroll costs and miscellaneous other payroll costs increased by $443,000 principally due to higher average headcount.
Other operating costs for sales and marketing increased by a total of $504,000. Marketing materials costs and travel and entertainment costs were higher by a total of $311,000, reflecting product launch and deployment activities for our UX Series product. Costs for products deployed for sales and marketing purposes, such as those provided for use in Microsoft Training Centers, were higher by $167,000. Miscellaneous other costs were higher by $195,000. These cost increases were partially offset by reduced allocations of facilities costs, which were lower by $169,000.
Research and development expense:
Research and development expense in fiscal 2011 was approximately equal to 2010 expense. The principal variances in spending activities in fiscal 2011 were as follows.
Employee compensation for research and development was higher by $1.3 million, largely due to UX Series development programs, including additional costs for consultants and temporary employees of $785,000. Also, stock compensation expense increased by $429,000 due to the issuance of stock awards tied to new product milestones, and direct payroll costs increased by $65,000, largely due to higher average headcount.
These increases in research and development expense were offset by reduced expenditures in the following areas: engineering-related expenses were lower by $566,000, principally because fiscal 2010 results included substantial costs for prototype and expensed material used in development activities; depreciation expense was lower by $266,000, as many of the Company’s capital assets came to the end of their depreciation lives over the past two years; allocations of facilities costs were lower by $507,000; and miscellaneous other costs were higher by $43,000.
General and administrative expense:
General and administrative expense was $10.5 million in fiscal 2011, 11.1% lower than in fiscal 2010. The largest single reason for the difference is that in fiscal 2010 we incurred one-time employee separation costs of $878,000 in connection with the departure of our former Chief Financial Officer and there were no similar charges in fiscal 2011. Other reasons for the decline were: outside consulting costs were lower by $530,000 due principally to lower professional service fees; other payroll-related costs, including stock-based compensation, were lower by $229,000; allocations of facilities costs were lower by $254,000; and miscellaneous other costs that included bad debt, bank fees, and accretion charges for our vacated facility, were lower by $170,000.
These decreases were offset by higher legal fees, which increased by $752,000 due principally to costs for an internal investigation of our export-related activities, which is being performed by outside counsel.
Restructure and other costs:
Restructuring costs of $281,000 and $17,000 for fiscal 2011 and fiscal 2010, respectively, related to net charges for employee separation costs related to corporate restructuring activities.
Fiscal 2010 compared to fiscal 2009
Total operating expenses in fiscal 2010 decreased primarily because of the absence of impairment charges which affected operating expenses in fiscal 2009. Cost control measures implemented in fiscal 2009 also contributed to the decrease. The cost control measures include reduced facilities and information technology costs, which are allocated among the various expense line items.
Sales and marketing expense:
Sales and marketing expense decreased in fiscal 2010 by $1.5 million, largely as a result of cost reduction initiatives. Payroll-related and consultancy costs were lower by $1.3 million. The reduction in payroll-related and consultancy costs is due principally to lower headcount and temporary salary reductions, though amounts attributable to the salary reductions were offset by stock-based compensation as discussed below. Marketing communication costs were lower by $758,000 due principally to the termination of a new-customer acquisition program which ran through the first three quarters of fiscal 2009 and to lower advertising costs relating to programs that were discontinued in fiscal 2010. Travel and entertainment costs were lower by $367,000. In addition, there was no amortization of purchased intangibles in fiscal 2010, whereas intangibles amortization expense was $663,000 in fiscal 2009. Also, other miscellaneous sales and marketing costs were lower by $189,000, largely due to reduced consignment inventory reserve charges.
Offsetting the expense reductions, sales commissions were higher by $827,000, reflecting higher product revenue and bookings. Non-cash stock-based compensation was higher due to the effect of restricted stock grants awarded in connection with salary reductions, which accounted for $205,000. We also incurred various costs and charges related to the departure of our former federal sales executive, including employee separation costs of $490,000 and non-cash stock compensation charges of $224,000 for award modifications in connection with his departure.
Research and development expense:
Research and development expense decreased in fiscal 2010 by $2.6 million due primarily to the effect of cost reduction programs as we consolidated our research and development plans into a single company-wide strategy. Payroll-related and consultancy costs were lower by $2.4 million due to reduced headcount and temporary salary reductions, though amounts attributable to the salary reductions were offset by stock-based compensation as discussed below. Depreciation and other operating expenses were lower by $498,000. Engineering related costs were lower by $44,000, due primarily to consolidation of development resources. Allocations of shared expenses, including facilities and information technology costs, were lower by $188,000, due to a reduction in company-wide allocated costs and also to revised allocation percentages to reflect actual utilization of facilities and services. Other miscellaneous research and development costs were lower by $85,000.
These expense reductions were partially offset by non-cash stock-based compensation, which was higher by $613,000, due to the effect of restricted stock grants, awarded mostly in connection with offsets to salary reductions.
General and administrative expense:
General and administrative expense was lower in fiscal 2010 by $1.3 million due primarily to the effect of company-wide cost reduction programs, partially offset by employee separation costs. Payroll related and consultancy costs were lower by $1.2 million, due to lower headcount, temporary salary reductions and reduced usage of consultants, though amounts attributable to the salary reductions were offset by stock-based compensation as discussed below. Outside services, which include audit and tax related services as well as external reporting costs, decreased by $426,000, due in part to elimination of redundant services related to Quintum. Other operating expenses decreased by $272,000. Allocations of shared expenses, including facilities and information technology costs, were lower by $213,000, due to a reduction in company-wide allocated costs and also to revised allocation percentages to reflect actual utilization of facilities and services. In addition, there was no amortization of purchased intangibles in fiscal 2010, versus intangibles amortization expense of $88,000 in fiscal 2009.
Offsetting these savings, legal costs were higher by $250,000, principally due to patent lawsuit defense costs. We also incurred various costs and charges related to the departure of our former Chief Financial Officer, including employee separation costs of $516,000 and non-cash stock compensation charges of $362,000 for award modifications in connection with his departure. The effect of the stock compensation charge was partially offset by reduced stock compensation expense for all other general and administrative employees, which was lower by $223,000.
Restructure and other costs:
Restructuring charges and recoveries in fiscal 2010 were not material and principally were a result of employee separation costs relating to corporate restructuring initiatives. Restructuring charges in fiscal 2009 also related to corporate restructuring initiatives, and primarily resulted from a change in our estimate of the cost to vacate certain facilities as well as costs relating to headcount reductions.
Non-operating items
|
(in thousands, except percentages)
|
Year Ended
|
Year Ended
|
||||||||||||||||||
|
March 25, 2011
|
March 26, 2010
|
FY11 vs FY10
|
March 27, 2009
|
FY 10 vs FY09
|
||||||||||||||||
|
Interest income
|
$
|
888
|
$
|
1,514
|
(41.3
|
)%
|
$
|
3,660
|
(58.6
|
)%
|
||||||||||
|
Interest expense
|
$
|
(2,215
|
)
|
$
|
(2,271
|
)
|
(2.5
|
)%
|
$
|
(3,862
|
)
|
(41.2
|
)%
|
|||||||
|
Other income (expense), net
|
$
|
(2
|
)
|
$
|
1,101
|
(100.2
|
)%
|
$
|
28,944
|
(96.2
|
)%
|
|||||||||
Other income (expense), net, consisted of:
|
(in thousands, except percentages)
|
Year Ended
|
Year Ended
|
|||||||||||||||||
|
March 25, 2011
|
March 26, 2010
|
FY11 vs FY10
|
March 27, 2009
|
FY10 vs FY09
|
|||||||||||||||
|
Loss on foreign exchange
|
$
|
(180
|
)
|
$
|
(45
|
)
|
300.0
|
%
|
$
|
(428
|
)
|
(89.5
|
)%
|
||||||
|
Gain on extinguishment of debt
|
—
|
555
|
(100.0
|
)%
|
28,927
|
(98.1
|
)%
|
||||||||||||
|
Realized gain on available-for-sale securities
|
182
|
569
|
(68.0
|
)%
|
450
|
26.4
|
%
|
||||||||||||
|
Other
|
(4
|
)
|
22
|
(118.2
|
)%
|
(5
|
)
|
(540.0
|
)%
|
||||||||||
|
$
|
(2
|
)
|
$
|
1,101
|
(100.2
|
)%
|
$
|
28,944
|
(96.2
|
)%
|
|||||||||
Fiscal 2011 compared to fiscal 2010
Interest income was lower in fiscal 2011 due to lower average interest earned on investments, and to lower average cash and investment balances. Average cash and investment balances in fiscal 2011 were lower primarily due to the effect of operating losses in fiscal 2011 and 2010.
Interest expense was lower in fiscal 2011, due principally to the effect of the retirement of a portion of our outstanding debt through repurchases in fiscal 2010.
Other income and expense was lower in fiscal 2011 due to higher losses on foreign exchange transactions and lower realized gains on available-for-sale securities. In addition, in fiscal 2010 we realized gains upon the retirement of a portion of our outstanding debt through repurchases and did not have such gains in fiscal 2011.
Fiscal 2010 compared to fiscal 2009
Interest income was lower in fiscal 2010 due to lower average cash balances and, to a lesser extent, to lower average interest earned on investments. Average cash balances were lower primarily due to the effect of operating losses in fiscal 2010 and 2009, as well as the use of cash to repurchase and retire a total of $75.5 million of the outstanding 3¾% convertible senior notes and 7¼% redeemable convertible subordinated debentures.
Both interest expense and other income and expense were lower in fiscal 2010 reflecting the retirement of a portion of our outstanding debt through repurchases in both fiscal 2010 and 2009. In fiscal 2010 we repurchased and retired $2.5 million of the principal amount of our outstanding 3¾% convertible senior notes. We realized a net gain on this extinguishment of debt of $555,000, consisting of a $625,000 gain resulting from the repurchase of debt at below principal, partially offset by a $70,000 write-off of unamortized deferred financing costs related to the repurchased debt. The net gain on this transaction was recorded as non-operating income. In fiscal 2009, we repurchased $72.0 million of our outstanding 3¾% convertible senior notes at a discount to the original issue price. The repurchase of the 3¾% notes at below principal generated a gain of $30.8 million, which was partially offset by a write-off of $2.2 million of unamortized deferred financing costs, for a net realized gain of $28.6 million. We also retired $1.0 million of our outstanding 7¼% redeemable convertible subordinated debentures. This retirement was also accomplished by repurchasing the 7¼% debentures at a discount to the original issue price. The repurchase of the 7¼% debentures at below principal generated a gain of $360,000, which was offset by a write-off of $7,000 of unamortized deferred financing costs, for a net realized gain of $353,000.
Income tax provision
Income tax provisions were $131,000, $72,000 and $67,000, for fiscal 2011, 2010 and 2009, respectively. All prior periods benefited from a U.S. federal refundable credit as a result of legislation that allowed taxpayers to elect to forego bonus depreciation on certain additions of qualified eligible property and, in return, to claim a refundable credit for a portion of its unused alternative minimum tax and research credits. The Housing and Economic Recovery Act of 2008, signed into law in July 2008, applied to certain additions of qualified property placed in service from the period between April 2008 and December 2008. In February 2009, the American Recovery and Reinvestment Tax Act of 2009 was enacted, which extended the period for eligible property additions for another year, through December 31, 2009. The refundable credit ended December 31, 2009. Provisions for income tax are primarily related to our international operations. We incurred additional one-time tax expense of $46,000 in the third quarter of fiscal 2011 on interest income related to freight/duty refunds received by our United Kingdom subsidiary.
Liquidity and Capital Resources
Historically, our primary sources of liquidity and capital resources have been our cash and investment balances, cash provided by operating activities and debt financing activities.
Cash balances: As of March 25, 2011, cash and cash equivalents, short-term investments and restricted cash were $61.4 million, as compared to $81.0 million as of March 26, 2010. At March 25, 2011, these amounts were invested 41% in U.S. Treasury notes, U.S. government agency investments and cash equivalents.
Cash flow from operating activities:
Net cash used by operating activities was $16.8 million, $12.9 million, and $21.1 million in fiscal 2011, 2010, and 2009, respectively.
The increase in net cash used in operating activities of $3.9 million in fiscal 2011 resulted principally from the higher net loss in fiscal 2011 and reductions in accounts payable balances. Accounts payable balances declined primarily because the Company did not need to make as many inventory purchases in support of sales in fiscal 2011 as it did in fiscal 2010. Increases in cash used in operating activities were partially offset by the effect of higher collections on accounts receivable in fiscal 2011 and a lower accounts receivable balance at fiscal 2011 year-end. The collective effect of other activities upon cash used in operating activities in fiscal 2011, including depreciation, amortization and accretion, stock-based compensation expense and gain on extinguishment of debt, was not significant.
In fiscal 2010, cash used in operating activities was primarily the result of the fiscal 2010 net loss of $17.8 million and lower collections on accounts receivable, partially offset by changes in assets and liability balances, principally prepaid assets and accounts payable.
In fiscal 2009, cash used in operating activities was primarily the result of the fiscal 2009 net loss of $53.5 million after allowing for the effect upon cash of: the non-cash charge for impairment of goodwill and long-lived assets of $44.3 million; the non-cash gain on extinguishment of debt of $28.9 million; and cash provided by accounts receivable collections of $16.1 million. The effect upon cash of other non-cash charges and changes in assets and liabilities was relatively minor.
Cash flow from investing activities:
Net cash provided by investing activities was $15.2 million, $4.4 million, and $37.4 million in fiscal 2011, 2010 and 2009, respectively.
Net cash provided by investing activities increased by $10.8 million in fiscal 2011. The principal reason for this change was the net effect upon cash of purchases, sales and maturities of short-term investments. These activities provided net cash of $18.4 million in fiscal 2011 compared to $5.5 million in fiscal 2010. We used the cash provided by investing activities in fiscal 2011 principally to fund operating activities.
In fiscal 2010, net cash provided by investing activities was a relatively low $4.4 million. Operating activities in fiscal 2010 were principally funded by the cash on hand at the beginning of fiscal 2010.
In fiscal 2009, net cash provided by purchases, sales and maturities of short-term assets was $39.6 million. Much of this cash was applied to the repurchase of debt (see “Cash flow from financing activities” below).
Cash flow from financing activities:
Net cash used in financing activities was $566,000, $2.4 million, and $43.1 million in fiscal 2011, 2010 and 2009, respectively.
Financing activities were similar in fiscal 2011 and fiscal 2010 except that in fiscal 2010, we paid $1.9 million to repurchase a portion of our outstanding 3¾% convertible senior notes, whereas there were no note repurchases in fiscal 2011. Other financing activities in both fiscal 2011 and fiscal 2010 consisted principally of repurchases of common stock from employees to satisfy withholding-tax obligations arising from the vesting of restricted stock awards, partially offset by cash provided by proceeds from exercises of stock options.
In fiscal 2009, we paid $41.2 million to repurchase a portion of our outstanding 3¾% convertible senior notes; $640,000 to repurchase a portion of our outstanding 7¼% redeemable convertible subordinated debentures; and $1.3 million to repurchase common stock on the open market, primarily under our 2008 stock repurchase plan.
Non-cash investing activities: Our primary non-cash investing activity in fiscal 2011 was the acquisition of assets under capital lease in the amount of $162,000. In the comparable prior-year period, we acquired assets under capital lease and through notes payable totaling $286,000.
Summary disclosures about contractual obligations and commercial commitments: The following table provides a summary of our contractual obligations and other commercial commitments as of March 25, 2011:
|
Contractual obligations
(in thousands)
|
Total
|
2012
|
2013 to 2014
|
2015 to 2016
|
After 2016
|
|||||||||||||||
|
Long-term debt
|
$ | 34,204 | $ | — | $ | 1,204 | $ | 33,000 | $ | — | ||||||||||
|
Interest on long-term debt
|
7,590 | 2,112 | 4,225 | 1,253 | — | |||||||||||||||
|
Operating leases
|
10,450 | 3,570 | 3,353 | 2,551 | 976 | |||||||||||||||
|
Capital leases
|
240 | 96 | 99 | 45 | — | |||||||||||||||
|
Total contractual obligations
|
$ | 52,484 | $ | 5,778 | $ | 8,881 | $ | 36,849 | $ | 976 | ||||||||||
Included in the operating lease amounts are payments on our former manufacturing facility. Of those payments, $435,000, representing the discounted value of the lease payments net of sublease income, is accrued in our restructure liability at March 25, 2011.
We have a contract with a third-party technology supplier that calls for payment by us of $2.5 million upon receipt of deliverables meeting certain conditions.
We have a long-term income tax liability for uncertain tax positions amounting to $601,000 at March 25, 2011. We cannot currently predict the date of settlement or payment, as the timing of resolution of our liability is highly uncertain.
In the normal course of business, we enter into contractual commitments to purchase services, materials, components, and finished goods from suppliers, mainly our primary contract manufacturer, Plexus. Under our agreement with Plexus, which runs through December 31, 2011, we maintain a level of control over parts procurement, design, documentation, and selection of approved suppliers. We are generally liable for any termination or cancellation of product orders, as well as excess and obsolete material, which can result, for example, from an engineering change, product obsolescence, or inaccurate component forecasting. Under the agreement, Plexus is to procure raw materials and begin manufacturing of products in accordance with our forecasts. If certain purchased raw materials or certain work-in-process items are held for greater than 90 days, we must make deposits on the aging inventory, although Plexus must make efforts to minimize our liability for the aging inventory, including returning materials to suppliers, canceling orders with suppliers, or using materials to manufacture product for its other customers. If raw material or in-process inventories are still unused and have been held for more than nine months, we must take ownership and pay for the aged inventory. Alternatively, if there is forecasted demand for such inventory, we must pay a management fee for Plexus to retain such inventory. If the forecasted demand does not materialize we must take ownership and pay for such inventory. This activity may increase our owned inventories.
At March 25, 2011, Plexus held inventory related to our products. Our deposit relating to this inventory was $4.2 million and reserves relating to this deposit were $1.3 million. Both the deposit and the related reserves are included in prepaid expenses and other assets on the consolidated balance sheets. Additional deposits may be required under the terms of the agreement.
Other contingencies: We have learned that some of our products may have been exported or re-exported in violation of U.S. export laws. Consequently, we have launched an internal investigation of our export-related activities, which is being performed by outside counsel. We will report the results of the investigation to the U.S. government. Certain issues subject to the investigation have already been reported to the U.S. government, and the U.S. government has closed a limited portion of the matter with the issuance of a warning letter. The results of the rest of the internal investigation will be reported to the U.S. government in due course. If the U.S. government finds that we have violated one or more export control laws or trade sanctions, we could be subject to various penalties. By statute, these penalties can include but are not limited to fines of up to $250,000 for each violation, denial of export privileges, and debarment from participation in U.S. government contracts. We believe, however, that our cooperation with the U.S. government, our immediate attention to rectifying the issues, and other factors provide a basis for mitigating any penalty that might be imposed. As a result of the discovery of these events, we have implemented more stringent export control procedures. We believe it is reasonably possible that we could incur a loss as a result of penalties relating to these events. However, at this time, we cannot determine an estimated cost, if any, or range of costs, for any such penalties or fines that may be incurred upon resolution of this matter. Accordingly, we have not made a provision for this matter.
We believe that our existing cash, cash equivalents and short-term investments will be sufficient to fund operations for at least the next twelve months. We believe the most strategic uses of our cash resources in the near term will include investments in new technologies, expansion of our sales capabilities, and working capital.
Off-Balance Sheet Arrangements:
Other than the commitments described above, there are no off-balance sheet arrangements that are reasonably likely to materially affect our financial condition, changes in financial condition, revenues or expenses, results of operations, liquidity, capital expenditures or capital resources.
Recently Issued Accounting Standards
See Note 1 of our Notes to Consolidated Financial Statements, Description of Business and Summary of Significant Accounting Policies, for recent accounting pronouncements, including the expected dates of adoption and estimated effects on our consolidated financial statements.
ITEM 7A. QUANTITATIVE AND QUALITATIVE DISCLOSURES ABOUT MARKET RISK
The following discussion about our market risk disclosure involves forward-looking statements. Actual results could differ materially from those projected in the forward-looking statements.
We use foreign exchange contracts to hedge significant accounts receivable and intercompany account balances denominated in foreign currencies. Market value gains and losses on these hedged contracts are substantially offset by fluctuations in the underlying balances being hedged. At March 25, 2011, our primary net foreign currency exposures were in Japanese yen, Euros and British pounds. The net financial impact of foreign exchange gains and losses are recorded in other income. Our policy is to not use hedges or other derivative financial instruments for speculative purposes.
We believe our hedging strategy will not have a significant effect on our business, operating results or financial condition. A 10% adverse change in the foreign currency rates affecting the contracts at their March 25, 2011 levels would decrease the fair value of the contracts by approximately $590,000 and if this occurred, the fair value of the underlying exposures hedged by the contracts should increase by a similar amount. However, we could have gains or losses in the future if our actual balances differ from the amounts hedged under foreign exchange contracts. The amount of such gains or losses would depend in part on the timing and amount of foreign currency exchange rate movements.
A portion of our investment portfolio is composed of income securities. These securities are subject to interest rate risk and will fall in value if market interest rates increase. A sensitivity analysis assuming a hypothetical increase or decrease of 10% from levels at March 25, 2011 and March 26, 2010 indicated the fair value of the portfolio would change by approximately $44,000 and $61,000 at March 25, 2011 and March 26, 2010, respectively. At March 25, 2011, the fair value of the short-term investments was $56.9 million compared to $75.5 million at March 26, 2010.
The fair market value of our 3¾% convertible senior notes and 7¼% redeemable convertible subordinated debentures are sensitive to changes in interest rates and to the prices of our common stock into which they can be converted as well as our financial stability. The yield to maturity on the debentures is fixed, therefore the interest expense on the debt does not fluctuate with interest rates. We have estimated the approximate fair value of these securities using recent quotes and trades. The fair value of the trading debt securities was approximately:
|
(in thousands)
|
Fiscal year ended
|
|||||||
|
March 25, 2011
|
March 26, 2010
|
|||||||
|
3¾% convertible senior notes
|
$ | 8,709 | $ | 7,980 | ||||
|
7¼% redeemable convertible subordinated debentures
|
$ | 21,334 | $ | 20,860 | ||||
ITEM 8. FINANCIAL STATEMENTS AND SUPPLEMENTARY DATA
Financial Highlights:
|
(dollars in thousands, except per share amounts)
|
Fiscal year ended
|
|||||||
|
Highlights
|
March 25, 2011
|
March 26, 2010
|
||||||
|
Total revenue
|
$
|
60,147
|
$
|
74,494
|
||||
|
Loss from operations
|
$
|
(24,838
|
)
|
$
|
(18,115
|
)
|
||
|
Net loss
|
$
|
(26,298
|
)
|
$
|
(17,843
|
)
|
||
|
Basic and diluted net loss per share
|
$
|
(0.88
|
)
|
$
|
(0.61
|
)
|
||
|
Working capital
|
$
|
64,882
|
$
|
85,604
|
||||
|
Total assets
|
$
|
89,371
|
$
|
117,686
|
||||
|
3¾% convertible senior notes
|
$
|
10,500
|
$
|
10,500
|
||||
|
7¼% convertible subordinated debentures
|
$
|
23,704
|
$
|
23,704
|
||||
|
Total stockholders’ equity
|
$
|
38,175
|
$
|
60,104
|
||||
|
Number of employees
|
234
|
247
|
||||||
Quarterly financial data (unaudited):
|
Fiscal quarter 2011
|
||||||||||||||||
|
First
|
Second
|
Third
|
Fourth
|
|||||||||||||
|
Total revenue
|
$
|
13,481
|
$
|
20,230
|
$
|
13,921
|
$
|
12,515
|
||||||||
|
Gross margin
|
$
|
4,748
|
$
|
9,907
|
$
|
5,059
|
$
|
5,037
|
||||||||
|
Net loss
|
$
|
(8,210
|
)
|
$
|
(3,394
|
)
|
$
|
(7,822
|
)
|
$
|
(6,872
|
)
|
||||
|
Basic and diluted net loss per share
|
$
|
(0.28
|
)
|
$
|
(0.11
|
)
|
$
|
(0.26
|
)
|
$
|
(0.23
|
)
|
||||
|
Fiscal quarter 2010
|
||||||||||||||||
|
First
|
Second
|
Third
|
Fourth
|
|||||||||||||
|
Total revenue
|
$
|
19,510
|
$
|
19,761
|
$
|
16,323
|
$
|
18,900
|
||||||||
|
Gross margin
|
$
|
8,872
|
$
|
7,803
|
$
|
6,536
|
$
|
9,391
|
||||||||
|
Net loss
|
$
|
(3,713
|
)
|
$
|
(4,184
|
)
|
$
|
(6,799
|
)
|
$
|
(3,147
|
)
|
||||
|
Basic and diluted net loss per share
|
$
|
(0.13
|
)
|
$
|
(0.14
|
)
|
$
|
(0.23
|
)
|
$
|
(0.11
|
)
|
||||
NETWORK EQUIPMENT TECHNOLOGIES, INC.
REPORT OF INDEPENDENT REGISTERED PUBLIC ACCOUNTING FIRM
To the Board of Directors and Stockholders of
Network Equipment Technologies, Inc.
Fremont, California
We have audited the accompanying consolidated balance sheets of Network Equipment Technologies, Inc. and subsidiaries (the “Company”) as of March 25, 2011 and March 26, 2010, and the related consolidated statements of operations, comprehensive loss, stockholders’ equity, and cash flows for each of the three years in the period ended March 25, 2011. Our audits also included the financial statement schedule listed in the Index at Item 15a(2). These consolidated financial statements and financial statement schedule are the responsibility of the Company’s management. Our responsibility is to express an opinion on these consolidated financial statements and financial statement schedule based on our audits.
We conducted our audits in accordance with the standards of the Public Company Accounting Oversight Board (United States). Those standards require that we plan and perform the audit to obtain reasonable assurance about whether the financial statements are free of material misstatement. An audit includes examining, on a test basis, evidence supporting the amounts and disclosures in the financial statements. An audit also includes assessing the accounting principles used and significant estimates made by management, as well as evaluating the overall financial statement presentation. We believe that our audits provide a reasonable basis for our opinion.
In our opinion, such consolidated financial statements present fairly, in all material respects, the financial position of Network Equipment Technologies, Inc. and subsidiaries as of March 25, 2011 and March 26, 2010, and the results of their operations and their cash flows for each of the three years in the period ended March 25, 2011, in conformity with accounting principles generally accepted in the United States of America. Also, in our opinion, such financial statement schedule, when considered in relation to the basic consolidated financial statements taken as a whole, presents fairly, in all material respects, the information set forth therein.
We have also audited, in accordance with the standards of the Public Company Accounting Oversight Board (United States), the Company’s internal control over financial reporting as of March 25, 2011, based on the criteria established in Internal Control — Integrated Framework issued by the Committee of Sponsoring Organizations of the Treadway Commission and our report dated June 7, 2011, expressed an unqualified opinion on the Company’s internal control over financial reporting.
/s/ DELOITTE & TOUCHE LLP
San Jose, California
June 7, 2011
NETWORK EQUIPMENT TECHNOLOGIES, INC.
CONSOLIDATED BALANCE SHEETS
|
(in thousands, except par value amounts)
|
March 25, 2011
|
March 26, 2010
|
||||||
|
Current assets:
|
||||||||
|
Cash and cash equivalents
|
$
|
2,367
|
$
|
4,953
|
||||
|
Short-term investments
|
56,860
|
75,508
|
||||||
|
Restricted cash
|
2,192
|
554
|
||||||
|
Accounts receivable, net of allowances of $234 at March 25, 2011 and $265 at March 26, 2010
|
8,701
|
13,468
|
||||||
|
Inventories
|
4,660
|
4,377
|
||||||
|
Prepaid expenses and other assets
|
5,860
|
7,961
|
||||||
|
Total current assets
|
80,640
|
106,821
|
||||||
|
Property and equipment:
|
||||||||
|
Machinery and equipment
|
29,801
|
31,355
|
||||||
|
Furniture and fixtures
|
4,228
|
4,285
|
||||||
|
Leasehold improvements
|
10,999
|
10,951
|
||||||
|
45,028
|
46,591
|
|||||||
|
Less: accumulated depreciation and amortization
|
(40,593
|
)
|
(41,436
|
)
|
||||
|
Property and equipment, net
|
4,435
|
5,155
|
||||||
|
Other assets
|
4,296
|
5,710
|
||||||
|
Total assets
|
$
|
89,371
|
$
|
117,686
|
||||
|
Current liabilities:
|
||||||||
|
Accounts payable
|
$
|
5,496
|
$
|
7,987
|
||||
|
Accrued liabilities
|
10,262
|
13,230
|
||||||
|
Total current liabilities
|
15,758
|
21,217
|
||||||
|
Long-term liabilities:
|
||||||||
|
3¾% convertible senior notes
|
10,500
|
10,500
|
||||||
|
7¼% redeemable convertible subordinated debentures
|
23,704
|
23,704
|
||||||
|
Capital lease obligation, less current portion
|
137
|
69
|
||||||
|
Other long-term liabilities
|
1,097
|
2,092
|
||||||
|
Total long-term liabilities
|
35,438
|
36,365
|
||||||
|
Commitments and contingencies – See Note 9
|
||||||||
|
Stockholders’ equity:
|
||||||||
|
Preferred stock ($0.01 par value; 5,000 shares authorized; none outstanding)
|
—
|
—
|
||||||
|
Common stock ($0.01 par value; 75,000 shares authorized; 30,389 and 30,060 shares outstanding at March 25, 2011 and March 26, 2010)
|
303
|
300
|
||||||
|
Additional paid-in capital
|
258,339
|
252,105
|
||||||
|
Treasury stock, at cost
|
(11,532
|
)
|
(10,374
|
)
|
||||
|
Accumulated other comprehensive loss
|
(2,108
|
)
|
(1,398
|
)
|
||||
|
Accumulated deficit
|
(206,827
|
)
|
(180,529
|
)
|
||||
|
Total stockholders’ equity
|
38,175
|
60,104
|
||||||
|
Total liabilities and stockholders’ equity
|
$
|
89,371
|
$
|
117,686
|
||||
See accompanying notes to consolidated financial statements
NETWORK EQUIPMENT TECHNOLOGIES, INC.
CONSOLIDATED STATEMENTS OF OPERATIONS
|
Fiscal Year Ended
|
||||||||||||
|
(in thousands, except per share amounts)
|
March 25, 2011
|
March 26, 2010
|
March 27, 2009
|
|||||||||
|
Revenue:
|
||||||||||||
|
Product
|
$
|
45,909
|
$
|
58,142
|
$
|
51,202
|
||||||
|
Service and other
|
14,238
|
16,352
|
14,586
|
|||||||||
|
Total revenue
|
60,147
|
74,494
|
65,788
|
|||||||||
|
Costs of revenue:
|
||||||||||||
|
Cost of product revenue
|
24,396
|
27,934
|
30,772
|
|||||||||
|
Cost of service and other revenue
|
11,000
|
13,958
|
14,415
|
|||||||||
|
Impairment of long-lived assets
|
—
|
—
|
10,061
|
|||||||||
|
Total cost of revenue
|
35,396
|
41,892
|
55,248
|
|||||||||
|
Gross margin
|
24,751
|
32,602
|
10,540
|
|||||||||
|
Operating expenses:
|
||||||||||||
|
Sales and marketing
|
19,582
|
19,647
|
21,161
|
|||||||||
|
Research and development
|
19,212
|
19,229
|
21,817
|
|||||||||
|
General and administrative
|
10,514
|
11,824
|
13,120
|
|||||||||
|
Restructure and other costs
|
281
|
17
|
2,423
|
|||||||||
|
Impairment of goodwill
|
—
|
—
|
27,441
|
|||||||||
|
Impairment of long-lived assets
|
—
|
—
|
6,756
|
|||||||||
|
Total operating expenses
|
49,589
|
50,717
|
92,718
|
|||||||||
|
Loss from operations
|
(24,838
|
)
|
(18,115
|
)
|
(82,178
|
)
|
||||||
|
Interest income
|
888
|
1,514
|
3,660
|
|||||||||
|
Interest expense
|
(2,215
|
)
|
(2,271
|
)
|
(3,862
|
)
|
||||||
|
Other income (expense), net
|
(2
|
)
|
1,101
|
28,944
|
||||||||
|
Loss before taxes
|
(26,167
|
)
|
(17,771
|
)
|
(53,436
|
)
|
||||||
|
Income tax provision
|
131
|
72
|
67
|
|||||||||
|
Net loss
|
$
|
(26,298
|
)
|
$
|
(17,843
|
)
|
$
|
(53,503
|
)
|
|||
|
Basic and diluted net loss per share
|
$
|
(0.88
|
)
|
$
|
(0.61
|
)
|
$
|
(1.85
|
)
|
|||
|
Common and common equivalent shares, basic and diluted
|
29,924
|
29,178
|
28,854
|
|||||||||
See accompanying notes to consolidated financial statements
NETWORK EQUIPMENT TECHNOLOGIES, INC.
CONSOLIDATED STATEMENTS OF COMPREHENSIVE LOSS
|
Fiscal Year Ended
|
||||||||||||
|
(in thousands)
|
March 25, 2011
|
March 26, 2010
|
March 27, 2009
|
|||||||||
|
Net loss
|
$
|
(26,298
|
)
|
$
|
(17,843
|
)
|
$
|
(53,503
|
)
|
|||
|
Other comprehensive loss:
|
||||||||||||
|
Foreign currency translation adjustments
|
(452
|
)
|
250
|
(2,030
|
)
|
|||||||
|
Gross unrealized holding gains (losses) on available-for-sale securities
|
(76
|
)
|
183
|
113
|
||||||||
|
Less: Reclassification adjustments for gains included in net loss
|
(182
|
)
|
(569
|
)
|
(450
|
)
|
||||||
|
Comprehensive loss
|
$
|
(27,008
|
)
|
$
|
(17,979
|
)
|
$
|
(55,870
|
)
|
|||
See accompanying notes to consolidated financial statements
NETWORK EQUIPMENT TECHNOLOGIES, INC.
CONSOLIDATED STATEMENTS OF CASH FLOWS
|
Fiscal Year Ended
|
||||||||||||
|
(in thousands)
|
March 25, 2011
|
March 26, 2010
|
March 27, 2009 | |||||||||
|
Cash and cash equivalents at beginning of period
|
$
|
4,953
|
$
|
15,589
|
$
|
44,246
|
||||||
|
Cash flows from operating activities:
|
||||||||||||
|
Net loss
|
(26,298
|
)
|
(17,843
|
)
|
(53,503
|
)
|
||||||
|
Adjustments required to reconcile net loss to net cash used in operating activities:
|
||||||||||||
|
Depreciation, amortization, and accretion
|
2,469
|
3,308
|
5,674
|
|||||||||
|
Impairment of goodwill and long-lived assets
|
—
|
—
|
44,258
|
|||||||||
|
Stock-based compensation expense
|
5,950
|
5,789
|
4,428
|
|||||||||
|
Gain on extinguishment of debt
|
—
|
(555
|
)
|
(28,929
|
)
|
|||||||
|
Loss on disposition of property and equipment
|
29
|
87
|
43
|
|||||||||
|
Provision for deferred income taxes
|
195
|
—
|
590
|
|||||||||
|
Other
|
(1
|
)
|
(8
|
)
|
—
|
|||||||
|
Changes in assets and liabilities:
|
||||||||||||
|
Accounts receivable
|
4,767
|
(6,377
|
)
|
16,083
|
||||||||
|
Inventories
|
(283
|
)
|
868
|
4,741
|
||||||||
|
Prepaid expenses and other assets
|
2,823
|
2,475
|
(4,031
|
)
|
||||||||
|
Accounts payable
|
(2,486
|
)
|
3,733
|
(5,718
|
)
|
|||||||
|
Accrued and other long-term liabilities
|
(3,919
|
)
|
(4,331
|
)
|
(4,686
|
)
|
||||||
|
Net cash used in operating activities
|
(16,754
|
)
|
(12,854
|
)
|
(21,050
|
)
|
||||||
|
Cash flows from investing activities:
|
||||||||||||
|
Purchase of short-term investments
|
(43,314
|
)
|
(62,894
|
)
|
(62,520
|
)
|
||||||
|
Proceeds from sales and maturities of short-term investments
|
61,705
|
68,432
|
102,163
|
|||||||||
|
Purchases of property and equipment
|
(1,563
|
)
|
(1,737
|
)
|
(1,041
|
)
|
||||||
|
Changes in restricted cash
|
(1,637
|
)
|
608
|
(1,154
|
)
|
|||||||
|
Net cash provided by investing activities
|
15,191
|
4,409
|
37,448
|
|||||||||
|
Cash flows from financing activities:
|
||||||||||||
|
Issuance of common stock
|
700
|
661
|
58
|
|||||||||
|
Repurchase of common stock
|
(1,161
|
)
|
(1,200
|
)
|
(1,339
|
)
|
||||||
|
Payments under capital lease and note payable obligations
|
(105
|
)
|
(27
|
)
|
—
|
|||||||
|
Repurchase of 3¾% convertible senior notes
|
—
|
(1,875
|
)
|
(41,176
|
)
|
|||||||
|
Repurchase of 7¼% redeemable convertible subordinated debentures
|
—
|
—
|
(640
|
)
|
||||||||
|
Net cash used in financing activities
|
(566
|
)
|
(2,441
|
)
|
(43,097
|
)
|
||||||
|
Effect of exchange rate changes on cash
|
(457
|
)
|
250
|
(1,958
|
)
|
|||||||
|
Net decrease in cash and cash equivalents
|
(2,586
|
)
|
(10,636
|
)
|
(28,657
|
)
|
||||||
|
Cash and cash equivalents at end of period
|
$
|
2,367
|
$
|
4,953
|
$
|
15,589
|
||||||
|
Other cash flow information:
|
||||||||||||
|
Cash paid during the period for interest
|
$
|
2,128
|
$
|
2,163
|
$
|
4,479
|
||||||
|
Non-cash investing activities:
|
||||||||||||
|
Net unrealized loss on available-for-sale securities
|
$
|
(258
|
)
|
$
|
(386
|
)
|
$
|
(337
|
)
|
|||
|
Assets acquired under capital lease
|
$
|
162
|
$
|
145
|
$
|
—
|
||||||
|
Assets acquired through note payable
|
$
|
—
|
$
|
141
|
$
|
—
|
||||||
See accompanying notes to consolidated financial statements
NETWORK EQUIPMENT TECHNOLOGIES, INC.
CONSOLIDATED STATEMENTS OF STOCKHOLDERS’ EQUITY
|
(in thousands)
|
Accumulated Other Comprehensive
Income (Loss)
|
|||||||||||||||||||||||||||||||
|
Common Stock
|
Additional Paid-in
Capital
|
Treasury
Stock
|
||||||||||||||||||||||||||||||
|
Shares
|
Amount
|
Cumulative
Translation
Adjustments
|
Unrealized Gain (Loss) on
Securities
|
Accumulated
Deficit
|
Total
Stockholders’
Equity
|
|||||||||||||||||||||||||||
|
Balances, March 28, 2008
|
29,248 | $ | 292 | $ | 241,171 | $ | (7,842 | ) | $ | — | $ | 1,105 | $ | (109,183 | ) | $ | 125,543 | |||||||||||||||
|
Issuance and sale of common stock under stock-based compensation plans
|
305 | 3 | 55 | — | — | — | — | 58 | ||||||||||||||||||||||||
|
Stock-based compensation
|
— | 4,428 | — | — | — | — | 4,428 | |||||||||||||||||||||||||
|
Repurchase of common stock
|
(360 | ) | (4 | ) | — | (1,335 | ) | — | — | — | (1,339 | ) | ||||||||||||||||||||
|
Net unrealized loss on available-for-sale securities
|
— | — | — | — | (337 | ) | — | (337 | ) | |||||||||||||||||||||||
|
Cumulative translation adjustment
|
— | — | — | (2,030 | ) | — | — | (2,030 | ) | |||||||||||||||||||||||
|
Net loss
|
— | — | — | — | — | (53,503 | ) | (53,503 | ) | |||||||||||||||||||||||
|
Balances, March 27, 2009
|
29,193 | 291 | 245,654 | (9,177 | ) | (2,030 | ) | 768 | (162,686 | ) | 72,820 | |||||||||||||||||||||
|
Issuance and sale of common stock under stock-based compensation plans
|
1,151 | 12 | 649 | — | — | — | — | 661 | ||||||||||||||||||||||||
|
Stock-based compensation
|
— | 5,898 | — | — | — | — | 5,898 | |||||||||||||||||||||||||
|
Net unrealized loss on available-for-sale securities
|
— | — | — | — | (386 | ) | — | (386 | ) | |||||||||||||||||||||||
|
Repurchase of common stock
|
(268 | ) | (3 | ) | — | (1,197 | ) | — | — | — | (1,200 | ) | ||||||||||||||||||||
|
Stock returned in connection with escrow settlements
|
(16 | ) | — | (96 | ) | — | — | — | — | (96 | ) | |||||||||||||||||||||
|
Cumulative translation adjustment
|
— | — | — | 250 | — | — | 250 | |||||||||||||||||||||||||
|
Net loss
|
— | — | — | — | — | (17,843 | ) | (17,843 | ) | |||||||||||||||||||||||
|
Balances, March 26, 2010
|
30,060 | 300 | 252,105 | (10,374 | ) | (1,780 | ) | 382 | (180,529 | ) | 60,104 | |||||||||||||||||||||
|
Issuance and sale of common stock under stock-based compensation plans
|
701 | 7 | 693 | — | — | — | — | 700 | ||||||||||||||||||||||||
|
Stock-based compensation
|
— | 5,950 | — | — | — | — | 5,950 | |||||||||||||||||||||||||
|
Net unrealized loss on available-for-sale securities
|
— | — | — | — | (258 | ) | — | (258 | ) | |||||||||||||||||||||||
|
Repurchase of common stock
|
(296 | ) | (3 | ) | — | (1,158 | ) | — | — | — | (1,161 | ) | ||||||||||||||||||||
|
Stock returned in connection with escrow settlements
|
(76 | ) | (1 | ) | (409 | ) | — | — | — | — | (410 | ) | ||||||||||||||||||||
|
Cumulative translation adjustment
|
— | — | — | (452 | ) | — | — | (452 | ) | |||||||||||||||||||||||
|
Net loss
|
— | — | — | — | — | (26,298 | ) | (26,298 | ) | |||||||||||||||||||||||
|
Balances, March 25, 2011
|
30,389 | $ | 303 | $ | 258,339 | $ | (11,532 | ) | $ | (2,232 | ) | $ | 124 | $ | (206,827 | ) | $ | 38,175 | ||||||||||||||
See accompanying notes to consolidated financial statements
NETWORK EQUIPMENT TECHNOLOGIES, INC.
NOTES TO CONSOLIDATED FINANCIAL STATEMENTS
Note 1. Description of Business and Summary of Significant Accounting Policies
Nature of Business: Network Equipment Technologies, Inc. (the Company or NET) provides network and VoIP solutions to enterprises and government agencies that seek to reduce the cost to deploy next generation unified and secure communications applications. For over a quarter of a century, NET has delivered solutions for multi-service networks requiring high degrees of versatility, security and performance. Today, the Company’s broad family of products enables interoperability and integration with existing networks for migration to secure IP-based communications. Broadening NET’s voice solutions, Quintum Technologies (Quintum), now a part of NET, is a VoIP innovator whose applications bring the reliability and clarity of public telephone networks to Internet telephony and unified communications. NET was founded in 1983.
Principles of Consolidation: The consolidated financial statements include the accounts of the Company and its wholly-owned subsidiaries. All intercompany balances and transactions have been eliminated.
Segments: The Company’s management uses consolidated financial information in determining how to allocate resources and assess performance. For this reason, the Company has determined that it is engaged in a single reportable segment.
Basis of Presentation: The Company’s fiscal year ends on the last Friday in March. In most years, including fiscal 2011, 2010 and 2009, the fiscal year is 52 weeks, with each quarter comprised of thirteen weeks, which allows comparability of quarter over quarter results.
Revenue Recognition: The Company recognizes product revenue when all four of the following criteria are met:
1) the Company has a contract with its customer,
2) the product has been shipped as required by the contract and risk of loss has passed to the customer,
3) the price is fixed or determinable, and
4) collection of payment is probable.
If the customer has a right of acceptance and the Company has not yet obtained acceptance, revenue is deferred until the terms of acceptance are satisfied. When product revenue is deferred, the Company also defers the associated cost of goods until the revenue is recognized. The Company recognizes service revenue upon completion of the service or, for ongoing services such as maintenance, ratably over the period of the contract. For sales arrangements that involve multiple elements to be delivered at different times, such as a sale of equipment together with post-contract support services, the Company assigns revenue to each element based on its fair value and recognizes revenue for each element as the criteria for recognition are met. Fair value for each element is determined by vendor-specific objective evidence, if available, such as the sales price charged when the same element is sold separately or otherwise by the residual method, whereby the value of delivered elements is determined by subtracting the fair value of the undelivered elements from the total value of the arrangement. If vendor-specific objective evidence of fair value of one or more undelivered elements does not exist, revenue on the entire arrangement is deferred and is recognized only upon delivery of those elements or when fair value has been established. The Company reports revenue net of sales taxes.
Through a contractual arrangement with the Company, CACI International Inc. (CACI) had certain rights to provide maintenance and other services to the Company’s federal government customers. Under this arrangement, both companies sold services for NET products, other than the Quintum Series products, and each company was responsible for various aspects of service delivery. CACI was responsible for maintenance support for first-level calls and on-site repairs, NET provided spares logistics and bug fixes; and both companies provided training services. Under a revenue-sharing arrangement, revenue from maintenance and training services was shared between both companies, regardless of which company sold the services. The receipts from sales of these services were shared based on a pre-determined percentage, which was 37% for NET and 63% for CACI at the time of the termination of the agreement. Therefore, 63% of NET’s receipts that were subject to the agreement were remitted to CACI, and conversely, 37% of CACI’s receipts that were subject to the agreement were remitted to the Company. Receipts from sales of training services were shared based on sales volumes but training services revenues were not significant for either NET or CACI. The Company recorded amounts derived from sales by NET as gross revenue and recorded amounts remitted to NET by CACI as net revenue. This arrangement expired December 1, 2010, and since then, the Company has performed these services itself and retained all the revenue associated with these services.
NETWORK EQUIPMENT TECHNOLOGIES, INC.
NOTES TO CONSOLIDATED FINANCIAL STATEMENTS
(Continued)
Revenue on sales through resellers is recognized upon transfer of title to the reseller. Many of the sales to the Company’s resellers are based upon firm commitments from their end customer; as a result, these resellers carry little or no NET stock. For the Company’s Promina, VX, NX, and UX products, NET’s customers generally do not have the right to return the equipment. For the Company’s Tenor product line, NET customers are subject to agreements allowing for limited rights of return and price protection. Accordingly, revenues are reduced for the Company’s estimates of liability related to these rights. The estimate for returns is recorded at the time the related sale is recognized and is adjusted periodically based on historical rates of returns and other related factors. The reserves for price protection are recorded at the time these programs are offered. Price protection is estimated based on specific programs, expected usage and historical experience.
For a contract related to funded research and development activities, the Company recognized revenue and related costs in accordance with the provisions of the Financial Accounting Standards Board (FASB) Accounting Standards Codification (ASC) Topic 605, Revenue Recognition. NET accounted for this contract using the completed contract method because management determined that reasonable estimates of gross profit and percentage of completion were not available. All revenues and related costs were deferred until the contract was completed. Because the completed contract method precludes recognition of performance under the contract as the work progresses, it does not reflect current financial performance when the contract extends beyond one accounting period, and it therefore may result in uneven recognition of revenue, related cost of revenues and gross margin.
Revenue relating to multi-year contracts that are subject to review at the end of the contract period is recognized after the final review is complete.
Financial Statement Estimates: The preparation of financial statements in conformity with accounting principles generally accepted in the United States of America requires management to make estimates and assumptions that affect the reported amounts of assets and liabilities and disclosure of contingent assets and liabilities at the date of the financial statements and the reported amounts of revenue and expenses during the reporting period. Such management estimates and assumptions include, but are not limited to: assumptions related to contracts that have multiple elements, the allowances for sales returns and potentially uncollectible accounts receivable, the valuation of intangibles, inventories, warranty costs, the valuation allowance on deferred tax assets, certain reserves and accruals, estimated lives of depreciable and amortizable assets, and assumptions related to stock-based compensation. Actual results could differ from those estimates.
Cash and Cash Equivalents: Cash and cash equivalents include highly liquid investments with original maturities of three months or less at the time of acquisition. The Company, at times, maintains cash balances in excess of the federally insured limit of $250,000.
Short-term Investments: Short-term investments are primarily composed of highly liquid investments with original maturities of greater than three months at the time of acquisition. The Company classifies its short-term cash investments as available-for-sale securities. The carrying value of such securities is carried at fair market value with unrealized gains and losses being excluded from earnings and reported as a separate component of stockholders’ equity. Realized gains and losses on the sale or maturity of short-term investments are determined on the basis of specific identification.
Restricted Cash: Restricted cash consists of cash collateral related to letters of credit for leases in the United States.
Allowance for Sales Returns: A reserve for sales returns is established for primarily reseller and distributor customers, based on actual historical product returns.
Credit Risk and Allowance for Doubtful Accounts: The Company’s credit evaluation process and the reasonably short collection terms help mitigate credit risk. The Company typically does not require collateral or other security to support accounts receivable. The Company performs ongoing credit evaluations of its customers’ financial condition and limits the amount of credit extended when deemed necessary. The Company maintains reserves for known recourse obligations and estimated bad debts. The allowance for doubtful accounts receivable is based on the assessment of the collectability of specific customer accounts and the aging of accounts receivable. Credit losses have historically been within the Company's expectations and established allowances for doubtful accounts receivable.
Inventories: Inventories are stated at the lower of cost (first-in, first-out) or market and include material, labor and manufacturing overhead costs.
Property and Equipment: Property and equipment are stated at cost. Depreciation is computed using the straight-line method over estimated useful lives of generally three to ten years. Leasehold improvements are amortized over the shorter of the respective lease terms or estimated useful lives.
NETWORK EQUIPMENT TECHNOLOGIES, INC.
NOTES TO CONSOLIDATED FINANCIAL STATEMENTS
(Continued)
Software Development Costs: Capitalization of software development costs begins upon the establishment of technological feasibility for the products, and amortization begins when the products are available for release to customers. The Company assesses the recoverability of capitalized software development costs in light of many factors, including anticipated future revenue, estimated economic useful lives and changes in software and hardware technologies. The Company did not capitalize internal software development costs in fiscal years 2011, 2010 or 2009. Software development costs are amortized over the lives of the products, generally three years.
Goodwill and indefinite-lived intangible assets: Goodwill and intangible assets with indefinite useful lives are not amortized, but instead are tested for impairment annually, or more frequently if impairment indicators arise. Impairment indicators arise when events or changes in circumstances indicate that the carrying value of the asset may not be recoverable, such as a significant downturn in industry or economic trends with a direct impact on the business, an expectation that a reporting unit will be sold or otherwise disposed of for less than the carrying value, loss of key personnel, or a significant decline in the market price of an asset or asset group. Impairment of goodwill is tested at a reporting unit level using a two-step process. Impairment of indefinite-lived intangible assets is tested at the unit of accounting level by comparing fair value to its carrying value. Goodwill was fully impaired in fiscal 2009 as part of the Company’s impairment analysis.
Long-lived asset: The Company reviews long-lived assets, including intangible assets with finite lives, property and equipment, and other assets for impairment whenever events or changes in circumstances indicate that the carrying amount of an asset may not be recoverable. Conditions that would necessitate an impairment assessment include a significant decline in the market price of an asset or asset group, a significant adverse change in the extent or manner in which an asset or asset group is being used, the loss of legal ownership or title to the asset, significant negative industry or economic trends or the presence of other factors that would indicate that the carrying amount of an asset or asset group is not recoverable. The Company considers a long-lived asset to be impaired if the estimated undiscounted future cash flows resulting from the use of the asset and its eventual disposition are not sufficient to recover the carrying value of the asset. If the Company deems an asset to be impaired, the amount of the impairment loss represents the excess of the asset’s carrying value compared to its estimated fair value. Intangible assets were fully impaired in fiscal 2009 as part of the Company’s impairment analysis.
At March 25, 2011 and at March 26, 2010, the Company’s balance sheets included no goodwill or intangible assets.
Warranty Accruals: The Company warrants hardware product, generally for twelve months, and software, generally for 90 days. The software warranty entitles the customer to bug fixes but not software upgrades during the warranty period. The Company’s methodology is to accrue warranty expense based on historical expense trends calculated as a percentage of product sales. Actual expenses are charged against the accrual in the period they are incurred. On a quarterly basis, the warranty accrual is analyzed for adequacy based on actual trends and subsequent adjustments are made as necessary.
Foreign Currency: The functional currency for the Company’s foreign subsidiaries is the local currency. Assets and liabilities of foreign subsidiaries are translated into U.S. dollars at the rates of exchange in effect at the end of the period. Revenue and expenses are translated into dollars at the average exchange rate during the period. Gains and losses from foreign currency translation are included in a separate account in stockholders' equity in the consolidated balance sheets.
Foreign exchange transaction gains and losses, substantially all of which relate to intercompany activity between us and our foreign subsidiaries, amounted to losses of $180,000, $45,000 and $428,000 in 2011, 2010 and 2009, respectively. These losses are included in other income (expense) in the accompanying consolidated statements of operations.
Loss Contingencies: The Company is subject to the possibility of various loss contingencies arising in the ordinary course of business. Management considers the likelihood of loss related to an asset, or the incurrence of a liability, as well as its ability to reasonably estimate the amount of loss, in determining loss contingencies. An estimated loss contingency is accrued when it is probable that an asset has been impaired or a liability has been incurred and the amount of loss can be reasonably estimated. The Company records a charge equal to the minimum estimated liability or a loss contingency only when both of the following conditions are met: (i) information available prior to issuance of the consolidated financial statements indicates that it is probable that an asset had been impaired or a liability had been incurred at the date of the financial statements, and (ii) the range of loss can be reasonably estimated. The Company regularly evaluates current information available to determine whether such accruals should be adjusted and whether new accruals are required.
The Company provides disclosure when it is reasonably possible that a loss will be incurred or when it is reasonably possible that the amount of a loss will exceed the recorded provision. In such cases, management assesses whether a reasonable estimate of the loss or range of the loss can be made. If the loss or range of loss can be estimated, the Company does so. If management concludes the loss or range of loss cannot be estimated, the Company discloses its conclusion in that regard.
NETWORK EQUIPMENT TECHNOLOGIES, INC.
NOTES TO CONSOLIDATED FINANCIAL STATEMENTS
(Continued)
From time to time, the Company is involved in disputes, litigation, and other legal actions. The Company is aggressively defending its current litigation matters. However, there are many uncertainties associated with any litigation and these actions or other third-party claims against the Company may cause the Company to incur costly litigation and/or substantial settlement charges. If any of those events were to occur, the Company’s business, financial condition, results of operations, and cash flows could be adversely affected. The actual liability in any such matters may be materially different from the Company’s estimates, which could result in the need to adjust the liability and record additional expenses.
Stock-based Compensation: The Company recognizes stock-based compensation expense for all share-based payment awards including employee stock options and restricted stock awards, in accordance with FASB ASC Topic 718, Compensation – Stock Compensation. Stock-based compensation expense for expected-to-vest stock-based awards is valued under the single-option approach and amortized on a straight-line basis, net of estimated forfeitures. The value of the portion of the award that is ultimately expected to vest is recognized as expense over the requisite service periods in the Company’s consolidated statements of operations for all periods presented.
The Company estimates the fair value of stock options granted using the Black-Scholes option-pricing formula and a single option award approach. The fair value is amortized on a straight-line basis over the requisite service periods of the awards, which is generally the vesting period. The Company’s computation of expected volatility is based on historical volatility commensurate with the expected term of the options. The risk-free interest rate used in the Black-Scholes option-pricing formula is based on the implied yield currently available on U.S. Treasury securities with an equivalent remaining term commensurate with the expected term of the options. The expected dividend assumption is based on the Company’s current expectations about future dividends and the Company does not expect to pay out cash dividends in the foreseeable future. The Company estimated the expected term of options granted in fiscal 2011, 2010 and 2009 using vesting periods of awards and historical data such as past experience and post vesting cancellations. The Company believes these calculations provide reasonable estimates of expected life for stock–based awards to employees.
Comprehensive Loss —ASC 220 - Reporting Comprehensive Income establishes standards for the reporting and displaying of comprehensive income (loss) and its components. Comprehensive loss includes foreign currency translation adjustments, gross unrealized holding gains (losses) on available-for-sale securities, and reclassification adjustments for gains included in net loss.
Subsequent to the issuance of the 2010 consolidated financial statements, the Company determined that gross unrealized holding gains (losses) on available-for-sale securities were understated by $342,000 and reclassification adjustments for gains included in net loss were overstated by the same amount. Accordingly, the Company has corrected this error on the consolidated statement of comprehensive loss as follows:
|
|
·
|
Gross unrealized holding gains (losses) on available-for-sale securities for fiscal 2010 originally reported of $(159,000) were corrected to $183,000; and
|
|
|
·
|
Reclassification adjustments for gains included in net loss for fiscal 2010 originally reported of $(227,000) were corrected to $(569,000).
|
The corrections did not affect the total comprehensive loss previously reported. The foregoing corrections are not considered material by the Company.
Derivatives: The Company does not use derivative financial instruments for speculative or trading purposes. Where available, the Company enters into foreign exchange forward contracts to hedge certain balance sheet exposures and intercompany balances against future movement in foreign exchange rates. Gains and losses on the foreign exchange contracts are included in other income(expense), net, which offset foreign exchange gains or losses from revaluation of foreign currency-denominated balance sheet items and intercompany balances.
Recently Issued Accounting Standards: In October 2009, the Financial Accounting Standards Board (FASB) issued new accounting guidance with respect to revenue recognition: ASU No. 2009-13, Topic 605 — Multiple-Deliverable Revenue Arrangements; and ASU No. 2009-14, Topic 985 — Certain Revenue Arrangements That Include Software Elements. When adopted, these accounting standards may be applied either prospectively or retrospectively. The Company will adopt this new guidance as of the mandatory adoption date of March 26, 2011, the beginning of the Company’s fiscal 2012, and is currently evaluating the impact on its consolidated financial statements.
In January 2010, the FASB issued new accounting guidance to amend and clarify existing guidance related to fair value measurements and disclosures: ASU No. 2010-06 — Improving Disclosures about Fair Value Measurements. This guidance requires entities to separately present purchases, sales, issuances, and settlements in their reconciliation of Level 3 fair value measurements (i.e., to present such items on a gross basis rather than on a net basis), and clarifies existing disclosure requirements regarding the level of disaggregation and the inputs and valuation techniques used to measure fair value for measurements that fall within either Level 2 or Level 3 of the fair value hierarchy. The Company adopted the provisions of this guidance effective March 27, 2010, except for the requirement to disclose purchases, sales, issuances, and settlements related to Level 3 measurements, which the Company will adopt in the first quarter of fiscal 2012.
NETWORK EQUIPMENT TECHNOLOGIES, INC.
NOTES TO CONSOLIDATED FINANCIAL STATEMENTS
(Continued)
Note 2. Goodwill and Long-lived Assets
Fiscal 2009 Impairment: The Company performed an impairment analysis of its goodwill and long-lived assets in fiscal 2009, pursuant to FASB ASC 350, Intangibles – Goodwill and Other and FASB ASC 360, Property, Plant, and Equipment. As a result of this impairment analysis, the Company recorded impairment charges of $16.8 million, which are included in the captions “Impairment of long-lived assets” in the accompanying consolidated statements of operations. Of the total long-lived asset impairment recorded in fiscal 2009, $12.5 million related to assets recorded in connection with the purchase of Quintum, $3.7 million related to a license and development agreement, $258,000 related to property and equipment and $320,000 related to prepaid licenses acquired by Quintum which were determined not to have value as the Company integrated product strategies. Also as a result of this impairment analysis, the Company recognized a goodwill impairment loss in the amount of $27.4 million which was the excess of the carrying value of goodwill over its implied fair value.
License and Development Agreement: In October 2005, the Company entered into a license and development agreement with a third-party technology supplier, under which the Company acquired a license to manufacture and distribute the supplier’s high-speed networking platform. In June 2007, the agreement was amended to include an additional, more advanced, platform. Under the 2005 agreement and the 2007 amendment, each party agreed to perform development and other activities to bring new products to market and the Company obtained certain rights to market these products. Under the 2005 agreement, the Company paid $3.0 million in license and development fees and capitalized the amount in other assets in the accompanying consolidated balance sheets. The Company began amortizing this amount in the second half of fiscal 2007 concurrent with the sale of the initial platform. Under the 2007 amendment, the Company agreed to pay an additional $5.0 million in four equal installments to the supplier for the advanced platform and an extended exclusive right to market. The first two installments were paid in fiscal 2008 and the remaining two will be due at separate future dates dependent upon the supplier’s delivery of future enhancements of the advanced platform. The Company believes it is unlikely the remaining two installments will become due or be paid.
In fiscal 2009 the Company performed an impairment analysis in accordance with the provisions of FASB ASC 360, Property, Plant, and Equipment and determined the fair value of the license and development agreement and related other assets to be zero. Accordingly, the Company recorded an impairment charge of $3.7 million in fiscal 2009, representing the full net book value of the license and development agreement and other related assets. As a result of this impairment charge, there will be no future amortization expense relating to the amounts already paid under the license and development agreement. Prior to the impairment, amortization of $422,000 was recorded for fiscal 2009 and was included in the cost of product revenue.
At March 25, 2011 and March 26, 2010, the Company’s balance sheets included no goodwill or intangible assets.
Note 3. Financial Instruments
Short-term investments at March 25, 2011 and March 26, 2010 consisted of the following:
|
(in thousands)
|
Amortized
Cost
|
Gross
Unrealized
Gains
|
Gross
Unrealized
Losses
|
Fair
Value
|
||||||||||||
|
2011
|
||||||||||||||||
|
U.S. Treasury notes
|
$ | 3,222 | $ | 10 | $ | (1 | ) | $ | 3,231 | |||||||
|
U.S. government agencies
|
17,297 | 34 | (15 | ) | 17,316 | |||||||||||
|
Corporate notes and bonds
|
20,507 | 66 | (13 | ) | 20,560 | |||||||||||
| Asset backed securities | 14,187 | 61 | (21 | ) | 14,227 | |||||||||||
|
Other debt securities
|
1,523 | 4 | (1 | ) | 1,526 | |||||||||||
| $ | 56,736 | $ | 175 | $ | (51 | ) | $ | 56,860 | ||||||||
|
2010
|
||||||||||||||||
|
U.S. Treasury notes
|
$ | 1,251 | $ | 2 | $ | (3 | ) | $ | 1,250 | |||||||
|
U.S. government agencies
|
22,569 | 146 | (3 | ) | 22,712 | |||||||||||
|
Corporate notes and bonds
|
41,471 | 230 | (14 | ) | 41,687 | |||||||||||
| Asset backed securities | 8,082 | 30 | - | 8,112 | ||||||||||||
|
Other debt securities
|
1,753 | - | (6 | ) | 1,747 | |||||||||||
| $ | 75,126 | $ | 408 | $ | (26 | ) | $ | 75,508 | ||||||||
NETWORK EQUIPMENT TECHNOLOGIES, INC.
NOTES TO CONSOLIDATED FINANCIAL STATEMENTS
(Continued)
The maturities of short-term investments at March 25, 2011 are as follows:
|
(in thousands)
|
Amortized
Cost
|
Fair
Value
|
||||||
|
Maturing in one year
|
$
|
18,450
|
$
|
18,533
|
||||
|
Maturing in one to five years
|
38,276
|
38,317
|
||||||
|
Maturing in five to ten years
|
—
|
—
|
||||||
|
Maturing after ten years
|
10
|
10
|
||||||
|
Total
|
$
|
56,736
|
$
|
56,860
|
||||
Unrealized gain positions for short-term investments held twelve months or more were $187,000 and $196,000 at March 25, 2011 and March 26, 2010, respectively.
The following table summarizes the financial assets and liabilities of the Company measured at fair value on a recurring basis:
|
(in thousands)
|
Fair Value Measurements at
March 25, 2011, using
|
|||||||||||
|
Balance as of
March 25, 2011
|
Level 1
|
Level 2
|
||||||||||
|
Assets:
|
||||||||||||
|
U.S. Treasury notes(1)
|
$
|
3,231
|
$
|
3,231
|
$
|
—
|
||||||
|
U.S. government agencies(1)
|
17,316
|
—
|
17,316
|
|||||||||
|
Corporate notes and bonds(1)
|
20,560
|
—
|
20,560
|
|||||||||
|
Asset backed securities(1)
|
14,227 |
—
|
14,227 | |||||||||
|
Other debt securities(1)
|
1,526
|
—
|
1,526
|
|||||||||
|
56,860
|
3,231
|
53,629
|
||||||||||
|
Foreign currency derivatives(2)
|
31
|
—
|
31
|
|||||||||
|
Total
|
$
|
56,891
|
$
|
3,231
|
$
|
53,660
|
||||||
|
Liabilities:
|
||||||||||||
|
Foreign currency derivatives(3)
|
$
|
112
|
$
|
—
|
$
|
112
|
||||||
|
Total
|
$
|
112
|
$
|
—
|
$
|
112
|
||||||
|
(in thousands)
|
Fair Value Measurements at
March 26, 2010, using
|
|||||||||||
|
Balance as of
March 26, 2010
|
Level 1
|
Level 2
|
||||||||||
|
Assets:
|
||||||||||||
|
U.S. Treasury notes(1)
|
$
|
1,250
|
$
|
1,250
|
$
|
—
|
||||||
|
U.S. government agencies(1)
|
22,712
|
—
|
22,712
|
|||||||||
|
Corporate notes and bonds(1)
|
41,687
|
—
|
41,687
|
|||||||||
|
Asset backed securities(1)
|
8,112 |
—
|
8,112 | |||||||||
|
Other debt securities(1)
|
1,747
|
—
|
1,747
|
|||||||||
|
75,508
|
1,250
|
74,258
|
||||||||||
|
Foreign currency derivatives(2)
|
57
|
—
|
57
|
|||||||||
|
Total
|
$
|
75,565
|
$
|
1,250
|
$
|
74,315
|
||||||
|
Liabilities:
|
||||||||||||
|
Foreign currency derivatives(3)
|
$
|
98
|
$
|
—
|
$
|
98
|
||||||
|
Total
|
$
|
98
|
$
|
—
|
$
|
98
|
||||||
|
|
(1)
|
Included in short-term investments on the Company’s consolidated balance sheet.
|
|
|
(2)
|
Included in accounts receivable on the Company’s consolidated balance sheet.
|
|
|
(3)
|
Included in accrued liabilities on the Company’s consolidated balance sheet.
|
NETWORK EQUIPMENT TECHNOLOGIES, INC.
NOTES TO CONSOLIDATED FINANCIAL STATEMENTS
(Continued)
The three levels of the fair value hierarchy are:
Level 1: Quoted prices (unadjusted) in active markets that are accessible at the measurement date for identical assets or liabilities. The fair value hierarchy gives the highest priority to Level 1 inputs.
Level 2: Observable inputs other than quoted prices included within Level 1, including quoted prices for similar assets or liabilities in active markets; quoted prices for identical or similar assets or liabilities in markets that are not active; and inputs other than quoted prices that are observable or are derived principally from, or corroborated by, observable market data by correlation or other means.
Level 3: Unobservable inputs are used when little or no market data is available. The fair value hierarchy gives the lowest priority to Level 3 inputs.
A financial instrument’s level within the fair value hierarchy is based on the lowest level of any input that is significant to the fair value measurement.
Investments are classified within Level 1 if derived from quoted prices in active markets for identical assets and liabilities.
Items are classified in Level 2 if the investments are valued using quoted prices for identical assets in markets that are not active, using quoted prices for similar assets in an active market, or using model-based valuation techniques for which all significant assumptions are observable in the market or can be corroborated by observable market data for substantially the full term of the assets.
The Company did not hold financial assets or liabilities which were recorded at fair value using inputs in the Level 3 category as of March 25, 2011 and March 26, 2010.
Derivative financial instruments are limited to foreign exchange contracts which the Company enters into to minimize certain balance sheet exposures and intercompany balances against future movement in foreign exchange rates. The Company’s primary net foreign currency exposures are in Japanese yen, Euros, and British pounds. The fair value of the Company’s derivative instruments is determined using pricing models based on current market rates. Gains and losses on these foreign exchange contracts, which are not designated as hedging instruments, are included in other income and expense, net, and were not material for any period presented.
Subsequent to the issuance of the 2010 consolidated financial statements, the Company determined that $74.3 million of securities including U.S. government agencies, corporate notes and bonds and other debt securities should be classified as Level 2 investments rather than Level 1 as originally classified, as such investments are not based on quoted prices and actively traded. Accordingly, the Company has corrected the classification of U.S. government agencies, corporate notes and bonds, and other debt securities from Level 1 to Level 2 in the table of fair value measurements as of March 26, 2010. The Company also identified that $27.0 million corporate bonds guaranteed by the full faith and credit of the United States government under the Federal Deposit Insurance Corporation’s Temporary Liquidity Guarantee Program were previously included within U.S. government and municipalities as of March 26, 2010. The Company has corrected the presentation by including these as corporate notes and bonds in the above tables. The foregoing corrections are not considered material by the Company.
Asset backed securities were previously included within other debt securities as of March 26, 2010. The Company has reclassified these securities as a separate category of investments in the above tables to conform to the 2011 presentation.
Note 4. Inventories
Inventories consisted of the following:
|
(in thousands)
|
March 25, 2011
|
March 26, 2010
|
||||||
|
Purchased components
|
$
|
3,037
|
$
|
2,806
|
||||
|
Finished goods
|
1,623
|
1,571
|
||||||
|
$
|
4,660
|
$
|
4,377
|
|||||
Certain inventories, not expected to be consumed within the next 12 months, are included in the consolidated balance sheet as non-current assets. These inventories consist of both raw materials and finished goods, and were $805,000 and $1.8 million, respectively, at March 25, 2011 and March 26, 2010.
Under the Company’s agreement with its primary contract manufacturer, Plexus Corp. (Plexus), which runs through December 31, 2011, the Company maintains a level of control over parts procurement, design, documentation, and selection of approved suppliers. The Company is generally liable for any termination or cancellation of product orders, as well as excess and obsolete material, which can result, for example, from an engineering change, product obsolescence, or inaccurate component forecasting. Under the agreement, Plexus is to procure raw materials and begin manufacturing of products in accordance with the Company’s forecasts. If certain purchased raw materials or certain work-in-process items are held for greater than 90 days, the Company must make deposits on the aging inventory, although Plexus must make efforts to minimize the Company’s liability for the aging inventory, including returning materials to suppliers, canceling orders with suppliers, or using materials to manufacture product for its other customers. If raw material or in-process inventories are still unused and have been held for more than nine months, the Company must take ownership and pay for the aged inventory. Alternatively, if there is forecasted demand for such inventory, the Company must pay a management fee for Plexus to retain such inventory. If the forecasted demand does not materialize the Company must take ownership and pay for such inventory. This activity may increase the Company’s owned inventories.
NETWORK EQUIPMENT TECHNOLOGIES, INC.
NOTES TO CONSOLIDATED FINANCIAL STATEMENTS
(Continued)
At March 25, 2011, the Company’s deposit on inventory held by Plexus was $4.2 million, of which $1.3 million had been charged to a reserve for excess inventory. The deposit, including the related reserve, is included in prepaid expenses and other assets in the consolidated balance sheets.
The Company regularly evaluates its inventory for lower of cost or market valuation, including inventory held by Plexus and the amount on deposit with Plexus as well as inventory classified non-current assets. As a result of these evaluations, the Company recorded charges of $550,000, $1.9 million and $5.2 million, respectively, to cost of revenue in fiscal 2011, 2010 and 2009.
Note 5. Other Assets and Accrued Liabilities
Other assets at March 25, 2011 and March 26, 2010 were as follows:
|
(in thousands)
|
2011
|
2010
|
||||||
|
Inventory spares
|
$ | 1,722 | $ | 1,930 | ||||
|
Debenture costs
|
296 | 383 | ||||||
|
Deferred taxes
|
1,014 | 1,209 | ||||||
|
Other
|
459 | 406 | ||||||
|
Long-term inventories
|
805 | 1,782 | ||||||
| $ | 4,296 | $ | 5,710 | |||||
Accrued liabilities at March 25, 2011 and March 26, 2010 were as follows:
|
(in thousands)
|
2011
|
2010
|
||||||
|
Accrued compensation
|
$ | 2,776 | $ | 3,233 | ||||
|
Unearned income
|
2,894 | 4,823 | ||||||
|
Accrued rent
|
540 | 863 | ||||||
|
Restructure and other costs
|
915 | 1,297 | ||||||
|
Accrued interest
|
759 | 759 | ||||||
|
Other
|
2,378 | 2,255 | ||||||
| $ | 10,262 | $ | 13,230 | |||||
See also Note 7 for activity in the liability for restructuring.
NETWORK EQUIPMENT TECHNOLOGIES, INC.
NOTES TO CONSOLIDATED FINANCIAL STATEMENTS
(Continued)
Note 6. Warranty Accruals
The warranty accrual, which is included in accrued liabilities in the accompanying consolidated balance sheets, was $85,000 at March 25, 2011, as shown in the table below. Components of the warranty accrual and changes in accrued amounts related to the warranty accrual during fiscal 2009, 2010 and 2011 were as follows:
|
(in thousands)
|
Warranty Accrual
|
|||
|
Balance at March 28, 2008
|
$
|
98
|
||
|
Charges to cost of goods sold
|
28
|
|||
|
Charges to warranty accrual
|
(58
|
)
|
||
|
Other adjustments (1)
|
14
|
|||
|
Balance at March 27, 2009
|
82
|
|||
|
Charges to cost of goods sold
|
53
|
|||
|
Charges to warranty accrual
|
(62
|
)
|
||
|
Other adjustments (1)
|
(4
|
)
|
||
|
Balance at March 26, 2010
|
69
|
|||
|
Charges to cost of goods sold
|
90
|
|||
|
Charges to warranty accrual
|
(107
|
)
|
||
|
Other adjustments (1)
|
33
|
|||
|
Balance at March 25, 2011
|
$
|
85
|
||
|
(1)
|
Adjustments resulted from changes in warranty cost estimates, relating primarily to hourly costs of labor to repair products and frequency of warranty claims.
|
Note 7. Restructure and Other
Restructure and other costs of $281,000 in fiscal 2011 and $17,000 in fiscal 2010 relate to charges for employee separation costs.
Restructure and other costs of $2.4 million in fiscal 2009 related to charges for employee separation costs and a change in estimated costs to vacate the Company’s former manufacturing facility and represent the total amount expected to be incurred in connection with these restructuring activities. Employee separation costs were $1.3 million in fiscal 2009 and were principally for employee severance and related costs resulting from workforce reductions. The Company previously estimated the remaining liability for lease and other exit costs associated with its former manufacturing facility to be net of anticipated sublease income. In January 2009, the sublessee occupying the former manufacturing facility informed the Company that it would not exercise its option to extend its sublease. As a result, the Company could no longer assume incremental sublease income and therefore revised its estimate of the remaining liability for lease and other exit costs. The Company recorded facility exit costs of $1.1 million in fiscal 2009 to reflect the revision of estimated costs to vacate the Company’s manufacturing facility.
NETWORK EQUIPMENT TECHNOLOGIES, INC.
NOTES TO CONSOLIDATED FINANCIAL STATEMENTS
(Continued)
The liability for restructuring was $915,000 at March 25, 2011, as shown in the table below. Components of accrued restructure costs and changes in accrued amounts related to these restructuring programs during fiscal 2009, 2010, and 2011 are as follows:
|
(in thousands)
|
Employee Separation Costs & Other
|
Facility Exit Costs & Other
|
Total
|
|||||||||
|
Balance at March 28, 2008
|
$
|
117
|
$ |
3,087
|
$ |
3,204
|
||||||
|
Provision
|
1,287
|
1,577
|
2,864
|
|||||||||
|
Benefit
|
—
|
(441
|
)
|
(441
|
)
|
|||||||
|
Payments
|
(1,255
|
)
|
(1,053
|
)
|
(2,308
|
)
|
||||||
|
Other (1)
|
—
|
131
|
131
|
|||||||||
|
Balance at March 27, 2009
|
149
|
3,301
|
3,450
|
|||||||||
|
Provision
|
18
|
(1
|
)
|
17
|
||||||||
|
Payments
|
(63
|
)
|
(1,368
|
)
|
(1,431
|
)
|
||||||
|
Other (1)
|
(104
|
)
|
187
|
83
|
||||||||
|
Balance at March 26, 2010
|
—
|
2,119
|
2,119
|
|||||||||
|
Provision
|
281
|
—
|
281
|
|||||||||
|
Payments
|
(275
|
)
|
(1,322
|
)
|
(1,597
|
)
|
||||||
|
Other (1)
|
(2
|
)
|
114
|
112
|
||||||||
|
Balance at March 25, 2011
|
$
|
4
|
$
|
911
|
$
|
915
|
||||||
|
(1)
|
Consists primarily of accretion and adjustments to accretion of implied interest on the remaining liability for lease and other exit costs associated with the Company’s former manufacturing facility which is reflected in general and administrative expense in the consolidated statement of operations and comprehensive income loss. Adjustments to accretion were related to the Company’s revision of its estimate of the remaining liability for lease and other exit costs.
|
The balances at March 26, 2010 and March 27, 2009 include $822,000 and $1.9 million, respectively, classified as other long-term liabilities related to lease and other exit costs for the vacated facility, net of an estimated amount of sublease income.
NETWORK EQUIPMENT TECHNOLOGIES, INC.
NOTES TO CONSOLIDATED FINANCIAL STATEMENTS
(Continued)
Note 8. Income Taxes
Loss before income taxes and income tax provision consist of the following for fiscal 2011, 2010 and 2009:
|
(in thousands)
|
2011
|
2010
|
2009 | |||||||||
|
Income (loss) before income taxes:
|
||||||||||||
|
Domestic
|
$
|
(27,176
|
)
|
$
|
(18,880
|
)
|
$
|
(53,049
|
)
|
|||
|
Foreign
|
1,009
|
1,109
|
(387
|
)
|
||||||||
|
Total
|
$
|
(26,167
|
)
|
$
|
(17,771
|
)
|
$
|
(53,436
|
)
|
|||
|
Income tax provision (benefit):
|
||||||||||||
|
Current:
|
||||||||||||
|
Federal
|
$
|
(21
|
)
|
$
|
(77
|
)
|
$
|
(100
|
)
|
|||
|
State
|
(2
|
)
|
10
|
1
|
||||||||
|
Foreign
|
23
|
(14
|
)
|
189
|
||||||||
|
—
|
(81
|
)
|
90
|
|||||||||
|
Deferred:
|
||||||||||||
|
Federal
|
—
|
—
|
—
|
|||||||||
|
State
|
—
|
—
|
—
|
|||||||||
|
Foreign
|
131
|
153
|
(23
|
)
|
||||||||
|
131
|
153
|
(23
|
)
|
|||||||||
|
$
|
131
|
$
|
72
|
$
|
67
|
|||||||
The income tax expense reconciles to the amount computed by applying the statutory United States federal rate of 35% to income (loss) before income taxes as follows:
|
(in thousands)
|
2011
|
2010
|
2009
|
|||||||||
|
Statutory federal tax position
|
$
|
(9,159
|
)
|
$
|
(6,223
|
)
|
$
|
(18,703
|
)
|
|||
|
State tax, net of federal benefit
|
(712
|
)
|
(585
|
)
|
(1,484
|
)
|
||||||
|
Foreign tax rate differential
|
(199
|
)
|
(380
|
)
|
(5
|
)
|
||||||
|
Research and development, and manufacturers’ investment credits
|
(1,085
|
)
|
85
|
(611
|
)
|
|||||||
|
Change in valuation allowance
|
10,588
|
6,452
|
9,085
|
|||||||||
|
Provision (release) of tax contingency reserve
|
(32
|
)
|
(22
|
)
|
177
|
|||||||
|
Goodwill impairment
|
—
|
—
|
10,512
|
|||||||||
|
Permanent differences
|
560
|
121
|
166
|
|||||||||
|
Other
|
170
|
624
|
930
|
|||||||||
|
Income tax expense
|
$
|
131
|
$
|
72
|
$
|
67
|
Deferred tax assets are comprised of the following at March 25, 2011 and March 26, 2010:
|
(in thousands)
|
2011
|
2010
|
||||||
|
Gross deferred tax assets:
|
||||||||
|
Allowances not currently deductible for tax purposes
|
$ | 8,981 | $ | 8,505 | ||||
|
Loss carryforwards
|
73,003 | 63,679 | ||||||
|
Credit carryforwards
|
12,902 | 12,030 | ||||||
|
Depreciation
|
7,022 | 7,288 | ||||||
|
Gross deferred tax assets
|
101,908 | 91,502 | ||||||
|
Deferred tax liabilities:
|
— | — | ||||||
|
Net deferred tax assets
|
101,908 | 91,502 | ||||||
|
Valuation allowance
|
(100,727 | ) | (90,139 | ) | ||||
|
Net deferred tax assets
|
$ | 1,181 | $ | 1,363 | ||||
The Company recorded a tax expense of $131,000, $72,000 and $67,000 for fiscal 2011, 2010 and 2009, respectively, primarily related to international operations.
NETWORK EQUIPMENT TECHNOLOGIES, INC.
NOTES TO CONSOLIDATED FINANCIAL STATEMENTS
(Continued)
The valuation allowance increased by $10.6 million, $7.5 million and $9.1 million in fiscal 2011, 2010 and 2009, respectively. The Company's operating loss carryforwards and credits, which have been offset by the valuation allowance, include $4.7 million of deferred tax benefits associated with stock -based compensation, which will be credited to additional-paid-in-capital when realized. The Company has incurred tax losses in the last several fiscal years and, at March 25, 2011, has approximately $197.5 million of federal net operating loss carryforwards and $102.2 million of state net operating loss carryforwards available, expiring in the years 2013 through 2031. In assessing the realization of deferred tax assets, management considers whether it is more likely than not that some portion or all of deferred tax assets will not be realized. FASB ASC Topic 740, Income Taxes, provides for the recognition of deferred tax assets if realization of such assets is more likely than not to occur. Based upon the weight of available evidence, which includes the Company’s historical operating performance, reported cumulative net losses, the Company provided a full valuation allowance against its US and most foreign net deferred tax assets. There is no valuation allowance against the Company’s UK deferred tax assets. The Company reassesses the need for its valuation allowance on a quarterly basis.
As of March 25, 2011, the Company has available federal research and development tax credit carryforwards of approximately $5.3 million expiring in the years 2013 through 2031 and alternative minimum tax credit carryforwards of approximately $2.5 million available indefinitely. At March 25, 2011, state research and development tax credit carryforwards of approximately $14.9 million are also available indefinitely. The Company considers all undistributed earnings of its foreign subsidiaries to be permanently invested in foreign operations. Accordingly, no deferred tax assets or liabilities have been established in this regard.
Current federal and state tax laws include provisions that could limit the annual use of our net operating loss carryforwards in the event of certain defined changes in stock ownership. The Company's issuance of common and preferred stock could result in such a change. Accordingly, the annual use of net operating loss carryforwards may be limited by these provisions, and this limitation may result in the loss of carryforward benefits to the extent the above-limit portion expires before it can be used. The Company has determined the extent of the limitation at March 25, 2011, and the losses reflected in the deferred tax assets will not be subject to limitation.
A reconciliation of the Company's changes in uncertain tax position to March 25, 2011, March 26, 2010 and March 27, 2009 is as follows:
|
(in thousands)
|
2011
|
2010
|
2009
|
|||||||||
|
Beginning balance, gross uncertain tax positions
|
$
|
6,769
|
$
|
7,400
|
$
|
8,176
|
||||||
|
Additions to tax positions related to prior years
|
49
|
—
|
174
|
|||||||||
|
Reductions to tax positions related to prior years
|
—
|
(605
|
)
|
(997
|
)
|
|||||||
|
Additions to tax positions related to current year
|
122
|
86
|
188
|
|||||||||
|
Reductions to tax positions related to lapse of statute
|
(52
|
)
|
(24
|
)
|
(13
|
)
|
||||||
|
Effect of exchange rates
|
136
|
(88
|
)
|
(128
|
)
|
|||||||
|
Ending balance, gross uncertain tax positions
|
$
|
7,024
|
$
|
6,769
|
$
|
7,400
|
||||||
The amount of tax benefits that would, if recognized, affect the effective tax rate at March 25, 2011 was $601,000, as the Company maintains a full valuation allowance against the remaining uncertain tax benefits. Interest and penalties of $30,000, $2,000 and $40,000, respectively, for fiscal 2011, 2010 and 2009 related to income tax matters are recorded in income tax expense. At March 25, 2011, $148,000 was accrued for interest and penalties related to uncertain tax benefits.
As of March 25, 2011, tax years from 1998 in the U.S. and 2004 in the Company's primary foreign jurisdictions remain open for examination. Although the timing of resolution and closure of audits is highly uncertain, the Company does not believe it is reasonably possible that the unrecognized tax benefits would materially change in the next twelve months. The Company currently has no uncertain tax benefits that would reduce as a result of a lapse of applicable statutes of limitations.
Note 9. Commitments and Contingencies
3¾% Convertible Senior Notes: In December 2007, the Company issued $85.0 million of 3¾% convertible senior notes due December 15, 2014, in a private placement of which $10.5 million remained outstanding at March 25, 2011. The notes may be converted by a holder, at its option, into shares of the Company’s common stock initially at a conversion rate of 73.3689 shares of common stock per $1,000 principal amount, which is equivalent to an initial conversion price of approximately $13.63 per share of common stock (subject to adjustment in certain events), at any time on or prior to December 15, 2014, unless the notes were previously repurchased. If a holder elects to convert its notes in connection with certain fundamental changes, in certain circumstances the conversion rate will increase by a number of additional shares of common stock upon conversion. Upon conversion, a holder generally will not receive any cash payment representing accrued and unpaid interest, if any. The notes are not redeemable by the Company prior to the stated maturity.
NETWORK EQUIPMENT TECHNOLOGIES, INC.
NOTES TO CONSOLIDATED FINANCIAL STATEMENTS
(Continued)
Upon the occurrence of certain fundamental changes including, without limitation, an acquisition of voting control of the Company, the liquidation or dissolution of the Company, or the Company’s common stock ceasing to be traded on a U.S. national securities exchange, a holder may require the Company to purchase for cash all or any part of its notes at a purchase price equal to 100% of the principal amount plus any accrued and unpaid interest (including additional interest, if any) up until, but not including, the fundamental change purchase date.
The notes are unsecured senior obligations, ranking equal in right of payment to all existing and future senior indebtedness, and senior in right of payment to any existing and future subordinated indebtedness. The notes are effectively subordinated to existing and future secured indebtedness to the extent of the assets securing such indebtedness and structurally subordinated to the claims of all existing and future indebtedness and other liabilities of the Company’s subsidiaries.
In fiscal 2010, the Company repurchased and retired $2.5 million principal amount of the outstanding notes in privately negotiated transactions. The Company recorded a net gain on this extinguishment of debt of $555,000, consisting of a $625,000 gain resulting from the repurchase of debt at below principal, partially offset by a $70,000 write-off of unamortized deferred financing costs related to the repurchased debt.
In fiscal 2009, the Company repurchased and retired $72.0 million principal amount of the outstanding notes in privately negotiated transactions. The Company recorded a net gain on this extinguishment of debt of approximately $28.6 million, consisting of a $30.8 million gain resulting from the repurchase of debt at below principal, offset by a $2.2 million write-off of unamortized deferred financing costs related to the repurchased debt. The net gain on these transactions was recorded as non-operating income.
Interest expense relating to the 3¾% Convertible Senior Notes was $394,000, $482,000 and $1.9 million in fiscal 2011, 2010 and 2009, respectively, and consisted solely of contractual coupon interest.
7¼% Redeemable Convertible Subordinated Debentures: In May 1989, the Company issued $75.0 million of 7¼% redeemable convertible subordinated debentures due May 15, 2014, of which $23.7 million remained outstanding at March 25, 2011. Each debenture is convertible at the option of the holder into common stock at $31.50 per share and is redeemable at the option of the Company. The debentures are entitled to a sinking fund which began May 15, 2000, of 14 annual payments of 5% of the aggregate principal amount of debentures issued ($3.8 million annually), reduced by any redemption or conversion of the debentures. As a result of previous redemptions, the total remaining sinking fund requirement is $1.2 million, which, assuming no further redemptions, will be due as a final sinking fund payment on May 15, 2013.
In fiscal 2009, the Company repurchased and retired $1.0 million principal amount of outstanding notes in a privately negotiated transaction. The Company recorded a net gain on this extinguishment of debt of approximately $353,000, consisting of a $360,000 gain resulting from the repurchase of debt at below principal, offset by a $7,000 write-off of unamortized deferred financing costs related to the repurchased debt. The net gain on this transaction was recorded as non-operating income.
Interest expense relating to the 7¼% Redeemable Convertible Subordinated Debentures was $1.7 million, $1.7 million and $1.8 million in fiscal 2011, 2010 and 2009, respectively, and consisted solely of contractual coupon interest.
Operating Leases: The Company leases its facilities under operating leases. These leases expire at various dates through fiscal 2017. The Company’s headquarters facility lease expires in fiscal 2017. The minimum future lease commitments under these leases as of March 25, 2011, were as follows:
|
(in thousands)
|
2012
|
2013
|
2014
|
2015
|
2016
|
Thereafter
|
Total
|
|||||||||||||||||||||
|
Minimum future operating lease payments
|
$ | 3,570 | $ | 2,036 | $ | 1,317 | $ | 1,265 | $ | 1,286 | $ | 976 | $ | 10,450 | ||||||||||||||
|
Less income from subleases
|
(409 | ) | ||||||||||||||||||||||||||
|
Net minimum operating lease payments
|
$ | 10,041 | ||||||||||||||||||||||||||
Included in the operating lease amounts are payments for vacated facilities in Fremont, California of which $435,000, representing the discounted value of the lease payments, net of assumed sublease income, is accrued in the restructure liability at March 25, 2011; see Note 7 Restructure and Other.
NETWORK EQUIPMENT TECHNOLOGIES, INC.
NOTES TO CONSOLIDATED FINANCIAL STATEMENTS
(Continued)
Rental expense under operating leases was $2.6 million, $2.9 million and $2.9 million for fiscal 2011, 2010 and 2009, respectively.
Equipment Financing: In fiscal 2011, the Company acquired certain office equipment through two agreements classified as capital leases. The cost of equipment financed by capital leases was $162,000. The terms of the capital lease agreements range from three to five years. One of the capital lease agreements includes a bargain purchase option which the Company may exercise at the end of the lease term. The equipment financed by the capital leases is included in the consolidated balance sheets as property and equipment, net.
In fiscal 2010, the Company acquired certain office equipment through an agreement classified as a capital lease and also through a note payable. The cost of equipment financed by the capital lease and by the note payable was $145,000 and $141,000, respectively. The terms of both the capital lease agreement and the note payable are three years. The capital lease agreement includes a bargain purchase option which the Company may exercise at the end of the lease term. The equipment financed by the capital lease and the note payable is included in the consolidated balance sheets as property and equipment, net.
Amortization of assets under capital lease is included in depreciation expense. Accumulated amortization of assets under capital lease was $81,000 at March 25, 2011 and $13,000 at March 26, 2010.
The minimum future lease commitments under capital leases as of March 25, 2011, were as follows:
|
(in thousands)
|
2012
|
2013
|
2014
|
2015
|
2016
|
Thereafter
|
Total
|
|||||||||||||||||||||
|
Minimum future capital lease payments
|
$ | 96 | $ | 68 | $ | 31 | $ | 25 | $ | 20 | $ | — | $ | 240 | ||||||||||||||
License and Development Agreement: The Company is a party to a license and development agreement with a third-party technology supplier, under which the Company acquired a license to manufacture and distribute the supplier’s high-speed networking platform. The Company agreed to pay an additional $5.0 million in four equal installments to the supplier for the advanced platform and an extended exclusive right to market. The first two installments were paid in fiscal 2008 and the remaining two will be due at separate future dates dependent upon the supplier’s delivery of future enhancements of the advanced platform. The Company believes it is unlikely the remaining two installments will become due or be paid.
Contingencies: In the normal course of business, the Company enters into contractual commitments to purchase services, materials, components, and finished goods from suppliers, mainly its primary contract manufacturer, Plexus. Under the agreement with Plexus, the Company may incur certain liabilities, as described in Note 4.
The Company has learned that some of its products may have been exported or re-exported in violation of U.S. export laws. Consequently, the Company has launched an internal investigation of its export-related activities, which is being performed by outside counsel. The Company will report the results of the investigation to the U.S. government. Certain issues subject to the investigation have already been reported to the U.S. government, and the U.S. government has closed a limited portion of the matter with the issuance of a warning letter. The results of the rest of the internal investigation will be reported to the U.S. government in due course. If the U.S. government finds that the Company has violated one or more export control laws or trade sanctions, the Company could be subject to various penalties. By statute, these penalties can include but are not limited to fines of up to $250,000 for each violation, denial of export privileges, and debarment from participation in U.S. government contracts. The Company believes, however, that its cooperation with the U.S. government, its immediate attention to rectifying the issues, and other factors provide a basis for mitigating any penalty that might be imposed. As a result of the discovery of these events, the Company has implemented more stringent export control procedures. Management believes it is reasonably possible that the Company could incur a loss as a result of penalties relating to these events. However, at this time, the Company cannot reasonably estimate the cost, or range of costs, if any, for any such penalties or fines that may be incurred upon resolution of this matter.
Product Warranty: See Note 6.
Restructure: See Note 7.
Litigation: See Note 17.
Note 10. Stock-based Compensation
Stock Option and Award Plans: The Company grants options to purchase shares of its common stock and is authorized to award restricted shares of common stock pursuant to the terms of its 2008 Equity Incentive Plan, its 1993 Stock Option Plan and its 1997 Stock Option Program. Upon stockholder approval of the 2008 Equity Incentive Plan in August 2008, the 1993 Stock Option Plan and the 1997 Stock Option Program were terminated, and all shares available for future grants of awards under the 1993 Stock Option Plan and the 1997 Stock Option Program were terminated. Stock options generally become exercisable ratably over a four-year period and expire after seven to ten years. Options may be granted to officers, employees, directors and independent contractors to purchase common stock at a price not less than 100% of the fair market value at the date of grant.
NETWORK EQUIPMENT TECHNOLOGIES, INC.
NOTES TO CONSOLIDATED FINANCIAL STATEMENTS
(Continued)
Restricted stock awards (RSAs) granted under the equity plans are independent of option grants and are subject to restrictions. RSAs, which have been issued since fiscal 2007, are subject to forfeiture if employment or services are terminated prior to the release of restrictions, which generally occurs on a ratable basis over one to two years from the date of grant. Until the restriction is released, the shares cannot be transferred. These shares have the same cash dividend and voting rights as other common stock and are considered as issued and outstanding. The cost of the awards, determined to be the fair market value of the shares at the date of grant, is expensed ratably over the period the restrictions lapse.
Restricted stock unit awards (RSUs) granted under the 2008 Equity Incentive Plan are also independent of option grants and are subject to restrictions. RSUs, which the Company began issuing in fiscal 2011, are subject to forfeiture if employment or services are terminated prior to the release of restrictions, which generally occurs on a ratable basis over periods ranging from one day to two years from the date of grant. Until the restriction is released, the shares cannot be transferred. These shares are not considered as issued and outstanding until the release of restrictions. The cost of the awards, determined to be the fair market value of the shares at the date of grant, is expensed ratably over the period the restrictions lapse.
For both RSAs and RSUs, upon release of restrictions, a portion of the released shares are repurchased from employees by the Company to satisfy withholding-tax obligations arising from the vesting of restricted stock awards. The withholding tax obligations were based upon the fair market value of the Company’s common stock on the vesting dates. The Company repurchased 296,000 shares from employees in fiscal 2011 for a total price of $1.2 million. In fiscal 2010, the Company repurchased 268,000 shares from employees for a total price of $1.2 million.
Stock Compensation Expense: The following table shows total stock-based compensation expense included in the Consolidated Statements of Operations:
|
(in thousands)
|
2011
|
2010
|
2009
|
|||||||||
|
Cost of revenue
|
$ | 851 | $ | 732 | $ | 550 | ||||||
|
Sales and marketing
|
1,679 | 1,680 | 1,253 | |||||||||
|
Research and development
|
2,064 | 1,636 | 1,023 | |||||||||
|
General and administrative
|
1,356 | 1,741 | 1,602 | |||||||||
| $ | 5,950 | $ | 5,789 | $ | 4,428 | |||||||
There was no stock-based compensation cost capitalized as part of inventory in fiscal 2011, 2010 or 2009.
In September 2009, the Company completed an offer to exchange certain employee stock options issued under the 2008 Equity Incentive Plan, the 1993 Stock Option Plan and the 1997 Stock Option Program (the Offer to Exchange). Certain previously granted options were exchanged for restricted shares of the Company’s common stock. Options for an aggregate of 923,844 shares of the Company’s common stock were exchanged for an aggregate of 256,034 restricted shares. The number of restricted shares issued under the Offer to Exchange was based on ratios designed to equalize the value of stock options exchanged with that of restricted shares issued. Restricted shares issued under the Offer to Exchange were issued and outstanding upon grant, but are subject to vesting over approximately two years following the date of grant. The Company did not incur additional non-cash stock compensation expense in connection with the Offer to Exchange as the fair value of the stock options exchanged was equivalent to the fair value of the restricted shares awarded.
NETWORK EQUIPMENT TECHNOLOGIES, INC.
NOTES TO CONSOLIDATED FINANCIAL STATEMENTS
(Continued)
The weighted average fair value of the Company’s stock option awards granted to employees was $2.73, $3.21 and $2.31, respectively, for fiscal 2011, 2010, and 2009, and was estimated using the following weighted-average assumptions:
|
2011
|
2010
|
2009
|
||||||||||
|
Expected term, in years
|
4.94 | 5.08 | 5.14 | |||||||||
|
Expected volatility
|
73.46 | % | 69.68 | % | 60.58 | % | ||||||
|
Risk-free interest rate
|
1.82 | % | 2.47 | % | 3.21 | % | ||||||
|
Expected dividends
|
— | — | — | |||||||||
At March 25, 2011, the total compensation cost related to unvested stock-based awards not yet recognized, net of estimated forfeitures, was approximately $5.0 million. The weighted-average period during which the cost will be amortized, which will be adjusted for subsequent changes in estimated forfeitures, was approximately 2.5 years.
Stock Options & Awards Activity:
Stock option activity in the Company’s employee stock plans is summarized below:
|
Shares
|
Weighted Average Exercise Price
|
Number Exercisable
|
Weighted Average Exercise Price
|
Number Vested and Expected to vest at
March 25, 2011
|
Weighted Average Exercise Price
|
|||||||||||||||||||
|
Options outstanding at March 28, 2008
|
5,211,346 | $ | 7.79 | 2,952,000 | $ | 6.85 | ||||||||||||||||||
|
Granted
|
674,682 | $ | 4.23 | |||||||||||||||||||||
|
Exercised
|
(14,538 | ) | $ | 3.60 | ||||||||||||||||||||
|
Forfeited and expired
|
(1,049,560 | ) | $ | 8.26 | ||||||||||||||||||||
|
Options outstanding at March 27, 2009
|
4,821,930 | $ | 7.20 | 3,182,450 | $ | 7.02 | ||||||||||||||||||
|
Granted
|
1,038,325 | $ | 5.40 | |||||||||||||||||||||
|
Exercised
|
(157,776 | ) | $ | 4.15 | ||||||||||||||||||||
|
Forfeited and expired
|
(1,563,893 | ) | $ | 9.57 | ||||||||||||||||||||
|
Options outstanding at March 26, 2010
|
4,138,586 | $ | 5.97 | 2,662,832 | $ | 6.15 | ||||||||||||||||||
|
Granted
|
814,913 | $ | 4.53 | |||||||||||||||||||||
|
Exercised
|
(203,864 | ) | $ | 3.39 | ||||||||||||||||||||
|
Forfeited and expired
|
(447,695 | ) | $ | 6.90 | ||||||||||||||||||||
|
Options outstanding at March 25, 2011
|
4,301,940 | $ | 5.72 | 2,858,271 | $ | 6.12 | 4,120,658 | $ | 5.76 | |||||||||||||||
|
At March 25, 2011:
|
||||||||||||||||||||||||
|
Weighted average remaining contractual term (in years)
|
4.98 | 4.49 | 4.94 | |||||||||||||||||||||
|
Aggregate intrinsic value (in thousands) (1)
|
$ | 122 | $ | 62 | $ | 114 | ||||||||||||||||||
|
(1)
|
The aggregate intrinsic value is calculated as the difference between the exercise price of the underlying awards and the quoted price of the Company’s common stock at March 25, 2011 for options outstanding as of that date. The total intrinsic value of stock options exercised in fiscal 2011, 2010 and 2009 was $300,000, $372,000 and $12,000, respectively.
|
NETWORK EQUIPMENT TECHNOLOGIES, INC.
NOTES TO CONSOLIDATED FINANCIAL STATEMENTS
(Continued)
The following table summarizes information concerning options outstanding and exercisable as of March 25, 2011:
|
Options Outstanding
|
Options Exercisable
|
|||||||||||||||||||||||||||||
|
Range of
Exercise Prices
|
Shares
Outstanding
|
Weighted Average Remaining Contractual Life
(Years)
|
Weighted Average
Exercise Price
|
Shares
Exercisable
|
Weighted Average
Exercise Price
|
|||||||||||||||||||||||||
| $ | 2.63 | - | $ | 3.52 | 435,562 | 5.08 | $ | 3.14 | 277,494 | $ | 3.20 | |||||||||||||||||||
| $ | 3.57 | - | $ | 4.38 | 590,680 | 5.44 | $ | 4.08 | 362,011 | $ | 4.15 | |||||||||||||||||||
| $ | 4.45 | - | $ | 4.70 | 487,474 | 3.92 | $ | 4.64 | 467,254 | $ | 4.65 | |||||||||||||||||||
| $ | 4.80 | - | $ | 4.85 | 5,857 | 5.53 | $ | 4.80 | 5,857 | $ | 4.80 | |||||||||||||||||||
| $ | 4.90 | - | $ | 4.90 | 534,300 | 6.12 | $ | 4.90 | 2,800 | $ | 4.90 | |||||||||||||||||||
| $ | 4.92 | - | $ | 5.43 | 468,625 | 5.64 | $ | 5.27 | 349,672 | $ | 5.33 | |||||||||||||||||||
| $ | 5.60 | - | $ | 5.99 | 674,800 | 5.10 | $ | 5.87 | 337,089 | $ | 5.87 | |||||||||||||||||||
| $ | 6.05 | - | $ | 7.30 | 472,500 | 3.25 | $ | 6.77 | 467,805 | $ | 6.77 | |||||||||||||||||||
| $ | 7.36 | - | $ | 10.75 | 611,642 | 4.95 | $ | 9.89 | 571,634 | $ | 9.97 | |||||||||||||||||||
| $ | 11.66 | - | $ | 11.66 | 20,500 | 6.70 | $ | 11.66 | 16,655 | $ | 11.66 | |||||||||||||||||||
| $ | 2.63 | - | $ | 11.66 | 4,301,940 | 4.98 | $ | 5.72 | 2,858,271 | $ | 6.12 | |||||||||||||||||||
Stock award activity in the Company’s employee stock plans is summarized below:
|
Shares
|
Weighted
Average
Grant Date Fair Value
|
|||||||
|
Nonvested stock at March 28, 2008
|
91,809 | $ | 5.55 | |||||
|
Granted
|
318,209 | $ | 4.40 | |||||
|
Vested
|
(268,615 | ) | $ | 4.75 | ||||
|
Forfeited and cancelled
|
(28,360 | ) | $ | 4.39 | ||||
|
Nonvested stock at March 27, 2009
|
113,043 | $ | 4.50 | |||||
|
Granted
|
1,014,799 | $ | 4.92 | |||||
|
Vested
|
(688,839 | ) | $ | 4.24 | ||||
|
Forfeited and cancelled
|
(21,962 | ) | $ | 5.97 | ||||
|
Nonvested stock at March 26, 2010
|
417,041 | $ | 5.88 | |||||
|
Granted
|
871,972 | $ | 3.55 | |||||
|
Vested
|
(804,430 | ) | $ | 3.98 | ||||
|
Forfeited and cancelled
|
(47,310 | ) | $ | 5.03 | ||||
|
Nonvested stock at March 25, 2011
|
437,273 | $ | 3.99 | |||||
The total fair value of RSAs and RSUs vested was $3.2 million, $2.9 million and $1.3 million for fiscal 2011, 2010 and 2009, respectively.
Note 11. Capital Stock
Stock Repurchase Plan: In fiscal 2008, the Board of Directors approved a stock repurchase plan, for a period of up to twenty-four months. In fiscal 2009 the Company repurchased 258,000 shares under the 2008 program at an average price of $3.90 per share for a total price of $1.0 million. The Company did not repurchase any shares under the 2008 program in fiscal 2010 and the stock repurchase plan expired in the fourth quarter of fiscal 2010. In addition, the Company repurchased 296,000 and 267,000 shares of common stock from employees in fiscal 2011 and fiscal 2010, respectively, to satisfy withholding-tax obligations arising from the vesting of restricted stock awards. See Note 10.
Preferred Stock: The Company has authorized 5,000,000 shares of $0.01 par value preferred stock. This stock, if issued, will carry liquidation preferences and other rights, as determined by the Board of Directors. As of March 25, 2011, no preferred shares were outstanding.
NETWORK EQUIPMENT TECHNOLOGIES, INC.
NOTES TO CONSOLIDATED FINANCIAL STATEMENTS
(Continued)
Reserved Stock: As of March 25, 2011, the Company had reserved shares of its common stock for the following purposes:
|
Reserved Shares
|
||||
|
Stock option plans:
|
||||
|
Outstanding
|
4,301,940 | |||
|
Available for grant
|
1,255,072 | |||
|
7¼% Redeemable convertible subordinated debentures
|
752,508 | |||
|
3¾% Convertible senior notes
|
770,373 | |||
Note 12. Loss Per Share
The following table sets forth the computation of the numerator and denominator used in the computation of basic and diluted net loss per share:
|
(in thousands, except per share amounts)
|
2011
|
2010
|
2009
|
|||||||||
|
Numerator:
|
||||||||||||
|
Net loss
|
$
|
(26,298
|
)
|
$
|
(17,843
|
)
|
$
|
(53,503
|
)
|
|||
|
Denominator -weighted average shares of common stock outstanding for basic and diluted loss per share:
|
29,924
|
29,178
|
28,854
|
|||||||||
|
Basic and diluted net loss per share
|
$
|
(0.88
|
)
|
$
|
(0.61
|
)
|
$
|
(1.85
|
)
|
The denominator for basic net loss per share is the weighted average number of unrestricted common shares outstanding for the periods presented. In periods of net income, the denominator for diluted net income per share also includes potentially dilutive shares, which consist of shares issuable upon the exercise of dilutive stock options and contingently issuable shares. These shares, which totaled 206,000, 291,000 and 119,000, respectively, for fiscal 2011, 2010 and 2009, were excluded from the computations of diluted net loss per share as the effect of including those shares would be anti-dilutive and therefore reduce the loss per share.
At March 25, 2011, there were approximately 770,000 shares of common stock issuable upon conversion of convertible senior notes and approximately 753,000 shares of common stock issuable upon conversion of redeemable convertible subordinated debentures. These shares and the related effect of the accrued interest on the convertible senior notes and the debentures are excluded from the calculation of diluted net loss per share for each period presented, as their inclusion would be anti-dilutive.
Note 13. Significant Customers
In fiscal 2011 and fiscal 2009, no single customer accounted for more than 10% of the Company’s revenue. In fiscal 2010, General Dynamics Corporation accounted for 22.7% of the Company’s revenue. Excluding aggregate orders from a variety of government agencies, no other single customer accounted for more than 10% percent of the Company’s revenue in fiscal 2011, 2010, or 2009.
Sales to the government sector represented 71.1%, 78.6% and 72.8% of the Company’s revenue in fiscal 2011, 2010, and 2009, respectively.
NETWORK EQUIPMENT TECHNOLOGIES, INC.
NOTES TO CONSOLIDATED FINANCIAL STATEMENTS
(Continued)
Note 14. Segment Information
The Company operates in one reportable segment: the design, development, manufacture and sale of voice and data telecommunications equipment for multi-service networks and associated services used by government organizations, enterprises, and carriers worldwide. The following table presents revenue and long-lived assets by geographic territory for fiscal 2011, 2010 and 2009:
|
(in thousands)
|
United
States
|
Europe
|
Other
International
|
Eliminations
|
Totals
|
|||||||||||||||
|
2011
|
||||||||||||||||||||
|
Product
|
$ | 34,504 | $ | 6,280 | $ | 5,125 | $ | — | $ | 45,909 | ||||||||||
|
Service
|
12,018 | 1,913 | 307 | — | 14,238 | |||||||||||||||
|
Total revenue
|
$ | 46,522 | $ | 8,193 | $ | 5,432 | $ | — | $ | 60,147 | ||||||||||
|
Long-lived assets
|
$ | 6,694 | $ | 81 | $ | 168 | $ | (32 | ) | $ | 6,911 | |||||||||
|
2010
|
||||||||||||||||||||
|
Product
|
$ | 47,274 | $ | 5,937 | $ | 4,931 | $ | — | $ | 58,142 | ||||||||||
|
Service
|
13,436 | 2,712 | 204 | — | 16,352 | |||||||||||||||
|
Total revenue
|
$ | 60,710 | $ | 8,649 | $ | 5,135 | $ | — | $ | 74,494 | ||||||||||
|
Long-lived assets
|
$ | 7,773 | $ | 44 | $ | 88 | $ | (32 | ) | $ | 7,873 | |||||||||
|
2009
|
||||||||||||||||||||
|
Product
|
$ | 42,735 | $ | 6,361 | $ | 2,106 | $ | — | $ | 51,202 | ||||||||||
|
Service
|
12,624 | 1,856 | 106 | — | 14,586 | |||||||||||||||
|
Total revenue
|
$ | 55,359 | $ | 8,217 | $ | 2,212 | $ | — | $ | 65,788 | ||||||||||
|
Long-lived assets
|
$ | 9,293 | $ | 47 | $ | 100 | $ | (31 | ) | $ | 9,409 | |||||||||
In fiscal 2011, 2010, and 2009, Promina products accounted for 32.5%, 36.4% and 42.4% of product revenue, respectively. In fiscal 2011, 2010, and fiscal 2009, Tenor products accounted for 18.6%, 16.6% and 23.5% of product revenue, respectively. In fiscal 2011, 2010 and 2009, NX Series products accounted for 8.6%, 21.9% and 11.4%, respectively, of product revenue. In fiscal 2011, 2010, and 2009, the VX Series and predecessor products accounted for 35.3%, 22.3% and 19.8% of product revenue, respectively. All other products accounted for less than 10% of product revenue, individually and in the aggregate, for all years presented.
Subsequent to the issuance of the fiscal 2010 consolidated financial statements, the Company determined that certain noncurrent inventories were included as long-lived assets in the table above as of March 26, 2010. The Company has corrected the March 26, 2010 presentation to exclude these amounts. Total long-lived assets and long-lived assets for the United States originally reported of $9,655,000 and $9,555,000 were corrected to $7,873,000 and $7,773,000, respectively. The foregoing corrections are not considered material by the Company.
Note 15. Employee Benefit Plan
The Company has a 401(k) tax-deferred savings plan, whereby eligible employees may contribute a percentage of their eligible compensation. Company contributions are discretionary; including administrative fees, Company expense was $31,000, $45,000 and $446,000 for fiscal 2011, 2010 and 2009, respectively. The Company made discretionary contributions to the plan in fiscal 2009, but did not do so in fiscal 2010 and fiscal 2011.
Note 16. Financial Instruments Fair Value Disclosure
The estimated fair values of the Company’s financial instruments at March 25, 2011 and March 26, 2010 were as follows:
|
(in thousands)
|
2011
|
2010
|
||||||||||||||
|
Carrying
Amount
|
Estimated
Fair Value
|
Carrying
Amount
|
Estimated
Fair Value
|
|||||||||||||
|
Assets:
|
||||||||||||||||
|
Short-term investments
|
$ | 56,860 | $ | 56,860 | $ | 75,508 | $ | 75,508 | ||||||||
|
Liabilities:
|
||||||||||||||||
|
3¾% Convertible senior notes
|
$ | 10,500 | $ | 8,709 | $ | 10,500 | $ | 7,980 | ||||||||
|
7¼% Redeemable convertible subordinated debentures
|
$ | 23,704 | $ | 21,334 | $ | 23,704 | $ | 20,860 | ||||||||
NETWORK EQUIPMENT TECHNOLOGIES, INC.
NOTES TO CONSOLIDATED FINANCIAL STATEMENTS
(Continued)
The following methods and assumptions were used in estimating the fair values of financial instruments:
Cash and cash equivalents: The carrying amounts reported in the balance sheets for cash and cash equivalents approximate their estimated fair values due to their short maturities.
Short-term investments: Fair values are based on quoted market prices and observable prices that are based on inputs not quoted on active markets, but corroborated by market data. See Note 3.
Restricted cash: The carrying value approximates fair value.
Accrued liabilities: The carrying value approximates fair value.
Convertible debt: The Company has estimated the approximate fair value of these securities using the quoted market price or trade closest to March 25, 2011.
Foreign exchange contracts: The Company’s foreign exchange forward contracts require an exchange of foreign currencies to U.S. dollars or vice versa, and generally mature in one month or less. As of March 25, 2011 and March 26, 2010, the Company had outstanding foreign exchange forward contracts with aggregate notional amounts of $5.9 million and $5.1 million, respectively, which had remaining maturities of one month or less. As of March 25, 2011, the carrying amount, which was also the estimated fair value of the foreign exchange forward contracts, was based on prevailing financial market information. The amounts recorded on the consolidated balance sheets for foreign exchange contracts are not material.
Note 17. Litigation
A subsidiary of the Company, Quintum Technologies, LLC (Quintum), is party, by interpleader, to three related lawsuits in Greece filed by Lexis SA, a former distributor of Quintum products in Greece. The initial interpleader lawsuit was filed October 26, 2006, at the Multimember First Instance Court of Athens. The first two of these lawsuits were initially filed against Lexis by one of its customers, Advanced Telecom Systems (“ATS”), alleging that a set of hardware and software products acquired for ATS by Lexis failed to perform as a system. The products include Quintum’s hardware product and a software product by another vendor, Ipercom. In these first two lawsuits, the customer (ATS) seeks damages from the distributor (Lexis), and the distributor has interpleaded the product vendors, Quintum and Ipercom, asking them to pay any amounts that Lexis may be ordered to pay to ATS, who seeks a refund of amounts paid for the purchase of the hardware and software, totaling €78,215, and compensation for real and moral damages, totaling €4,054,893. The third lawsuit was initiated by one of ATS’ customers for non delivery of services, which were to be delivered through the system ATS purchased from Lexis. In this lawsuit, the ATS customer seeks various monetary damages totaling €2,859,847. ATS filed an interpleader lawsuit against Lexis and Lexis has filed the same against Quintum and Ipercom. Hearings on all the lawsuits and interpleader lawsuits are currently scheduled for February 2012. The Company has not accrued any amounts related to the claim, as it believes that a negative outcome is not probable.
In addition to the above, the Company is involved in various legal proceedings from time to time in the normal course of business.
ITEM 9. CHANGES IN AND DISAGREEMENTS WITH ACCOUNTANTS ON ACCOUNTING AND FINANCIAL DISCLOSURE
Not applicable.
ITEM 9A. CONTROLS AND PROCEDURES
(a) Conclusions Regarding the Effectiveness of Disclosure Controls and Procedures
In accordance with Section 302 of the Sarbanes-Oxley Act of 2002 and Section 13(a) or Section 15(d) of the Securities Exchange Act of 1934, management, under the supervision and with the participation of the chief executive officer (CEO) and chief financial officer (CFO), evaluated the effectiveness of our disclosure controls and procedures (as defined in Exchange Act Rule 13a-15(e)) at the end of the period covered by this report as well as any changes in disclosure controls and procedures that occurred during the period covered by this report. Our management, including our CEO and CFO, has concluded that our disclosure controls and procedures are effective as of March 25, 2011.
We intend to review and evaluate the design and effectiveness of our disclosure controls and procedures on an ongoing basis and correct any deficiencies that we may discover in the future. Our goal is to ensure that our senior management has timely access to all material financial and non-financial information concerning our business. While we believe the present design of our disclosure controls and procedures is effective to achieve our goal, future events affecting our business may cause us to significantly modify our disclosure controls and procedures.
(b) Management’s Annual Report on Internal Control over Financial Reporting
Our management is responsible for establishing and maintaining adequate internal control over financial reporting, as such term is defined in Exchange Act Rules 13a-15(f). Our internal control over financial reporting is designed to provide reasonable assurance regarding the reliability of financial reporting and the preparation of financial statements for external purposes in accordance with generally accepted accounting principles in the U.S. However, all internal control systems, no matter how well conceived and implemented, have inherent limitations. Therefore, even those systems determined to be effective can provide only reasonable assurance with respect to financial statement preparation and reporting. Under the supervision and with the participation of our management, including our principal executive officer and principal financial officer, we conducted an evaluation of the effectiveness of our internal control over financial reporting based on the framework in Internal Control—Integrated Framework issued by the Committee of Sponsoring Organizations of the Treadway Commission. Based on our evaluation under the framework in Internal Control—Integrated Framework, our management concluded that our internal control over financial reporting was effective as of March 25, 2011.
Deloitte & Touche LLP, an independent registered public accounting firm, has audited and issued a report on the effectiveness of our internal control over financial reporting, which appears below.
(c) Changes in Internal Control over Financial Reporting
No changes in our internal control over financial reporting occurred during the quarter ended March 25, 2011 that have materially affected, or are reasonably likely to materially affect, our internal control over financial reporting.
REPORT OF INDEPENDENT REGISTERED PUBLIC ACCOUNTING FIRM
To the Board of Directors and Stockholders of
Network Equipment Technologies, Inc.
Fremont, California
We have audited the internal control over financial reporting of Network Equipment Technologies, Inc. and subsidiaries (the “Company”) as of March 25, 2011, based on criteria established in Internal Control — Integrated Framework issued by the Committee of Sponsoring Organizations of the Treadway Commission. The Company’s management is responsible for maintaining effective internal control over financial reporting and for its assessment of the effectiveness of internal control over financial reporting. Our responsibility is to express an opinion on the Company’s internal control over financial reporting based on our audit.
We conducted our audit in accordance with the standards of the Public Company Accounting Oversight Board (United States). Those standards require that we plan and perform the audit to obtain reasonable assurance about whether effective internal control over financial reporting was maintained in all material respects. Our audit included obtaining an understanding of internal control over financial reporting, assessing the risk that a material weakness exists, testing and evaluating the design and operating effectiveness of internal control based on the assessed risk, and performing such other procedures as we considered necessary in the circumstances. We believe that our audit provides a reasonable basis for our opinion.
A company’s internal control over financial reporting is a process designed by, or under the supervision of, the company’s principal executive and principal financial officers, or persons performing similar functions, and effected by the company’s board of directors, management, and other personnel to provide reasonable assurance regarding the reliability of financial reporting and the preparation of financial statements for external purposes in accordance with generally accepted accounting principles. A company’s internal control over financial reporting includes those policies and procedures that (1) pertain to the maintenance of records that, in reasonable detail, accurately and fairly reflect the transactions and dispositions of the assets of the company; (2) provide reasonable assurance that transactions are recorded as necessary to permit preparation of financial statements in accordance with generally accepted accounting principles, and that receipts and expenditures of the company are being made only in accordance with authorizations of management and directors of the company; and (3) provide reasonable assurance regarding prevention or timely detection of unauthorized acquisition, use, or disposition of the company’s assets that could have a material effect on the financial statements.
Because of the inherent limitations of internal control over financial reporting, including the possibility of collusion or improper management override of controls, material misstatements due to error or fraud may not be prevented or detected on a timely basis. Also, projections of any evaluation of the effectiveness of the internal control over financial reporting to future periods are subject to the risk that the controls may become inadequate because of changes in conditions, or that the degree of compliance with the policies or procedures may deteriorate.
In our opinion, the Company maintained, in all material respects, effective internal control over financial reporting as of March 25, 2011, based on the criteria established in Internal Control — Integrated Framework issued by the Committee of Sponsoring Organizations of the Treadway Commission.
We have also audited, in accordance with the standards of the Public Company Accounting Oversight Board (United States), the consolidated financial statements and financial statement schedule as of and for the year ended March 25, 2011, of the Company and our report dated June 7, 2011, expressed an unqualified opinion on those financial statements and financial statement schedule.
/s/ DELOITTE & TOUCHE LLP
San Jose, California
June 7, 2011
ITEM 9B. OTHER INFORMATION
Not applicable.
PART III
Certain information required by Part III is omitted from this Form 10-K because NET will file its definitive proxy statement (“Proxy Statement”) pursuant to Regulation 14A within 120 days after the end of its fiscal year covered by this Report, and certain information included in the Proxy Statement is incorporated by reference into this Part III.
ITEM 10. DIRECTORS, EXECUTIVE OFFICERS AND CORPORATE GOVERNANCE
The information requested by Items 401, 405, 406 and 407(c)(3), (d)(4) and (d)(5) of Regulation S-K is incorporated herein by reference to the Proxy Statement. Pursuant to Item 401(b) of Regulation S-K, information about our executive officers is reported under the caption “Executive Officers” in Part I of this report.
Code of Ethics
Our Code of Business Conduct, which covers all directors and employees (including the Chief Executive Officer, Chief Financial Officer and Controller), meets the requirements of the SEC Rules promulgated under Section 406 of the Sarbanes-Oxley Act of 2002 for a code of ethics. The Code of Business Conduct is available free of charge on our Internet website located at www.net.com. In addition, any stockholder who wishes to obtain a printed copy of the Code of Business Conduct should write to: Investor Relations, NET, 6900 Paseo Padre Parkway, Fremont, California 94555-3660. Since adoption of the Code of Business Conduct, our Board has not granted a waiver of any of its provisions for any director or executive officer. Any future waivers or amendments will be disclosed on our Internet website.
ITEM 11. EXECUTIVE COMPENSATION
The information requested by Items 402 and 407(e)(4) and (e)(5) of Regulation S-K is incorporated herein by reference to the Proxy Statement.
ITEM 12. SECURITY OWNERSHIP OF CERTAIN BENEFICIAL OWNERS AND MANAGEMENT AND RELATED STOCKHOLDER MATTERS
The information requested by Item 403 of Regulation S-K is incorporated herein by reference to the Proxy Statement.
ITEM 13. CERTAIN RELATIONSHIPS AND RELATED TRANSACTIONS AND DIRECTOR INDEPENDENCE
The information requested by Items 404 and 407(a) of Regulation S-K is incorporated herein by reference to the Proxy Statement.
ITEM 14. PRINCIPAL ACCOUNTING FEES AND SERVICES
The information requested by Item 9(e) of Schedule 14A with respect to the fees and services related to our independent registered public accounting firm and the disclosure of the Audit Committee’s pre-approval policies and procedures is incorporated herein by reference to the Proxy Statement.
PART IV
ITEM 15. EXHIBITS, FINANCIAL STATEMENT SCHEDULES
|
(a)
|
1. Index to Consolidated Financial Statements
|
|
Report of Independent Registered Public Accounting Firm
|
36 |
|
Consolidated Balance Sheets as of March 25, 2011 and March 26, 2010
|
37 |
|
Consolidated Statements of Operations for the years ended March 25, 2011, March 26, 2010 and March 27, 2009
|
38 |
|
Consolidated Statements of Comprehensive Loss for the years ended March 25, 2011, March 26, 2010 and March 27, 2009
|
39 |
|
Consolidated Statements of Cash Flows for the years ended March 25, 2011, March 26, 2010 and March 27, 2009
|
40 |
|
Consolidated Statements of Stockholders’ Equity for the years ended March 25, 2011, March 26, 2010 and March 27, 2009
|
41 |
|
Notes to Consolidated Financial Statements
|
42 |
2. Index to Consolidated Financial Statement Schedules
|
Schedule II - Valuation and Qualifying Accounts
|
68 |
All other schedules are omitted because they are not required, are not applicable, or the information is included in the consolidated financial statements or notes thereto.
Separate financial statements of the Registrant are omitted because the Registrant is primarily an operating company and all subsidiaries included in the consolidated financial statements filed, in the aggregate, do not have a minority equity interest and/or long-term indebtedness to any person outside the consolidated group in an amount which together exceeds 5% of total consolidated assets at March 25, 2011.
3. Exhibits
Index to Exhibits
|
Incorporated by Reference
|
||||||||||||
|
Exhibit No.
|
Exhibit
|
Form
|
File No.
|
Filing Date
|
Exh. No.
|
Filed Herewith
|
||||||
|
3.1
|
Registrant’s Certificate of Incorporation.
|
S-8
|
333-101962
|
08/19/2008
|
4.1
|
|||||||
|
3.2
|
Registrant’s Bylaws, as amended.
|
8-K
|
001-10255
|
10/30/2007
|
3.1
|
|||||||
|
4.1
|
Indenture dated as of May 15, 1989 between Registrant and Morgan Guaranty Trust Company of New York.
|
10-K/A
|
001-10255
|
7/25/1989
|
4.4
|
|||||||
|
4.3
|
Certificate of Designations of Series A Junior Participating Preferred Stock filed with the Secretary of State of Delaware on August 24, 1989 (Exhibit 4.1 in the Registrant’s Form S-8 Registration Statement).
|
S-8
|
33-33013
|
1/19/1990
|
4.1
|
|||||||
|
4.4
|
Indenture, dated as of December 18, 2007, between Network Equipment Technologies, Inc. and U.S. Bank National Association, as trustee, with related form of 3.75% Senior Convertible Note due 2014.
|
8-K
|
001-10255
|
12/20/2007
|
4.4
|
|||||||
|
10.1
|
Headquarters Facilities – Lease between Ardenwood Corporate Park Associates and Network Equipment Technologies, Inc. dated December 21, 2000.
|
10-K
|
001-10255
|
6/28/2001
|
10.23
|
|||||||
|
10.1A
|
Headquarters Facilities – First Amendment to Lease between Ardenwood Corporate Park Associates and Network Equipment Technologies, Inc. dated August 11, 2010.
|
10-Q
|
001-10255
|
11/3/2010
|
10.48
|
|||||||
|
Registrant’s Amended and Restated 1993 Stock Option Plan, as amended March 21, 2007.
|
X
|
|||||||||||
|
10.3
|
Registrant’s Amended and Restated 1997 Stock Option Program, as amended April 16, 2002.
|
10-K
|
001-10255
|
6/18/2002
|
99.8
|
|||||||
|
10.4*
|
Registrant’s 2008 Equity Incentive Plan.
|
10-K
|
001-10255
|
5/22/2009
|
10.45
|
|||||||
|
Form of Change of Control Agreement between the Company and its executive officers.
|
|
X | ||||||||||
|
10.6
|
Form of Director and Officer Indemnification Agreement as signed by all directors and executive officers of the Company.
|
8-K
|
001-10255
|
7/23/2008
|
10.44
|
|||||||
|
Subsidiaries of Registrant (as of May 20, 2011).
|
X
|
|||||||||||
|
Consent of Independent Registered Public Accounting Firm.
|
X
|
|||||||||||
|
Certification of C. Nicholas Keating, Jr., President and Chief Executive Officer, pursuant to Rule 15d-14 of the Securities and Exchange Act of 1934, as adopted pursuant to Section 302 of the Sarbanes-Oxley Act of 2002.
|
X
|
|||||||||||
|
Certification of David Wagenseller, Vice President and Chief Financial Officer, pursuant to Rule 15d-14 of the Securities and Exchange Act of 1934, as adopted pursuant to Section 302 of the Sarbanes-Oxley Act of 2002.
|
X
|
|||||||||||
|
Certification of C. Nicholas Keating, Jr., President and Chief Executive Officer, pursuant to 18 U.S.C. Section 1350, as adopted pursuant to Section 906 of the Sarbanes-Oxley Act of 2002.
|
X
|
|||||||||||
|
Certification ofDavid Wagenseller, Vice President and Chief Financial Officer, pursuant to 18 U.S.C. Section 1350, as adopted pursuant to Section 906 of the Sarbanes-Oxley Act of 2002.
|
X
|
|||||||||||
* Compensation plans or arrangements in which directors and executive officers are eligible to participate.
SIGNATURES
Pursuant to the requirements of Section 13 or 15(d) of the Securities Exchange Act of 1934, the Registrant has duly caused this report to be signed on its behalf by the undersigned, thereunto duly authorized.
|
NETWORK EQUIPMENT TECHNOLOGIES, INC.
(Registrant)
|
|||
|
Date: June 7, 2011
|
By:
|
/s/ C. NICHOLAS KEATING, JR.
|
|
| C. Nicholas Keating, Jr. | |||
| President and Chief Executive Officer | |||
Pursuant to the requirements of the Securities Exchange Act of 1934, this report has been signed below by the following persons on behalf of the Registrant and in the capacities and on the dates indicated.
|
Signature
|
Title
|
Date
|
||
|
/s/ C. NICHOLAS KEATING, JR.
|
President, Chief Executive Officer and Director (Principal Executive Officer)
|
June 7, 2011
|
||
|
C. Nicholas Keating, Jr.
|
||||
|
/s/ DAVID WAGENSELLER
|
Vice President and Chief Financial Officer (Principal Financial Officer)
|
June 7, 2011
|
||
|
David Wagenseller
|
||||
|
/s/ KAREN CARTE
|
Vice President and Chief Accounting Officer (Principal Accounting Officer)
|
June 7, 2011
|
||
|
Karen Carte
|
|
/s/ DIXON R. DOLL
|
Chairman of the Board
|
June 7, 2011
|
||
|
Dixon R. Doll
|
||||
|
/s/ FREDERICK D. D’ALESSIO
|
Director
|
June 7, 2011
|
||
|
Frederick D. D’Alessio
|
||||
|
/s/ DAVID R. LAUBE
|
Director
|
June 7, 2011
|
||
|
David R. Laube
|
NETWORK EQUIPMENT TECHNOLOGIES, INC.
SCHEDULE II
Valuation and Qualifying Accounts
(In thousands)
|
Description
|
Balance at beginning of period
|
Charged to costs and expenses
|
Charged to other accounts (1)
|
Deduction/write-offs
|
Balance at end of period
|
|||||||||||||||
|
For the year ended March 27, 2009:
|
||||||||||||||||||||
|
Allowance for doubtful accounts and sales returns
|
$ | 452 | $ | 152 | $ | 72 | $ | (325 | ) | $ | 351 | |||||||||
|
For the year ended March 26, 2010:
|
||||||||||||||||||||
|
Allowance for doubtful accounts and sales returns
|
$ | 351 | $ | 22 | $ | (108 | ) | $ | — | $ | 265 | |||||||||
|
For the year ended March 25, 2011:
|
||||||||||||||||||||
|
Allowance for doubtful accounts and sales returns
|
$ | 265 | $ | 61 | $ | (92 | ) | $ | — | $ | 234 | |||||||||
(1) Amount represents additions or deductions to accounts receivable allowances representing sales return reserve that were charged or credited primarily to revenue.
68