Attached files
| file | filename |
|---|---|
| 8-K - FORM 8-K - W&T OFFSHORE INC | d8k.htm |
 RBC
Capital Markets Global Energy and Power Conference
June 7, 2011
Exhibit 99.1 |
 1
1
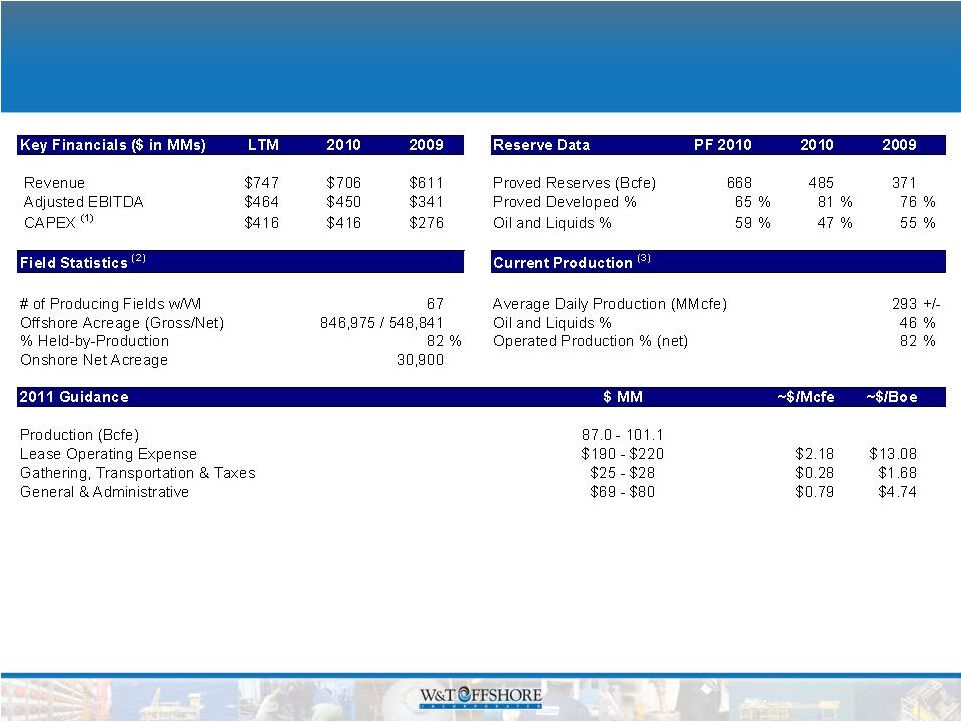
Company Snapshot
(1) Includes acquisition-related CAPEX.
(2) Data as of 12/31/10 for offshore properties. Producing fields include
offshore fields only. (3) Average daily production from 5/11/11 to 5/19/11;
includes recently announced Permian acquisition production of 2,950 Boe/d. |
 Key
Investment Considerations •
Strong operating track record with 27+ year history of success in
the Gulf of Mexico
•
High-quality, oil-exposed reserve base with history of reserve
and production growth
•
Strong financial position and healthy liquidity level
•
Conservative operating strategy with drilling budget financed
through internally generated cash flow
•
Proven, experienced management team whose interests align
with all stakeholders (CEO owns over 50% of stock)
|
 3
Company Overview
•
Large acreage position in the Gulf of Mexico primarily held by
production
•
Added Permian Basin to the portfolio with acquisition on May 11,
2011
–
Oily, longer-lived proved reserves
–
Provides “predictable growth”
opportunities, and complements GOM
conventional shelf and deepwater assets with high cash flow and upside
potential
–
Reserves to production profile increases to 6.7 years, while oil
and
liquids percentage increases to 59%
•
Continued emphasis on reserve and production growth
•
Strong cash flow focused on full cycle economics
•
Active drilling program with 36 (27 onshore, 9 offshore) wells planned
as part of $310 million capital program |
 4
4
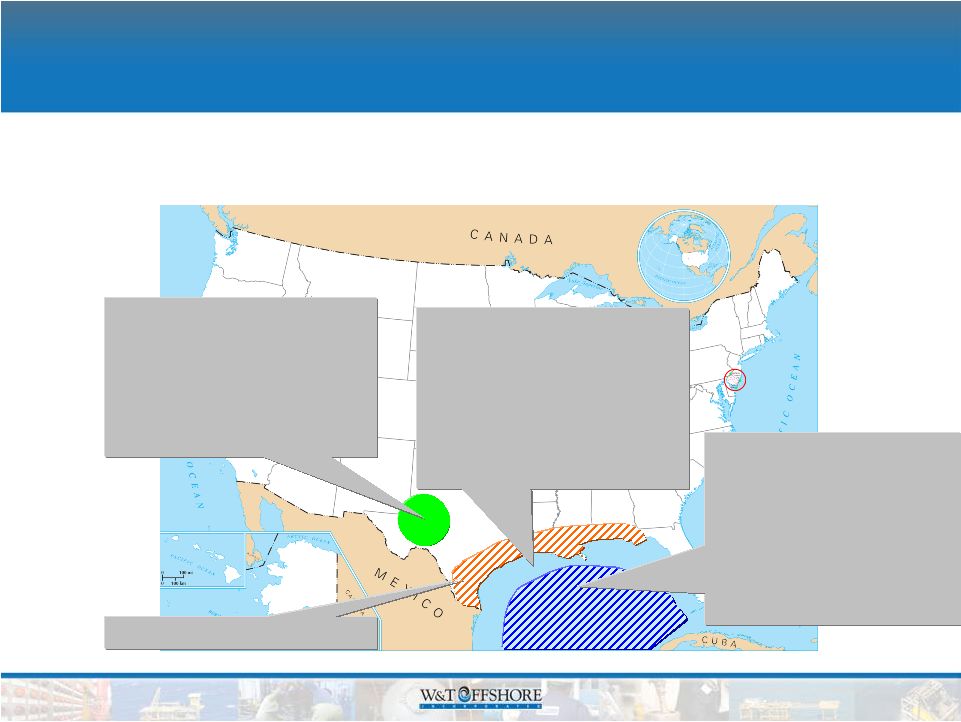
Company Diversification in Progress
•
Since April 2010, we have diversified our existing portfolio by
acquiring producing assets at attractive prices in the deepwater
GOM and the Permian basin
(1) Pro forma for recently announced Permian basin acquisition.
Permian Basin
(1)
•
Proved Reserves: 182 Bcfe
/
30 MMBoe
•
Acreage: 30,900 Net
•
~6% of Production
GOM Deepwater
•
Proved Reserves:
144 Bcfe
/
24 MMBoe
•
Acreage: 137,792 Gross /
93,670 Net
•
~31% of Production
(1)
GOM Shelf
•
Proved Reserves: 341 Bcfe
/
57 MMBoe
•
Acreage: 709,183 Gross /
455,171 Net
•
~62% of Production
(1)
Gulf Coast |
 5
5
Strategic Plan
•
Pursue drilling and development of our recently
acquired Permian Basin properties
–
Integrate West Texas operations
•
Expand/acquire acreage positions in onshore prospect
areas
•
Continue evaluations of other potential acquisitions
•
Pursue active and balanced drilling program to increase
reserves and production
–
Historically drilled within internally generated cash flow
|
 Onshore |
 7
7
Permian Basin Acquisition Provides Base
for Transformation
•
Signed purchase and sale agreement to acquire approximately
21,900 gross acres (21,500 net acres) from private sellers for
approximately $377 million
•
Strong volumes from proved developed production
–
Current net daily production of about 2,950 BOE
–
Production grew ~55% from 1,900 BOE at Jan. 1, 2011
–
Currently 73 producing wells
•
Proved and probable reserves
–
30 MMBoe of proved reserves
–
25 MMBoe of additional probable reserves
•
Conservative estimates of reserves
–
Analyses assume an average estimated ultimate recovery of ~100 MBoe net
per well for PUDs and 40 acres spacing
•
High ratio of oil and liquid (91%) to gas production and reserves
–
Reserves to production ratio increases to 6.7 years and W&T’s % of oil /
liquids increases to 59% |
 8
8
Permian Basin Acquisition Provides
Long-term Growth
•
Low risk operations with a multi-year extensive drilling inventory
–
450 to 500 drilling locations identified for future exploration and
development –
Proved reserves based on 40 acre spacing but certain nearby operators are
using 20 acre spacing
–
3 drilling
and
2
-
4
workover
rigs
continually
working
–
Focused on improving operating efficiency
•
Plan for three drilling rigs working throughout remainder of 2011
–
Primarily targeting the “Wolfberry”
trend, but deeper targets have been tested
and are producing
–
2011 Capital Expenditures of $35 million -
$40 million
–
Anticipate drilling 15 to 20 development wells in 2011
|
 9
9
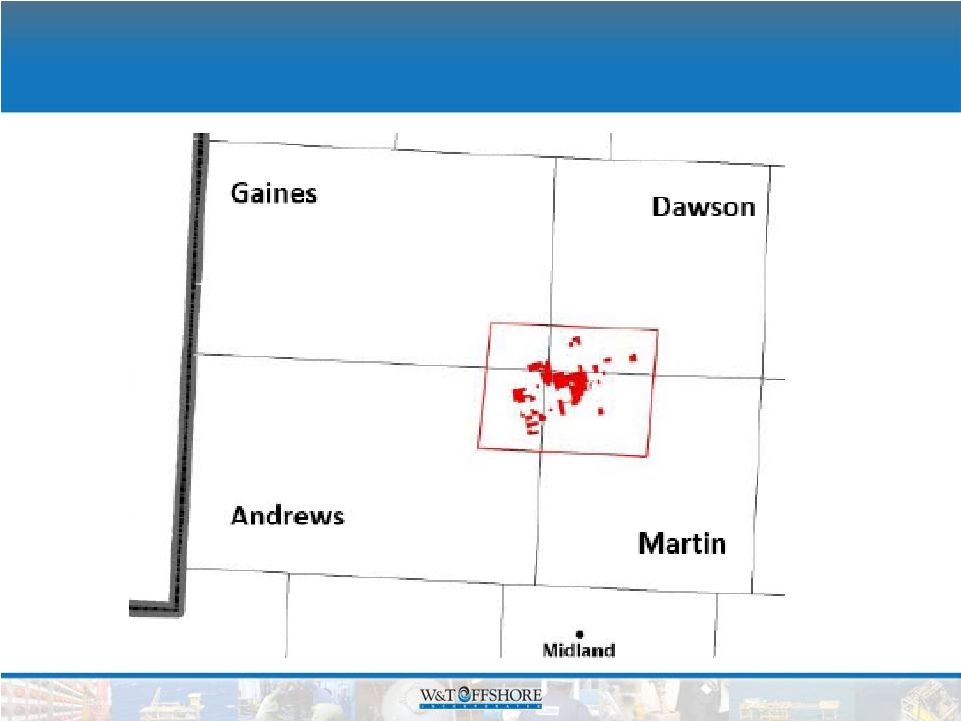
Newly Acquired Assets in West Texas:
Martin, Dawson, Andrews & Gaines Counties |
 Wolfberry West Texas Completions *
Limestone Pay
Organic Rich Shale Play
Average Cased Depth
of Wellbore
Fractured Stimulation
Stages
Clear-
fork
Dean
Non-organic Shale Non-pay
Sandstone Play
12,500’
13,250’
Devonian
Silurian
* Not drawn to scale. |
 11
11
Other Onshore Activities
•
In addition to our West Texas Permian Basin acquisition, we are actively
involved: –
In South Texas –
•
Our initial well, in which we have a 25% non-operating working interest (WI),
was completed and found 22 feet of gas and condensate. This area has
potential for additional drilling opportunities.
–
In West Texas –
•
We
have
also
acquired
about
9,400
net
acres
in
the
Permian
Basin
through
leasing
and
farm-outs and expect to have about seven exploratory wells drilled before the
end of the year. Working interests vary; we should operate three or
four of such exploratory wells. –
In East Texas –
•
Our
first
well
reached
total
depth
in
April.
Due
to
downhole
problems
in
this
non-operated
well, a sidetrack operation was commenced early in May and should be again at
total depth in July. The original operation found both conventional
and unconventional reservoirs. We had a 25% WI in the original well
and have increased our participation to about 35% in the subsequent
operation. This area has potential for additional drilling opportunities. |
 12
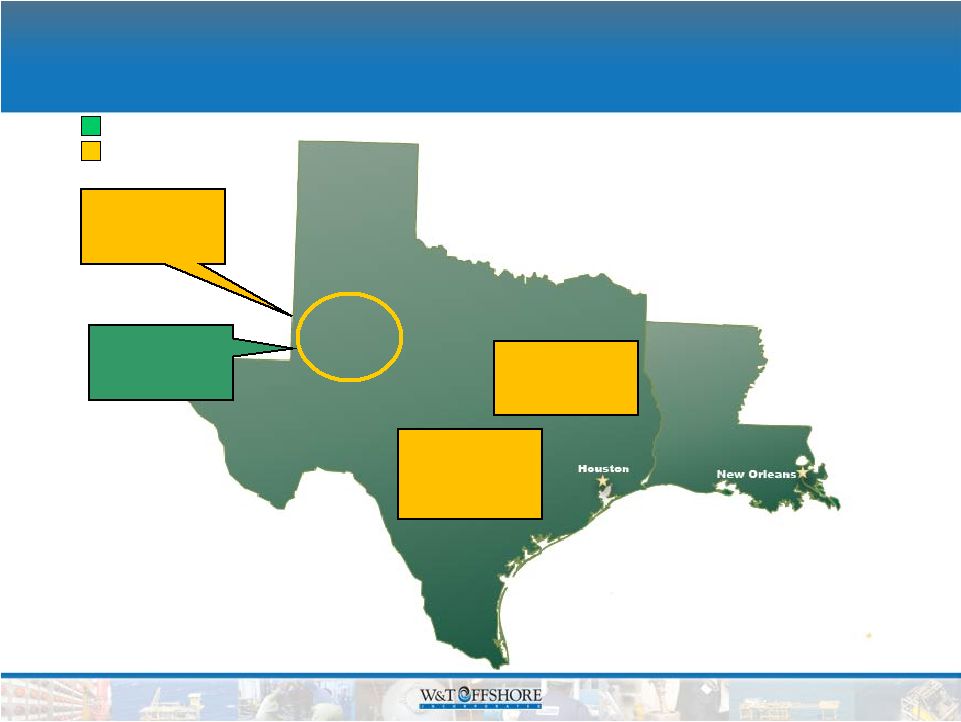
12
Onshore 2011 Drilling Program
South Texas
WI: 50%
2 Wells
East Texas
WI: 25%
1 well
Exploration
Development
West Texas
WI: 25% to 100%
7 -
8 Wells
West Texas
WI: 100%
15 –
20 Wells
•
In addition to the recently announced
Permian acquisition, we have also
acquired 9,400 net exploratory acres in
the Permian basin |
 Gulf
of Mexico |
 14
Gulf of Mexico Highlights
•
Strong operating track record
–
10 year exploration drilling success rate of 77% and 10 year development drilling
success rate of 91%
–
Proved reserve replacement rate of 231% in 2010
–
Excellent safety track record and culture of operating success
–
All-in F&D costs in 2010 of $2.59/Mcfe
•
Large acreage position
•
Great history of production and reserves
–
Highly prolific with multiple pay zones
–
Reserves at deeper but virtually untapped zones, significant upside
potential –
Established infrastructure on shelf
–
Substantial percentage of oil reserves
–
Reserve to production profile is consistent
•
Attractive reservoir characteristics
–
High porosity rock provides quick return on investment
–
Cash flow velocity significantly higher than most other basins
–
Balanced growth opportunities (high impact or low risk)
•
Costs historically adjust quickly to commodity prices due to shorter
contract terms |
 15
15
Gulf of Mexico Proved Reserve with
Geographic Diversification
•
67 fields
•
80% operated
•
846,975 gross acres, 548,841 net acres
•
82% held by production
•
Producing 274 MMcfe
per day
•
44% oil & liquids / 56% gas |
 16
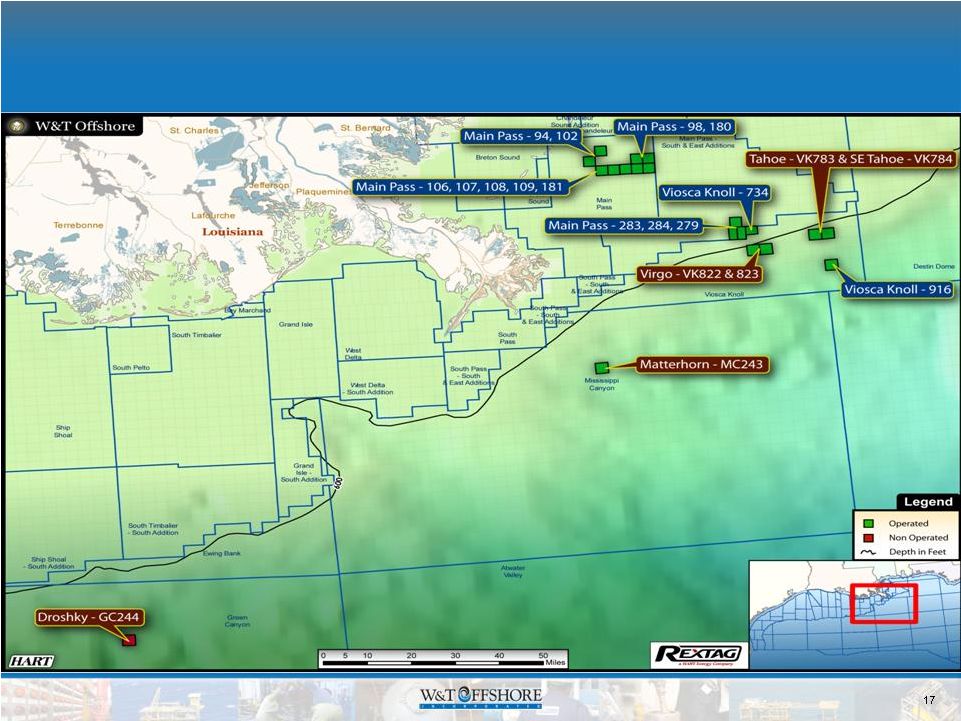
Gulf of Mexico Recent Activity
•
We are integrating two purchases closed in 2010 consisting of
virtually all proved, producing reserves
–
We
acquired
two
properties
from
Total
and
closed
the
acquisition
on
5/3/10
–
We acquired three properties from Shell and closed 11/3/10
•
Currently working to close a fourth Shell property consisting
of virtually all proved, producing reserves
•
Restored production to the Main Pass 108 Field early in the
2011 second quarter
–
Current net production amounts to about 42MMcfe per day, or 35 MMcf
and 1,300 barrels per day
•
Successfully drilled one exploratory well at Main Pass 180 and
a development sidetrack at our MP 108 D-3 well
•
Anticipate drilling three more exploratory wells and four
development wells offshore this year |
 17
17
Concentrated Operations in Recently
Acquired GOM Fields and Focus Areas |
 18
18
Offshore 2011 Drilling Program
Viosca Knoll
Mississippi Canyon
Atwater Valley
Green Canyon
Garden Banks
East Breaks
Mustang
Island
Matagorda
Island
Brazos
Galveston
High
Island
E.
Cameron
Vermilion
Eugene
Island
Ship
Shoal
South
Timbalier
Ewing
Bank
West
Delta
Grand
Isle
Main
Pass
S. and E.
Main
Pass
W.
Cameron
Exploration
Development
MP 180 A-2
WI: 100%
Shelf
(Drilled and
successful)
MP 108 #8 & Tex W5
WI: 75%
Shelf
West Cameron 73 #2
WI: 30%
Deep Shelf
Deepwater
Prospect
WI: 20%
MP 108 D-3 ST
WI: 100%
Shelf
(Drilled and successful)
SS 349 E
WI: 100%
Shelf
ST 316 A-2 ST
WI: 40%
Shelf
SS 349 B
WI: 100%
Shelf |
 19
Regulatory Developments --
Deepwater
•
Permits approved for 14 unique deepwater wells since
drilling was halted after last year’s spill
•
Well
control
options
–
Operators
to
show
how
they
would
respond to subsea well control issue.
–
Helix Well Containment Group (HWCG)
–
Marine Well Containment Company (MWCC)
–
Total Deepwater Solution (TDWS)
•
W&T has executed a contract with HWCG
•
The first 3 approved deepwater drilling permit were
members of the HWCG |
 Other
Operational and Financial Information |
 PDP
41%
PDNP
24%
PUD
35%
21
21
Proved Reserves
PDP
49%
PDNP
32%
PUD
19%
Pro Forma 2010
2010
485
Bcfe
668
Bcfe |
 22
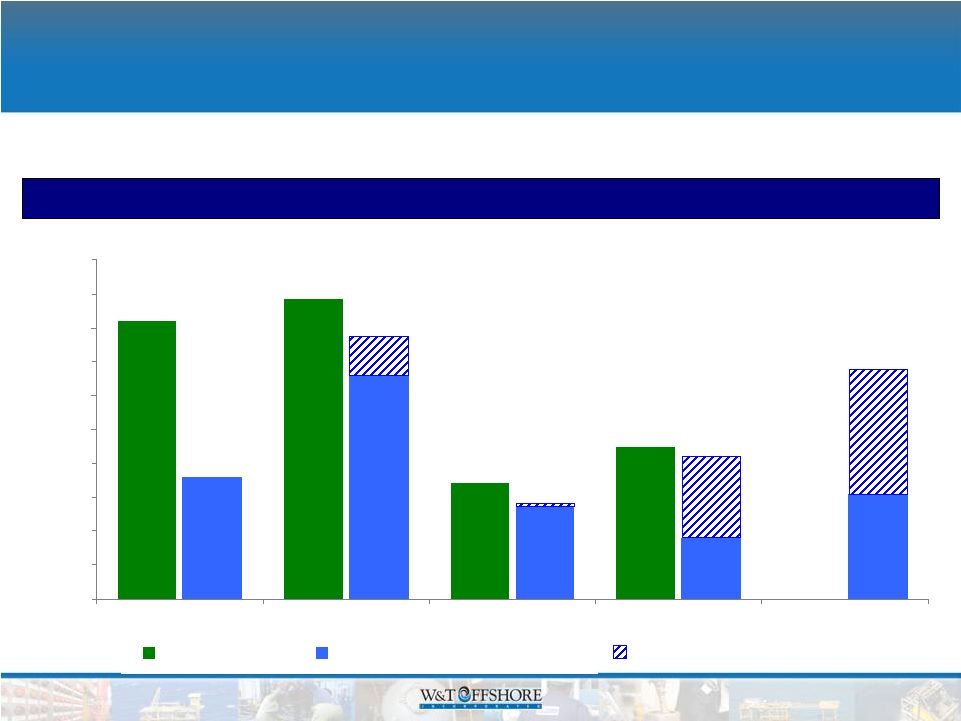
22
Drilling Within Cash Flow
Adjusted EBITDA vs. Capital Expenditures
($ in millions)
Capital
expenditures
funded
largely
through
internally
generated
cash
flow
$884
$820
$341
$450
$687+
$416
$276
$775
$359
$0
$100
$200
$300
$400
$500
$600
$700
$800
$900
$1,000
2007
2008
2009
2010
2011E
Adj. EBITDA
CAPEX, Excl. Acquisitions
Acquisition CAPEX
$884
$820
$341
$450
$687+
$416
$276
$775
$359
$0
$100
$200
$300
$400
$500
$600
$700
$800
$900
$1,000
2007
2008
2009
2010
2011E
Adj. EBITDA
CAPEX, Excl. Acquisitions
Acquisition CAPEX
Estimate |
 23
23
Liquidity Profile
•
Cash balance at May 25, 2011 ~ $71 million
•
New four-year revolver with $525 million borrowing base
–
Borrowing base increases to $575 million when the fourth Shell
property closes
–
The newly acquired Permian Basin assets have yet to be
considered for an increase to the borrowing base
–
~$150 million drawn on revolver pro forma for Permian
acquisition and new high yield bond offering
•
Net cash provided by operating activities $464.8 million
for 2010 |
 Appendix |
 25
The following table presents a reconciliation of our consolidated net income to
consolidated EBITDA to Adjusted EBITDA:
We define EBITDA as net income (loss) plus income tax expense (benefit), net
interest expense (which includes interest income), depreciation, depletion,
amortization and accretion and impairment of oil and natural gas properties. Adjusted EBITDA excludes
the loss on extinguishment of debt and the unrealized gain or loss related to our
derivative contracts. Although not prescribed under GAAP, we believe
the presentation of EBITDA and Adjusted EBITDA provide useful information regarding our ability to
service debt and fund capital expenditures and they help our investors understand
our operating performance and make it easier to compare our results with
those of other companies that have different financing, capital and tax structures. EBITDA and
Adjusted
EBITDA
should
not
be
considered
in
isolation
from
or
as
a
substitute
for
net
income,
as
an
indication
of
operating
performance or cash flow from operating activities or as a measure of
liquidity. EBITDA and Adjusted EBITDA, as we calculate them, may not
be comparable to EBITDA and Adjusted EBITDA measures reported by other companies. In addition, EBITDA and
Adjusted EBITDA do not represent funds available for discretionary use.
Reconciliation of Net Income to EBITDA
Twelve Months
Ended
March 31,
2007
2008
2009
2010
2010
2011
2011
($ in thousands)
Net income
144,300
$
(558,819)
$
(187,919)
$
117,892
$
42,315
$
18,649
$
94,226
$
Income taxes (benefit)
71,459
(269,663)
(74,111)
11,901
4,020
10,182
18,063
Net interest expense (income)
30,684
21,337
39,245
36,996
9,376
8,717
36,337
Depreciation, depletion,
amortization and accretion
532,910
521,776
342,537
294,100
69,209
74,092
298,983
Impairment of oil and natural gas
properties
--
1,182,758
218,871
--
--
--
--
EBITDA
779,353
897,389
338,623
460,889
124,920
111,640
447,609
Loss on extinguishment of debt
2,806
--
2,926
--
--
--
--
Unrealized derivatives loss (gain)
37,831
(13,501)
5,370
9,511
(5,109)
21,617
36,237
Royalty relief recoupment
--
--
--
(24,881)
--
--
(24,881)
Transportation allowance
--
--
(5,558)
4,687
--
--
4,687
Adjusted EBITDA
819,990
$
883,888
$
341,361
$
450,206
$
119,811
$
133,257
$
463,652
$
Year Ended December 31,
Three Months Ended
March 31, |
 26
Forward-Looking Statement Disclosure
This
presentation,
contains
“forward-looking
statements”
within
the
meaning
of
the
Private
Securities
Litigation
Reform
Act
of
1995, Section 27A of the Securities Act and Section 21E of the Exchange Act.
Forward-looking statements give our current expectations or forecasts of
future events. They include statements regarding our future operating and financial performance.
Although we believe the expectations and forecasts reflected in these and other
forward-looking statements are reasonable, we can give no assurance they
will prove to have been correct. They can be affected by inaccurate assumptions or by known
or unknown risks and uncertainties. You should understand that the following
important factors, could affect our future results and could cause those
results or other outcomes to differ materially from those expressed or implied in the forward-looking
statements
relating
to:
(1)
amount,
nature
and
timing
of
capital
expenditures;
(2)
drilling
of
wells
and
other
planned
exploitation
activities; (3) timing and amount of future production of oil and natural gas; (4)
increases in production growth and proved reserves; (5) operating costs such
as lease operating expenses, administrative costs and other expenses; (6) our future
operating or financial results; (7) cash flow and anticipated liquidity; (8) our
business strategy, including expansion into the deep shelf and the deepwater
of the Gulf of Mexico, and the availability of acquisition opportunities; (9) hedging strategy; (10)
exploration and exploitation activities and property acquisitions; (11) marketing
of oil and natural gas; (12) governmental and environmental regulation
of the oil and gas industry; (13) environmental liabilities relating to potential pollution arising from our
operations; (14) our level of indebtedness; (15) timing and amount of future
dividends; (16) industry competition, conditions, performance and
consolidation; (17) natural events such as severe weather, hurricanes, floods, fire and earthquakes; and (18)
availability of drilling rigs and other oil field equipment and services.
We caution you not to place undue reliance on these forward-looking statements,
which speak only as of the date of this presentation or as of the date of
the report or document in which they are contained, and we undertake no obligation to update
such
information.
The
filings
with
the
SEC
are
hereby
incorporated
herein
by
reference
and
qualifies
the
presentation
in
its
entirety.
Cautionary Note to U.S. Investors
The
United
States
Securities
and
Exchange
Commission
permits
oil
and
gas
companies,
in
their
filings
with
the
SEC,
to
disclose
only
proved
reserves
that
a
company
has
demonstrated
by
actual
production
or
conclusive
formation
tests
to
be
economically and legally producible under existing economic and operating
conditions. U.S. Investors are urged to consider closely the
disclosure in our Form 10-K for the year ended December 31, 2010, available from us at Nine Greenway Plaza,
Suite 300, Houston, Texas 77046. You can obtain these forms from the SEC by
calling 1-800-SEC-0330. |
 W&T Offshore, Inc. (NYSE: WTI)
Nine Greenway Plaza
Suite 300
Houston, TX 77046
Main line -
713-626-8525
Fax -
713-626-8527
Investor
Relations
-
713-297-8024
www.wtoffshore.com
www.investorrelations@wtoffshore.com |