Attached files
| file | filename |
|---|---|
| 8-K - FORM 8-K - Sabra Health Care REIT, Inc. | d8k.htm |
 INVESTOR
PRESENTATION June 2011
Exhibit 99.1 |
 FORWARD LOOKING
STATEMENTS 2
Statements made in this presentation that are not historical facts are
“forward-looking” statements (as defined in the Private
Securities Litigation Reform Act of 1995) that involve risks and
uncertainties and are subject to change at any time. These
statements may be identified, without limitation, by the use of “expects,”
“believes,”
“intends,”
“should”
or comparable terms or
the negative thereof. Forward-looking statements in this presentation also include all
statements regarding our liquidity, financing plans, business strategy, the expected
amounts and timing of dividends, growth opportunities, acquisition plans and plans and
objectives of management for future operations. These statements are made as of the date
hereof and are subject to known and unknown risks, uncertainties, assumptions and other
factors—many of which are out of our control and difficult to forecast—that
could cause actual results to differ materially from those set forth in or implied by our
forward-looking statements. These risks and uncertainties include but are not
limited to: our dependence on Sun Healthcare Group, Inc., formerly known as SHG Services, Inc.
(“Sun”), until we are able to diversify our portfolio; our ability to qualify and
maintain our status as a real estate investment trust (“REIT”); changes in
general economic conditions and volatility in financial and credit markets; our ability to pursue and complete
acquisitions and the costs and management attention required to do so; the significant amount
of our indebtedness; covenants in our debt agreements that may restrict our ability to
make acquisitions, incur additional indebtedness and refinance indebtedness on favorable
terms; increases in market interest rates; the impact of healthcare reform legislation on our business; competitive
conditions in our industry; and other factors discussed from time to time in our news
releases, public statements and/or filings with the Securities and Exchange Commission
(the “SEC”), especially the “Risk Factors” sections of our Annual
and Quarterly Reports on Forms 10-K and 10-Q, including our Annual Report on
Form 10-K for the fiscal year ended December 31, 2010. We assume no, and hereby
disclaim any, obligation to update any of the foregoing or any other forward-looking statements as a result
of new information or new or future developments, except as otherwise required by law.
SUN INFORMATION
This presentation includes information regarding Sun. Sun is subject to the reporting
requirements of the SEC and is required to file
with the SEC annual reports containing audited financial information and quarterly reports
containing unaudited financial information. The information related to Sun provided in
this presentation has been provided by Sun or derived from Sun’s public filings.
We have not independently verified this information. We have no reason to believe that
such information is inaccurate in any material respect. We are providing this data for
informational purposes only. Sun’s filings with the SEC can be found at
www.sec.gov. |
 NON-GAAP
FINANCIAL MEASURES 3
This presentation includes the following financial measures defined as non-GAAP financial
measures by the SEC: EBITDA, Adjusted EBITDA, funds from operations (“FFO”),
adjusted FFO (“AFFO”), and normalized AFFO. These measures may be different
than non-GAAP financial measures used by other companies and the presentation of these measures is not intended to
be considered in isolation or as a substitute for financial information prepared and presented
in accordance with U.S. generally accepted accounting principles.
EBITDA is defined as net income before interest expense, income tax expense and depreciation
and amortization. Adjusted EBITDA is defined as EBITDA adjusted to exclude
stock-based compensation expense and acquisition pursuit costs. FFO is
calculated in accordance with The National Association of Real Estate Investment
Trusts’ (“NAREIT”) definition of “funds from
operations,”
and is defined as net income, computed in accordance with GAAP,
excluding gains or losses from real estate
dispositions, plus real estate depreciation and amortization. AFFO is defined as FFO excluding
straight-line rental income adjustments, acquisition pursuit costs,
stock-based compensation expense and amortization of deferred financing costs.
Normalized AFFO represents AFFO adjusted for one-time start up costs.
Reconciliations of these non-GAAP financial measures to the GAAP financial measures we
consider most comparable are included under “Actual and Pro Forma
Reconciliation” in this presentation. |
 4
|
 SABRA HAS
COMPETITIVE INDUSTRY PRESENCE 5
Formed by Opco/ Propco split of Sun Healthcare Group
Independently traded as of November 2010 (NASDAQ: SBRA)
Structured as an UPREIT
B/B2 rating (S&P/ Moody’s)
87 health care investments*
67 skilled nursing facilities
86 leased to Sun Healthcare Group
Presence in 20 states*
$441.7mm equity market cap*
$747.2mm total enterprise value*
$68.0mm of capital invested (as of June 1, 2011)
$100.0mm untapped revolver
Management team with over 20 years total operational experience
Rick Matros, Chairman & CEO
Harold Andrews, CFO
Talya Nevo-Hacohen, CIO
Formation
Portfolio
Capitalization
Management
*As of March 31, 2011. |
 OPPORTUNITY
Few capital providers serving the smaller operators
Over
90%
of
senior
housing
facilities
are
owned
in
portfolios
of
less
than
10
properties
(1)
Larger health care REITs have made transformational deals and grown
significantly
Lack of debt sources limits private equity activity
Uncertainty surrounding government reimbursement (Medicare and
Medicaid) chills new investor interest
Opportunities for quality, accretive acquisitions
6
(1)
Source: NIC MAP Q12011 Ownership Summary for MAP 100 as of Q12011. Statistic includes
assisted living, independent living and nursing care facilities. Be the capital provider
of choice to local and regional operators of healthcare facilities
|
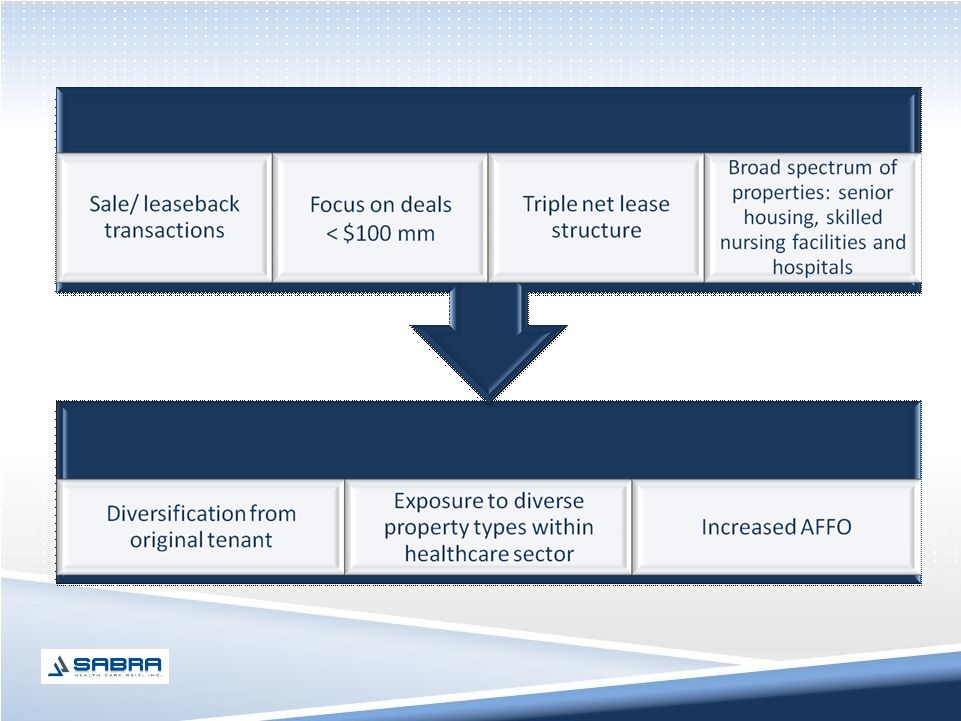 SABRA
CAPITALIZES ON OPPORTUNITY 7
Execution
Execution
Focused Tactics |
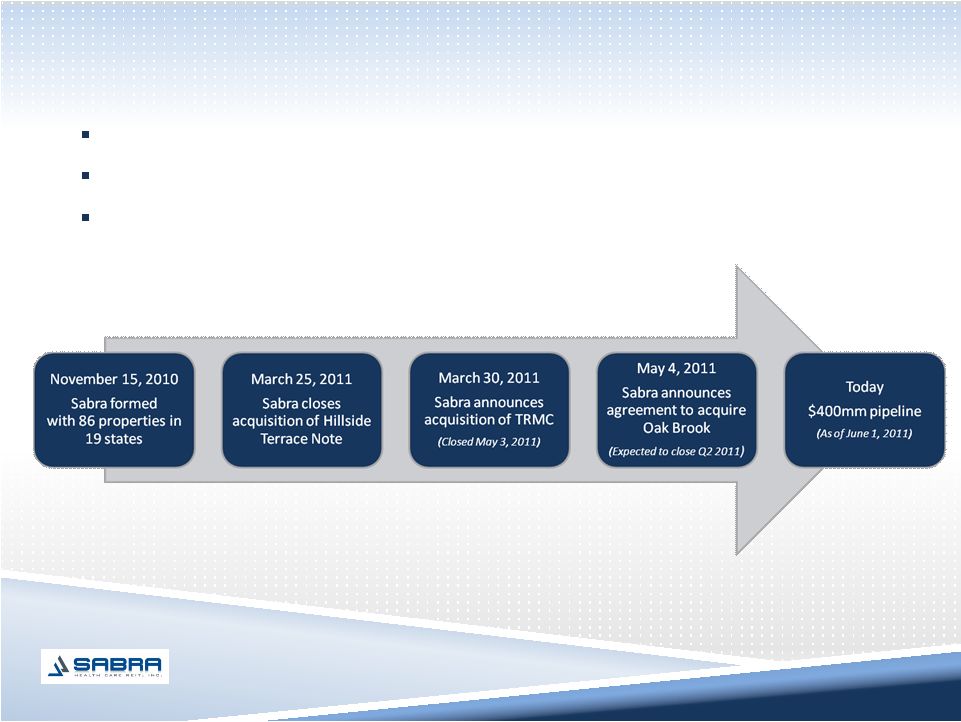 ACQUISITIONS
YIELD DIVERSIFICATION Acquisition of Texas Regional Medical Center and Hillside Terrace
Note Agreement to acquire Oak Brook Health Care Facility
Steady pipeline across spectrum of healthcare real estate
8 |
 Oak Brook
Health Care Facility (Expected to close Q2 2011)
Texas Regional Medical
Center at Sunnyvale
(Closed May 3, 2011)
9
Purchase Price: $62.7mm
Investment Type: Equity
Property Type: Acute Care Hospital
Available Beds: 70
Facility Age: 1.5 years
Facility EBITDAR
(1)
: $17.5mm
Facility EBITDAR Coverage: 3.02x
Annualized GAAP Rental Income: $6.6mm
Initial Cash Yield: 9.25%
Purchase Price: $11.3mm
Investment Type: Equity
Property Type: SNF
Available Beds: 120
Facility Age: 24 years
Facility EBITDAR
(1)
: $1.6mm
Facility EBITDAR Coverage: 1.50x
Annualized GAAP Rental Income: $1.3mm
Occupancy as of March 31, 2011: 96.0%
Initial Cash Yield: 9.50%
Purchase Price: $5.3mm
Investment Type: Debt
Property Type: AL, IL and Memory Care
Facility Age (based on renovation): 2 years
Occupancy as of March 31, 2011: 86.5%
Annualized GAAP Interest Income: $0.7mm
Initial Cash Yield (based on interest income): 12.22%
Hillside Terrace Mortgage Note
(Closed March 25, 2011)
*
**
INVESTMENT HIGHLIGHTS
(1)
Facility EBITDAR is for 12 months ended March 31, 2011 and
has been provided to Sabra by the applicable tenant.
|
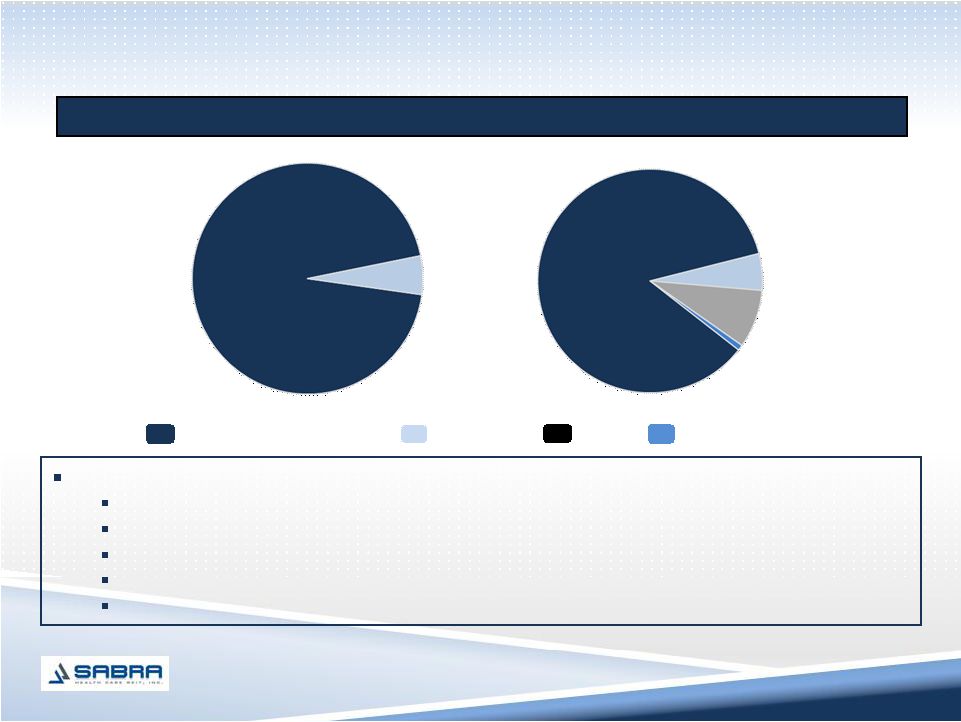 10
Senior Housing
(3)
Skilled Nursing/ Healthcare Facilities
(2)
Actual
Pro Forma
(1)
Acquisitions are changing the revenue makeup of our portfolio
(1)
Pro forma assumes TRMC, Hillside Terrace Note and Oak Brook acquisitions occurred on January
1, 2011. (2)
Skilled nursing and healthcare facilities include skilled nursing, multi-license
designation and mental health facilities. (3)
Senior housing facilities include independent living, assisted living and CCRC
facilities. (4)
Interest income includes impact of Hillside Terrace Note.
(5)
Inception
refers
to
the
date
from
which
Sabra
separated
from
Sun
Healthcare,
November 15, 2010 (86 properties).
94.6%
5.3%
8.4%
85.5%
0.8%
Sabra’s Revenue
$79.3 million of invested capital leads to (pro forma impact
(1)
):
Annualized normalized AFFO increase from $37.5 million to $44.9 million (20% increase)
Interest coverage increase from 2.28x to 2.57x
Leverage decrease from 5.96x to 5.27x
Invested capital from inception grew 14.0%
Sun concentration reduced to 89.0% since inception
(5)
5.4%
Hospital
Interest Income
(4)
IMPACT OF ACQUISITIONS
(as of March 31, 2011) |
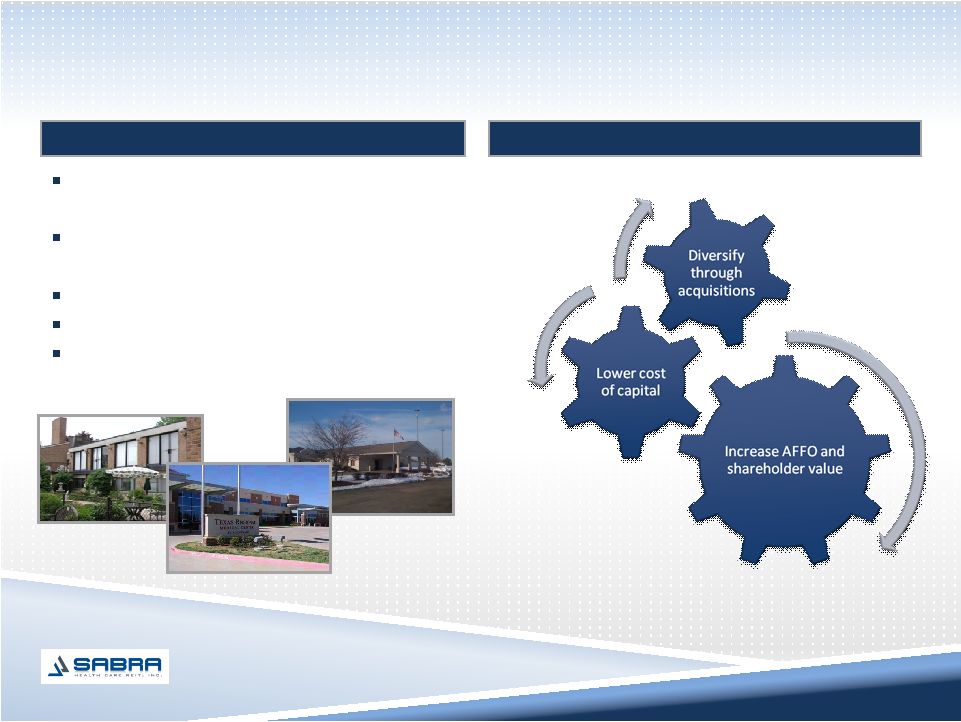 CAPITAL
DEPLOYMENT AND GROWTH STRATEGY 11
Sabra’s capital deployment strategy
Deploy available liquidity into
accretive acquisitions
Reduce Sun revenue concentration
and diversify asset base
Improve credit rating statistics
Replenish or expand revolver
Continue accretive acquisitions
Long-term benefits for Sabra and investors |
 12
|
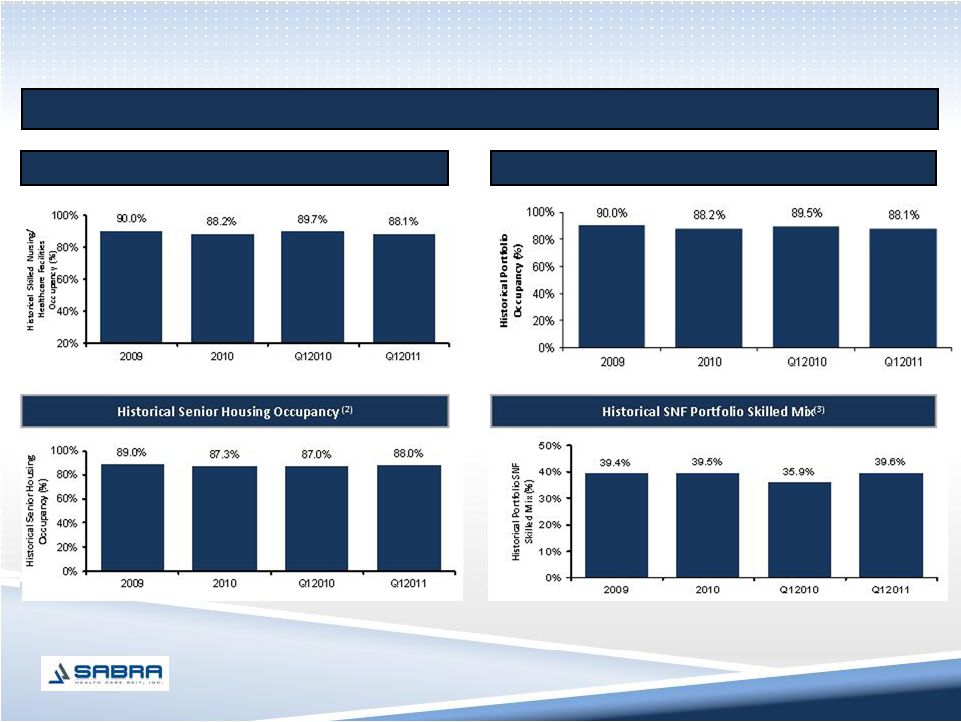 STRONG
PORTFOLIO PERFORMANCE Strong occupancy and skilled mix trends in Sabra’s
portfolio Historical
Skilled
Nursing/
Healthcare
Facilities
Occupancy
(1)
Historical Overall Occupancy
(1)
Skilled nursing and healthcare facilities include skilled nursing, multi-license
designation and mental health facilities (79 properties). (2)
Senior housing facilities include independent living, assisted living and CCRC facilities (7
properties). (3)
Skilled mix is defined as the total Medicare and non-Medicaid managed care patient
revenue divided by the total skilled nursing revenues for any given period.
13 |
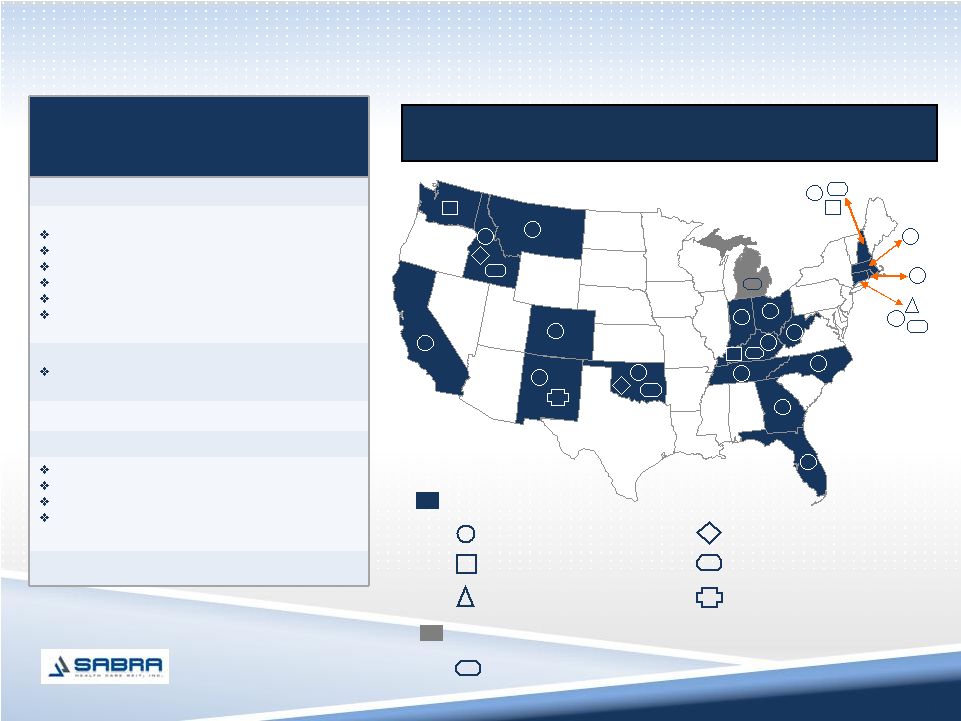 PROPERTY
DIVERSIFICATION (as of March 31, 2011)
1
1
1
1
3
2
2
1
4
3
1
1
5
2
1
1
2
2
11
2
1
8
5
2
8
3
2
8
1
1
States with facilities
(Equity
investments
–
86
total)
CCRC (total: 1)
Multi-Licensed Designation (total: 10)
Mental Health (total: 2)
Assisted Living (total: 5)
Skilled Nursing (total: 67)
Independent Living (total: 1)
Key real estate
portfolio information
(as of March 31, 2011)
Investments:
Equity Investments:
Skilled Nursing
Multi-License Designation
Assisted Living
Mental Health
Independent Living
CCRC
TOTAL Equity Investments:
67
10
5
2
1
1
86
Debt Investments:
Hillside Terrace
TOTAL Debt Investments:
1
1
TOTAL Investments:
87
Bed/ Unit Count (Equity Investments):
Skilled Nursing
Assisted Living
Independent Living
Mental Health
TOTAL Beds/ Units
8,488
912
121
82
9,603
Facility EBITDAR Coverage:
(1)
1.45x
States with facilities
(Debt
investments
–
1
total)
Geographically diversified portfolio of skilled nursing and
senior housing assets
14
(1)
Based on trailing 12 months ended March 31, 2011.
Multi-Licensed Designation (total: 1)
1 |
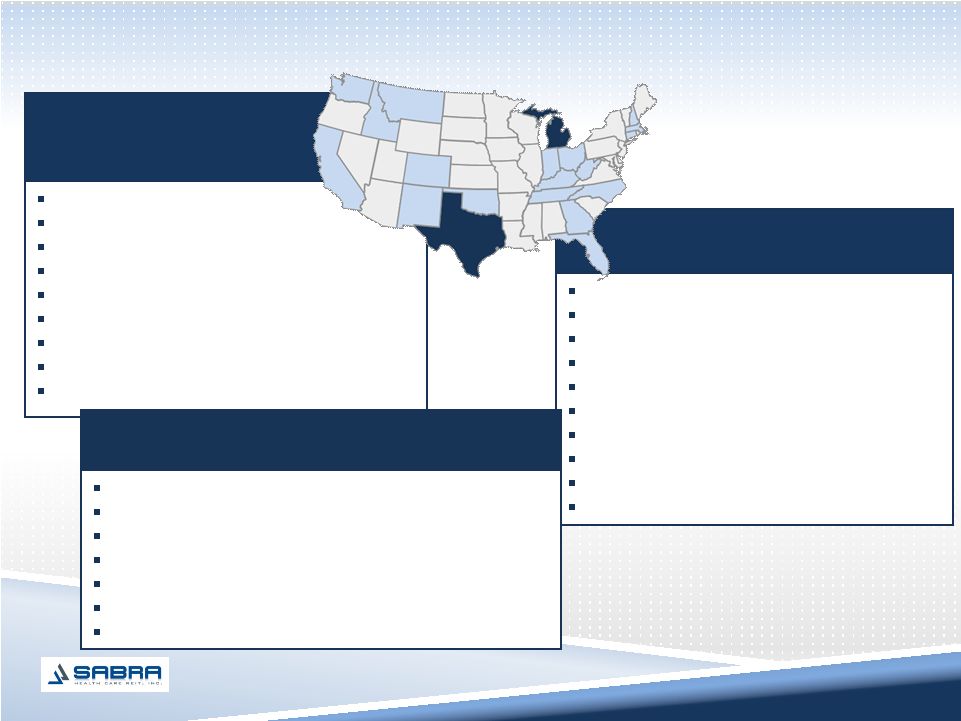
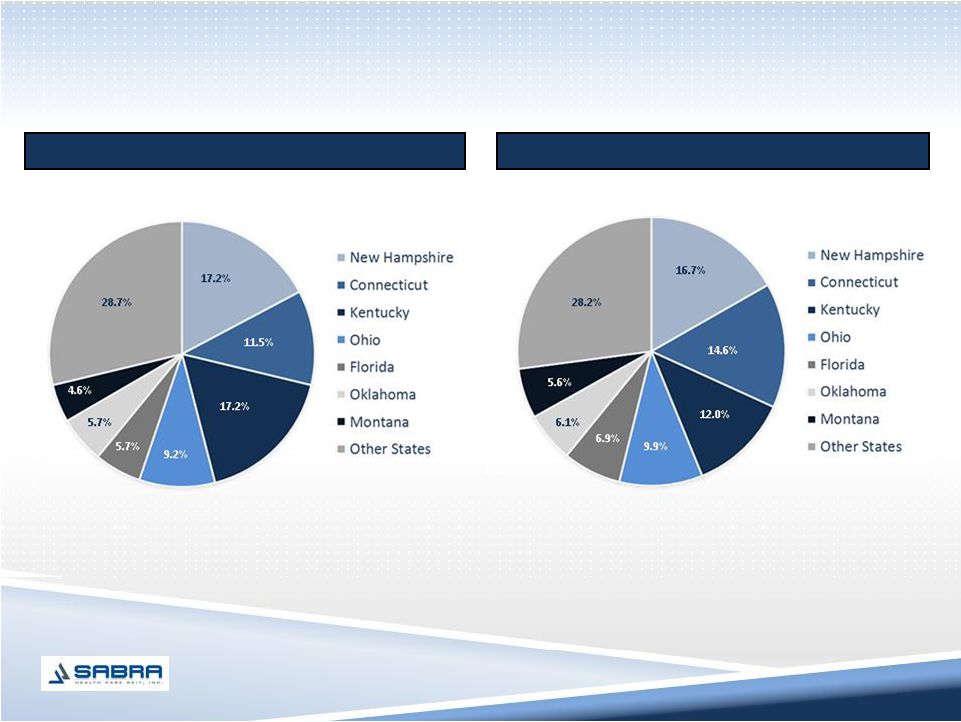 GEOGRAPHICALLY
DIVERSE PORTFOLIO (as of March 31, 2011)
87 investments in 20 states
9,603 licensed beds
(1)
Sabra has 86 equity investments in 19 states and 1 debt investment in 1 state as of March 31,
2011. (2)
The above information refers to Sabra’s licensed beds in 86 equity investments as of
March 31, 2011. Licensed beds are the number of beds for which a license has been
issued, which may vary in some instances from licensed beds available for use, which is used in the
computation of occupancy. Available beds for the 86 properties aggregated 9,266.
(2)
(1)
9.9%
15
Properties/ Facilities by State
Beds/ Units by State
17.2%
9.2%
5.7% |
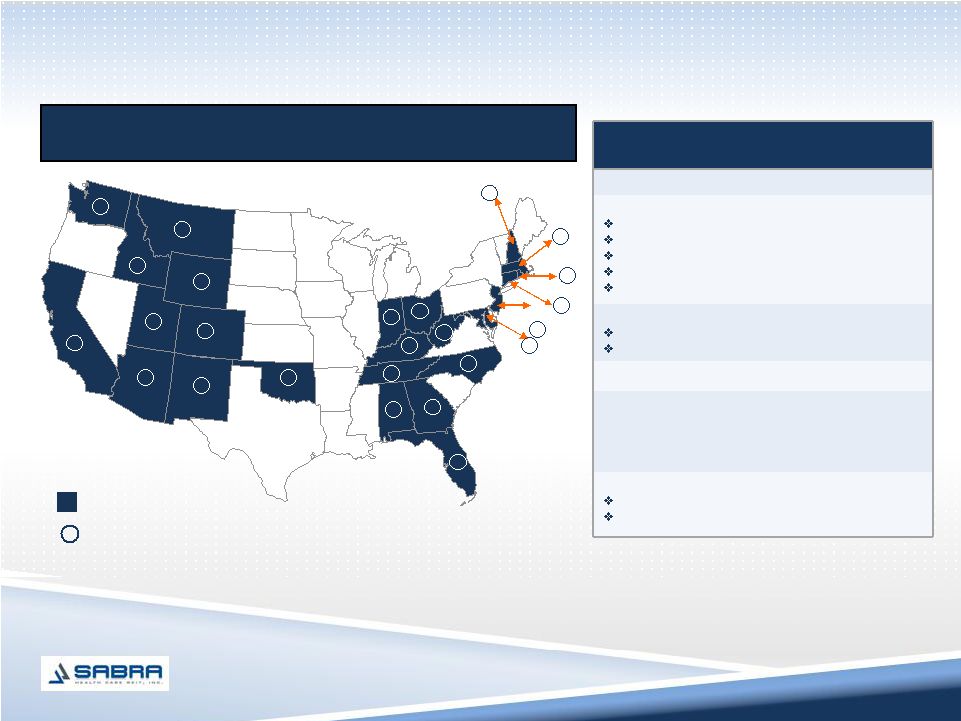 PRIMARY TENANT
OVERVIEW (as of March 31, 2011)
States with facilities
Number of facilities per state
Key portfolio information
(as of March 31, 2011)
Number of Centers:
199
Property Type:
Skilled Nursing
Multi-License Designation
Assisted Living
Mental Health
Independent Living
163 (82%)
16 (8%)
10 (5%)
8 (4%)
2 (1%)
Beds:
Licensed
Available
22,916
22,060
States:
25
As of 3/31/2011 Adjusted EBITDAR (000s):
Margin
As of 3/31/2011 SNF Skilled Mix %
(1)
As of 3/31/2011 Occupancy %
$63,949
13.2%
41.1%
87.0%
Facilities with Specialty Units:
(2)
RRS Units
Solana Units
68
47
11
15
9
9
5
7
9
9
8
8
20
7
2
17
15
18
2
10
Sun operates 199 inpatient centers in 25 states
(1)
Skilled mix defined as number of Medicare and non-Medicaid managed care revenues divided
by the total skilled nursing revenues.
(2)
As of December 31, 2010.
5
1
1
1
7
2
1
16 |
 FINANCIALLY
SECURE MAJOR TENANT 17
$145.6 million of liquidity
(1)
*
0.63x Net Debt-to-Adjusted EBITDA ratio*
*For the quarter ended March 31, 2011.
(1)
Includes $60.0 million available under Sun’s revolving credit facility.
Strong Operating Performance
$483.9 million in Revenue*
$63.9 million in Adjusted EBITDAR*
Corporate guarantee across diverse healthcare services
Sun Healthcare Group, SunBridge Healthcare, CareerStaff, SolAmor
Hospice, SunDance
Rehabilitation
Attractive business profile
Strong operating performance
Transparency and visibility
Balance sheet strength
Public entity
Sabra management team has substantial experience with Sun’s operations
|
 18
|
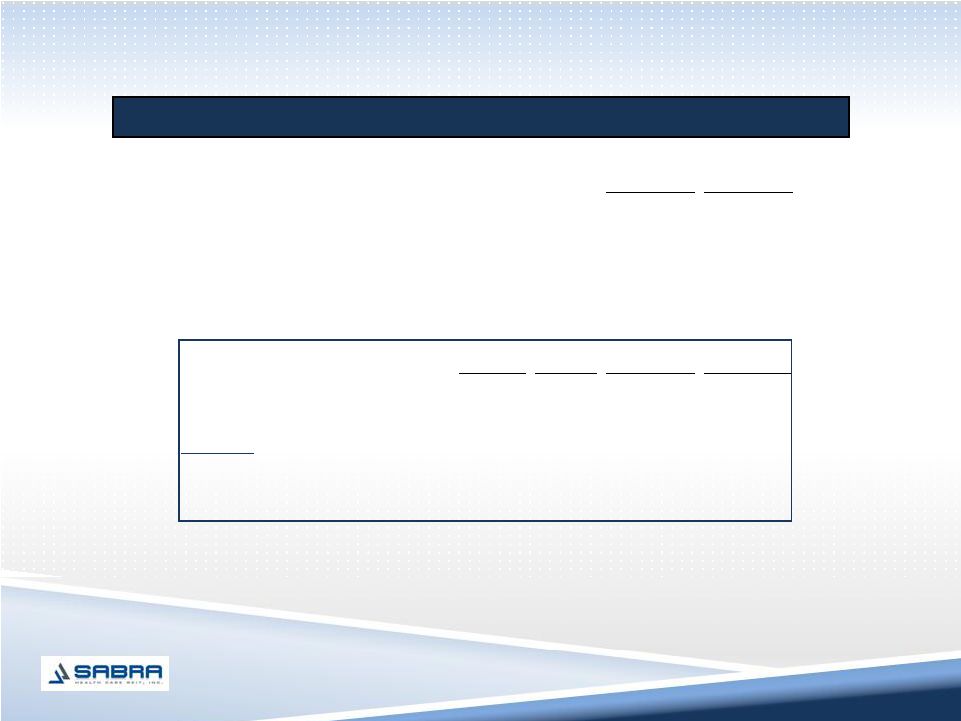
 FINANCIAL
HIGHLIGHTS 19
Income statement and other data
Pro Forma
(1)
Revenues
$
17.6
$
19.7
G&A costs
2.7
4.3
EBITDA
14.9
15.5
Net income
1.2
1.4
Adjusted EBITDA
16.2
18.3
FFO
7.3
7.9
AFFO
9.0
10.9
Normalized AFFO
9.3
11.2
Per share data:
Diluted EPS
$
0.05
$
0.05
Diluted FFO
0.29
0.31
Diluted AFFO
0.35
0.43
Diluted Normalized AFFO
0.36
0.44
Dividend per share
(2)
$
0.32
Dividend yield
(3)
7.4%
(in millions, except per share data and %)
(1)
Pro Forma assumes Texas Regional Medical Center, Hillside Terrace Note and Oak
Brook were acquired on January 1, 2011.
(2)
Declaration date of May 3, 2011 and payment date of June 2, 2011.
(3)
Based on current dividend annualized and stock price as of May 31, 2011.
Actual
For Three Months Ended March 31, 2011 |
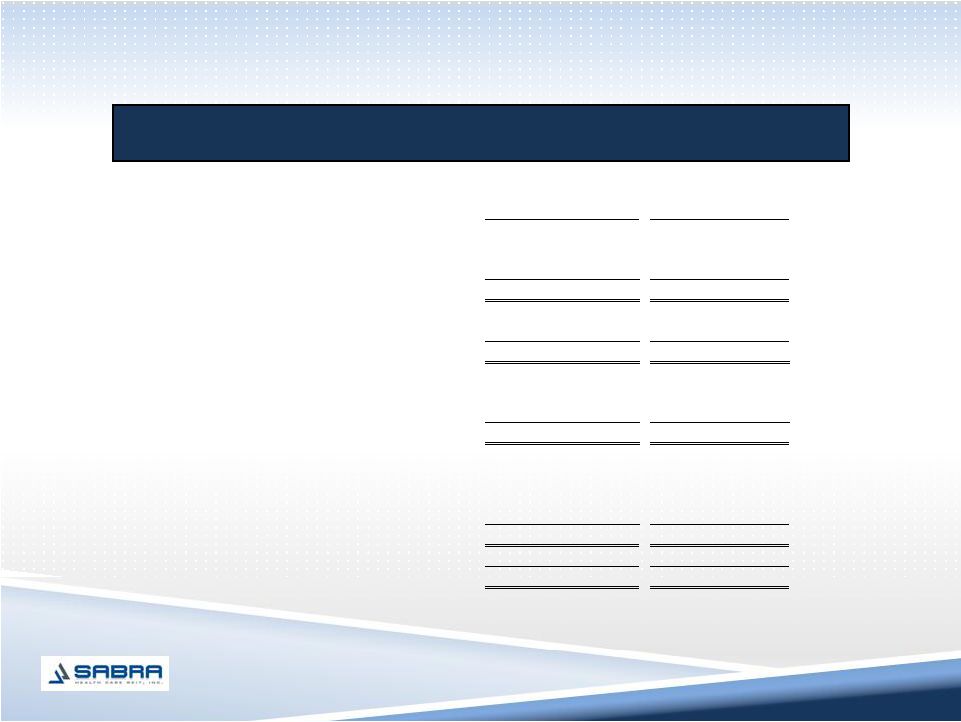
 FINANCIAL
HIGHLIGHTS 20
Balance sheet and other data
Actual
Pro Forma
(1)
Cash
$
80.2
$
4.6
Real Estate, Gross Book Value
571.0
645.0 Real Estate, Asset Value
(2)
720.0
794.0 Mortgage Note Receivable
5.3
5.3
Total Debt
385.7
385.7
Total Equity
179.9
179.9
Capitalization
565.6
565.6
Liquidity
167.8
92.2
Debt Covenants
(3)
MAX
Actual
Pro Forma
(1)
Incurrence:
Total Debt/ Asset Value
60%
47%
47%
Secured Debt/ Asset Value
40%
20%
20%
Minimum Interest Coverage
2.00x
2.28x
2.57x
Maintenance:
Leverage Ratio
6.25x
5.96x
5.27x
Fixed Charge Coverage Ratio
1.75x
2.06x
2.32x
Tangible Net Worth
$
162.0
$
263.8
$
263.8
Unencumbered Assets/ Unsecured Debt
150%
168%
168%
(dollars in millions)
MIN
As of March 31, 2011
As of March 31, 2011
(1)
Pro forma assumes Texas Regional Medical Center, Hillside Terrace Note and Oak Brook
were acquired on January 1, 2011 (except for the pro forma calculations of
Consolidated Tangible Net Worth, Total Debt/ Asset Value, Secured Debt/ Asset Value
and Unencumbered Asset/ Unsecured Debt, which assumes the acquisition of Texas Regional Medical and Oak Brook
occured on March 31, 2011).
(2)
Actual based on cap rate of 9.75% and $70.2 million annual rental revenue. Pro forma
acquisitions based on purchase price. (3)
Based on defined terms in notes indenture and credit
agreement. |
 INVESTMENT
HIGHLIGHTS SUMMARY 21
Geographically
Diverse Portfolio
Attractive Industry
Fundamentals
Favorable Long-Term
Lease Structure
Strong Lease
Coverage
Strong Asset
Coverage
Financially Secure
Primary Tenant
Growth
Opportunities
Experienced
Management Team |
 ACTUAL AND PRO
FORMA RECONCILIATION 22
Reconciliation of Net Income to EBITDA, Adjusted EBITDA, Funds from Operations (FFO),
Adjusted Funds from Operations (AFFO) and Normalized AFFO
Actual
Pro Forma
(1)
Net income
$
1.2
$
1.4
Interest expense
7.6
7.6
Depreciation and amortization
6.1
6.5
EBITDA
$
14.9
$
15.5
Stock-based compensation
1.1
1.1
Acquisition pursuit costs
0.1
1.7
Adjusted EBITDA
$
16.2
$
18.3
Net
income $
1.2
$
1.4
Depreciation of real estate assets
6.1
6.5
Funds from Operations (FFO)
$
7.3
$
7.9
Straight-line rental income adjustments
-
(0.3)
Acquisition pursuit costs
0.1
1.7
Stock-based compensation expense
1.1
1.1
Amortization of deferred financing costs
0.5
0.5
Adjusted Funds from Operations (AFFO)
$
9.0
$
10.9
Start-up costs
0.3
0.3
Normalized AFFO
$
9.3
$
11.2
(1)
Pro Forma assumes Texas Regional Medical Center, Hillside Terrace Note and Oak
Brook were acquired on January 1, 2011. (in millions)
Three Months Ended March 31, 2011 |