Attached files
| file | filename |
|---|---|
| 8-K - FORM 8-K - DUKE REALTY CORP | d8k.htm |
 RELIABLE.
ANSWERS. REIT Week: NAREIT Investor Forum
June 7-9, 2011
Exhibit 99.1 |
 RELIABLE. ANSWERS.
2011 Duke Realty Corporation
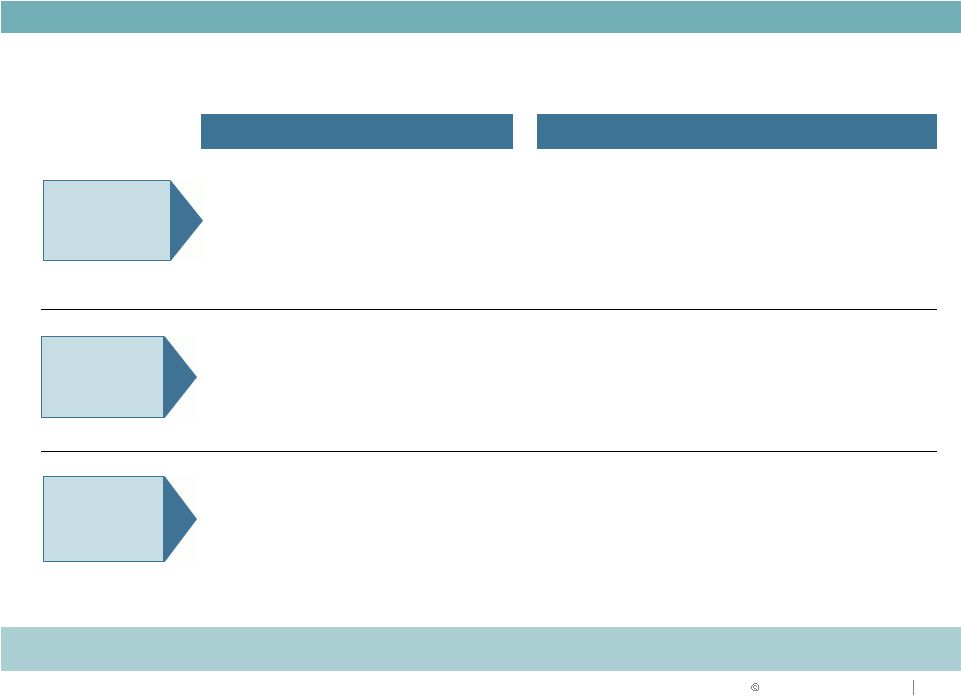
2
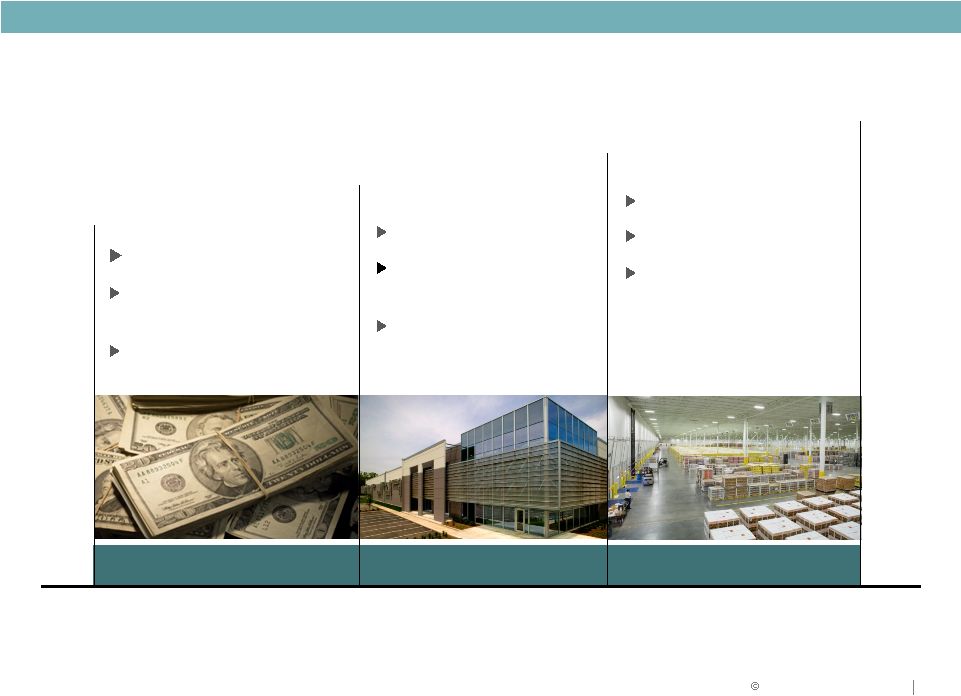
2009
2010
FOCUS:
Liquidity
More than $1.5 billion
capital raised
Strategy refined
FOCUS:
Strategy execution
Operating
fundamentals
Balance sheet
strength
FOCUS:
Asset quality
Cash flow growth
Shareholder return
Where we’ve been and where we’re going…
2011 and beyond |
 RELIABLE. ANSWERS.
2011 Duke Realty Corporation
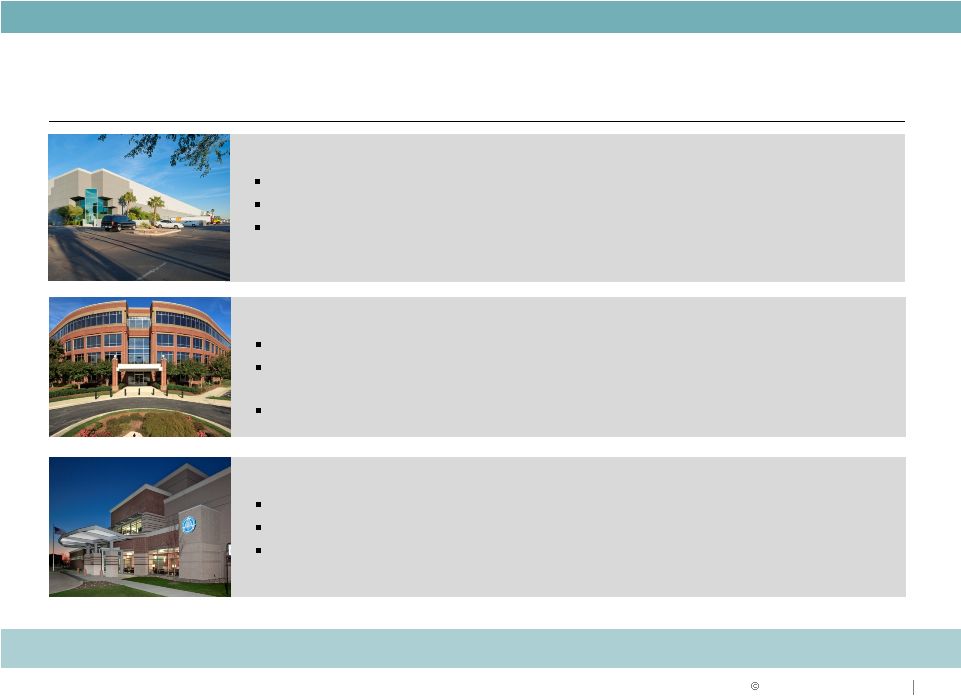
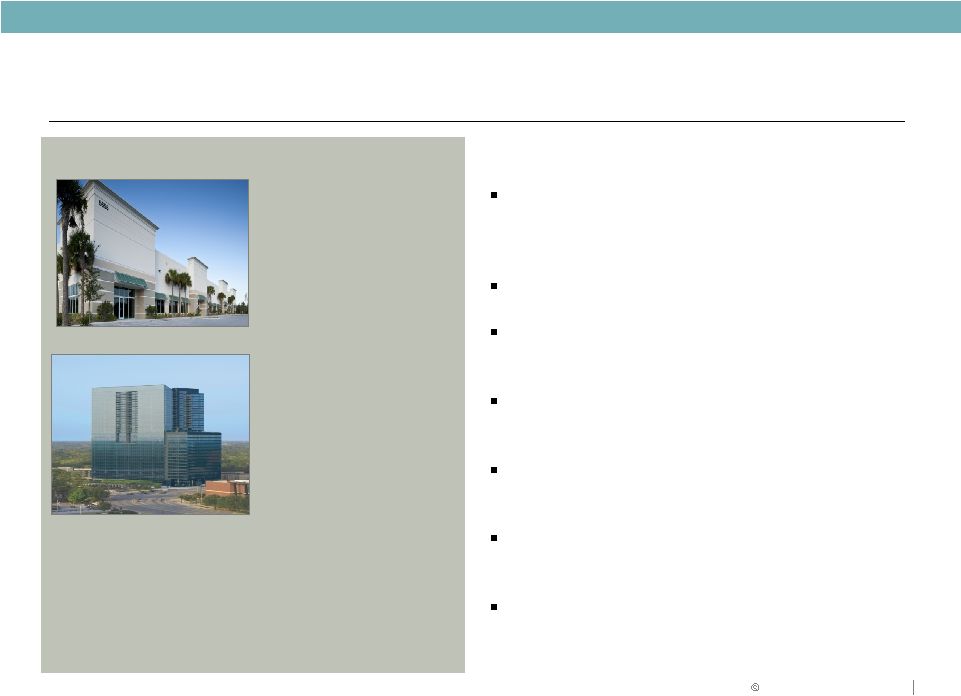
Suburban Office Market Still Challenging
Economic uncertainty limiting business investment and expansion decisions
Continued improvements in consumer spending, corporate profits and job outlook
will be catalyst
Recovery will be at slower pace
Medical Office Regaining Traction
Operators re-visiting expansion decisions
Relationships are a key driver of on campus MOB business
Demographics and economics positive growth drivers
3
Market Outlook
Fundamentals beginning to recover
Industrial Recovery Taking Shape
Net absorption in U.S. for Q1 2011 was positive for the third consecutive
quarter Retailers posting good results; container traffic volumes continuing
to increase Consumer confidence improving |
 RELIABLE. ANSWERS.
2011 Duke Realty Corporation
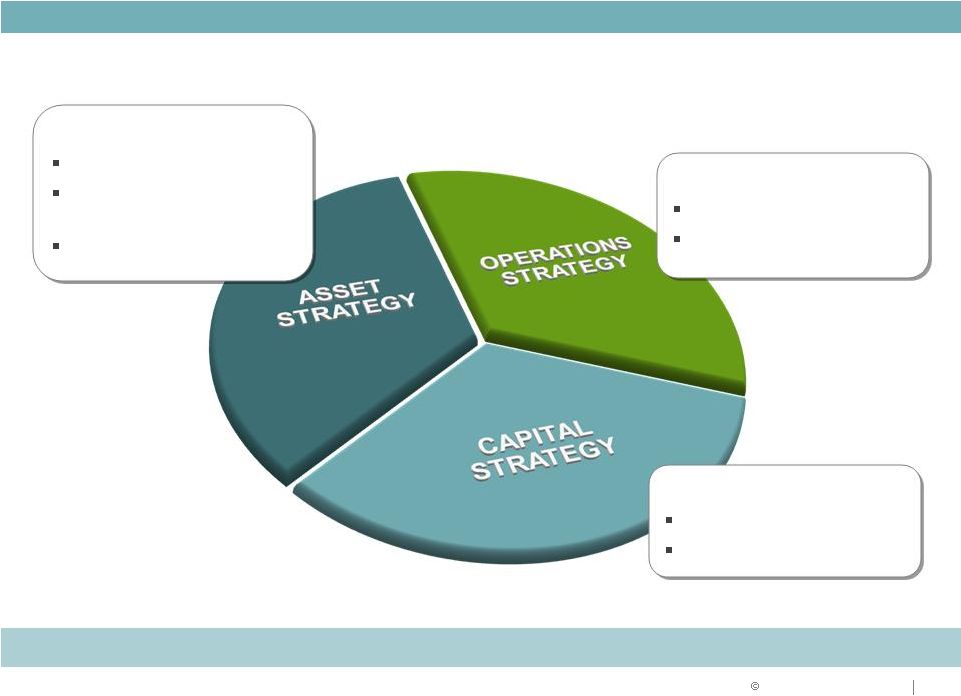
Focus on:
Increasing cash flow
Maximizing return on
assets
4
Strategy for Success
Focus on:
Improving coverage ratios
Improving ratings
Focus on:
Portfolio repositioning
Strategic acquisitions &
dispositions
Development opportunities
Delivering on what we say we will do |
 RELIABLE. ANSWERS.
2011 Duke Realty Corporation
Strategic Focus
2011 Goals and Objectives
Q1 2011 Update
•
Lease-up portfolio, manage cap ex; reach
positive same property income growth
•
Balance execution with capital strategy relative
to level and quality of cash flow and same
property NOI; Debt to EBITDA <7.0x
•
Development starts of $100 to $200 million
focus on medical office and Build-to-Suit
•
Total portfolio occupancy as of March 31, 2011 of 88.9%;
industrial portfolio at 90.2%
•
More than 5.3 million square feet of leases completed; in-line
with Q1 2010 volume of 5.5 million square feet
•
Debt
to
EBITDA
@
6.7x;<6.0x
by
2013;
0.9%
Same
Property
•
One medical office development project started during quarter
•
Continue strong momentum from 2010 on
repositioning of portfolio
•
Pursue acquisitions of medical and industrial
assets
•
Planned asset dispositions of primarily Midwest
office
•
Closed on remaining $173 million of Premier assets (final
closing in April)
•
Asset dispositions totaled $456 million, including completion of
$274 million CBRERT transaction
•
Opportunistically access capital markets . . .
push out maturity schedule further
•
Continue improving our coverage ratios
•
Maintain minimal balance on line of credit
•
Retired $42.5 million of unsecured bonds
•
Fixed charge ratio of 1.81x
•
Zero balance outstanding on line of credit, $167 million cash
Asset
Strategy
Operations
Strategy
Capital
Strategy
Executing across all three aspects of our strategy
5 |
 2011 Duke Realty Corporation
ASSET STRATEGY
6 |
 Depth & experience of team = Consistent execution
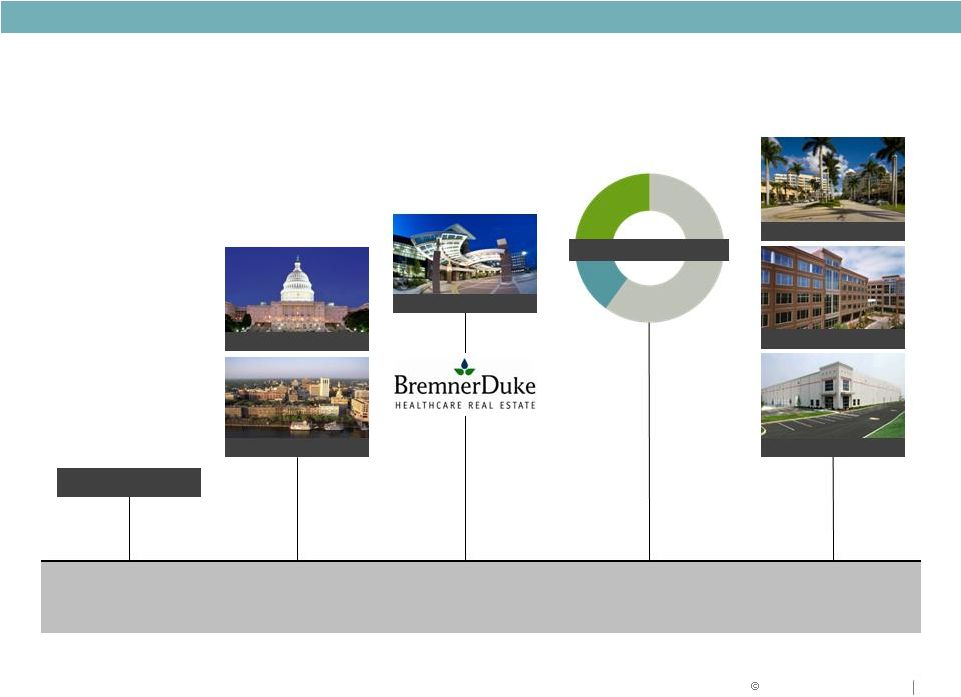
7
Proven Performance
ASSET STRATEGY
Flex disposition
$1 Billion
2005
2006
Savannah
Washington DC
2007
Healthcare
2009
Asset Strategy
2010
Dugan
CBRERT
Premier
2011 Duke Realty Corporation |
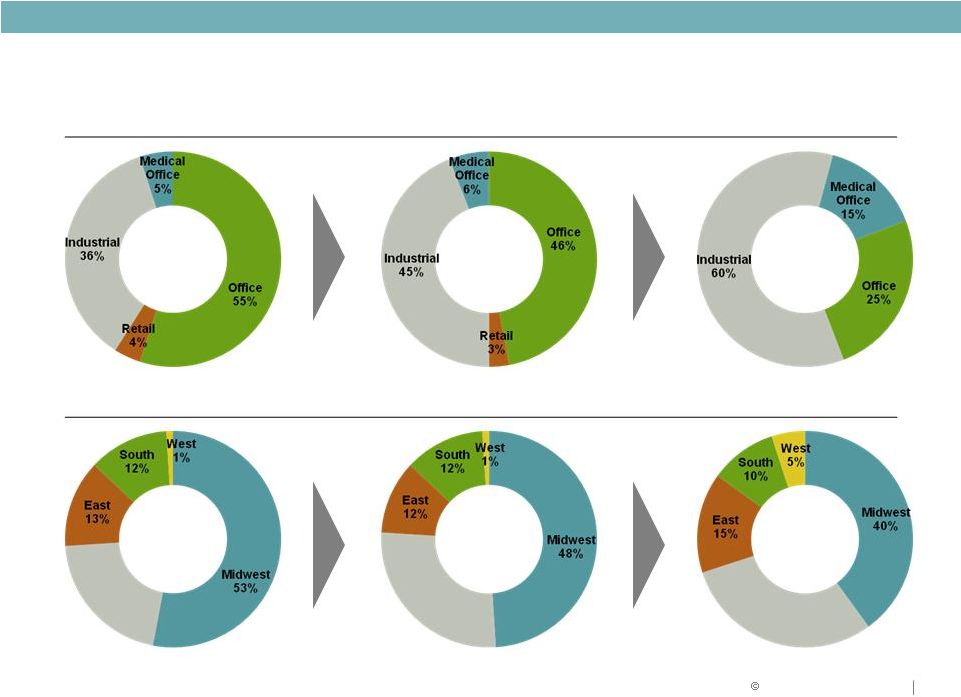 8
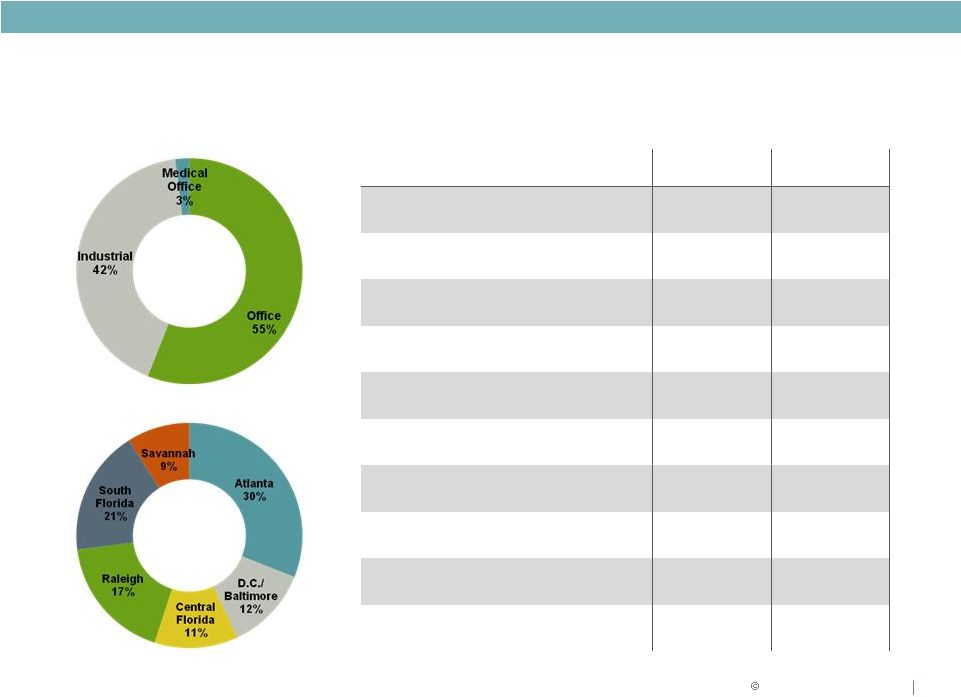
Portfolio Strategy
BY PRODUCT
2009
2013
BY GEOGRAPHY
Q1 2011
ASSET STRATEGY
2009
2013
Q1 2011
Southeast
21%
Southeast
27%
Southeast
30%
2011 Duke Realty Corporation |
 2011 Duke Realty Corporation
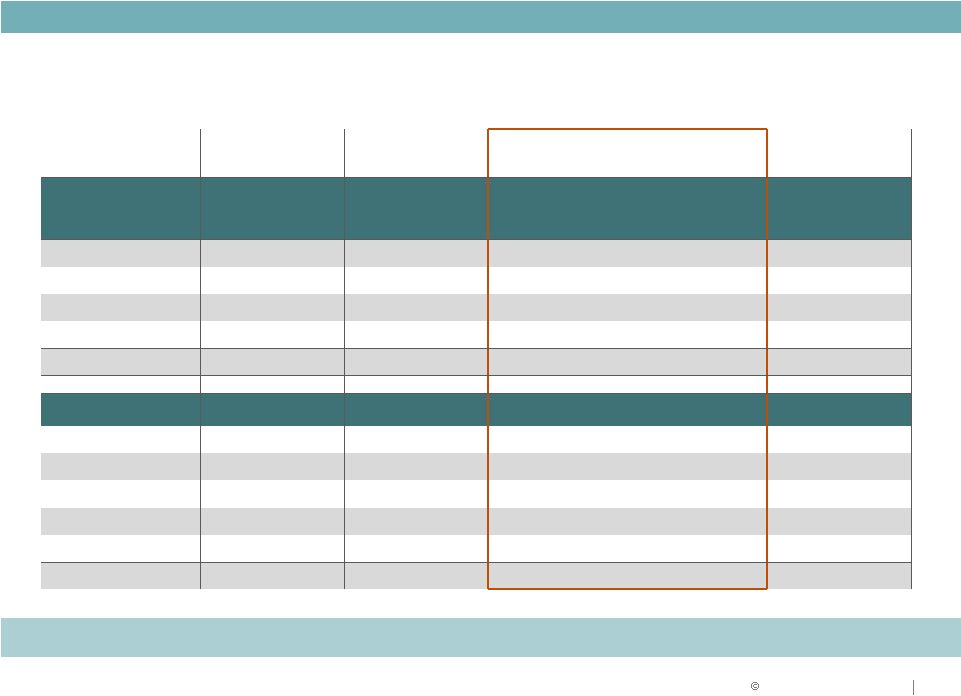
9
Asset Strategy: Road Map
($ in millions)
Investment
9/30/09
Investment
3/31/11
ACTION PLAN
Investment
2013
PRODUCT TYPE
Amount
%
Amount
%
Proceeds from
Targeted
Dispositions
Acquisitions/
Developments/
Repositioning
Amount
%
Industrial
$2,930
36%
$3,650
45%
($55)
$1,250
$4,920
60%
Office
4,515
55%
3,750
46%
(500)
(810)
2,050
25%
Medical Office
440
5%
520
6%
0
730
1,230
15%
Retail
290
4%
280
3%
(305)
0
0
0%
$8,175
100%
$8,200
100%
($860)
$1,170
$8,200
100 %
REGION
Midwest
$4,310
53%
$3,960
48%
($530)
$125
$3,280
40%
Southeast
1,755
21%
2,250
27%
(165)
150
2,460
30%
East
1,035
13%
975
12%
(120)
355
1,230
15%
South
970
12%
950
12%
(45)
200
820
10%
West
105
1%
65
1%
0
340
410
5%
$8,175
100%
$8,200
100%
($860)
$1,170
$8,200
100%
ASSET STRATEGY
Significant progress to date…
on target to meet 2013 goals |
 2011 Duke Realty Corporation
OPERATIONS STRATEGY
10 |
 11
Focus on Fundamentals
LEASING OF
PORTFOLIO
STRATEGIC
NEW DEVELOPMENT
AND LAND DISPOSITION
AFFO PAYOUT
OPERATIONS STRATEGY
Maximize return on assets
2011 Duke Realty Corporation |
 2011 Duke Realty Corporation
12
OPERATIONS STRATEGY
Portfolio Occupancy
2011 Guidance: Average Occupancy 87.5% to 90.5%
•
Occupancy at March 31, 2011 at 88.9%
•
Managing through anticipated tenant terminations
•
Upside to guidance from lease-up of portfolio and renewals
Unstabilized Portfolio
Significant progress on lease-up since March 31, 2010
•
Original portfolio was comprised of 48 buildings totaling
11.8 million square feet that were 59.2% leased at March
31, 2010
•
Progress to date:
12 buildings have been leased-up to at least 90% occupancy or
have been sold
Original portfolio is 77.9% leased as of March 31, 2011
•
Current portfolio comprised of the following:
Industrial: 16 projects, 5.7M square feet, 70% leased
Office: 8 projects, 8.6M square feet, 57% leased
Retail: 6 projects, 1.2M square feet, 85.2% leased
Same Property NOI
2011 Guidance: 1% to (3%)
•
Same property net operating income increased by 0.9%
over the twelve months ended March 31, 2011
•
Results in Q1 in line with expectations
Recurring AFFO Payout Ratio
2011 Guidance: 85% to 100%
•
Annual dividend of $0.68
•
2011 components of AFFO reflect current environment:
Recurring capital expenditures $85 million to $100 million
Straight line rent adjustment $20 million to
$25 million Non cash interest
expense $15 million to $20 million
•
Property level AFFO a critical metric for our business;
part of compensation performance criteria
2011 Performance Metrics
Company
performance
goals
and
objectives
aligned
with
key
operational
success
factors |
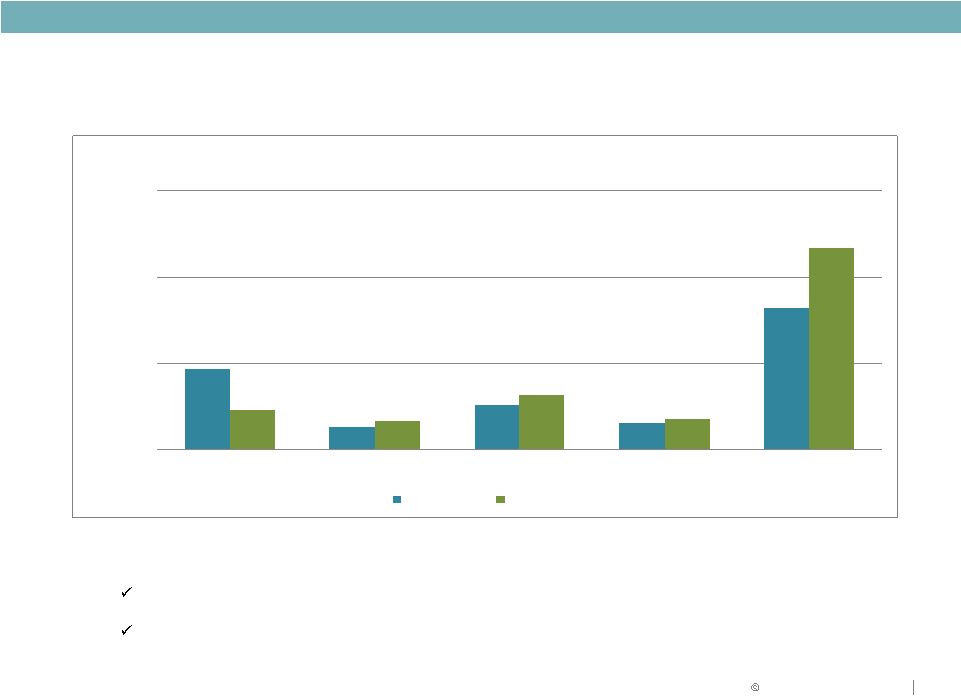
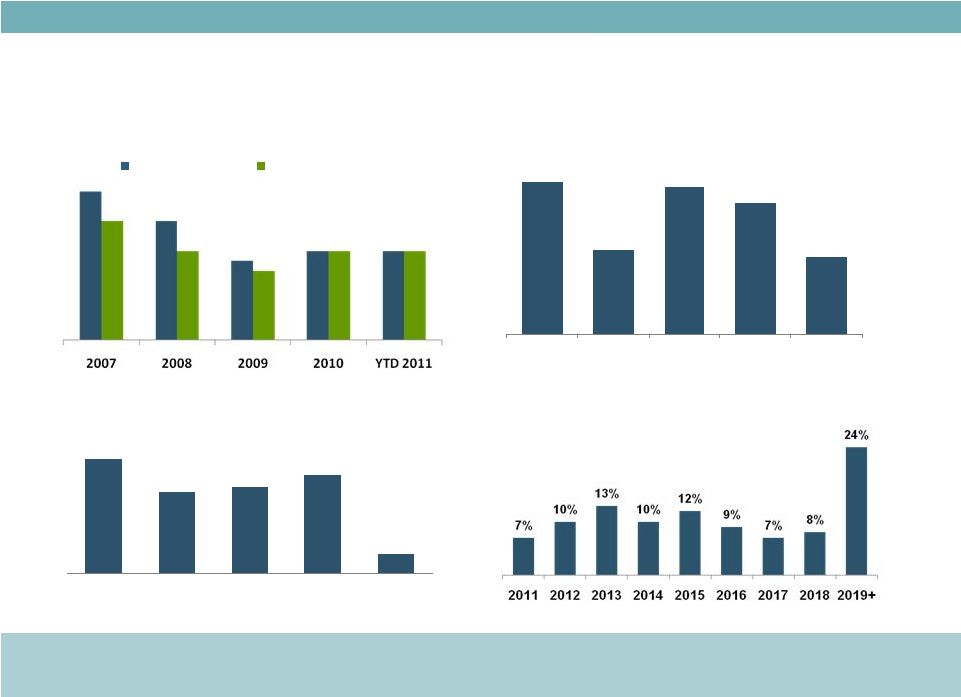 Operations Strategy: Consistent Operating Performance
Stabilized Occupancy (%)
Strong historical stabilized occupancy –
fundamentals improving
Lease Renewals (%)
Strong lease renewal percentages
Stabilized occupancy
In-service occupancy
80%
72%
79%
77%
2007
2008
2009
2010
YTD 2011
70%
29.9
21.4
22.7
25.9
2007
2008
2009
2010
YTD 2011
Leasing Activity
New
Leases
and
Renewals
–
Consistent
Execution
(in
millions
of
square feet)
Lease Maturity Schedule
Lease maturities are well balanced with no one year accounting for
more than 13%
95%
92%
92%
89%
88%
89%
89%
89%
89%
87%
OPERATIONS STRATEGY
5.3
Demonstrated ability to maintain consistency through difficult operating
environments
13 |
 2011 Duke Realty Corporation
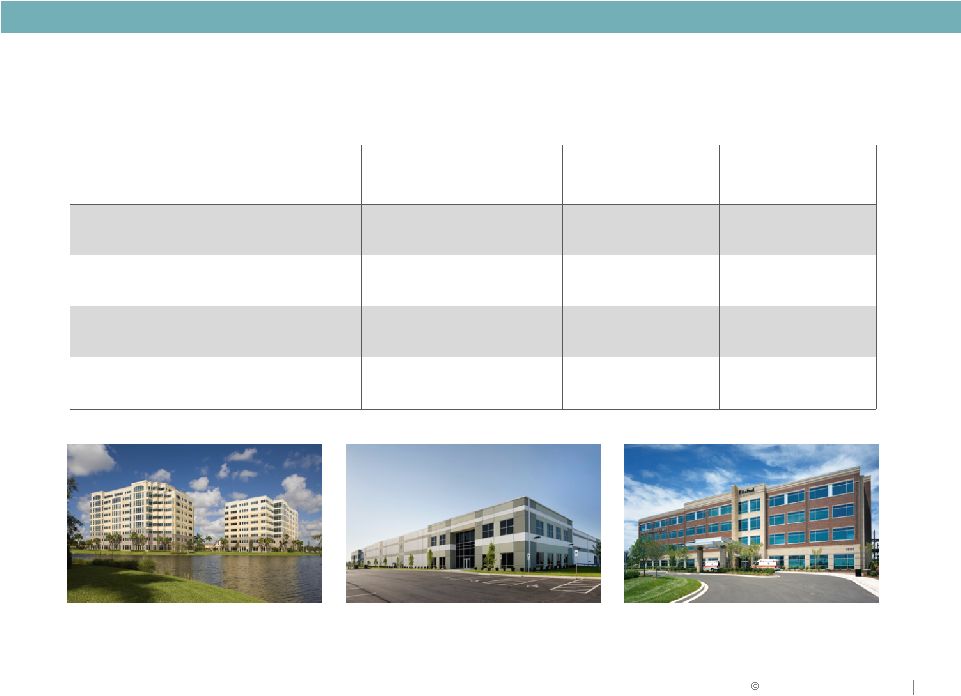
14
New, High Quality Portfolio with Long-term Leases
Bulk
Industrial
Suburban
Office
Medical Office
Property age
10.1 years
11.7 years
2.0 years
Property size
212,000 SF
118,000 SF
97,000 SF
Lease term
7.0 years
7.2 years
11.7 years
Tenant size
70,000 SF
12,000 SF
11,000 SF
OPERATIONS STRATEGY |
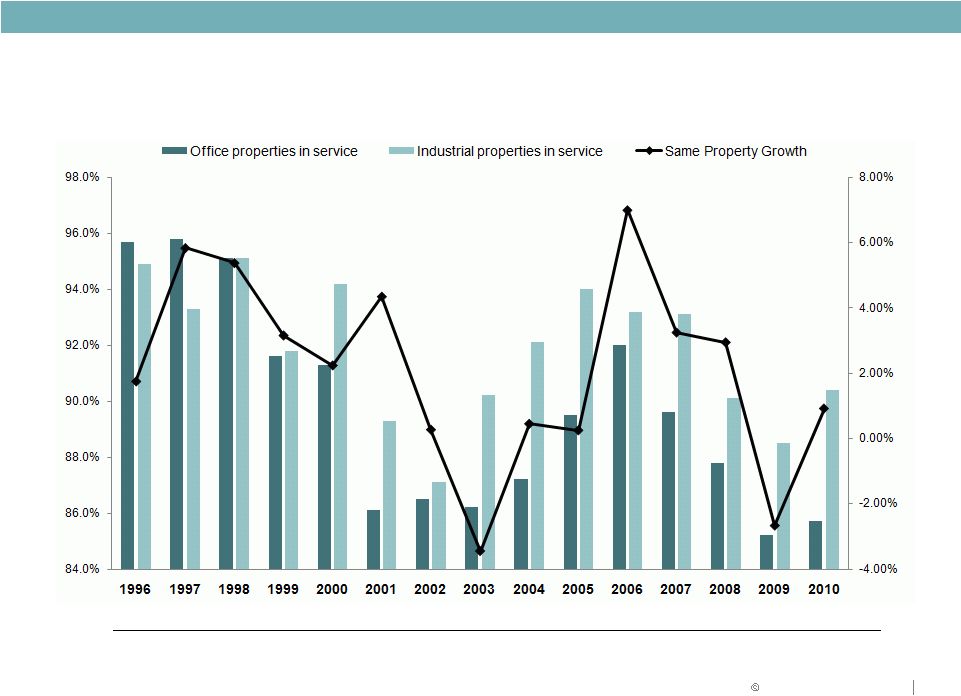 2011 Duke Realty Corporation
15
December 31
Historical Focus on Occupancy
OPERATIONS STRATEGY |
 2011 Duke Realty Corporation
REGIONAL MARKET OVERVIEWS
16 |
 2011 Duke Realty Corporation
RECENT TRANSACTIONS
17
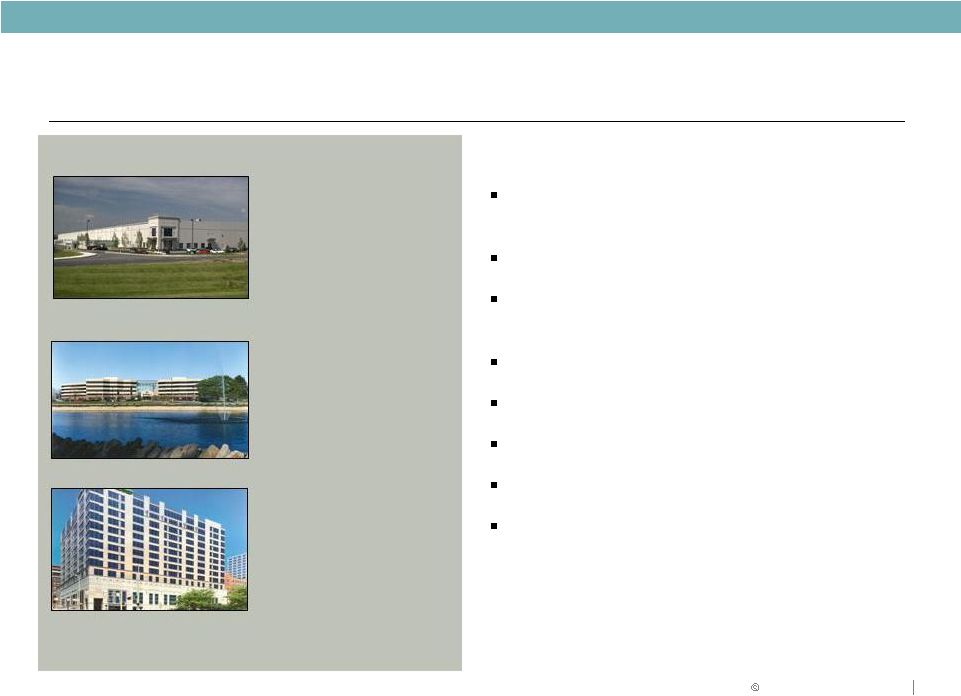
Midwest
Renewal Industrial
Hebron
I
-
Cincinnati
646,000 SF
100% leased
New Lease Office
Atrium
II
-
Columbus
121,000 SF
Tenant:
Alcatel
-
Lucent
MARKET OVERVIEW & KEY POINTS
Strong distribution base: Over 30% of U.S.
population within one day’s drive
74 Fortune 500 headquarters
High growth and return opportunities, particularly in
Chicago, Columbus, and Indianapolis
Duke Realty’s roots and a position of strength
Original
location
–
since
1972
Low cost basis product
Dominant market position
48% of our total investment
Committed to Midwest because we perform…
Remains a key component to our strategy
Disposition -
Office (CBD)
312 Elm & 312 Plum
Cincinnati
609,000 SF
MIDWEST OVERVIEW |
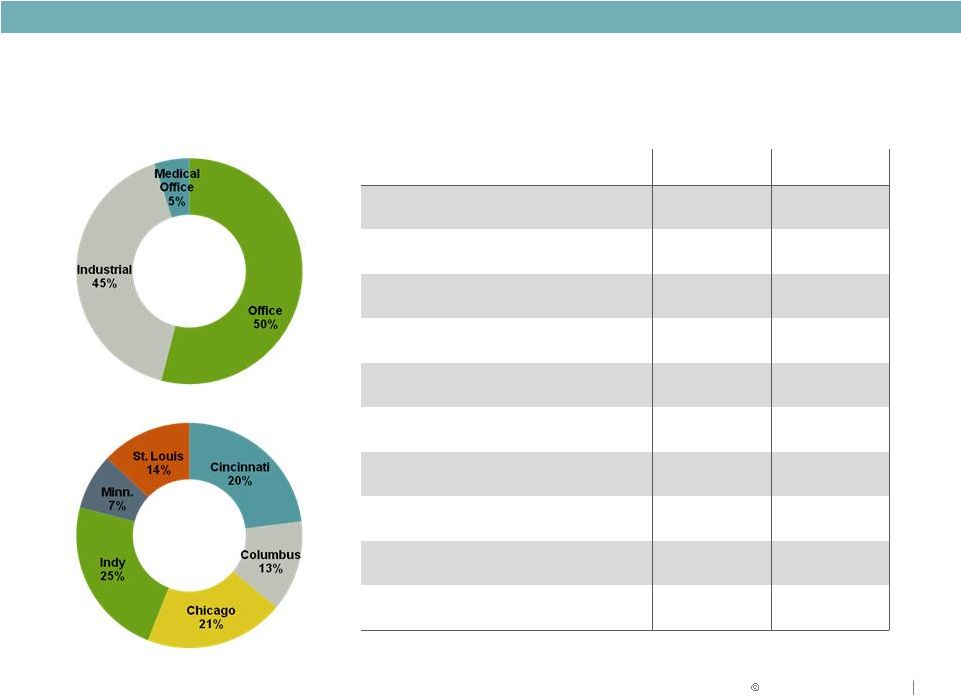 18
Midwest Overview
Location
Product
Type
Industrial
Office
Average Age
11.6 years
16.3 years
Average Building Size
236,000 SF
130,000 SF
Total Square Footage
51.5 million
16.4 million
Current Occupancy
93.0%
84.4%
Indianapolis
96.7%
86.5%
Chicago
96.1%
88.6%
Cincinnati
86.4%
82.5%
St. Louis
88.6%
79.5%
Columbus
96.2%
82.0%
Minneapolis
84.5%
96.8%
MIDWEST OVERVIEW
Note: All information as of March 31, 2011
2011 Duke Realty Corporation |
 2011 Duke Realty Corporation
RECENT TRANSACTIONS
19
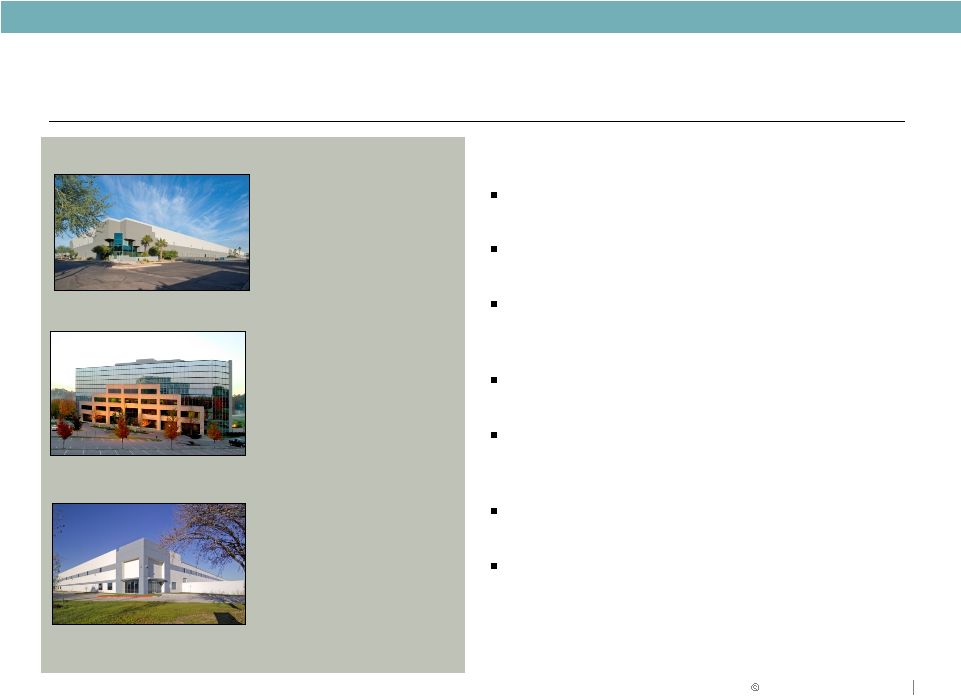
Southwest
Acquisition -
Industrial
Estrella Buckeye –
Phoenix
250,000 SF
100% Leased
Disposition Office
Lakeview office assets-
Nashville
379,000 SF
MARKET OVERVIEW & KEY POINTS
Duke Realty presence since 1999 (Weeks merger)
52 Fortune 500 headquarters
Demographic drivers: modern transportation and
infrastructure, population and job growth
Strong industrial demand expected post-recovery
Port, inland port and logistics key for bulk distribution
markets
13% of our total investment
Expand industrial presence by pursuing select
acquisition opportunities in Houston, Phoenix and
Southern California
New Development -
Industrial
Westland II Houston
300,000 SF
73% Leased
SOUTHWEST OVERVIEW |
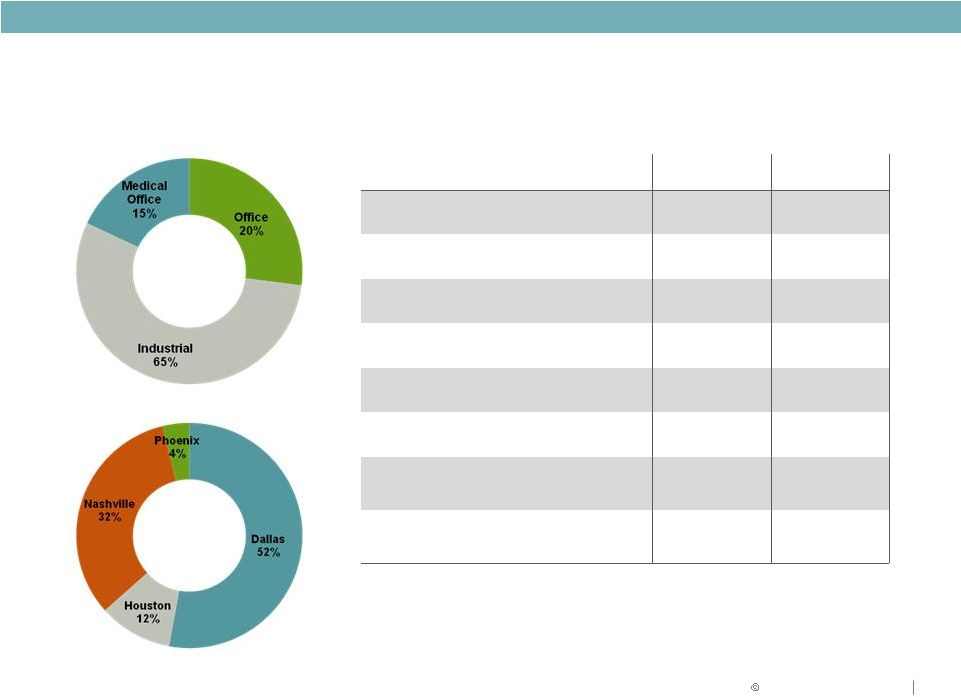 20
Southwest Overview
Location
Product
Type
Industrial
Office
Average Age
8.6 years
6.5 years
Average Building Size
256,500 SF
108,600 SF
Total Square Footage
20.0 million
2.1 million
Current Occupancy
85.6%
91.9%
Dallas
83.8%
83.3%
Nashville
80.9%
95.0%
Houston
98.0%
100%
Phoenix
97.1%
N/A
SOUTHWEST OVERVIEW
Note: All information as of March 31, 2011
2011 Duke Realty Corporation |
 2011 Duke Realty Corporation
RECENT TRANSACTIONS
21
East & Southeast Overview
Acquisition –
Office/Industrial
Premier Portfolio -
South Fl
4.9 million SF
MARKET OVERVIEW & KEY POINTS
Strong presence: entered Southeast in 1999 (Weeks
merger) and East in 2006 (acquisition of Winkler
portfolio)
15 Fortune 500 headquarters
East and Southeast cities among top growth markets
in country…
strong in-migration
Diversified economies; Government, healthcare,
finance and education
Eastern cities maintained highest employment rate
through downturn
Atlanta and Northeast corridor strong in bulk
industrial
39% of our total investment
New Leases -
Office
3630
Peachtree
–
Atlanta
Currently 44% leased
EAST & SOUTHEAST OVERVIEW |
 22
East and Southeast Overview
Location
Product
Type
Industrial
Office
Average Age
8.8 years
9.7 years
Average Building Size
225,000 SF
110,000 SF
Total Square Footage
26.9 million
13.7 million
Current Occupancy
89.0%
88.5%
Atlanta
85.2%
87.3%
South Florida
80.5%
89.2%
Raleigh
98.1%
89.5%
Washington D.C./Baltimore
94.2%
90.9%
Central Florida
91.0%
85.4%
Savannah
88.7%
NA
EAST & SOUTHEAST OVERVIEW
2011 Duke Realty Corporation |
 2011 Duke Realty Corporation
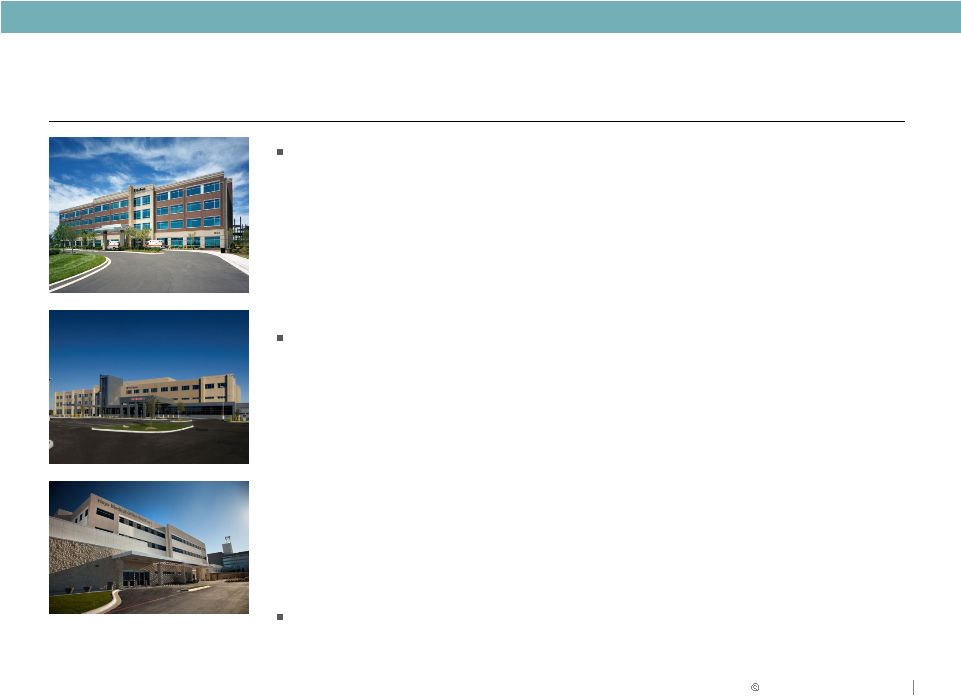
MEDICAL OFFICE OVERVIEW
23 |
 24
Portfolio Strategy
BY PRODUCT
2009
2013
BY GEOGRAPHY
2009
2013
Focus on “core”
assets
(on-campus)
Focus on national and
regional Hospital system
relationships
Focus on Duke Realty
office locations
Focus on demographic
healthcare growth cities
MEDICAL OFFICE OVERVIEW
2011 Duke Realty Corporation |
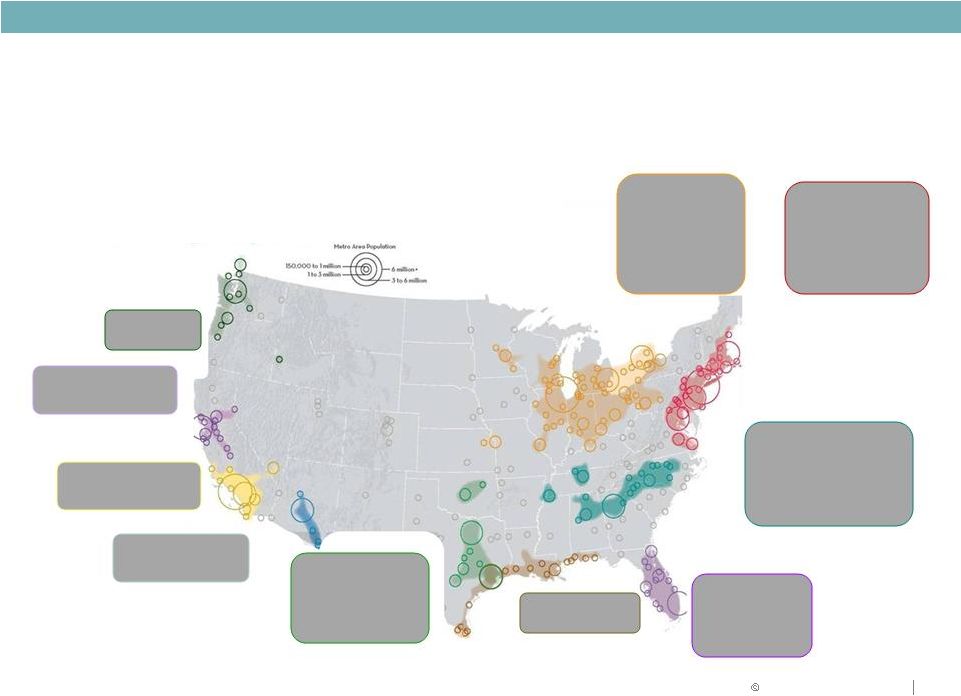 PIEDMONT ATLANTIC
Atlanta*
Birmingham
Charlotte
Nashville*
Raleigh*
NORTHEAST
Baltimore*
Boston
Philadelphia
Richmond
Washington, D.C.*
GREAT LAKES
Chicago*
Columbus*
Indianapolis*
Louisville
Minneapolis*
St. Louis*
FLORIDA
Jacksonville
Miami
Orlando*
Tampa*
GULF COAST
ARIZONA SUN
CORRIDOR
NORTHERN
CALIFORNIA
SOUTHERN
CALIFORNIA
CASCADIA
Megaregions
by
2050:
Populations
in
contiguous
regions
with
major cities that produce more than $100 billion in goods and
services. Mega-regions will drive need for healthcare,
transportation infrastructure and jobs through 2050
Duke Realty Markets: Demographic Focus
*
Duke Realty market
Map Source: ATLANTA REGIONAL COMMISSION MEGAREGIONS REPORT
MEDICAL OFFICE OVERVIEW
TEXAS TRIANGLE
Austin*
Dallas
*
Houston*
San
Antonio
2011 Duke Realty Corporation
25 |
 2011 Duke Realty Corporation
26
Healthcare Data Points
The nation’s largest industry
•
Represents more than 17% of GDP, predicted to exceed 23%
by 2020
•
Americans spend more than 5% of pre-tax income on
healthcare. Lower income brackets pay 15% or more ($7,800
per capita health expenditures in 2008/2009)
Reform
•
Increased number of people insured expected to increase by
30 to 50 million –
increased demand for care
•
Number
of
physicians
will
increase
–
more
space
demand
•
Hospitals expect margin pressure and need to increase
market share –
Hospitals seeking capital partners for
“non-core assets”
•
May
reduce
reimbursements
–
real
estate
efficiency
a
priority –
larger deals and floor plates
As many as 40% (20% now) of primary care physicians and 24%
(10% now) of specialists will be employed by hospitals by 2012 –
more Hospital credit on leases
MEDICAL OFFICE OVERVIEW |
 2011 Duke Realty Corporation
CAPITAL STRATEGY
27 |
 2011 Duke Realty Corporation
28
Key Metrics & Goals
2009
Actual
2010
Actual
Q1 2011
Actual
Goal
Debt to Gross Assets
44.5%
46.3%
46.1%
45.0%
Debt + Preferred to Gross
Assets
54.9%
55.5%
55.3%
50.0%
Fixed Charge Coverage Ratio
1.79 : 1
1.79 : 1
1.81 : 1
2.00 : 1
Debt/EBITDA
6.65
7.31
6.66
< 6.00
Debt + Preferred/EBITDA
8.47
8.88
8.20
< 7.75
CAPITAL STRATEGY
Progressing toward strategic plan goals |
 2011 Duke Realty Corporation
29
CAPITAL STRATEGY
Current Liquidity Position
$934
$256
$516
$310
$1,644
$460
$332
$632
$351
$2,335
$0
$1,000
$2,000
$3,000
2011
2012
2013
2014
Thereafter
Debt Maturity and Amortization Schedule
($ in millions)
3/31/2009
3/31/2011
•
Provide for $290 Million 2011 Unsecured Bond Maturities
$122 million due 8/15/11
$168 million due 12/1/11 |
 2011 Duke Realty Corporation
KEY TAKEAWAYS
30 |
 2011 Duke Realty Corporation
31
2010 Accomplishments and 2011 Opportunities
Drive Shareholder Return
2010
2011
Capital
Strategy
Raised nearly $1.1 billion of capital
Executed Capital Strategy in alignment with operating
and asset strategy
Operating with minimal balance outstanding on our
line of credit
2011 maturities provided for
Opportunistically access capital markets . . . push
out maturity schedule further
Continue improving our coverage ratios
Maintain minimal balance on our line of credit
Operating
Strategy
Reduced
operating
overhead
6.5%
Leased nearly 26 million square feet
Maintained high tenant retention @
77% renewal rate
Achieved strong service operations performance
Achieved $130 million development starts at attractive
yields; 40% of investment medical office
Balance capital strategy relative to level and quality
of cash flow and same property NOI
Maintain fixed charge coverage above 1.75x and
Debt/EBITDA below 7.0x
Lease-up portfolio; manage cap ex; reach positive
same property income growth
Development
Expertise
Third party volume totaled $619 million and exceeded
budget by $57 million
Increase our new development starts to
$200 million
Asset
Strategy
Made significant progress on strategic plan
Continue making significant progress on strategic
plan
RELIABLE. ANSWERS. |
 32
WHY DUKE REALTY?
Quality portfolio improving with asset strategy
Solid balance sheet improving with capital strategy
Unmatched ability to execute on daily operations
Development capabilities in place with existing land bank
Talent and leadership depth to execute
RELIABLE. ANSWERS.
2011 Duke Realty Corporation |
 RELIABLE. ANSWERS.
2011 Duke Realty Corporation
33
2011 Range of Estimates
2011 RANGE
Metrics
2010
Actual
Pessimistic
Optimistic
Key Assumptions
Core FFO Per Share
$1.15
$1.06
$1.18
AFFO Payout Ratio
89%
100%
85%
•
Annual dividend maintained at $0.68 per share
Average Occupancy
88.2%
87.5%
90.5%
•
First half expirations cause dip in occupancy
•
Upside to guidance driven by higher occupancy
•
Downside
assumes
“worst
case”
scenario
from
unknown
bankruptcies,
defaults and terminations
Same Property NOI
0.9%
(3.0%)
1.0%
•
Rental rate pressure remains
•
Coming off higher year
Building Acquisitions
$919
$200
$400
•
Aligned with long-term strategy
•
Focus on industrial and medical office
•
Includes $173 million remaining acquisition of Premier
Building Dispositions
$499
$400
$600
•
Strong backlog of non-strategic assets under contract
•
2011 pipeline consists primarily of office product
•
Includes $275 million sale to CBRERT
Land Dispositions
$35
$20
$50
•
Selling identified non-strategic parcels
•
Local market demand still sluggish
Construction and
Development Starts
$313
$200
$400
•
Anticipate medical office starts in the $75 million to $125 million range
•
Remaining starts from industrial build-to-suit and third party
construction Construction Volume
$751
$600
$800
•
BRAC volume consistent with 2010
General and Administrative
Expenses
$41
$45
$40
•
2011 total overhead expenses flat
•
No severance costs in 2011 guidance
Leasing actions continue to drive upside |