Attached files
| file | filename |
|---|---|
| 8-K - FORM 8-K - APARTMENT INVESTMENT & MANAGEMENT CO | c18477e8vk.htm |
Exhibit 99.1

| AIMCOApartment Investment and Management Company NAREIT REITWeekJune 2011 |

| 2 This presentation contains forward-looking statements within the meaning of the federal securities laws, including statements regarding projected results and specifically forecasts of 2011 financial results. These forward-looking statements are based on management's judgment as of this date and include certain risks and uncertainties. Risks and uncertainties include, but are not limited to, Aimco's ability to maintain current or meet projected occupancy, rental rates and property operating results. Actual results may differ materially from those described in these forward-looking statements and, in addition, will be affected by a variety of risks and factors, some of which are beyond the control of Aimco, including, without limitation: financing risks, including the availability and cost of capital markets financing and the risk that our cash flows from operations may be insufficient to meet required payments of principal and interest; earnings may not be sufficient to maintain compliance with debt covenants; real estate risks, including fluctuations in real estate values and the general economic climate in the markets in which we operate and competition for residents in such markets; national and local economic conditions, including the pace of job growth and the level of unemployment; the terms of governmental regulations that affect Aimco and interpretations of those regulations; the competitive environment in which Aimco operates; the timing of acquisitions and dispositions; insurance risk, including the cost of insurance; natural disasters and severe weather such as hurricanes; litigation, including costs associated with prosecuting or defending claims and any adverse outcomes; energy costs; and possible environmental liabilities, including costs, fines or penalties that may be incurred due to necessary remediation of contamination of properties presently owned or previously owned by Aimco. In addition, our current and continuing qualification as a real estate investment trust involves the application of highly technical and complex provisions of the Internal Revenue Code and depends on our ability to meet the various requirements imposed by the Internal Revenue Code, through actual operating results, distribution levels and diversity of stock ownership. Readers should carefully review Aimco's financial statements and notes thereto, as well as the risk factors described in Aimco's Annual Report on Form 10-K for the year ended December 31, 2010, and the other documents Aimco files from time to time with the Securities and Exchange Commission. These forward-looking statements reflect management's judgment as of this date, and Aimco assumes no obligation to revise or update them to reflect future events or circumstances. This presentation and these forward-looking statements include Aimco's analysis and conclusions based in part on third party data (including information on macro-economic indicators and market growth rates) and reflect management's judgment as of the date of these materials, which are subject to change based on macro-economic factors beyond Aimco's control. Aimco assumes no obligation to revise or update to reflect future events or circumstances. A change in cap rates, market growth rates, credit availability or other such items could affect the analysis and conclusions reached herein. In addition, this presentation includes certain non-GAAP measures, which Aimco defines and reconciles to GAAP in its supplemental schedules to its quarterly earnings releases - see in particular the Glossary to Aimco's 1Q 2011 earnings release. This presentation does not constitute an offer of securities for sale. Forward-looking Statements and Other Information |

| 3 Aimco Overview |

| 4 Aimco Has a Simple Business Strategy Own and operate B/B+ quality apartments Well located in 20 largest U.S. markets Opportunistic redevelopmen t Finance with lower risk, property-level, non-recourse, long-dated, fixed- rate and amortizing debt Provide above average risk-adjusted returns |

| 5 * Represents Aimco average 1Q 2011 rents for all conventional properties held at quarter-end, including same store properties, redevelopment properties and other conventional properties, compared to REIS average for each market. Asset Quality in Aimco's Markets Target B/B+ rents ~100% - 125% Expect capital recycling in these markets Aimco defines quality by comparing rents to local market averages:A-quality: rents greater than 125% of market averageB-quality: rents 90% - 125% of market averageC-quality: rents less than 90% of the market average |

| Excludes casualties and property management expenses.NOI less assumed capital replacement expenditures of $850 per unit. $8.5 billion of sales of lower-rated assets from 2004 through 2010 have improved overall portfolio quality.Average rents ? 42%NOI margin ? 8%Free Cash Flow margin ? 20% Disciplined Portfolio Management 6 |

| * For purposes of this analysis, peer group is comprised of BRE, Camden, Colonial Properties, Equity Residential, Home Properties, Post Properties and UDR, companies that report weighted- average maturity. Data as of 3/31/2011 as reported by SNL Financial. Risks of Leverage Entity risk Repricing risk Refunding risk Aimco Leverage Approach Avoid recourse debt. Use fixed rate property loans and preferred securities.Proactively refinance nearer-term property debt maturities to lock in attractive interest rates. Ladder maturities of long-term, non-recourse, amortizing property loans.Maintain little or no near-term debt maturities.Use perpetual preferred securities. Aimco Balance Sheet No recourse debt, other than line of credit, which was undrawn as of 3/31/2011. Property debt 93% fixed rate at 3/31/2011.Project 95%+ fixed at 12/31/2011. Weighted-average maturity of debt of eight years is >35% longer than Aimco's apartment REIT peer average.*Perpetual preferred securities ~13% of Aimco leverage. Aimco Uses Low Risk Leverage 7 |

| 8 Aimco Value Proposition |

| 9 Aimco Value Proposition Apartment demand, driven by favorable, predictable demographics, is strong.Apartment supply is limited and will return slowly as developers restart programs after several years on the sidelines.Favorable demand and supply fundamentals lead to rent growth.Aimco's portfolio and history of operating success provide opportunity for growth similar to other apartment REITs.Aimco's safe leverage will magnify these positive results.Aimco's shares are priced at a discount to its apartment REIT peers. |

| 60% to 70% of people aged 20 to 34 opt for rental housing.*This age cohort is projected to increase by 2.5 million people in the next three years, and 3.5 million over the next five years. * Source: Green Street Advisors Historically, people aged 60 and over have had a propensity to rent of approximately 18%.*Should propensity to rent in this age cohort remain at historical levels, the aging population alone would create additional demand for rental housing. Source: Moody's Economy.com Source: Moody's Economy.com Apartment Demand is Strong 10 |

| Source: Moody's Economy.com.Source: BLS Current Population Survey, May 6, 2011. Represents year-over-year change in the civilian labor force, as defined by the BLS and used in the computation of BLS's unemployment rate. Chart does not refer to nonfarm payroll data.Economist Tom Lawler study results as posted on his blog, CalculatedRisk.com, and quoted in several prominent news publications. Source: Moody's Economy.com The age cohort with the greatest propensity to rent is gaining the largest share of these new jobs.As younger people secure jobs, the 32 million people aged 25 to 34 that live with their parents(3) will be looking for housing, with a high propensity to rent. Monthly job growth has been positive, even though uneven, since October 2010. (1)Economists expect several years to pass before jobs lost during the recession are recovered. Jobs Are Returning 11 |

| Long-term average Homeownership is at a 10-year low, but still 1.2% above the long-term average.Every 1% decline in the homeownership rate translates into more than 1 million rental households. New supply remains limited in the short term. Completions are expected to recover by 2013 only to the average of the past 20 years, despite a much larger population. Source: U.S. Census Bureau, Housing and Household Economic Statistics Division Source: U.S. Census Bureau, Housing and Household Economic Statistics Division Apartment Supply is Limited 12 Long-term average 64.7% |

| * Represents average revenue growth computed by Aimco based on 1) the average of revenue growth projections published by REIS, PPR and AXIOMetrics as of 1Q 2011, and 2) peer market allocation, weighted based on revenues, as reported in 1Q 2011 company reports. Aimco does not endorse or affirm the projected revenue growth published by third parties set forth on this page. These third party projections are provided for informational purposes only, do not represent Aimco's projections for, or estimates of, revenue growth, and are not guarantees of performance. Aimco's increasing portfolio quality and property management strength support future revenue growth consistent with peers.The financial leverage of Aimco's low risk non-recourse property debt and preferred stocks magnifies growth compared to peers. Third party data providers project comparable revenue growth across the apartment REITs. Strong Fundamentals Support Revenue Growth 13 |

| Operating performance exceeds peer average over the last one, three and five years. Aimco is a Reliable Operator 14 Aimco 5-Year CAGR represents only Conventional Same-Store results as data is not available for Total Same Store results for the period. Average of AvalonBay, Camden, Equity Residential, Essex, Home Properties and UDR results as reported individually by SNL Financial. (2) (1) |
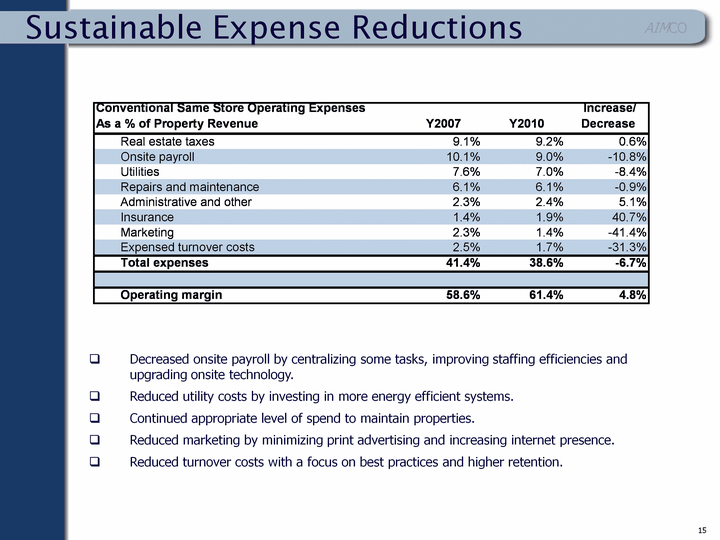
| 15 Sustainable Expense Reductions Decreased onsite payroll by centralizing some tasks, improving staffing efficiencies and upgrading onsite technology.Reduced utility costs by investing in more energy efficient systems.Continued appropriate level of spend to maintain properties.Reduced marketing by minimizing print advertising and increasing internet presence.Reduced turnover costs with a focus on best practices and higher retention. |
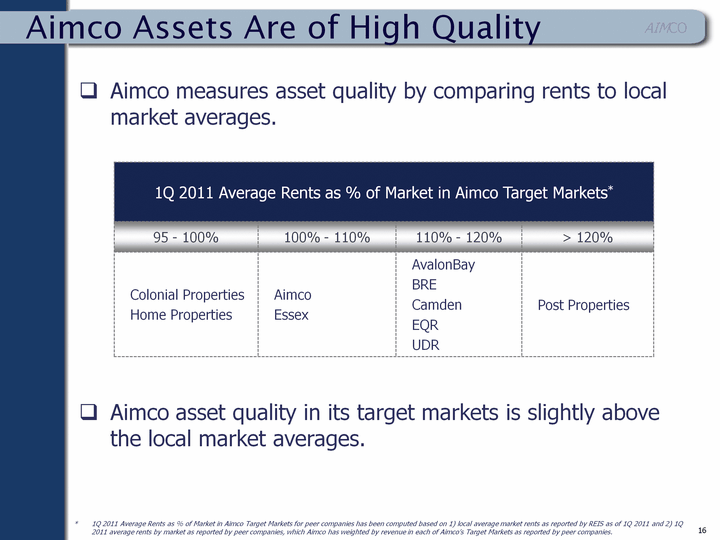
| Aimco measures asset quality by comparing rents to local market averages.Aimco asset quality in its target markets is slightly above the local market averages. the local market averages. the local market averages. the local market averages. the local market averages. the local market averages. the local market averages. the local market averages. the local market averages. the local market averages. the local market averages. the local market averages. * 1Q 2011 Average Rents as % of Market in Aimco Target Markets for peer companies has been computed based on 1) local average market rents as reported by REIS as of 1Q 2011 and 2) 1Q 2011 average rents by market as reported by peer companies, which Aimco has weighted by revenue in each of Aimco's Target Markets as reported by peer companies. Aimco Assets Are of High Quality 16 |

| Aimco's Investment Strategy Supports Growth 17 Match-fund investment activity Aimco makes investment decisions by comparing risk-adjusted, unlevered Free cash Flow Internal Rates of Return (FCF IRR).Aimco also considers factors such as market timing and target portfolio allocations.Semi-annually, Aimco calculates its portfolio FCF IRR on an asset by asset basis.Aimco compares its expected risk-adjusted return on an acquisition or redevelopment to its calculated risk-adjusted cost of capital from property sales or a blend of new property debt and equity issuance. Generate capital through sale of weaker assets, non-recourse property debt and/or share issuance to fund: RedevelopmentExisting AssetsAcquisition FCFIRR +50-150 bp LeverageReductions< 6% Debt Cost< 8% Preferreds(Levered) Real EstateAcquisitions7%-8% FCF IRR Increased Ownership inExisting Assets> Portfolio Avg FCF IRR Current Portfolio~8.0-8.5% FCF IRR |

| By all measures, Aimco is a stronger company today.However, when compared to peers and to historical valuations, Aimco shares traded at a greater discount during 2010 than they did during 2005, which discount has widened further year-to-date 2011. Aimco Conventional Portfolio Average rents NOI margin Free cash flow margin Non-recurring revenue as % of total revenue Recourse debt G&A as a % of property revenues Discount to peer median EV / Revenue Discount to peer median Price / Consensus NAV 2005 $811 55% 47% 2.4% $617M 5.8% -25% -5% 2010 $1,052 60% 54% 0.8% None 4.8% -34% -8% % Change + 30% + 8% + 15% - 67% - 100% - 17% - 36% - 60% Aimco Share Price Lags Aimco Improvements 18 |
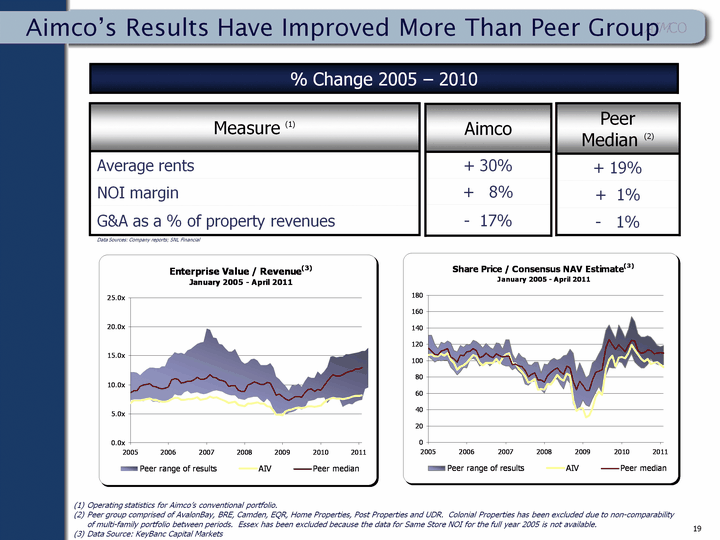
| Measure (1) Average rents NOI margin G&A as a % of property revenues Aimco + 30% + 8% - 17% Peer Median (2) + 19% + 1% - 1% Data Sources: Company reports; SNL Financial Operating statistics for Aimco's conventional portfolio.Peer group comprised of AvalonBay, BRE, Camden, EQR, Home Properties, Post Properties and UDR. Colonial Properties has been excluded due to non-comparability of multi-family portfolio between periods. Essex has been excluded because the data for Same Store NOI for the full year 2005 is not available.Data Source: KeyBanc Capital Markets % Change 2005 - 2010 Aimco's Results Have Improved More Than Peer Group 19 |

| 20 Mid-Quarter Update |

| 21 Property Operations On Track Aimco's focus is NOI growth, which takes into consideration the balance between rate, occupancy levels and turnover costs.Turnover remains at approximately 33%. |
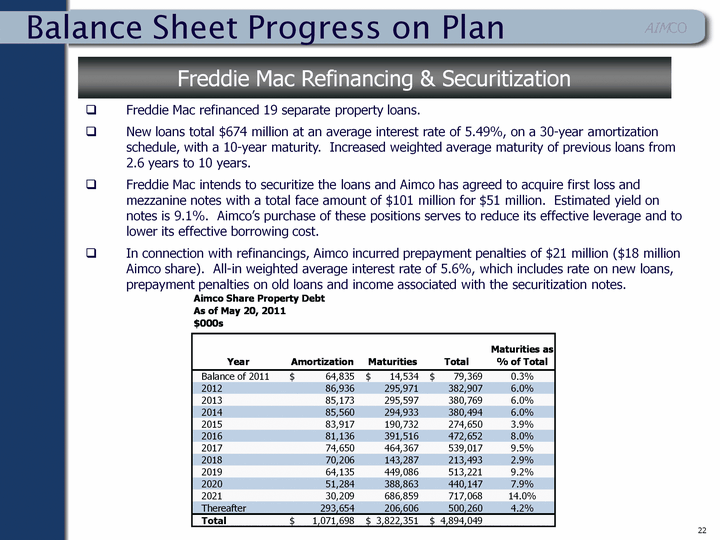
| 22 Balance Sheet Progress on Plan Freddie Mac Refinancing & Securitization Freddie Mac refinanced 19 separate property loans.New loans total $674 million at an average interest rate of 5.49%, on a 30-year amortization schedule, with a 10-year maturity. Increased weighted average maturity of previous loans from 2.6 years to 10 years.Freddie Mac intends to securitize the loans and Aimco has agreed to acquire first loss and mezzanine notes with a total face amount of $101 million for $51 million. Estimated yield on notes is 9.1%. Aimco's purchase of these positions serves to reduce its effective leverage and to lower its effective borrowing cost.In connection with refinancings, Aimco incurred prepayment penalties of $21 million ($18 million Aimco share). All-in weighted average interest rate of 5.6%, which includes rate on new loans, prepayment penalties on old loans and income associated with the securitization notes. |

| 23 Morgan Stanley REIT Initiation: Aimco is "priced for the last cycle, not the current one".AIMCO's relative valuation is weighed down by perceptions regarding weak apartment portfolio quality that do not fully reflect the enhancements produced by non-core dispositions in recent years (trimming from 70 markets to 35). While the asset sales have been dilutive to earnings, we believe the improvements in operating margins and same-store revenue potential should generate valuation gains that should be reflected in higher FFO multiples and lower implied cap rates.Raymond James Report re: AIV Financing Transaction: "AIMCO's ability to extend its debt maturities and lock in attractively priced, long-term property debt underscores a sound financial strategy that continues to reduce the risks associated with its leverage." * Represents NOI growth ranking of 11 apartment REITs as reported by Green Street Advisors in its Residential Sector Update dated May 20, 2011. Growth has been adjusted by Green Street Advisors for its estimate of the impact to NOI of revenue enhancing capital expenditures. Green Street Advisors Data: Aimco has provided above average NOI growth over the past five years. Positive News from Analyst Community |

| 24 Earnings and Dividend Aimco's opportunity for dividend increases is greater than peers due to higher AFFO growth rate and current low payout ratio. * Excluding impact of $0.14 of charges in 2011 associated with Freddie Mac refinancing and securitization announced by Aimco on May 20, 2011. Green Street Advisors projects Aimco's three year FFO growth to be above average, and AFFO growth to be twice the peer average. |