Attached files
| file | filename |
|---|---|
| 8-K - FORM8K - DYCOM INDUSTRIES INC | form8k.htm |
Exhibit 99.1

Credit Suisse 2011 Engineering
and Construction Conference
June 2, 2011
and Construction Conference
June 2, 2011

1
Forward-Looking Statements and Non-GAAP
Information
Information
Forward-Looking Statements and Non-GAAP
Information
Information
This presentation contains “forward-looking statements” which are statements relating to future
events, future financial performance, strategies, expectations, and competitive environment. All
statements, other than statements of historical facts, contained in this presentation, including
statements regarding our future financial position, future revenue, prospects, plans and objectives of
management, are forward-looking statements. Words such as “believe,” “expect,” “anticipate,”
“estimate,” “intend,” “forecast,” “may,” “should,” “could,” “project” and similar expressions, as well as
statements in future tense, identify forward-looking statements. You should not read forward-looking
statements as a guarantee of future performance or results. They will not necessarily be accurate
indications of whether or at what time such performance or results will be achieved. Forward-looking
statements are based on information available at the time those statements are made and/or
management’s good faith belief at that time with respect to future events. Such statements are subject
to risks and uncertainties that could cause actual performance or results to differ materially from those
expressed in or suggested by the forward-looking statements. Important factors that could cause such
differences include, but are not limited to factors described under Item 1A, “Risk Factors” of the
Company’s Annual Report on Form 10-K for the year ended July 31, 2010, and other risks outlined in
the Company’s periodic filings with the Securities and Exchange Commission (“SEC”). The forward-
looking statements in this presentation are expressly qualified in their entirety by this cautionary
statement. Except as required by law, the Company may not update forward-looking statements even
though its situation may change in the future.
This presentation includes certain “Non-GAAP” financial measures as defined by SEC rules. As
required by the SEC we have provided a reconciliation of those measures to the most directly
comparable GAAP measures on the Regulation G slide included at the end of this presentation.
required by the SEC we have provided a reconciliation of those measures to the most directly
comparable GAAP measures on the Regulation G slide included at the end of this presentation.

2
Dycom Industries Introduction
n Leading provider of specialty contracting services principally to
telephone and cable companies
telephone and cable companies
n Telecommunications industry dynamics driving growth potential
n Major participant in a large, but fragmented industry, which offers
acquisition opportunities
acquisition opportunities
n Significant portion of revenues from multi-year Master Service
Agreements
Agreements
n Experienced management team operating through a decentralized,
customer-focused organizational structure
customer-focused organizational structure
n Strong cash flows and liquidity
3
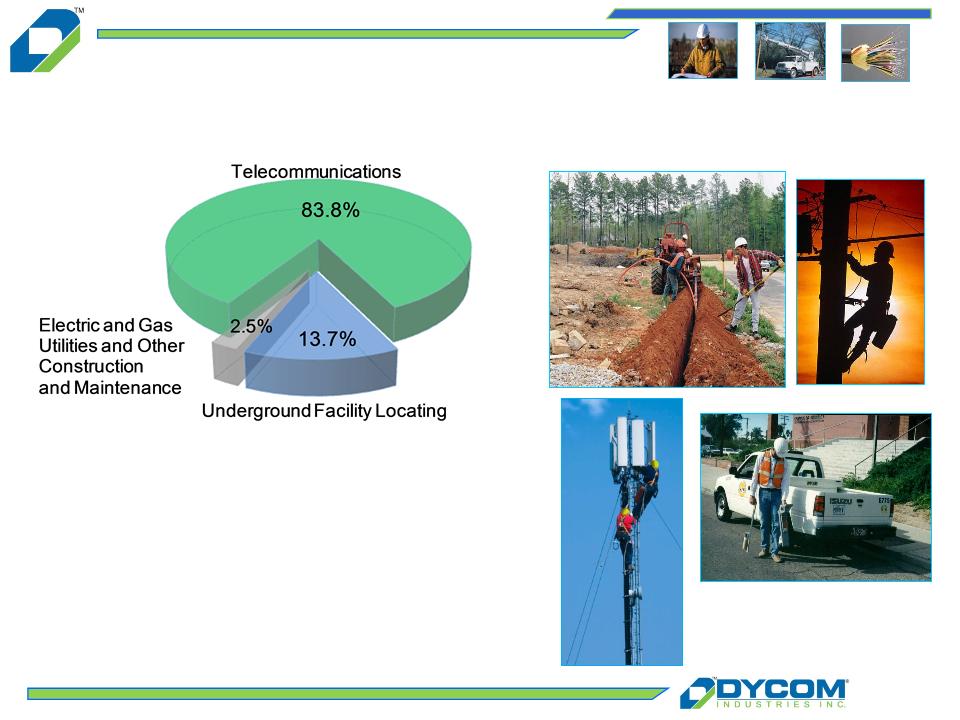
Customer Revenue Mix
Contract Revenue $252.4 million*
Quarter Ended April 30, 2011
* Includes revenues from businesses acquired in Q2-11 since acquisition dates.
4
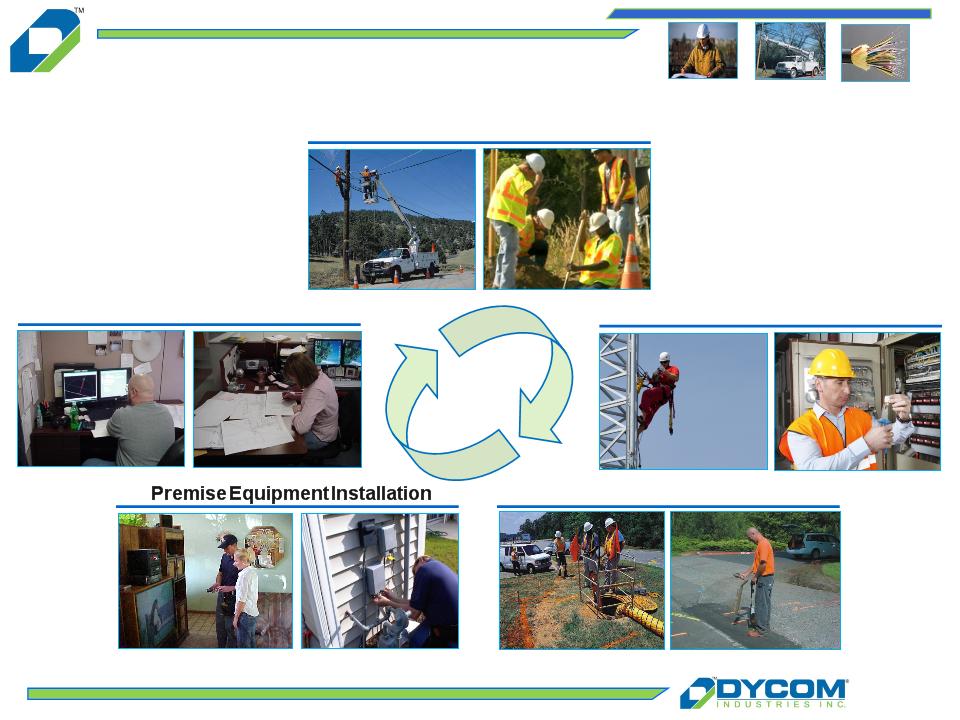
Providing End-To-End Services
Engineering
Underground Facility Locating
Outside Plant & Equipment Installation
Wireless Services

5
Dycom Industries At a Glance
Dycom is a leading telecommunications infrastructure provider in the United States
n Headquartered in Palm Beach Gardens, Florida
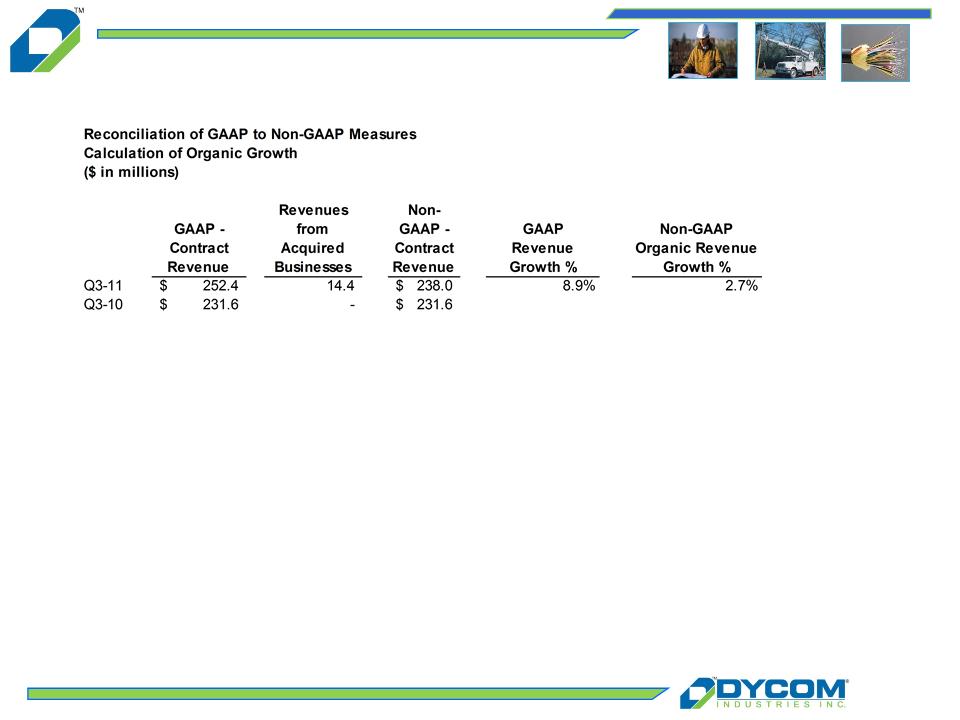
n Q3-2011 revenues of $252.4 million grew organically 2.7% after adjusting for
revenues from acquired companies
revenues from acquired companies
n Strong financial profile
} Cash and equivalents $89.0 million at April 30, 2011
} 7.125% Senior Subordinated Notes due 2021 issued in Q2-11
} Shareholders’ equity $346.4 million at April 30, 2011
} Repurchased over $55 million in common shares in the first nine months of
fiscal 2011
fiscal 2011
} Approximately $274 million in share repurchases since fiscal 2006
n Nationwide footprint
} Operates in 48 states and to a limited extent in Canada
} 31 operating subsidiaries and hundreds of field offices
n Over 8,100 employees
n Listed on the NYSE under the ticker: DY
See “Regulation G disclosure” slides for a reconciliation of Non-GAAP financial measures to GAAP financial measures.
6
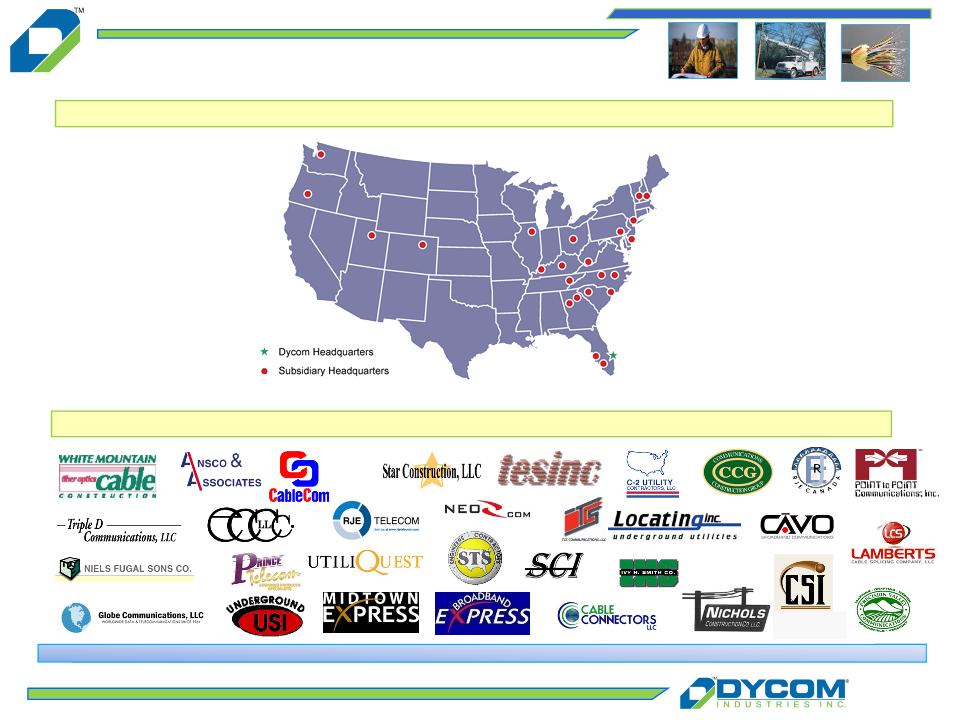
Strong subsidiaries, broad national footprint
Subsidiaries
Dycom’s Nationwide Presence
Dycom Operating Overview

7
Industry Developments…
n Telephone / cable industry convergence - a reality
} Competition for customers drives growth
n Network bandwidth expansion - an imperative
} Telephone companies expanding network capacity
} Cable responding to match capabilities and facilitate new
products such as VOIP, HDTV, and wideband
products such as VOIP, HDTV, and wideband
} Wireless service providers upgrading to 4G to accommodate
new services and increased data usage
new services and increased data usage
n Product bundles - key to telephone / cable success
} Decrease customer churn
} Provide revenue growth opportunities to offset market share
erosion
erosion

8
…And Industry Opportunities
n Continued capital spending
} Telephone company deployments of Fiber (FTTx)
} Cable company bandwidth expansion
} Customer premise equipment deployments
} 4G upgrades and fiber to the cell site wireless backhaul
} Rural broadband deployment
n Renewed focus on network reliability and availability as
subscribers demand better service levels
subscribers demand better service levels
n Continued outsourcing as time to market and installation quality
are crucial for new product launches
are crucial for new product launches

9
Telecom Capital Spending
Lowell McAdam - Verizon Communications, Inc. President, COO May 2011
n Continued capital spending in wireline reflects burgeoning demand for voice, data and
video transmission
video transmission
n Wireless capital spending accelerating as 4G networks proliferate and new competitors
emerge
emerge
n Significant portion of RBOCs’ capital budgets are expected to be from fiber deployments,
including fiber to the cell site initiatives
including fiber to the cell site initiatives
n Carriers are shifting capital spending to address growth needs and increased
competition from cable companies
competition from cable companies
Capital Expenditure Commentary
“….I think our -- our goal right now is to go out and streamline further the wireline assets,
and by that, I mean the core performance, as well as FiOS. As I've gone into this new job over
the last six months, and I travel around the wireline side of the business, I see what I call lots
of pots of gold here where we can become more efficient, so we're very focused on that. And
I think there's also an opportunity to streamline FiOS. There are too many network elements
between the central office and the customer. We're using technology to streamline those.
That also gives you the ability to improve the productivity of the technician; it doesn't take
him as long to do an installation. So I want to see how we can get more efficient and get
better penetration, and then I think it's -- maybe we expand FiOS a little bit, if I can make the
math work.”

10
Cable Capital Spending
“… And finally, carrier wholesale which includes cell backhaul services. Given our largely to
tier 2 footprint, we believe we are in a unique position to enable high-capacity last mile
services for wholesale providers. For the latter two segments, there is an especially long lead
time from the sales effort, to installation, and billable revenue, and you will continue to see
some quarter-to-quarter variability in both revenue and CapEx for the commercial side of the
house. As we've said before, we see significant growth opportunity in each of these
commercial segments and I believe we're making the right investments to capitalize on that
opportunity.”
n Continued capital expenditures on bandwidth reclamation, VOIP and HDTV product
offerings, and cellular backhaul
offerings, and cellular backhaul
n Ongoing plant and network enhancements are critical as cable operators continue to
offer services that require greater reliability
offer services that require greater reliability
n Network capacity and reliability increasingly crucial as cable companies compete with
traditional telecom firms
traditional telecom firms
Capital Expenditure Commentary
Don Detampel- Charter Communications
EVP of Technology & President of Commercial Services May 2011

11
Underground Facility Locating Services
n “Dig Safe” laws in all 50 states require owners of underground utilities to
identify and mark their facilities prior to excavation
identify and mark their facilities prior to excavation
} Regulates telephone, cable, power, gas and water & sewer utilities
} Seeks to minimize network outages, protect job-site workers and
safeguard the general public
safeguard the general public
} Locates often required as a condition for permit issuance
n Generally outsourced by telecom companies and cable operators
} Work generated by excavators via “800 number” call centers
} High volume of transactions must be completed within 48-72 hours
n Regulatory backdrop promotes steady workflow
} Driven by regional macro-economic factors

12
Dycom’s Competitive Advantages
n Established customer relationships and reputation
n Broad geographic coverage
n Scale to satisfy customer time and service requirements
n Responsive, local decentralized business units
n Access to capital
n Senior management operating expertise

13
Growth Strategy As Opportunities
Expand
Expand
n Build and maintain long-term customer relationships at the local level
} Position business to capture both recurring maintenance and new capital
spending
spending
n Empower subsidiary management
} Build relationships with customer contracting decision makers
} Utilize detailed knowledge of local pricing dynamics
} Leverage subcontractors and local trade relationships
n Deliberately select attractive customers with profitable business
} Focus on higher quality, long-term telecommunications industry leaders
n Selectively screen potential acquisitions
} Healthy players that bring long-term, established customer relationships
} Complement existing Dycom customer footprint
} Position Company for significant customer capital or maintenance
spending
spending
Dycom employs a deliberate and methodical growth strategy

14
Blue-chip, predominantly investment grade clients comprise the vast majority of revenue
Well Established Customers
Fiscal Quarter Ended April 30, 2011
Customer Revenue Breakdown
Comcast
AT&T
CenturyLink
Verizon
Windstream
Cablevision
Charter
Duke Energy
Time Warner
Cable
Other
Edison International
15
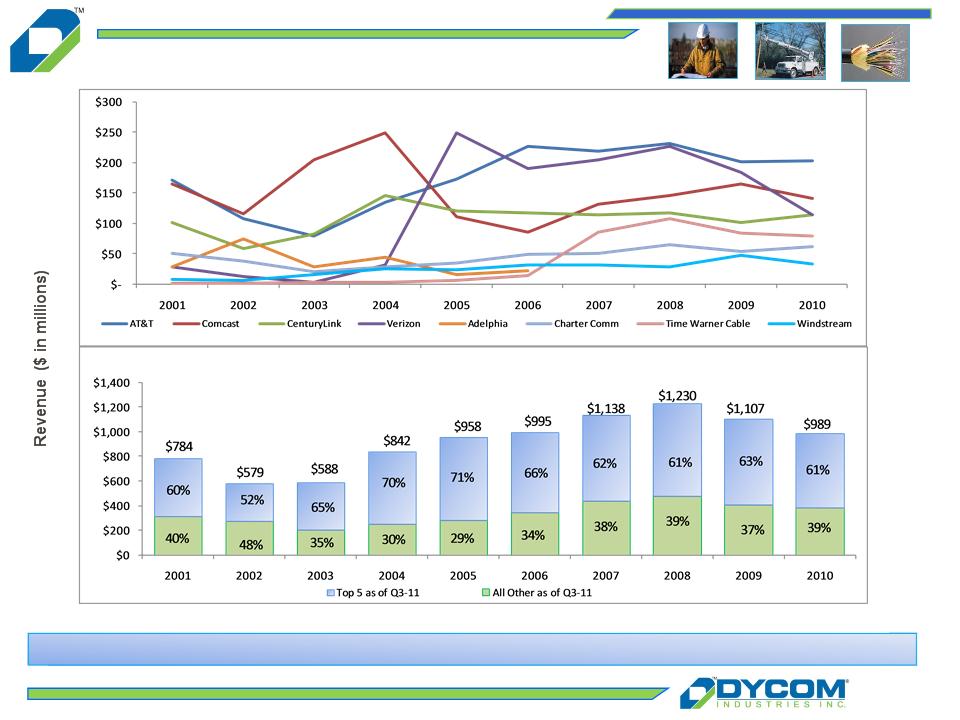
Customer Rotation
Key long-term relationships help Dycom manage the cyclical nature of telecom and cable capex spending
For comparison purposes, when customers have been combined through acquisition or merger, their revenues have been combined for all periods.
16
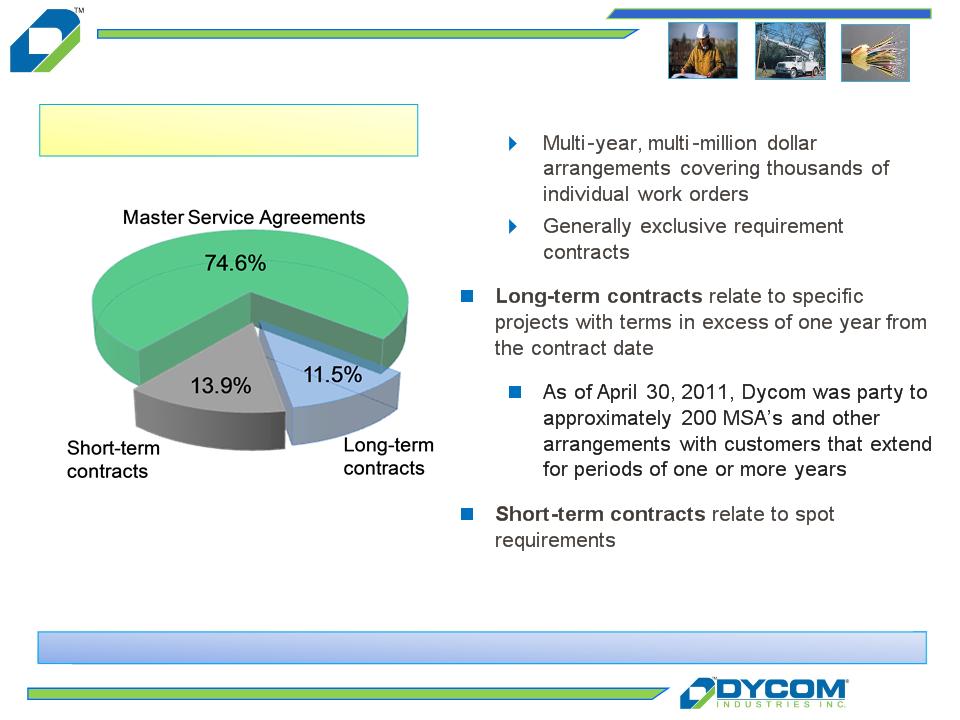
Dycom’s revenue stream is primarily generated by long-term contractual agreements
n Master Service Agreements (MSA’s)
n Significant majority of contracts are based on
units of delivery
units of delivery
Revenue By Contract Type
Quarter Ended April 30, 2011
Quarter Ended April 30, 2011
Revenue - Q3 Fiscal 2011

17
Senior Management
Seasoned management team with several decades of combined industry experience

Financial Update

19
nCentralize activities which yield synergistic benefits
} Treasury
} Tax
} Risk management
} Capital asset procurement
} Information technology resources
nDecentralize financial operations to provide solid support
and flexibility at operating unit level
and flexibility at operating unit level
nMaintain financial resources to support internal growth
and acquisition opportunities
and acquisition opportunities
Financial Overview
20
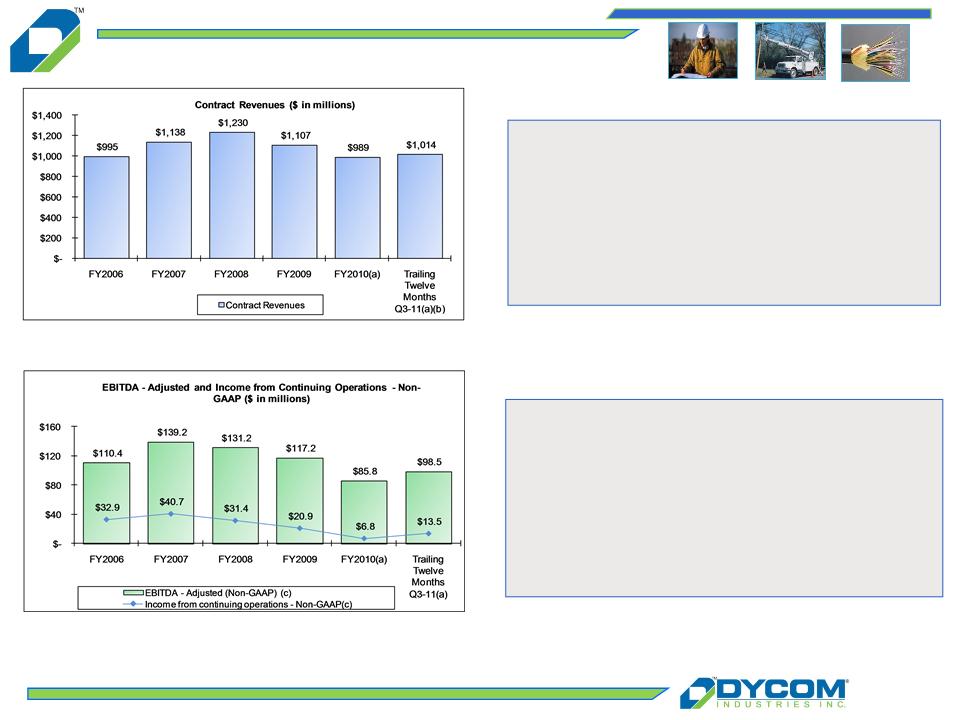
Fiscal Year Results - Revenue and Earnings
(a) Q4-10 Fiscal 2010 includes an incremental week as the result of our 52/53 week fiscal year.
(b) Trailing Twelve Months Q3-11 includes contract revenues of $732.1 million for the nine months ended April 30, 2011 and $281.5 million for the three months ended July 31, 2011 (including an
incremental week during Q4-10 as the result of our 52/53 week fiscal year)
incremental week during Q4-10 as the result of our 52/53 week fiscal year)
(c) The amounts for EBITDA - Adjusted and Income from continuing operations -Non-GAAP are Non-GAAP financial measures adjusted to exclude certain items. See “Regulation G Disclosure”
slide for a reconciliation of Non-GAAP financial measures to GAAP financial measures.
slide for a reconciliation of Non-GAAP financial measures to GAAP financial measures.
n Fiscal 2009 - 2010 revenues
impacted by reductions in
customer spending in response to
economic conditions
impacted by reductions in
customer spending in response to
economic conditions
n Trailing Twelve Months Q3-11
trends improving
trends improving
n Operating results responsive to
contract revenues
contract revenues
n With fiscal 2011 results increasing
from growth and improved
operating efficiencies
from growth and improved
operating efficiencies
21
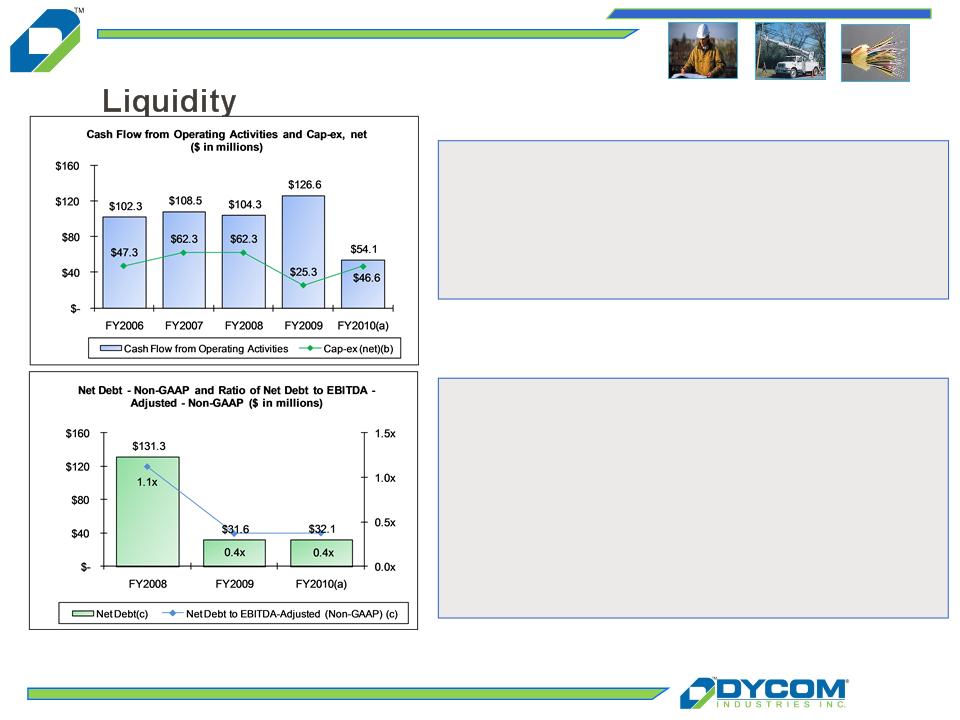
Fiscal Year Results - Cash Flow and
n Strong cash flow from operations. Fiscal
2010 cash flows impacted by lower levels
of operations
2010 cash flows impacted by lower levels
of operations
n Ample cash flows to support capital
expenditures and fund operations
expenditures and fund operations
n Long term financing in place
} $187.5 million 7.125% Senior
Subordinated Notes; due 2021
Subordinated Notes; due 2021
} $225 million Credit Facility; due 2015
} No borrowings outstanding
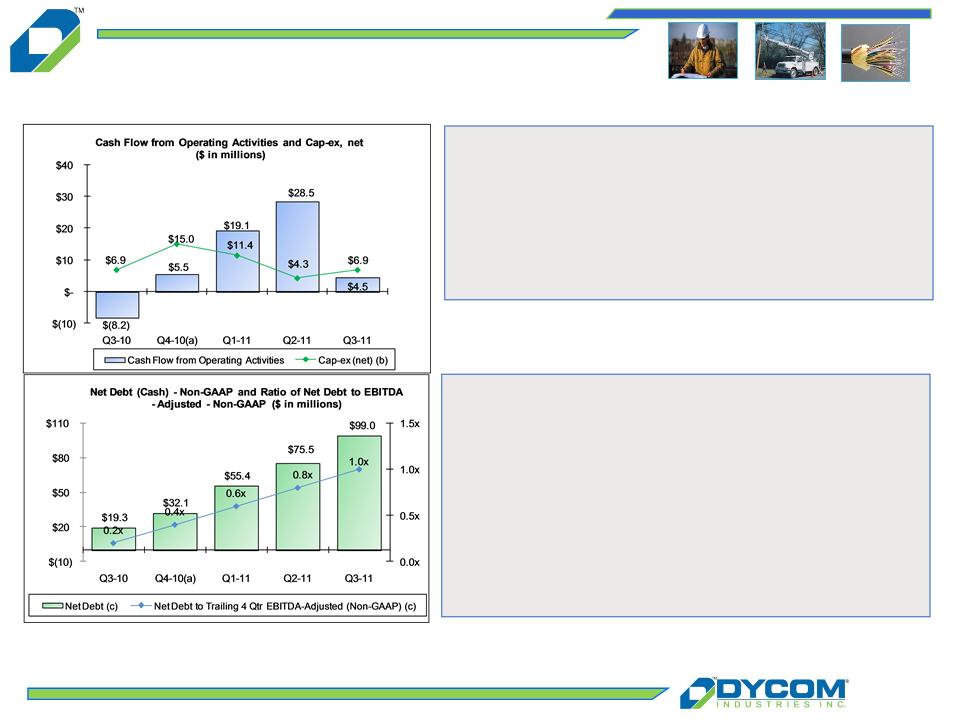
n 0.4x ratio of Net Debt to EBITDA-Adjusted
(a) Fiscal 2010 includes an incremental week as the result of our 52/53 week fiscal year.
(b) Capital expenditures net of proceeds from the sale of assets
(c) The amounts for EBITDA - Adjusted and Net Debt used in the calculations herein are Non-GAAP financial measures adjusted to exclude certain items. See
“Regulation G Disclosure” slide for a reconciliation of Non-GAAP financial measures to GAAP financial measures.
“Regulation G Disclosure” slide for a reconciliation of Non-GAAP financial measures to GAAP financial measures.
22
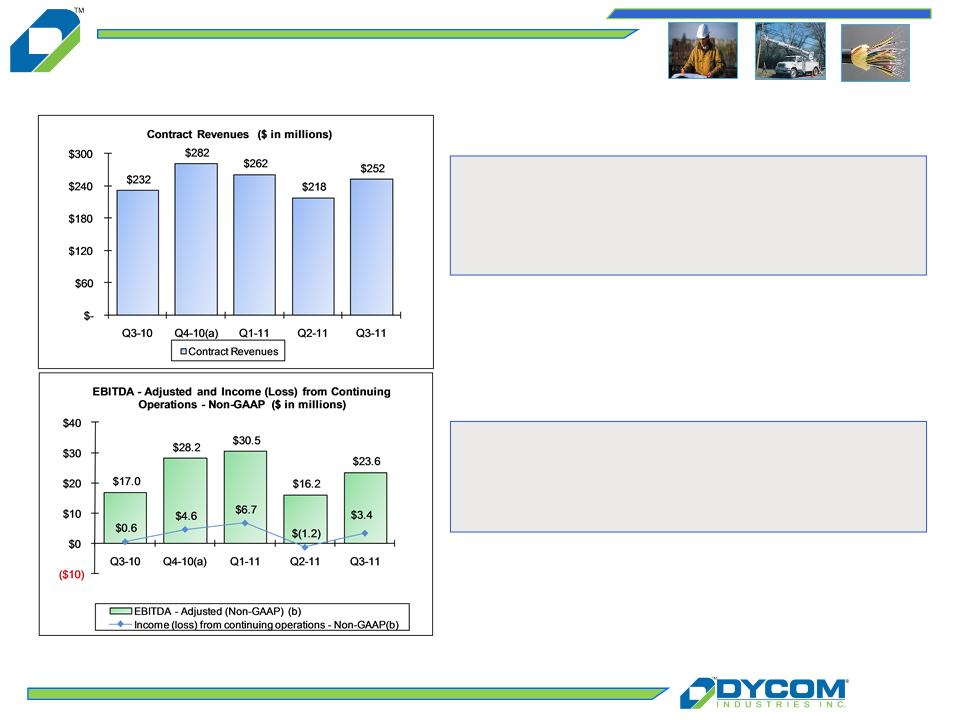
Quarterly Results - Revenue and
Earnings
Earnings
n Year-over-year revenue trends
improving as a result of organic growth
and revenues from acquired
businesses
improving as a result of organic growth
and revenues from acquired
businesses
(a) Q4-10 includes an incremental week as the result of our 52/53 week fiscal year.
(b) The amounts for EBITDA - Adjusted and Income (Loss) from continuing operations -Non-GAAP are Non-GAAP financial measures adjusted to exclude certain
items. See “Regulation G Disclosure” slide for a reconciliation of Non-GAAP financial measures to GAAP financial measures.
items. See “Regulation G Disclosure” slide for a reconciliation of Non-GAAP financial measures to GAAP financial measures.
n EBITDA - Adjusted and Income from
Continuing Operations improved from
operating efficiencies year over year
Continuing Operations improved from
operating efficiencies year over year
23
Quarterly Results - Cash Flow and
Liquidity
(a) Fiscal 2010 includes an incremental week as the result of our 52/53 week fiscal year.
(b) Capital expenditures net of proceeds from the sale of assets
(c) The amounts for EBITDA - Adjusted and Net Debt used in the calculations herein are Non-GAAP financial measures adjusted to exclude certain items. See
“Regulation G Disclosure” slide for a reconciliation of Non-GAAP financial measures to GAAP financial measures.
“Regulation G Disclosure” slide for a reconciliation of Non-GAAP financial measures to GAAP financial measures.
n Cash flows from operations reflects
seasonality, grew year-over-year from
improved operating results
seasonality, grew year-over-year from
improved operating results
n Capital expenditures, net of disposals
totaled $6.9 million during Q3-11
totaled $6.9 million during Q3-11
n Strong financial profile and ample
liquidity as of April 30, 2011
liquidity as of April 30, 2011
} $89.0 million cash and equivalents
} $187.5 million 7.125% Senior
Subordinated Notes due 2021
issued Q2-11
Subordinated Notes due 2021
issued Q2-11
} $127.8 million availability under
Revolving Credit Facility
Revolving Credit Facility
24
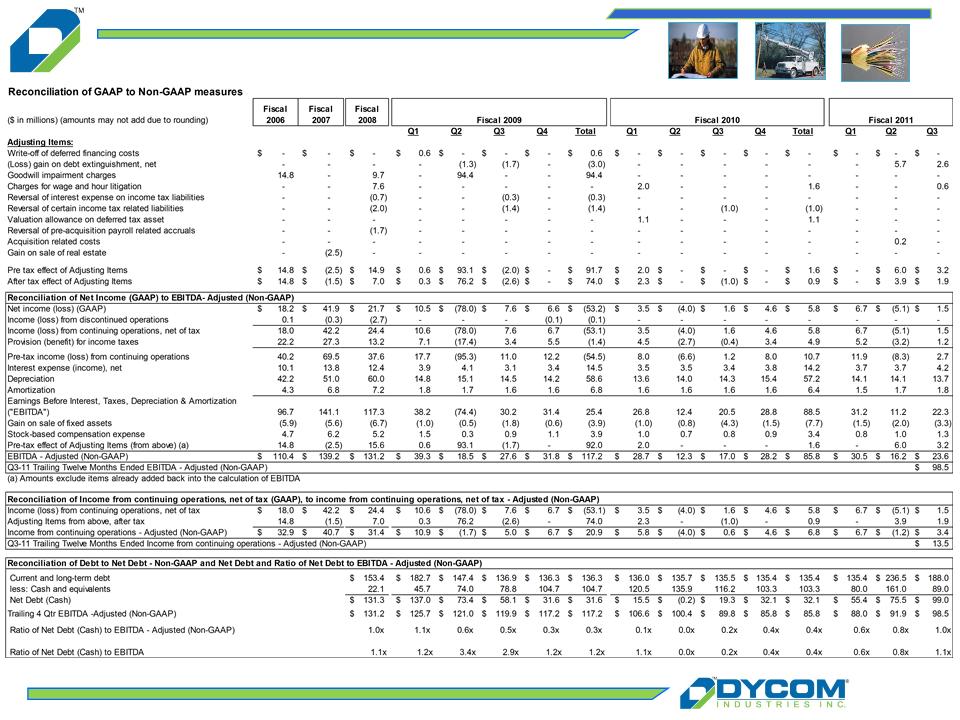
Regulation G Disclosure
25
Regulation G Disclosure
Credit Suisse 2011 Engineering
and Construction Conference
June 2, 2011
and Construction Conference
June 2, 2011