Attached files
| file | filename |
|---|---|
| 8-K - FORM 8-K - Howmet Aerospace Inc. | d8k.htm |
 Nomura Aluminum Seminar
June
2 ,
2011
Exhibit 99
Alcoa Logo
nd |
 Cautionary Statement
2
Alcoa Logo
Forward-Looking Statements
This presentation contains statements that relate to future events and expectations and as such
constitute forward-looking statements within the meaning of the Private Securities
Litigation Reform Act of 1995. Forward-looking statements include those containing such words as “anticipates,”
“estimates,” “expects,” “forecasts,” “intends,”
“outlook,” “plans,” “projects,” “should,” “targets,” “will,” or other words of similar meaning. All
statements that reflect Alcoa’s expectations, assumptions, or projections about the future other
than statements of historical fact are forward- looking statements, including, without
limitation, forecasts concerning global demand for aluminum, aluminum end-market growth, aluminum
consumption rates, or other trend projections, targeted financial results or operating performance,
and statements about Alcoa’s strategies, objectives, goals, targets, outlook, and business
and financial prospects. Forward-looking statements are subject to a number of known and
unknown risks, uncertainties, and other factors and are not guarantees of future performance.
Important factors that could cause actual results to differ materially from those in the
forward-looking statements include: (a) material adverse changes in aluminum industry conditions, including
global supply and demand conditions and fluctuations in London Metal Exchange-based prices for
primary aluminum, alumina, and other products, and fluctuations in indexed-based and spot
prices for alumina; (b) unfavorable changes in general business and economic conditions, in the global
financial markets, or in the markets served by Alcoa, including automotive and commercial
transportation, aerospace, building and construction, distribution, packaging, consumer
electronics, oil and gas, defense, and industrial gas turbines; (c) the impact of changes in foreign currency
exchange rates on costs and results, particularly the Australian dollar, Brazilian real, Canadian
dollar, and Euro; (d) increases in energy costs, including electricity, natural gas, and fuel
oil, or the unavailability or interruption of energy supplies; (e) increases in the costs of other raw
materials, including caustic soda or carbon products; (f) Alcoa’s inability to achieve the level
of revenue growth, cash generation, cost savings, improvement in profitability and margins,
fiscal discipline, or strengthening of operations (including moving its alumina refining and aluminum
smelting businesses down on the industry cost curve and increasing revenues in its Flat-Rolled
Products and Engineered Products and Solutions segments), anticipated from its productivity
improvement, cash sustainability and other initiatives; (g) Alcoa's inability to realize expected benefits
from newly constructed, expanded or acquired facilities or from international joint ventures as
planned and by targeted completion dates, including the joint venture in Saudi Arabia or the
upstream operations in Brazil; (h) political, economic, and regulatory risks in the countries in which Alcoa
operates or sells products, including unfavorable changes in laws and governmental policies, civil
unrest, or other events beyond Alcoa’s control; (i) the outcome of contingencies, including
legal proceedings, government investigations, and environmental remediation; (j) the business or
financial condition of key customers, suppliers, and business partners; (k) changes in tax rates or
benefits; and (l) the other risk factors summarized in Alcoa's Form 10-K for the year ended
December 31, 2010, and other reports filed with the Securities and Exchange Commission (SEC).
Alcoa disclaims any obligation to update publicly any forward-looking statements, whether in response to new information, future events or
otherwise, except as required by applicable law. |
 Perspective:
viewpoint
of
presentation
Differentiation:
Alcoa
and
what
makes
us
special
Looking
Back:
sustainably
improving
our
cost
structure
Looking
Forward:
setting
rigorous
3-
to
5-year
goals
3
Alcoa Logo |
 Perspective:
viewpoint
of
presentation
Differentiation:
Alcoa
and
what
makes
us
special
Looking
Back:
sustainably
improving
our
cost
structure
Looking
Forward:
setting
rigorous
3-
to
5-year
goals
4
Alcoa Logo |
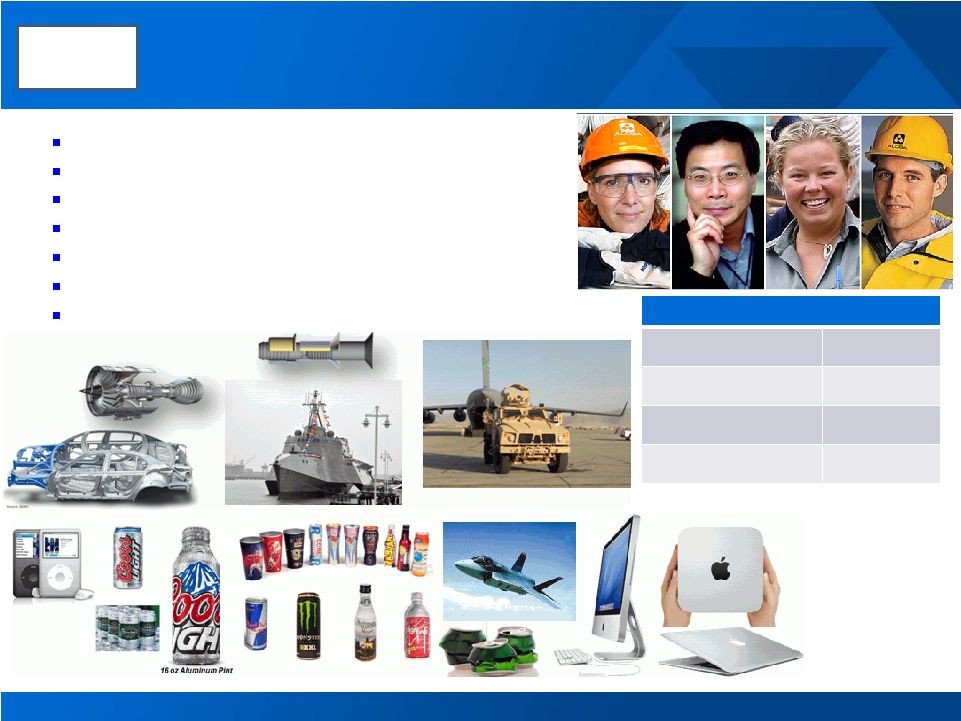 5
Founded in 1888
200+ locations
31 countries
$21.0 billion 2010 revenue
10 times safer workplace than US average
Award-winning sustainability leadership
120 years of aluminum technical leadership
Alcoa: long-lasting, global and focused on delivering value
Alcoa
Logo
Number of Employees (2010)
U.S.
24,000
Europe
17,000
Other Americas
11,000
Pacific
7,000
59,000 |
 Building a solid foundation and setting the right standard
6
Renewable Energy
Carbon
Sequestration
Carbothermic
Embracing diversity & talent to live our values…
…conserving natural resources…
…innovating continuously…
…and creating impacts through our values.
CO2
Reductions
Alcoa
Logo |
 Aluminum: the miracle metal
Lightweight
Recyclable
Non corrosive
Fuel efficient
Durable
High
strength
Highly
conductive
Malleable
7
Alcoa
Logo |
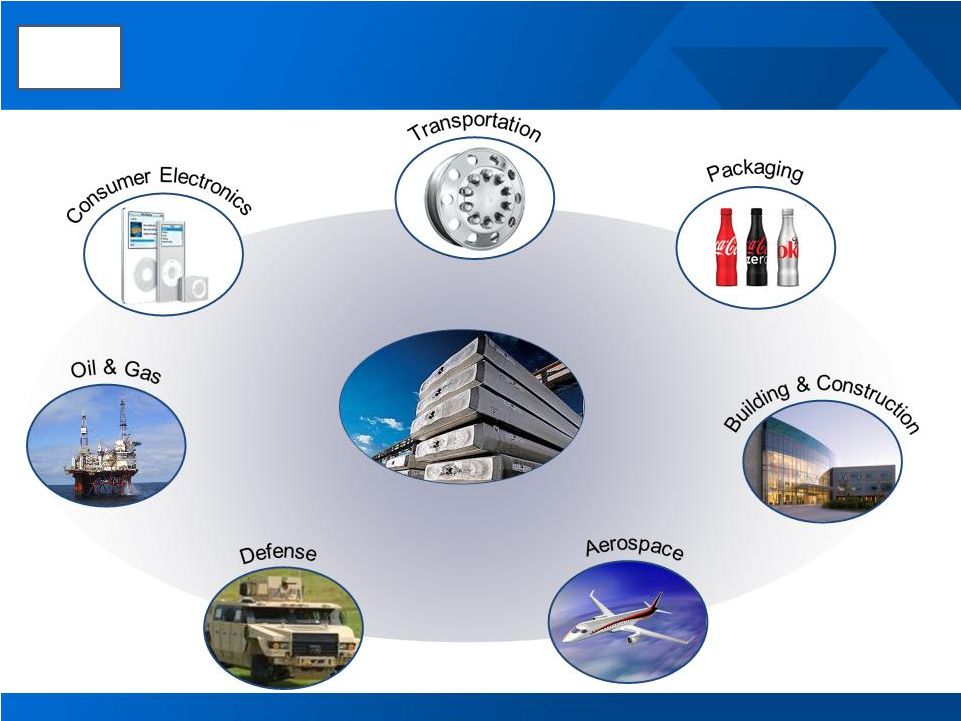
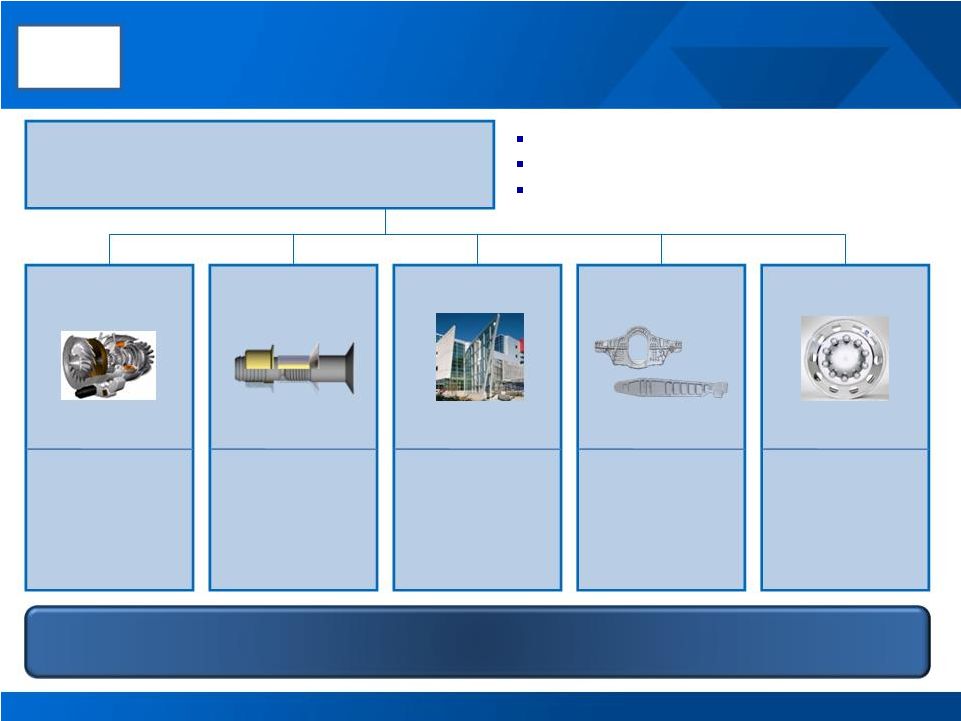
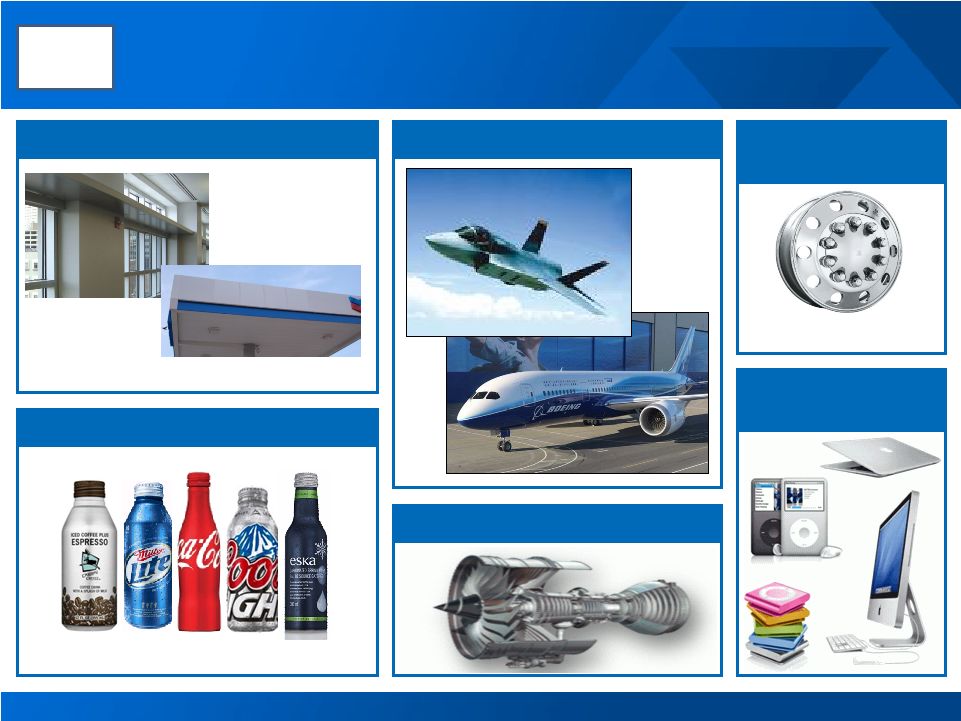 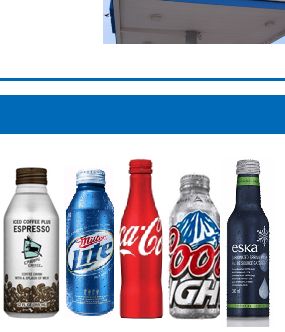 Partnering with our customers to drive innovation
Titanium coated Reynobond
Kawneer Light
Shelf
Aluminum Bottle
LvL ONE™
Truck Wheel
8
Building and Construction
Beverage Packaging
Industrial Gas Turbines
Aerospace
Consumer
Electronics
Commercial
Transportation
Alcoa
Logo |
 9
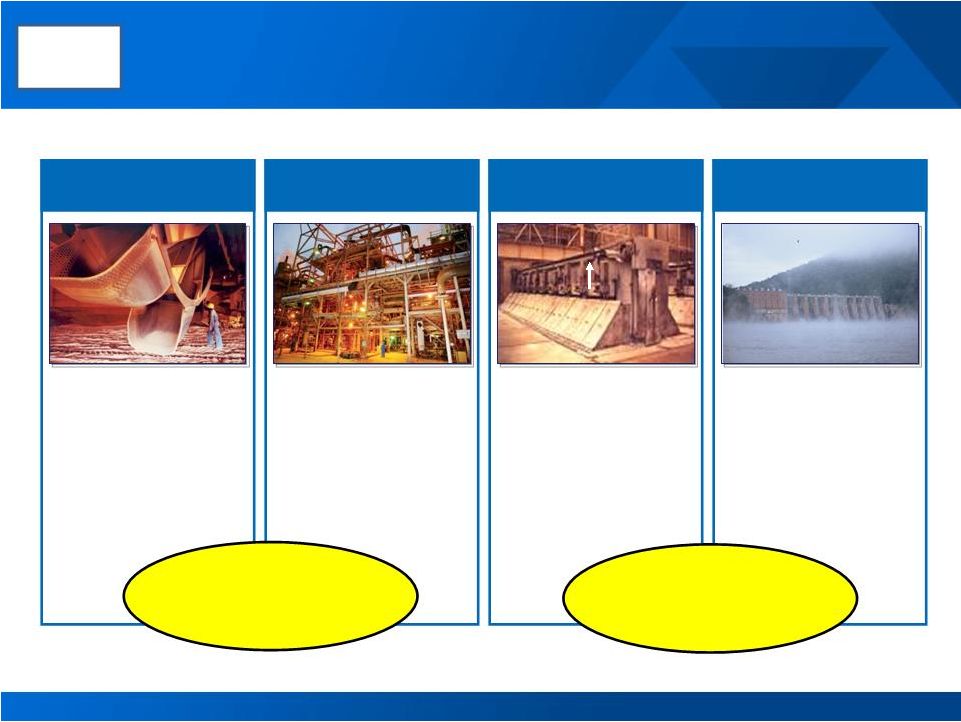
Upstream portfolio: bauxite, alumina, aluminum and energy
9
Mining
#1 in
Bauxite
Refining
Smelting
Energy
#1 in
Alumina
Global leader
in Smelting
$7.1B Revenues
In 2010
~ 2/3 smelter
capacity
powered with
renewable
energy
$2.8B Revenues
in 2010
Alcoa
Logo |
 10
10
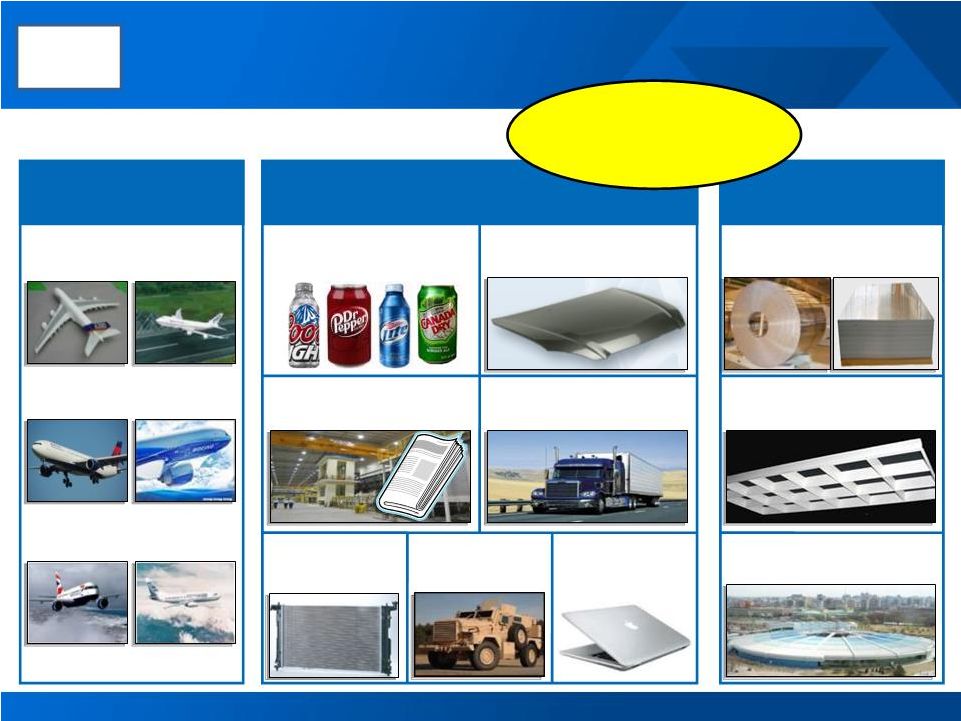
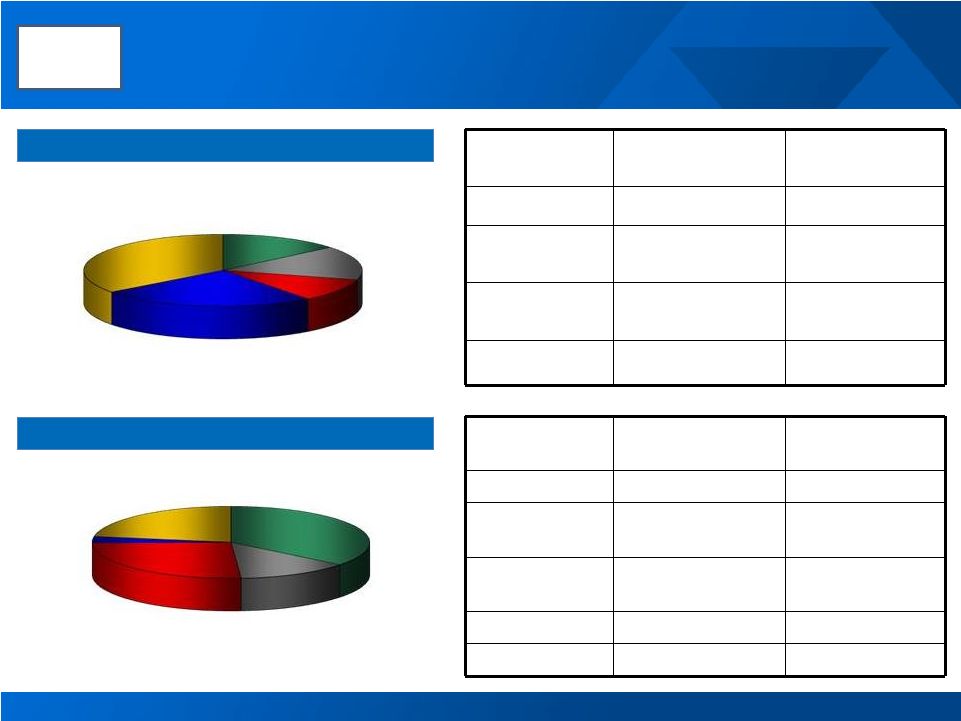
Midstream portfolio: Global Rolled Products
Global Rolled Products Portfolio
Global Aerospace
Regional
Commodities
Aerospace
Jumbo Aircraft
Twin Aisles
Single Aisles
Can /
Packaging
Automotive
Sheet
Lithographic
Sheet
Commercial
Transportation
Brazing
HVAC
Defense
Consumer
Electronics
Industrial
Products
Building &
Construction
Common
Alloys
Regional Specialties
B737
A320
B777
A330/A340
B747-8
A380
$4.7B Revenues
in 2010
Alcoa
Logo |
 Power &
Propulsion
Forgings &
Extrusions
Wheels
BCS
Fastening
Systems
$1.1B
$0.9B
$0.6B
$0.5B
Global leader
in aerospace
Fastening
Systems.
Global leader
in jet engine and
industrial gas
turbine airfoils
Global leader
in aluminum
commercial
vehicle wheels
Global
technology leader
in aerospace and
defense
NA Market leader
in commercial
architectural
systems
2010 Revenues: $4.6 billion
Employees: ~21,000
Locations: 88 Facilities in 20 Countries
11
$1.5B
Downstream portfolio: Engineered Products & Solutions
Technically complex & highly differentiated products focused on
aerospace, power generation, commercial transportation and B&C
markets Engineered Products & Solutions
Alcoa
Logo |
 Perspective:
viewpoint
of
presentation
Differentiation:
Alcoa
and
what
makes
us
special
Looking
Back:
sustainably
improving
our
cost
structure
Looking
Forward:
setting
rigorous
3-
to
5-year
goals
12
Alcoa
Logo |
 Driving cost improvements in 2009 and 2010
13
2009
2010
$
Millions
$2,000
$ Millions
$1,998
$1,500
2009
Target
2009
Actual
1
Procurement and other productivity
Procurement
2010
Original
Target
2010
Revised
Target
Overhead
$2,500
$2,643
2010
Actual
2009
2010
$
Millions
$400
$ Millions
$412
$200
2009
Target
2009
Actual
2010
Original
Target
2010
Revised
Target
$500
$509
2010
Actual
Alcoa
Logo
1 |
 14
Upstream costs are tied to several key commodities
Input Cost
Inventory flow
Pricing
convention
Fuel oil
1 -
2 months
Prior month
Natural gas
1 -
2 months
Rolling 16
quarters
Caustic soda
3 -
6 months
Spot & semi-
annual
Bauxite
2 -
3 months
6 -
9 month lag
Input Cost
Inventory flow
Pricing
convention
Alumina
1 -
2 months
2 -
3 month lags
Power
1 -
2 months
40% LME linked
-
3 month lag
Carbon
1 -
2 months
Spot & semi-
annual
Materials
1 -
2 months
1 -
3 month lag
Conversion
1 month
Immediate
Refining
Cost
Structure
Smelting
Cost
Structure
Alcoa
Logo
Conversion
35%
Fuel Oil
14%
Natural gas
15%
Caustic
11%
Bauxite
25%
Power
26%
Carbon
13%
Alumina
36%
Conversion
22%
Materials
3% |
 15
Currency and raw materials continue to trend upwards
1
PACE -
CPC USGC (PACE MidPoint)
2
CMAI -
Caustic Soda Average Acquisition -
FOB USGC ($/DMT)
3
Bloomberg Daily Average -
Gulf Coast 3% Sulfur Fuel Oil
4
NYMEX
LME Cash
AUD/USD
Currency / USD
Aluminum $ / Tonne
LME Cash
Caustic
Soda
Index
2
Index Prices
Aluminum $ / Tonne
CPC
Pace
Index
BRL/USD
CAD/USD
EUR/USD
Fuel
Oil
Index
Natural
Gas
4
Alcoa
Logo
3
1 |
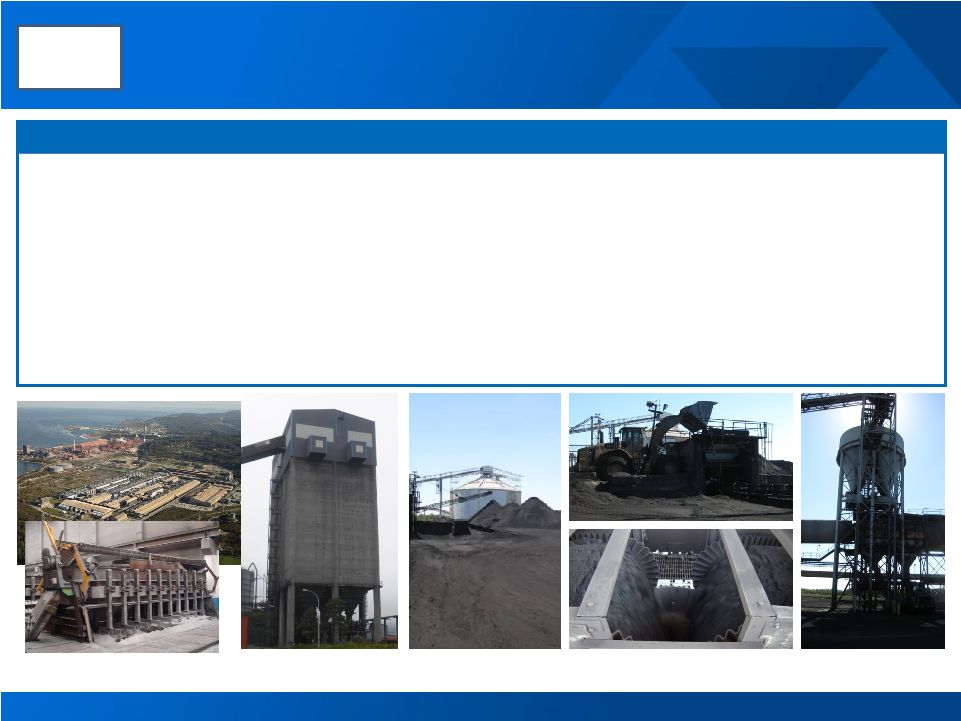 16
Sustainable advantage in an inflationary environment
•
Expanding internal calcining capacity
•
Lake Charles
has
increased
capacity
by 20% this year alone
•
Evaluating opportunities for backward
integration
•
Optimizing contract lengths and pricing
periods
Firm Actions to Gain Advantage in Raw Materials
•
Optimizing material specifications to
leverage multiple locations
•
Utilizing new and non-traditional sources
of raw materials
•
Global arbitrage
through
our
extensive,
world-wide logistics network
•
Trading and alliance partnerships
San Ciprian: leveraging our global operations
Complex blending at Lake Charles: super blends of up to 6 cokes
Alcoa
Logo |
 Perspective:
viewpoint of presentation
Differentiation:
Alcoa and what makes us special
Looking
Back:
sustainably
improving
our
cost
structure
Looking
Forward:
setting
rigorous
3-
to
5-year
goals
17
Alcoa
Logo |
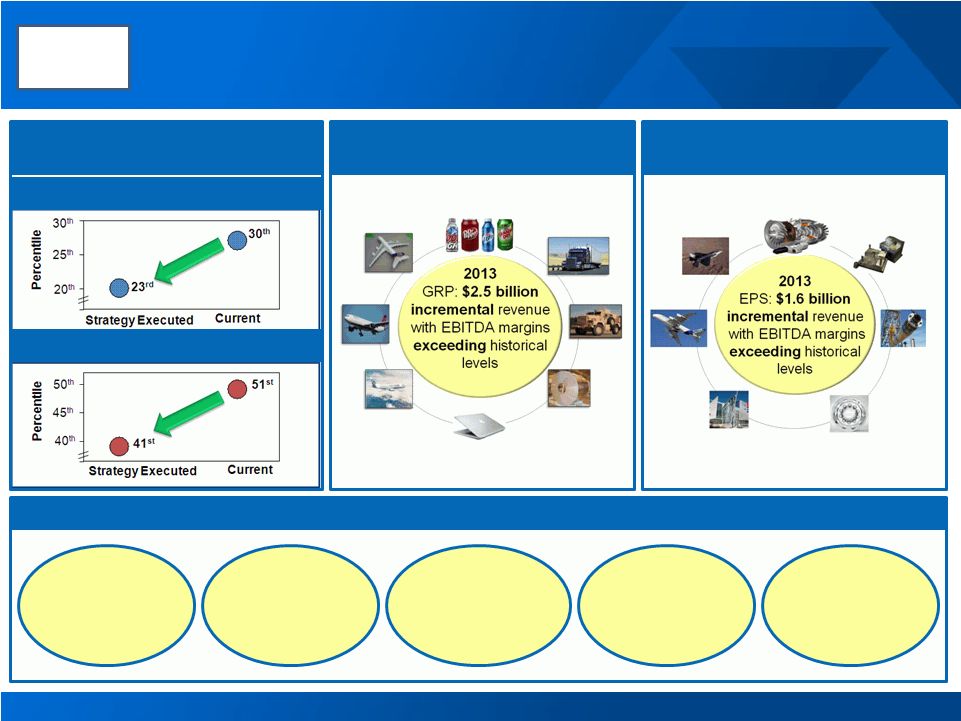 Accelerating shareholder value in 2011 and beyond
18
Upstream
2015 Cost Curve Changes
Refining Cost Curve Position
Smelting Cost Curve Position
Midstream
2013 Revenue Targets
Downstream
2013 Revenue Targets
2011 Financial Targets
Sustaining
Capex
$1.0B
Growth
Capex
$0.5B
Debt-to-
cap Ratio
30 to 35%
Positive
Free Cash
Flow
Ma’aden
Investment
$0.4B
Alcoa
Logo |
 Alcoa
Logo Alcoa Logo |