Attached files
| file | filename |
|---|---|
| 8-K - FORM 8K - MET PRO CORP | mpr8k20110601.htm |


The Private Securities Litigation Reform Act of 1995 provides a “safe harbor” for forward-
looking statements. Certain information included in this news release, and other materials
filed or to be filed with the Securities and Exchange Commission (as well as information
included in oral or other written statements made or to be made by the Company), contain
statements that are forward-looking. Such statements may relate to plans for future
expansion, business development activities, capital spending, financing, the effects of
regulation and competition, or anticipated sales or earnings results. Such information involves
risks and uncertainties that could significantly affect results in the future and, accordingly,
such results may differ from those expressed in any forward-looking statements made by or
on behalf of the Company. These risks and uncertainties include, but are not limited to, those
relating to, the cancellation or delay of purchase orders and shipments, product development
activities, goodwill impairment, computer systems implementation, dependence on existing
management, the continuation of effective cost and quality control measures, retention of
customers, global economic and market conditions, and changes in federal or state laws.
Safe Harbor Statement


Met-Pro Corporation
Founded: 1966 IPO: 1967
|
Stock price - 1/31/2010
|
$9.37
|
|
Stock price - 1/31/2011
|
$10.85
|
|
Stock price - 5/27/2011
|
$11.12
|
|
Common shares outstanding
|
14.7 Million
|
|
Market capitalization
|
$163.0 Million
|
|
52-week price range
|
$8.91 - $12.50
|
|
Avg. daily trading volume (3 mos.)
|
32,000
|
|
Dividend Increases
|
|
|
October 2010
|
+10%
|
|
October 2008
|
+9%
|
|
Yield
|
2.50%
|
|
Ownership
|
|
|
Institutional
|
59%
|
$15.8% increase
w/o dividend
w/o dividend

$89.9
6.1
9.0
$
0.42
10.0%
$88.9
36.3%
0.30
40.0%
$
$
$81.8
$80.1
6.5
$
4.4
$
$
34.2%
10.9%
37.7%
38.3%
¯
* Except per share amounts
Financial Highlights
For FYE 1/31
|
|
2011
|
2010
|
Change
|
|
New Order
Bookings |
|||
|
Net Sales
|
|||
|
Gross
Profit % |
|||
|
Operating
Income |
|||
|
Net Income
|
|||
|
Diluted EPS
|
Millions ($)*
|
|
1/31/2011
|
|
Cash
|
|
|
Total Assets
|
|
|
Total Debt
|
|
|
Shareholders’ Equity
|
|
Millions ($)
32.9
$ 108.0
3.5
84.5
$2.23
per share
per share
Debt to Equity
Ratio = 4.2%
Ratio = 4.2%
$
$
$
Strong Financial Condition
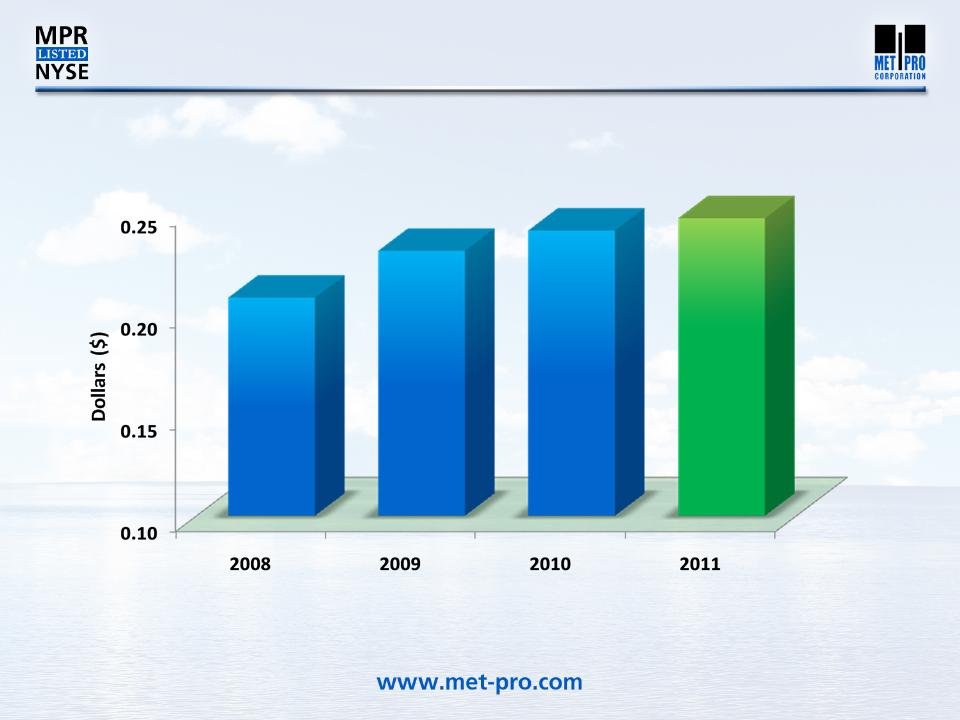
*Reflects 10% dividend increase effective October 2010
$.207
$.230
$.240
$.246*
36 Straight Years of Dividends
For FYE 1/31

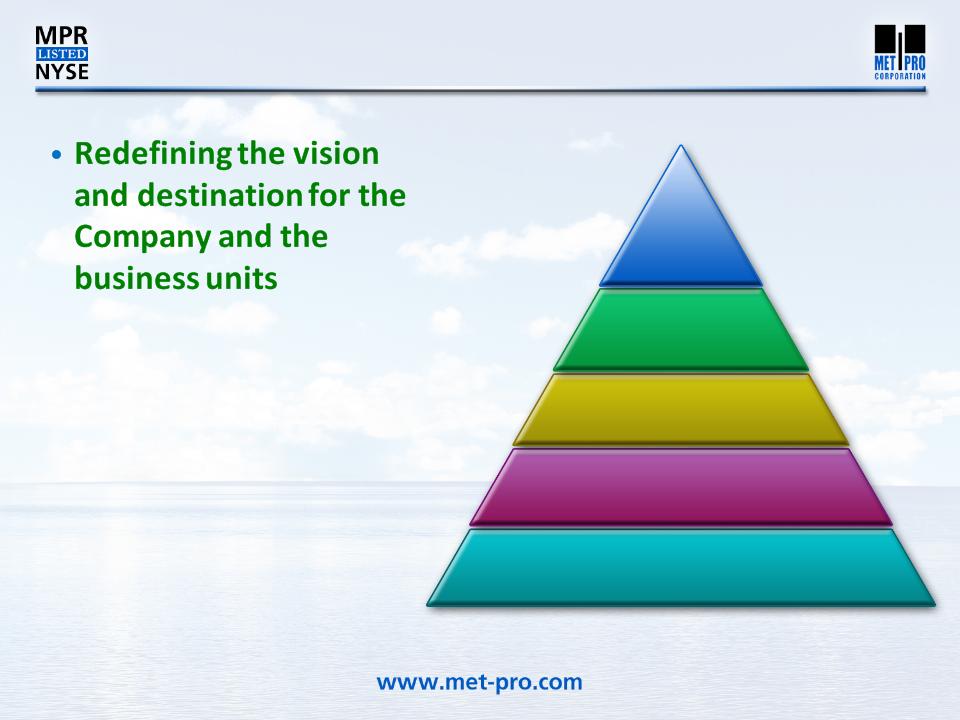
Our Strategic Process
• Identifying critical
success factors to
get us there
success factors to
get us there
• Integrating our work
processes and decision
making to drive us
to our destination
processes and decision
making to drive us
to our destination
Vision
& Mission
& Mission
Goals
Objectives
Methods
Tactics
Summary
