Attached files
| file | filename |
|---|---|
| 8-K - CURRENT REPORT - CHART INDUSTRIES INC | d8k.htm |
 Chart 2011
Investment Highlights Exhibit 99.1 |
 Disclosure
1 |
 Technology leader
- energy industry is the largest end-user of Chart’s products
Leading position -
#1 or #2 in all primary markets served
Global footprint –
operations on four continents with about 3,200 employees
Worldwide earnings –
approximately 60% of sales derived from outside the U.S.
Company Overview
Chart Industries is a leading provider of highly engineered cryogenic equipment
for the hydrocarbon, industrial gas, and biomedical markets.
2 |
 Energy & Chemicals (E&C) Segment Overview
Heat Exchanger
Cold Box
Production
2010 Sales by Product / Region
Highlights
Technology
leader
-
providing
heat
exchangers
and
cold
boxes
critical
to
LNG,
Olefin
petrochemicals,
natural
gas
processing
and
industrial
gas
markets
–
Separation,
liquefaction
and
purification
of
hydrocarbon
and
industrial
gases
Market
leader
–
leading
market
positions
worldwide
Manufacturing
leader
-
one
of
three
global
suppliers
of
mission-critical
LNG
and
LNG
liquefaction
equipment
Selected Products
3 |
 Distribution & Storage (D&S) Segment Overview
2010 Sales by Product / Region
Highlights
Balanced
customer
base
-
45%
of
segment
sales
derived
from
products
used
in
energy
applications
Strategic
footprint
–
manufacturing
located
near
growing
end
markets
and
lower-cost
countries
–
Positioned
to
capitalize
on
strong
expected
growth
in
Asia
and
Eastern
Europe
–
Continued
investment
in
key
global
manufacturing
facilities
Bulk
MicroBulk
Storage
Selected Products
Satellite LNG
Storage
4 |
 BioMedical Segment Overview
2010 Sales by Product / Region
Highlights
Strong
growth
-
increase
in
oxygen
respiratory
therapy
and
biomedical
research,
led
by
international
markets,
expected
Robust
end
markets
include:
–
Home
healthcare
and
nursing
homes
–
Hospitals
and
long-term
care
–
Biomedical
and
pharmaceutical
research
–
Animal
breeding
Portable Oxygen
Lab Storage
Stainless Steel Freezer
End-Use Consumption
Respiratory
Therapy
Systems
65%
Biological
Storage
Systems
35%
Selected Products
Americas
(Non-US)
5%
U.S.
34%
Europe
49%
Asia
11%
RoW
1%
5 |
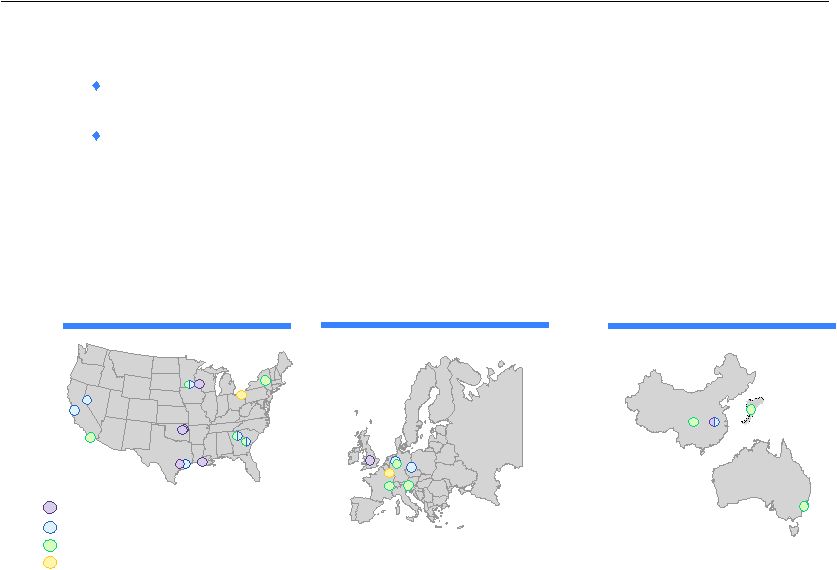 Global Manufacturing and Distribution Platform
Operating
leverage
provides
the
flexibility
to
expand
and
reduce
capacity
as
needed
with
minimal
capital
expenditures
Major manufacturing locations include:
China,
Changzhou
(D&S
and
E&C)
and
Chengdu
(BioMedical)
Czech
Republic,
Decin
(D&S)
Georgia,
Canton
and
Minnesota,
New
Prague
(D&S
and
BioMedical)
Wisconsin,
La
Crosse
and
Oklahoma,
Tulsa
(E&C)
Manufacturing facilities are strategically located in lower-cost countries
and near centers of demand
Corporate
Energy & Chemicals
Distribution & Storage
BioMedical
Asia-Pacific
North America
Europe
6 |
 Growth Opportunities
Energy & Chemicals
Significant exposure to expected global
energy demand growth, especially in
emerging economies
Small, mid and base load LNG global
projects
North American Natural Gas processing
(e.g., Shale fields and potential LNG export)
Distribution & Storage
Global relationships with major industrial gas
companies and distributors
World demand for industrial gases is forecast to
increase 8% annually to over $50 billion in 2014
(Source: Freedonia Group Inc. August 2010 “World Industrial
Gases”)
Supply equipment for the full LNG value chain,
including transportation equipment, terminal
storage, and vehicle tanks
BioMedical
Oxygen respiratory therapy growth with
aging demographics, especially in emerging
markets
Expansion of product portfolio to non-
delivery modalities with recent SeQual and
CFIC acquisitions
Increasing biological research expenditures
7 |
 Growing
industry
-
Natural
gas
demand
is
expected
to
continue
to
grow
at
a
pace
faster
than
coal
and
oil,
and
will
be
heavily
weighted
towards
emerging
economies,
which
is
expected
to
drive
demand
for
Chart’s products.
Natural
gas
expansion
-
U.S.
natural
gas
processing
is
rising
with
production
of
unconventional gas.
World
primary
demand
for
natural
gas
expands
on
average
by
1.4%
per
year
(2008-2035)
with
the
biggest
increases
in
the
Middle
East,
China
and
India.
(Source:
International
Energy
Agency
–
World
Energy
Outlook
2010,
New
Policies
Scenario)
LNG
growth
leader
-
“Global
gas
demand
is
likely
to
rise
by
25%,
while
the
use
of
LNG
is
set
to
surge
by
40%
by
2020.”
(Source:
ExxonMobil
quoted
at
CWC
World
LNG
Summit,
Barcelona
–
December
2009)
Global Natural Gas Production and Demand
8 |
 Natural
gas
penetration
–
Increasing
as
a
viable
energy
source
and
transportation
fuel
due
to
its
high
energy
density,
lower
costs,
cleaner
emissions
profile,
and
plentiful
supply
due
to
improved
drilling
technologies
(e.g.
shale
gas)
Broad
product
offering
-
Chart
provides
products
and
solutions
for
the
full
LNG
value
chain:
LNG
liquefiers,
transportation
equipment,
terminal
storage
equipment
and
vehicle
tanks
for
both
on-road
and
off-road
heavy
duty
vehicles
and
marine
applications
Shift
is
beginning
–
Starting
to
see
U.S.
fleets
convert
to
natural
gas
as
a
fuel.
Administration
appears
to
be
shifting
policy
towards
the
use
of
more
natural
gas
in
the
U.S.
Adoption
of
a
U.S.
energy
bill
could
significantly
boost
natural
gas
vehicle
adoption
and
drive
a
multi-year
build-out
of
LNG
production,
storage
and
distribution
infrastructure,
creating
additional
market
opportunities
LNG Value Chain Opportunities
9 |
 Dramatic
increase
in
imported
LNG
in
China
has
already
begun
and
is
expected
to
accelerate,
with
China
aggressively
investing
in
LNG
infrastructure,
including
LNG
transportation
and
storage
equipment
China’s
twelfth
5-year
plan
(2011
-
2015)
mandates
an
increase
of
gas
as
a
percentage
of
energy
consumption
from
less
than
4%
to
over
8%
(compared
to
over
20%
for
the
U.S.)
China
road
transit
authority
expects
to
add
2
million
new
gas
fueled
vehicles,
with
2/3
being
LNG
Lack
of
pipeline
infrastructure
in
China
requires
“virtual
pipeline”
with
LNG,
and
Chart
D&S
equipment
(e.g.,
storage,
transportation,
etc.)
can
fill
this
gap
China LNG Demand Outlook
10 |
 Acquisition Initiatives
Organic growth
Consolidation
Internal product
development
Bolt-on
New Platform
Internal market
development
Bolt-on
Existing
Products
New Products
Existing
Markets
New Markets
Organic
Inorganic
Emerging Markets
-
China/Asia LNG
Emerging Products
-
Natural Gas Production
-
LNG “Virtual Pipeline”
Acquisitions
-
Nine acquisitions since 2005
New Business Platform
-
Energy, Industrial Gas and/or other
segments
11 |
 Strong Track Record of Successful Execution
During
last
growth
cycle
Company
leveraged
its
flexible
manufacturing
platform
resulting
in
operating
income
growth
that
outpaced
sales
Flexible
cost
structure
and
good
execution
allowed
for
aggressive
response
to
economic
downturn
resulting
in
higher
operating
income
level
than
last
cycle
low
point
Improving
markets
and
good
performance
continue
to
drive
favorable
earnings
and
cash
generation,
resulting
in
strong
balance
sheet
with
significant
liquidity
Similar
or
higher
growth,
leveraged
by
acquisitions,
expected
to
occur
again
during
the
current
growth
cycle
Current
2011
sales
forecast
of
$740
-
$780
million
exceeds
prior
peak
sales
of
$753
million
achieved
in
2008
12 |
 Historical
Orders
and
Backlog
Orders
Backlog
13 |
 2011
Outlook Global markets continue their recovery during 2011 with the return of significant project
work in the E&C business and continued growth in LNG-related orders in the D&S
business
Recent contract awards in Saudi Arabia and Qatar totaling in excess of $110 million
increase our optimism about additional large project opportunities in the E&C business
First quarter results exceeded expectations with record orders leading the way. Based on
first quarter performance, current backlog and strong order trends, we raised our 2011
sales and earnings guidance with a sales forecast of $740 to $780 million and earnings of
$1.65 to $1.85 per diluted share
This guidance includes approximately $0.15 per diluted share for
anticipated restructuring
charges for the recently completed SeQual acquisition and trailing costs associated with
the shutdown of the Plainfield, Indiana facility acquired from Covidien. Therefore, our
adjusted EPS would be $1.80 to $2.00 per share
14 |
 Summary of Investment Highlights
Positioned for continued significant growth
–
Substantial organic growth expected, especially across Asian markets
–
New product development taking advantage of leading proprietary technology and designs
–
Strong track record of maximizing operating efficiencies and growth
–
Continued
inorganic
growth
initiatives
with
continued
strategic,
accretive
acquisition
activity
Flexible Manufacturing Platform
–
Ability to rapidly adjust production as demand fluctuates
–
Necessary
capacity
expansion
or
contraction
is
easily
attainable
without
significant
spend
Very strong balance sheet
–
Low net debt position, but will continue to optimize capital structure
–
Substantial
free
cash
flow
growth
and
liquidity,
especially
with
new
senior
credit
facility
Very stable business model
–
Attractive industry with long-term customer relationships
–
Solid platform with worldwide presence and leading market positions in all segments
Chart continues to represent a unique investment opportunity to capitalize on
global energy demand, growth in industrial gas use, and biomedical opportunities
15 |