Attached files
| file | filename |
|---|---|
| 8-K - MAY 2011 INVESTOR PRESENTATION 8-K - Frontier Communications Parent, Inc. | mayinvestpre8-k.htm |

Investor Presentation
May 2011

2
Safe Harbor Statement
Forward-Looking Language
This document contains forward-looking statements that are subject to risks and uncertainties that could cause actual results to differ materially from those expressed or implied in
the financial statements. Statements that are not historical facts are forward-looking statements made pursuant to the safe harbor provisions of the Private Securities Litigation
Reform Act of 1995. Words such as “believe,” “anticipate,” “expect” and similar expressions are intended to identify forward-looking statements. Forward-looking statements
(including oral representations) are only predictions or statements of current plans, which we review continuously. Forward-looking statements may differ from actual future results
due to, but not limited to, and our future results may be materially affected by, potential risks or uncertainties. You should understand that it is not possible to predict or identify all
potential risks or uncertainties. We note the following as a partial list: our ability to successfully integrate the operations of the acquired business into Frontier’s existing operations;
the risk that the growth opportunities and cost synergies from the transaction may not be fully realized or may take longer to realize than expected; our indemnity obligation to
Verizon for taxes which may be imposed upon them as a result of changes in ownership of our stock may discourage, delay or prevent a third party from acquiring control of us
during the two-year period ending July 2012 in a transaction that stockholders might consider favorable; the effects of increased expenses incurred due to activities related to the
transaction and the integration of the Acquired Business; our ability to maintain relationships with customers, employees or suppliers; the effects of greater than anticipated
competition requiring new pricing, marketing strategies or new product or service offerings and the risk that we will not respond on a timely or profitable basis; reductions in the
number of our access lines that cannot be offset by increases in High Speed Internet (HSI) subscribers and sales of other products and services; the effects of ongoing changes in
the regulation of the communications industry as a result of federal and state legislation and regulation, or changes in the enforcement or interpretation of such legislation and
regulation; the effects of any unfavorable outcome with respect to any current or future legal, governmental or regulatory proceedings, audits or disputes; the effects of changes in
the availability of federal and state universal funding to us and our competitors; the effects of competition from cable, wireless and other wireline carriers; our ability to adjust
successfully to changes in the communications industry and to implement strategies for growth; continued reductions in switched access revenues as a result of regulation,
competition or technology substitutions; our ability to effectively manage service quality in our territories and meet mandated service quality metrics; our ability to successfully
introduce new product offerings, including our ability to offer bundled service packages on terms that are both profitable to us and attractive to customers; changes in accounting
policies or practices adopted voluntarily or as required by generally accepted accounting principles or regulations; our ability to effectively manage our operations, operating
expenses and capital expenditures, and to repay, reduce or refinance our debt; the effects of changes in both general and local economic conditions on the markets that we serve,
which can affect demand for our products and services, customer purchasing decisions, collectability of revenues and required levels of capital expenditures related to new
construction of residences and businesses; the effects of customer bankruptcies and home foreclosures, which could result in difficulty in collection of revenues and loss of
customers; the effects of technological changes and competition on our capital expenditures and product and service offerings, including the lack of assurance that our network
improvements will be sufficient to meet or exceed the capabilities and quality of competing networks; the effects of increased medical, retiree and pension expenses and related
funding requirements; changes in income tax rates, tax laws, regulations or rulings, or federal or state tax assessments; the effects of state regulatory cash management practices
that could limit our ability to transfer cash among our subsidiaries or dividend funds up to the parent company; our ability to successfully renegotiate union contracts expiring in
2011 and thereafter; declines in the value of our pension plan assets, which would require us to make increased contributions to the pension plan in 2011 and beyond; adverse
changes in the credit markets or in the ratings given to our debt securities by nationally accredited ratings organizations, which could limit or restrict the availability, or increase the
cost, of financing; limitations on the amount of capital stock that we can issue to make acquisitions or to raise additional capital until July 2012; our ability to pay dividends on our
common shares, which may be affected by our cash flow from operations, amount of capital expenditures, debt service requirements, cash paid for income taxes and liquidity; and
the effects of severe weather events such as hurricanes, tornados, ice storms or other natural or man-made disasters. These and other uncertainties related to our business are
described in greater detail in our filings with the Securities and Exchange Commission, including our reports on Forms 10-K and 10-Q, and the foregoing information should be
read in conjunction with these filings. We undertake no obligation to publicly update or revise any forward-looking statements or to make any other forward-looking statement,
whether as a result of new information, future events or otherwise unless required to do so by securities laws.

3
Non-GAAP Financial Measures
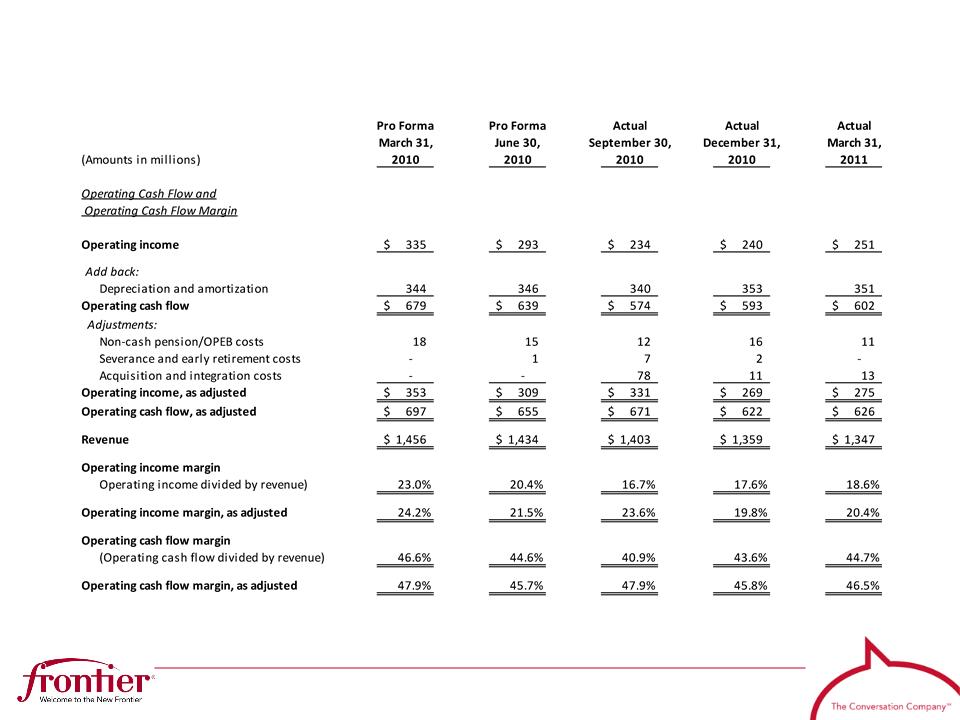
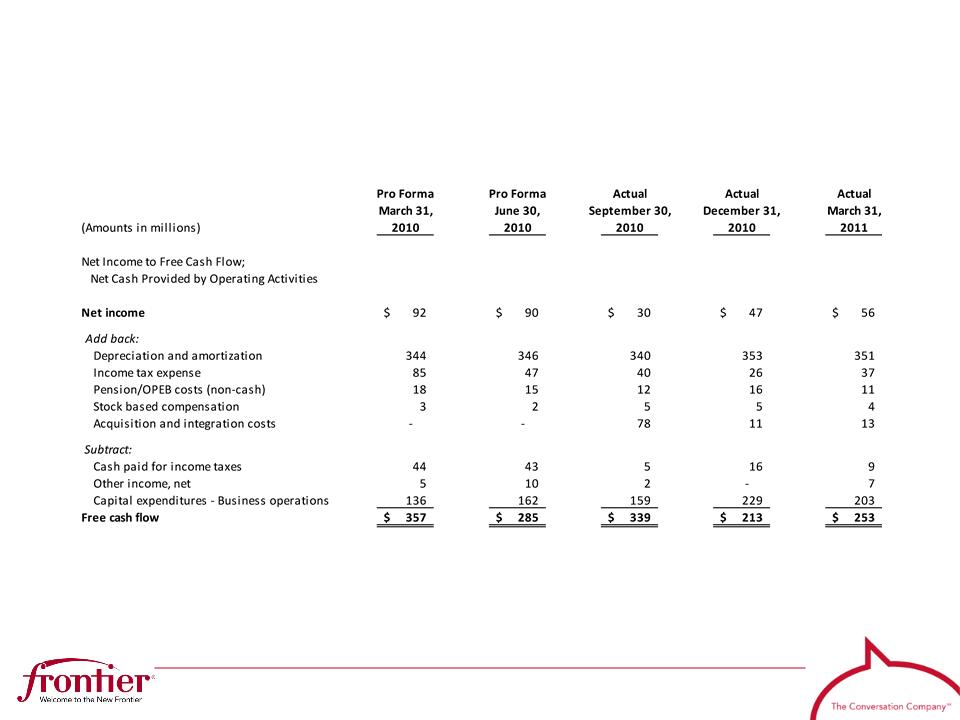
The Company uses certain non-GAAP financial measures in evaluating its performance. These include free cash flow, EBITDA or “operating cash flow”, which
we define as operating income plus depreciation and amortization (“EBITDA”), and Adjusted EBITDA; a reconciliation of the differences between EBITDA and
free cash flow and the most comparable financial measures calculated and presented in accordance with GAAP is included in the appendix. The non-GAAP
financial measures are by definition not measures of financial performance under generally accepted accounting principles and are not alternatives to operating
income or net income reflected in the statement of operations or to cash flow as reflected in the statement of cash flows and are not necessarily indicative of
cash available to fund all cash flow needs. The non-GAAP financial measures used by the Company may not be comparable to similarly titled measures of
other companies.
The Company believes that the presentation of non-GAAP financial measures provides useful information to investors regarding the Company’s financial
condition and results of operations because these measures, when used in conjunction with related GAAP financial measures, (i) together provide a more
comprehensive view of the Company’s core operations and ability to generate cash flow, (ii) provide investors with the financial analytical framework upon
which management bases financial, operational, compensation and planning decisions and (iii) presents measurements that investors and rating agencies
have indicated to management are useful to them in assessing the Company and its results of operations. Management uses these non-GAAP financial
measures to plan and measure the performance of its core operations, and its divisions measure performance and report to management based upon these
measures. In addition, the Company believes that free cash flow and EBITDA, as the Company defines them, can assist in comparing performance from period
to period, without taking into account factors affecting cash flow reflected in the statement of cash flows, including changes in working capital and the timing of
purchases and payments.
The Company has shown adjustments to its financial presentations to exclude certain costs because investors have indicated to management that such
adjustments are useful to them in assessing the Company and its results of operations. These adjustments are detailed in the Appendix for the reconciliation
of free cash flow and operating cash flow.
adjustments are useful to them in assessing the Company and its results of operations. These adjustments are detailed in the Appendix for the reconciliation
of free cash flow and operating cash flow.
Management uses these non-GAAP financial measures to (i) assist in analyzing the Company’s underlying financial performance from period to period, (ii)
evaluate the financial performance of its business units, (iii) analyze and evaluate strategic and operational decisions, (iv) establish criteria for compensation
decisions, and (v) assist management in understanding the Company’s ability to generate cash flow and, as a result, to plan for future capital and operational
decisions. Management uses these non-GAAP financial measures in conjunction with related GAAP financial measures. These non-GAAP financial measures
have certain shortcomings. In particular, free cash flow does not represent the residual cash flow available for discretionary expenditures, since items such as
debt repayments and dividends are not deducted in determining such measure. EBITDA has similar shortcomings as interest, income taxes, capital
expenditures, debt repayments and dividends are not deducted in determining this measure. Management compensates for the shortcomings of these
measures by utilizing them in conjunction with their comparable GAAP financial measures. The information in this document should be read in conjunction with
the financial statements and footnotes contained in our documents filed with the U.S. Securities and Exchange Commission.
4
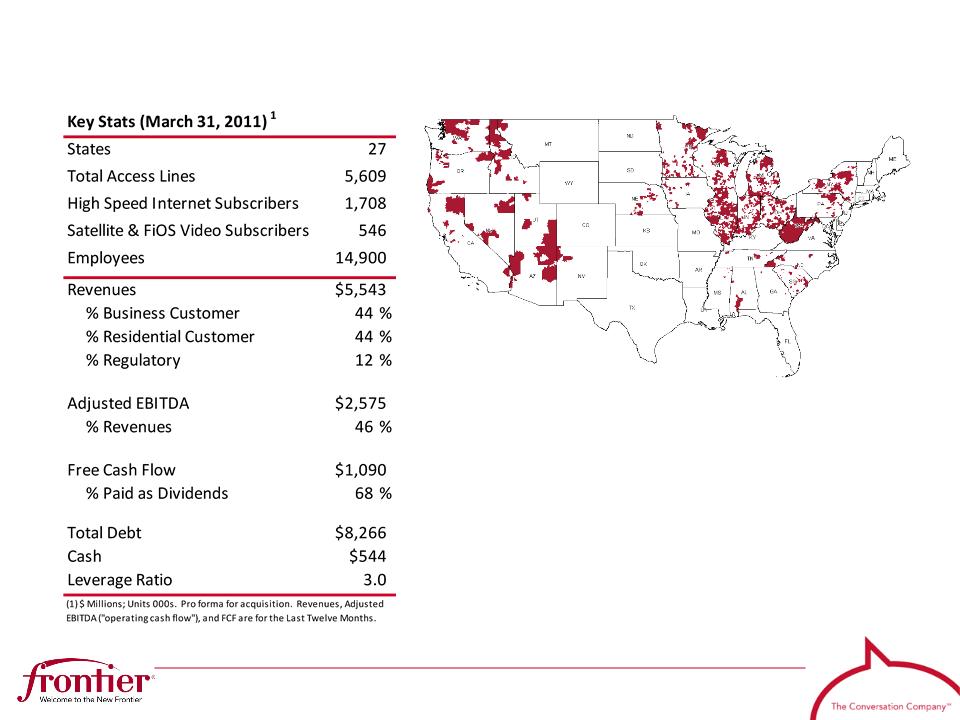
Frontier Introduction
• Frontier Communications (NYSE: FTR) was
founded in 1935 as Citizens Utilities and
became a pure-play telecom network
operator in 2004
founded in 1935 as Citizens Utilities and
became a pure-play telecom network
operator in 2004
• Frontier is the largest communications
company focused on rural America
company focused on rural America
• A transformational acquisition of properties
from Verizon tripled Frontier’s business
size on July 1, 2010
from Verizon tripled Frontier’s business
size on July 1, 2010

5
Investment Summary
|
Opportunity
|
|
• Manage the acquired properties with Frontier’s proven Local
Engagement Model and innovative marketing • Bring margins up to Legacy levels
• Harness economics of scale from business that is 3x its
former size |
|
|
|
|
|
Markets
|
|
• Expand broadband availability in new markets towards
Legacy Frontier’s 91% • Rural profile, less competition, less regulatory reform
exposure • Business & Broadband are 64% of customer revenues
|
|
|
|
|
|
Returns
|
|
• Revenue upside from increased product penetration
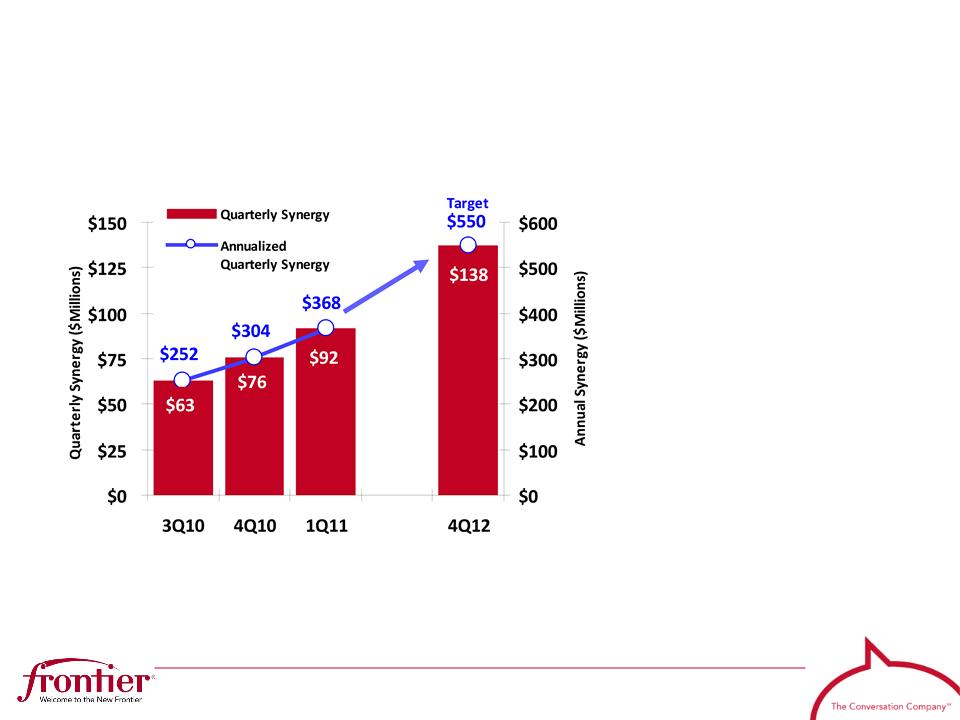
• $550 million operating expense synergy target by 2013
• Consistent execution, solid free cash flow, stable dividend
|
|
|
|
|
|
Credit
Quality |
|
• Significantly deleveraged on July 1, 2010
• Target leverage of 2.5x or below
• Well structured maturity schedule
|
6
Frontier Local Engagement
Local Area Manager
|
Residential
|
|
• High Speed Internet (DSL
& FTTP) • Voice
• Video (Satellite & FiOS)
• Wireless Data (WiFi mesh)
• Online backup
• 24/7 U.S. Tech Support
|
|
Business
|
|
• Managed IP VPN
• VoIP systems
• High-Capacity fiber data
• Metro Ethernet
• Wireless backhaul
• Managed router
|
• Over 120 Local Area Managers at the community level respond to unique
customer needs in each market across Frontier’s 27 states
customer needs in each market across Frontier’s 27 states
• Employees live in the markets they serve, and put the customer first
• Innovative marketing, 2-hour appointment windows, exceptional service
levels
levels
7
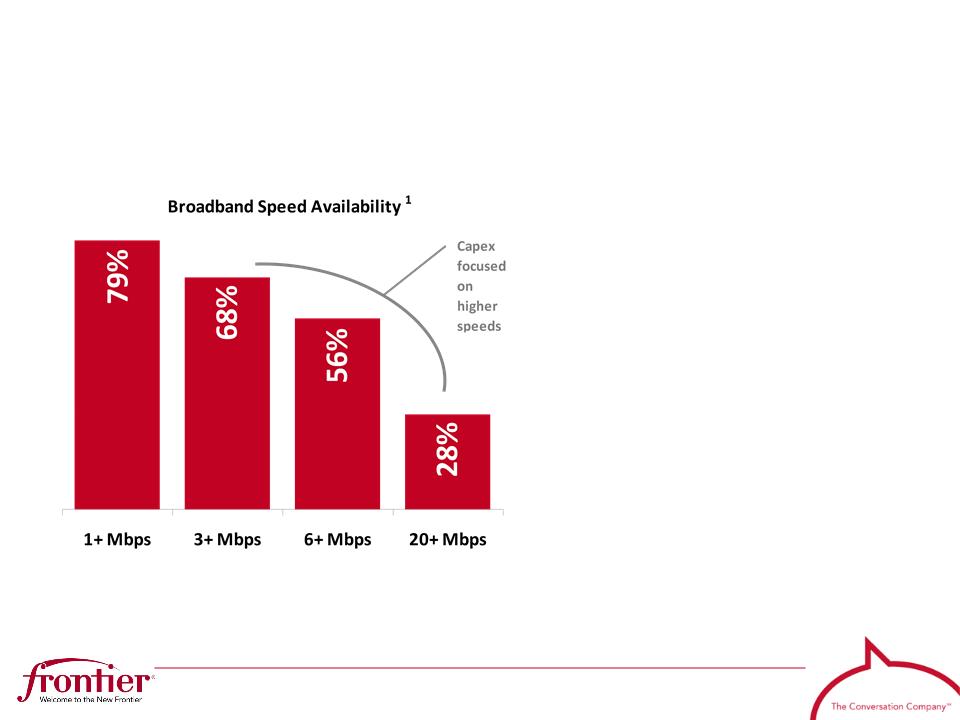
Robust Local Network
● 2,700 Central offices
● 2,700 Central offices
● National high-capacity
fiber backbone
fiber backbone
● National high-capacity
fiber backbone
fiber backbone
● Deploying ROADM in the
middle mile
middle mile
● Deploying ROADM in the
middle mile
middle mile
● Broadband expansion to
drive penetration
drive penetration
● Broadband expansion to
drive penetration
drive penetration
● FCC Commitments:
● FCC Commitments:
- 3Mbps to 85% by 12/31/13
- 3Mbps to 85% by 12/31/13
- 4Mbps to 85% by 12/31/15
- 4Mbps to 85% by 12/31/15
Notes: (1) Downlink product availability as of 3/31/11; loop length availability is higher in each tier.
8
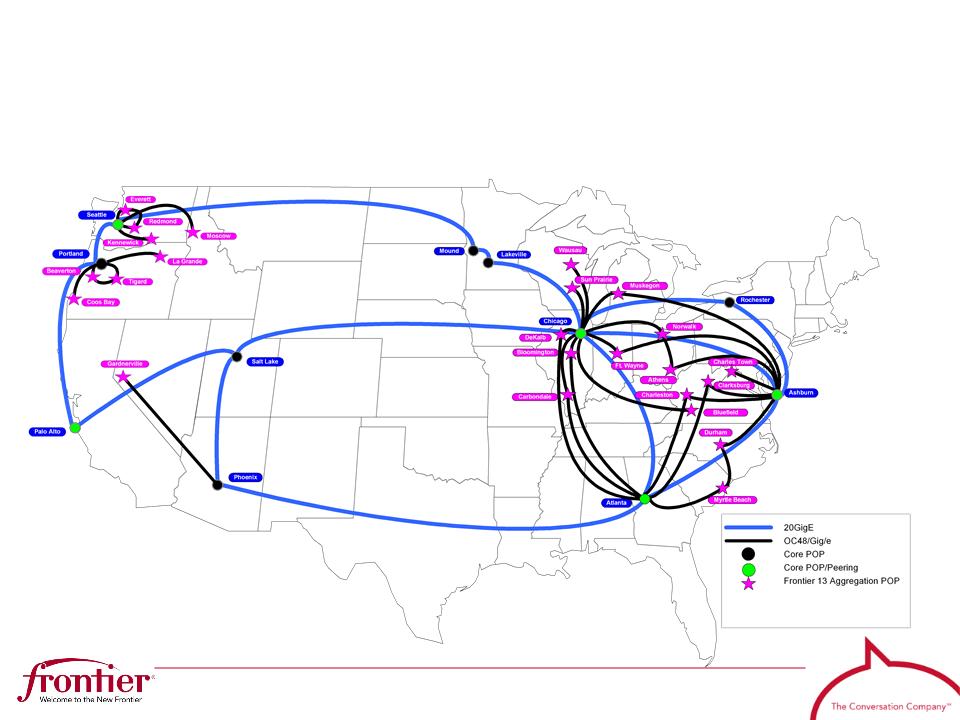
High-Capacity National Backbone
• Frontier’s fiber network interconnects its 27-state footprint
9
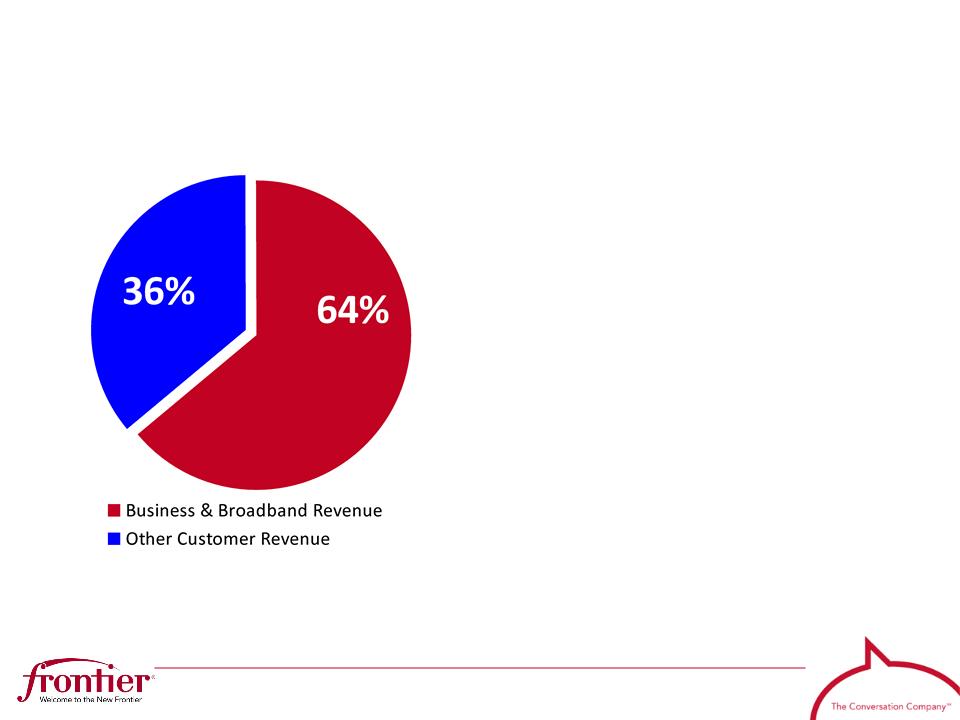
Attractive Revenue Base
● Frontier generates 64% of
its customer revenue from
Business and Broadband
sources
its customer revenue from
Business and Broadband
sources
● Frontier generates 64% of
its customer revenue from
Business and Broadband
sources
its customer revenue from
Business and Broadband
sources
● Our business capabilities
are very broad and include:
are very broad and include:
● Our business capabilities
are very broad and include:
are very broad and include:
- Advanced IP switching
- Advanced IP switching
- VoIP systems
- VoIP systems
- High-capacity fiber data systems
- High-capacity fiber data systems
- Wireless cell site backhaul
- Wireless cell site backhaul
- Ethernet
- Ethernet
For the quarter ended 3/31/11
10
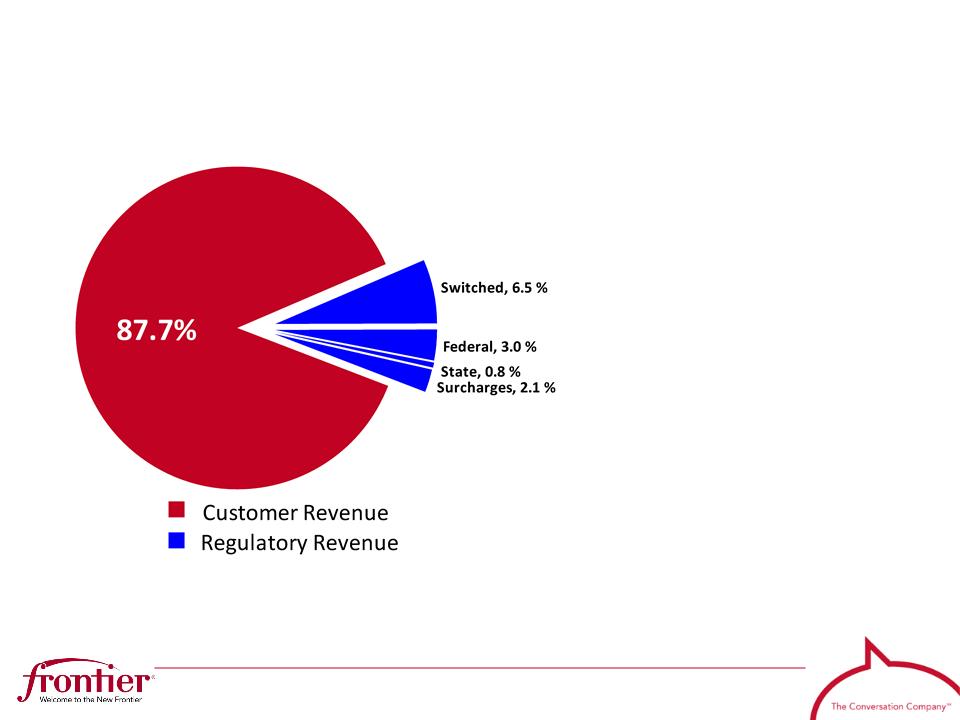
Minimizing Regulatory Risk
● The acquired
properties reduced
Frontier’s Regulatory
Revenue exposure
from 17.1% at 1Q10 to
12.3% at 1Q11, or
10.3% excluding
surcharges
properties reduced
Frontier’s Regulatory
Revenue exposure
from 17.1% at 1Q10 to
12.3% at 1Q11, or
10.3% excluding
surcharges
● The acquired
properties reduced
Frontier’s Regulatory
Revenue exposure
from 17.1% at 1Q10 to
12.3% at 1Q11, or
10.3% excluding
surcharges
properties reduced
Frontier’s Regulatory
Revenue exposure
from 17.1% at 1Q10 to
12.3% at 1Q11, or
10.3% excluding
surcharges
● We continue to
replace this uncertain
revenue stream with
Customer Revenue
replace this uncertain
revenue stream with
Customer Revenue
● We continue to
replace this uncertain
revenue stream with
Customer Revenue
replace this uncertain
revenue stream with
Customer Revenue
For the quarter ended 3/31/11
Note: Numbers may not sum due to rounding
11
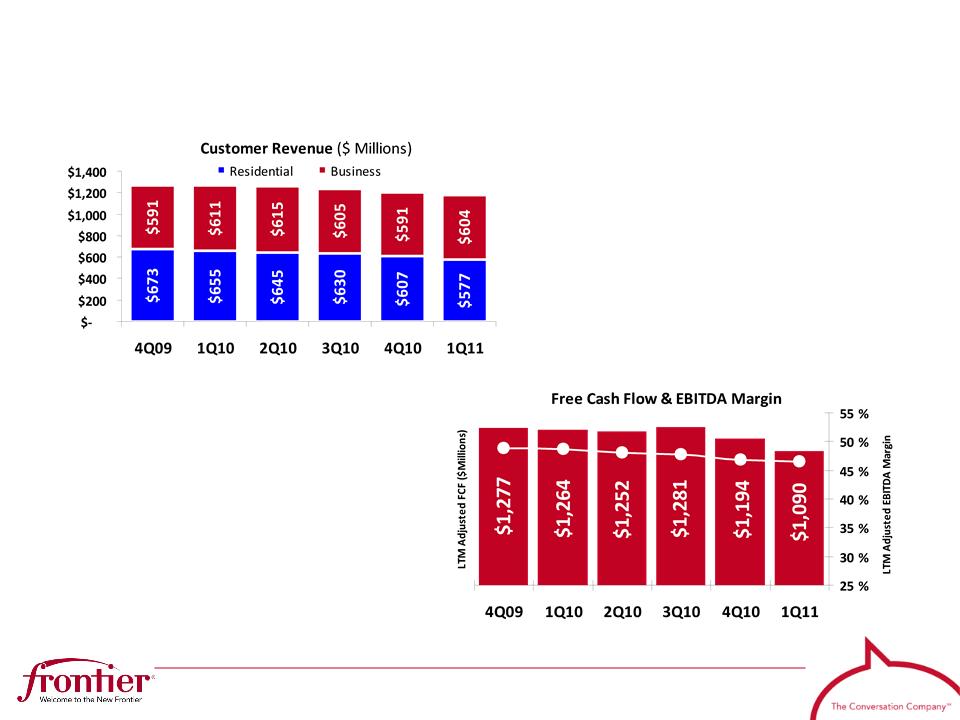
Consistent Execution
Stability of Revenues
ü Driving recurring customer revenues
ü Delivering reliable, quality products
and services at a good price
and services at a good price
ü Reducing churn with bundles
ü Maintaining strong
Business/Enterprise presence
Business/Enterprise presence
Notes: Pro forma for all periods prior to 3Q10. Customer revenue is defined as total revenue less access services revenue. Access
services include switched network access and subsidies. Please see Appendix for Non-GAAP Reconciliations.
services include switched network access and subsidies. Please see Appendix for Non-GAAP Reconciliations.
Stability of Cash Flows
ü Focus on expense reduction;
competitively fit and flexible
competitively fit and flexible
ü Capex reflecting network expansion
3Q10 through 2013
3Q10 through 2013
ü Margin benefit from synergy targets
ü High conversion rate of EBITDA into
free cash flow (FCF)
free cash flow (FCF)
12
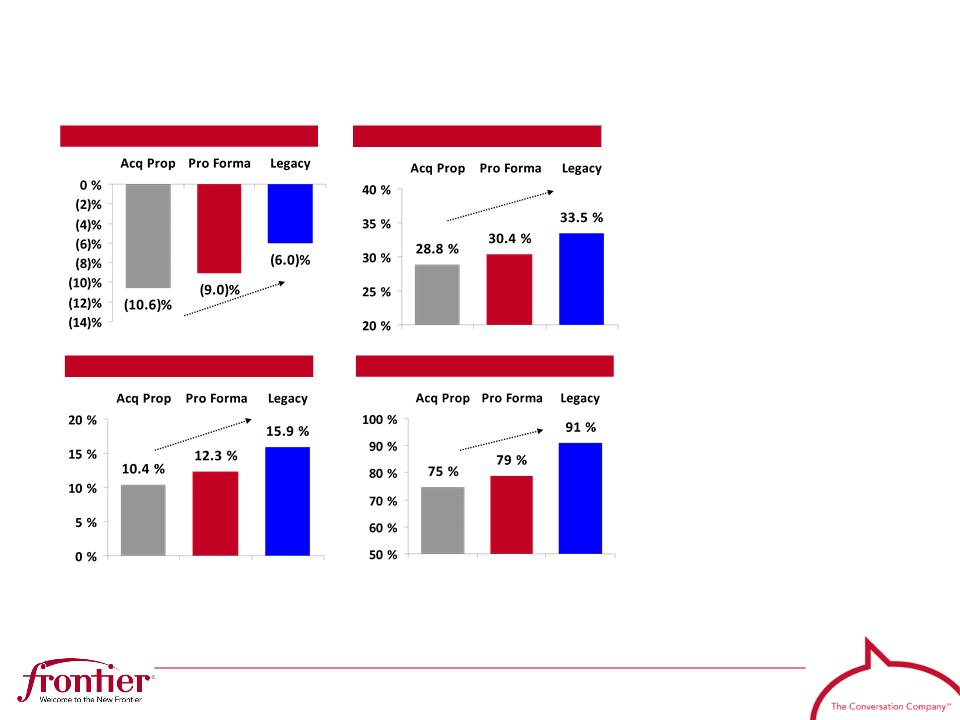
Revenue Opportunity
Satellite TV Penetration
Access Line Decline
HSI Penetration
Note: As of the quarter ended 3/31/11; percentage changes are year-over-year. HSI Penetration is percentage of
total access lines. Satellite TV Penetration is percentage of Residential access lines.
total access lines. Satellite TV Penetration is percentage of Residential access lines.
Note: As of the quarter ended 3/31/11; percentage changes are year-over-year. HSI Penetration is percentage of
total access lines. Satellite TV Penetration is percentage of Residential access lines.
total access lines. Satellite TV Penetration is percentage of Residential access lines.
Broadband Availability
● Our goal is to
migrate the
acquired properties
to Frontier’s
performance
metrics
migrate the
acquired properties
to Frontier’s
performance
metrics
● Our goal is to
migrate the
acquired properties
to Frontier’s
performance
metrics
migrate the
acquired properties
to Frontier’s
performance
metrics
● Key drivers:
● Key drivers:
- 25% expansion of
broadband homes
broadband homes
- 25% expansion of
broadband homes
broadband homes
- Local Engagement
- Local Engagement
13
Cost Synergy Overview
● Significant savings
from reducing cash
operating expenses
from reducing cash
operating expenses
● Significant savings
from reducing cash
operating expenses
from reducing cash
operating expenses
● Numerous projects
underway; synergy
estimates include:
underway; synergy
estimates include:
● Numerous projects
underway; synergy
estimates include:
underway; synergy
estimates include:
- Network savings
- Network savings
- Outside
contractors
contractors
- Outside
contractors
contractors
- IT savings from
conversion
conversion
- IT savings from
conversion
conversion
- Real estate
savings
savings
- Real estate
savings
savings
- Operations
- Operations
14
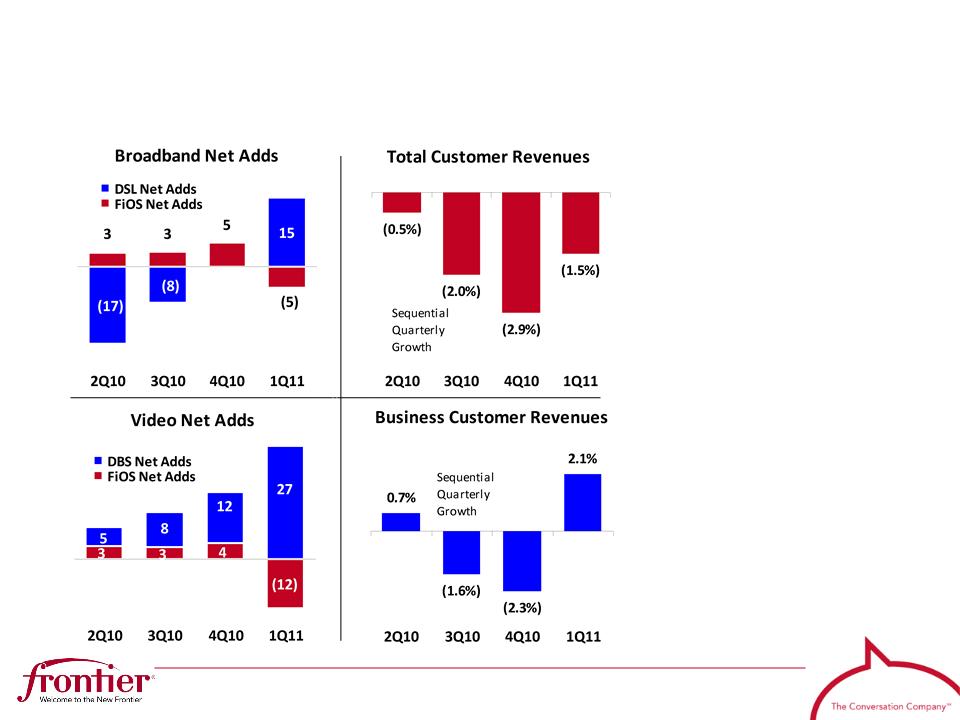
Quarterly Update: 1Q11
● Metrics turning on
strong HSI and
video bundles
strong HSI and
video bundles
● Metrics turning on
strong HSI and
video bundles
strong HSI and
video bundles
● Revenue trend
improving
improving
● Revenue trend
improving
improving
● Total cash opex
down $16 million
sequentially
down $16 million
sequentially
● Total cash opex
down $16 million
sequentially
down $16 million
sequentially
● FCF expanded
sequentially
sequentially
● FCF expanded
sequentially
sequentially
Notes: For more detail, please reference our Investor Update dated May 5, 2011 .

15
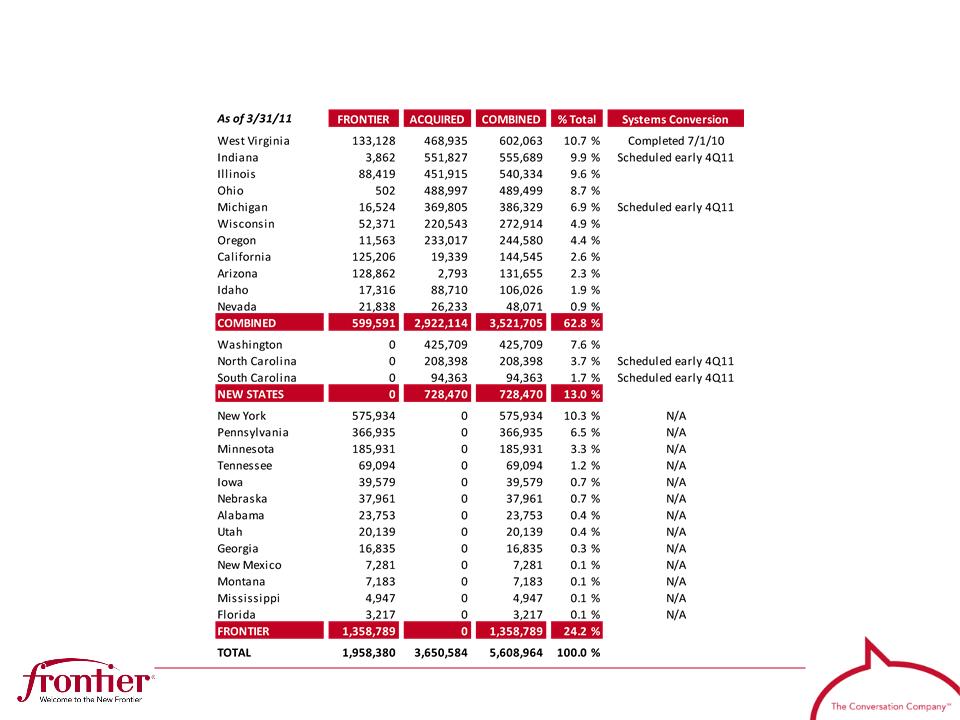
Systems Integration Plan
|
West Virginia
|
|
Frontier 13
|
|
• Successful conversion despite a
firm July 1 deadline • Billing cycles kept within days of
prior scheduled dates, and all systems functional out of the gate • Backlog managed downward
with “bubble workforce” and current levels within normal range |
|
• System mapping and analysis in
process • Systems are identical across all
13 states; processes on the first conversions will be replicated • First 4 states (MI, IN, NC, SC)
targeted early 4Q11; remaining states in two groups by end of 2012 |
Frontier converted West Virginia, which utilized BellAtlantic
systems, on July 1, 2010
systems, on July 1, 2010
Frontier converted West Virginia, which utilized BellAtlantic
systems, on July 1, 2010
systems, on July 1, 2010
The remaining 13 states of the acquired properties (detailed in the
appendix) will be converted off Verizon (GTE) systems onto
existing Frontier systems by the end of 2012
appendix) will be converted off Verizon (GTE) systems onto
existing Frontier systems by the end of 2012
The remaining 13 states of the acquired properties (detailed in the
appendix) will be converted off Verizon (GTE) systems onto
existing Frontier systems by the end of 2012
appendix) will be converted off Verizon (GTE) systems onto
existing Frontier systems by the end of 2012
16
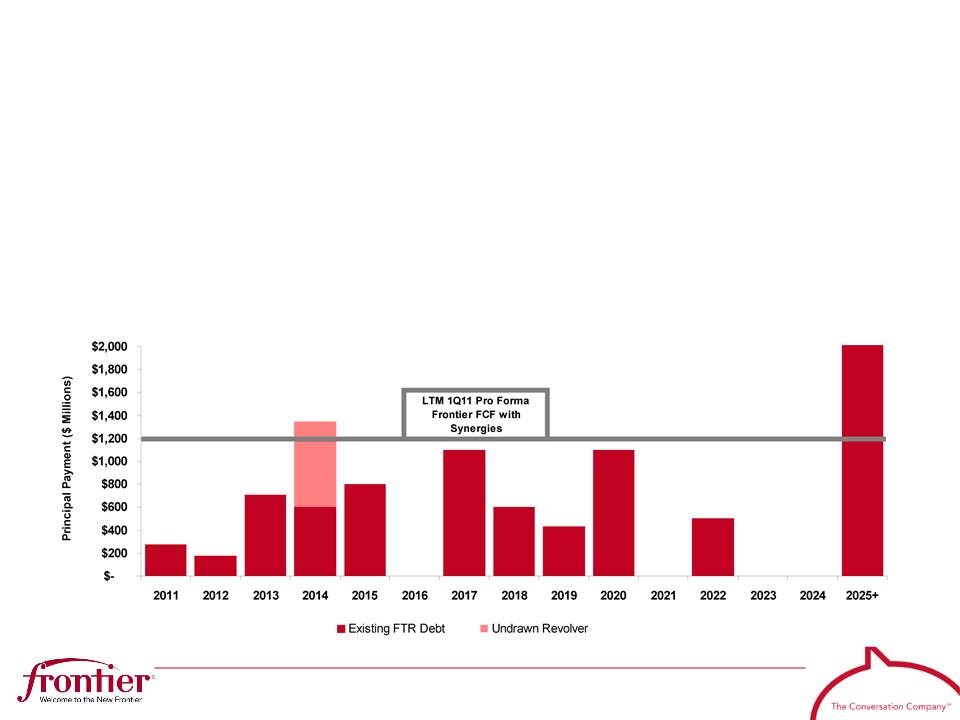
Financing Overview
• Deleveraged from 4.0x (6/30/10) to 3.0x (3/31/11)
• Strong $1.0 billion liquidity with an undrawn $750M R/C and $250M minimum
cash-on-hand objective
cash-on-hand objective
• Maturity schedule is well balanced and below run rate FCF levels
• Free cash flow levels match well with scheduled debt amortization.
17
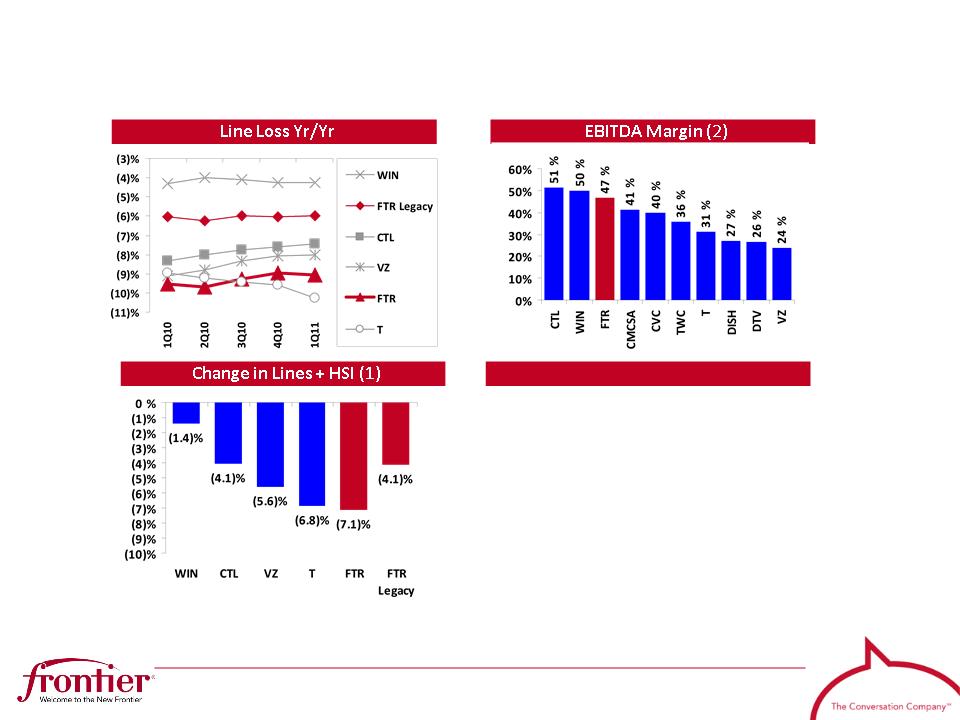
Industry Comparisons
Notes: Data for the 3-months ended 3/31/11. (1) Represents the yr/yr change in the combined ending base of access lines and HSI subscribers
(2) Adjusted EBITDA; excludes wireless; Cable is network operations only.
(2) Adjusted EBITDA; excludes wireless; Cable is network operations only.
Source: SEC filings; Wall Street research; Frontier.
• Results, as expected, weakened
from the Acquired Properties
from the Acquired Properties
• Results, as expected, weakened
from the Acquired Properties
from the Acquired Properties
• Operational metrics have begun
to turn around
to turn around
• Operational metrics have begun
to turn around
to turn around
• Focusing on: i) implementing
local engagement; ii) selling &
retaining customers; iii) getting
the expenses out; and iv)
building and improving the
network
local engagement; ii) selling &
retaining customers; iii) getting
the expenses out; and iv)
building and improving the
network
• Focusing on: i) implementing
local engagement; ii) selling &
retaining customers; iii) getting
the expenses out; and iv)
building and improving the
network
local engagement; ii) selling &
retaining customers; iii) getting
the expenses out; and iv)
building and improving the
network
FTR

18
Doing What We Say…
|
Goal
|
Status
|
|
Regulatory approval with appropriate conditions
|
|
|
Completion of financing within expected cost
|
|
|
Distribution of shares with minimal market disruption
|
|
|
Completion of West Virginia systems conversion
|
|
|
Continued delivery of solid Legacy Frontier results
|
|
|
Customer metric improvement and synergy
realization of acquired properties
|
In Process
|
|
Conversion of Frontier 13 systems to Legacy
|
In Process
|

19
Appendix
20
Access Lines by State
Note: Numbers may not sum due to rounding
21
Reconciliation of Non-GAAP Financial Measures
Notes: This is a summary table of our Form 8-K filed 5/5/11; please refer to our SEC filings for additional information. Numbers
may not sum due to rounding.
may not sum due to rounding.
Notes: This is a summary table of our Form 8-K filed 5/5/11; please refer to our SEC filings for additional information. Numbers
may not sum due to rounding.
may not sum due to rounding.
22
Reconciliation of Non-GAAP Financial Measures
Notes: This is a summary table of our Form 8-K filed 5/5/11; please refer to our SEC filings for additional information. Numbers
may not sum due to rounding.
may not sum due to rounding.
Notes: This is a summary table of our Form 8-K filed 5/5/11; please refer to our SEC filings for additional information. Numbers
may not sum due to rounding.
may not sum due to rounding.

23
Frontier Values
• Put the customer first
• Treat one another with respect
• Keep our commitments; be accountable
• Be ethical in all of our dealings
• Be innovative; Take the initiative
• Be team players
• Be active in our communities
• Do it right the first time
• Continuously improve
• Use resources wisely
• Use Frontier products and services
• Have a positive attitude

Frontier Communications Corp.
(NYSE: FTR)
Investor Relations
Investor Relations
Frontier Communications Corp.
Frontier Communications Corp.
3 High Ridge Park
3 High Ridge Park
Stamford, CT 06905
Stamford, CT 06905
203.614.4606
203.614.4606
IR@FTR.com
IR@FTR.com