Attached files
| file | filename |
|---|---|
| 8-K - FORM 8-K - SURMODICS INC | c64857e8vk.htm |
Exhibit 99.1

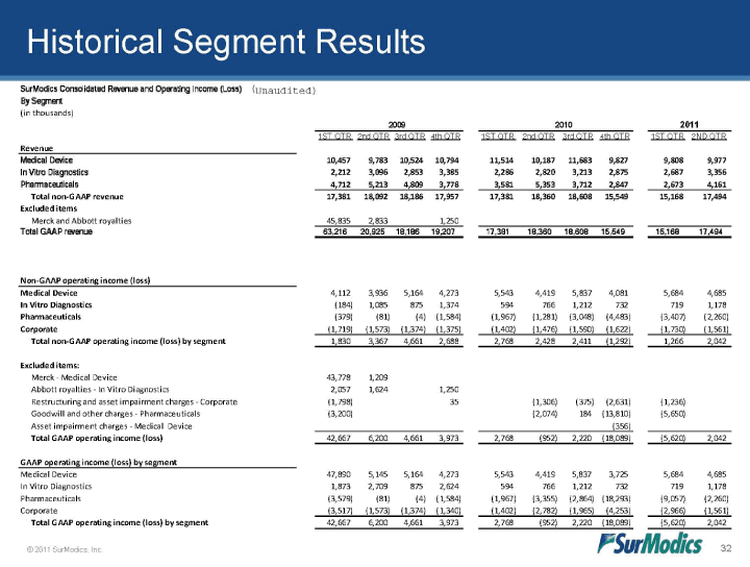
| 2011 SurModics, Inc. 32 Historical Segment Results SurModics Consolidated Revenue and Operating Income (Loss) By Segment (in thousands) 2009 2010 2011 1ST QTR 2nd QTR 3rd QTR 4th QTR 1ST QTR 2nd QTR 3rd QTR 4th QTR 1ST QTR 2ND QTR Revenue Medical Device 10,457 9,783 10,524 10,794 11,514 10,187 11,683 9,827 9,808 9,977 In Vitro Diagnostics 2,212 3,096 2,853 3,385 2,286 2,820 3,213 2,875 2,687 3,356 Pharmaceuticals 4,712 5,213 4,809 3,778 3,581 5,353 3,712 2,847 2,673 4,161 Total non-GAAP revenue 17,381 18,092 18,186 17,957 17,381 18,360 18,608 15,549 15,168 17,494 Excluded items Merck and Abbott royalties 45,835 2,833 1,250 Total GAAP revenue 63,216 20,925 18,186 19,207 17,381 18,360 18,608 15,549 15,168 17,494 Non-GAAP operating income (loss) Medical Device 4,112 3,936 5,164 4,273 5,543 4,419 5,837 4,081 5,684 4,685 In Vitro Diagnostics (184) 1,085 875 1,374 594 766 1,212 732 719 1,178 Pharmaceuticals (379) (81) (4) (1,584) (1,967) (1,281) (3,048) (4,483) (3,407) (2,260) Corporate (1,719) (1,573) (1,374) (1,375) (1,402) (1,476) (1,590) (1,622) (1,730) (1,561) Total non-GAAP operating income (loss) by segment 1,830 3,367 4,661 2,688 2,768 2,428 2,411 (1,292) 1,266 2,042 Excluded items: Merck - Medical Device 43,778 1,209 Abbott royalties - In Vitro Diagnostics 2,057 1,624 1,250 Restructuring and asset impairment charges - Corporate (1,798) 35 (1,306) (375) (2,631) (1,236) Goodwill and other charges - Pharmaceuticals (3,200) (2,074) 184 (13,810) (5,650) Asset impairment charges - Medical Device (356) Total GAAP operating income (loss) 42,667 6,200 4,661 3,973 2,768 (952) 2,220 (18,089) (5,620) 2,042 GAAP operating income (loss) by segment Medical Device 47,890 5,145 5,164 4,273 5,543 4,419 5,837 3,725 5,684 4,685 In Vitro Diagnostics 1,873 2 ,709 875 2,624 594 766 1,212 732 719 1,178 Pharmaceuticals (3,579) (81) (4) (1,584) (1,967) (3,355) (2,864) (18,293) (9,057) (2,260) Corporate (3,517) (1,573) (1,374) (1,340) (1,402) (2,782) (1,965) (4,253) (2,966) (1,561) Total GAAP operating income (loss) by segment 42,667 6,200 4,661 3,973 2,768 (952) 2,220 (18,089) (5,620) 2,042 |
