Attached files
| file | filename |
|---|---|
| 8-K - FORM 8-K - CAMCO FINANCIAL CORP | c17905e8vk.htm |
Exhibit 99.1

| 1 Camco Financial Corporation Annual Meeting of StockholdersMay 24, 2011 |
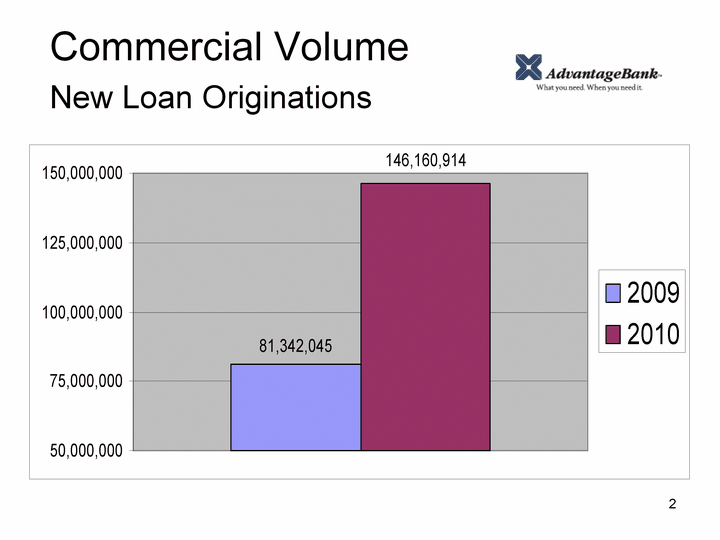
| 2 Commercial Volume New Loan Originations |

| 3 Loan Sales / Gain of Sale |

| 4 Deposit Balances |

| 5 Classified Assets (Substandard, Doubtful, Loss) 12/09 $85,000,00006/10 $76,689,37312/10 $64,087,99403/11 $61,176,076 |
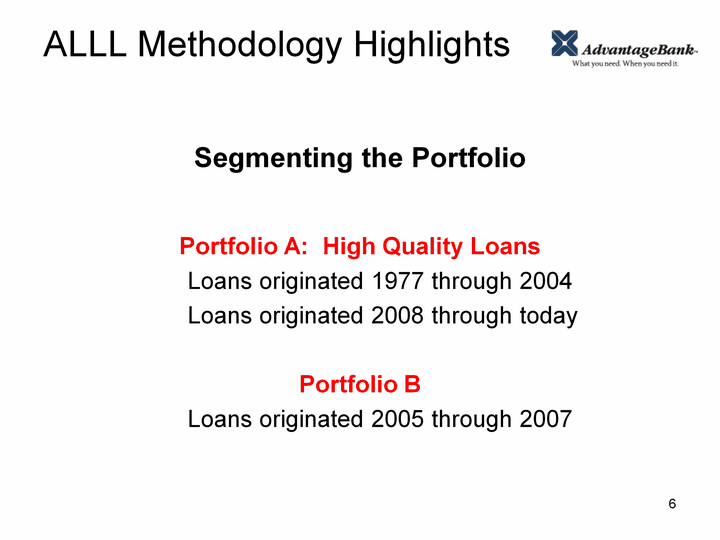
| 6 ALLL Methodology Highlights Segmenting the PortfolioPortfolio A: High Quality Loans Loans originated 1977 through 2004 Loans originated 2008 through todayPortfolio B Loans originated 2005 through 2007 |
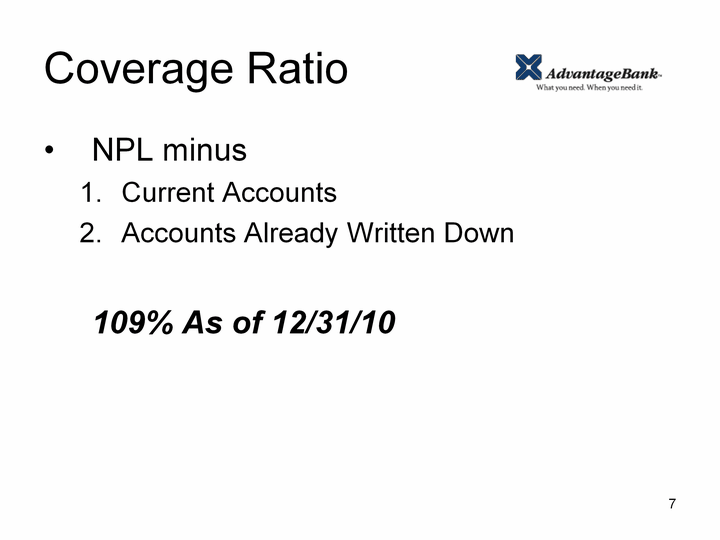
| 7 Coverage Ratio NPL minus Current AccountsAccounts Already Written Down 109% As of 12/31/10 |

| 8 Delinquency 60+ 06/09 $50,886,000 12/09 $32,296,00012/10 $27,815,000 |

| 9 Allowance for Loan Losses to Total Loans 12/09 2.38%12/10 2.46%03/11 2.61% |

| 10 Net Interest Margin Net Interest Margin |
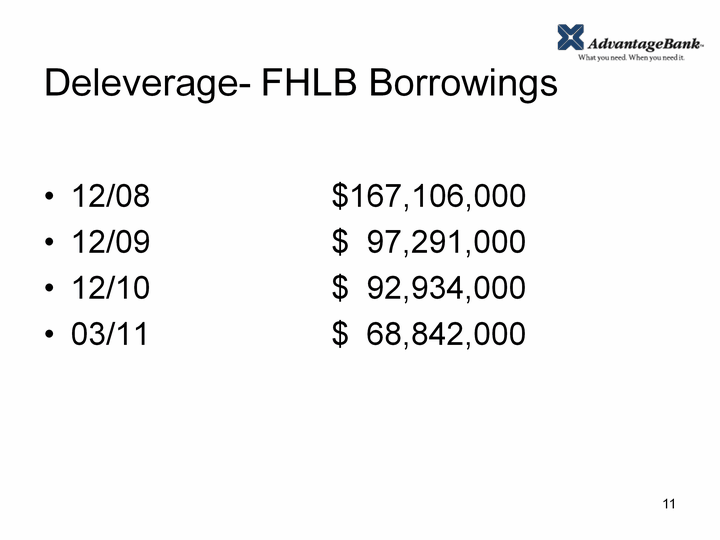
| 11 Deleverage- FHLB Borrowings 12/08 $167,106,000 12/09 $ 97,291,000 12/10 $ 92,934,000 03/11 $ 68,842,000 |

| 12 Non Performing Loans 12/08 $53,484,000 12/09 $32,848,00012/10 $33,779,00003/11 $32,363,000 |

| 13 Net Charge Offs 12/09 $21,440,00012/10 $17,689,0001st Qtr 2011 $ 473,000 |

| 14 NPL/Loans Year Ending 2008 6.91%Year Ending 2009 5.40%Year Ending 2010 5.04% 1st Qtr 2011 4.85% |

| 15 Tier One Capital Trend (CAFI) Monthly Ratio |

| 16 Capital Impact of $20 Million Common Equity Offering |
These materials are not intended to and do not constitute an offer of any securities for sale.

| 17 Earnings Pretax Earnings 4th Qtr 2009 $1,069,5541st Qtr 2011 $1,200,247 |

| 18 Dividends |

| 19 Camco Financial Corporation Annual Meeting of Stockholders May 24, 2011 |
| 20 Financial Disclosure |
