Attached files
| file | filename |
|---|---|
| 8-K - ROCK-TENN COMPANY 8-K - Rock-Tenn CO | a6735833.htm |
Exhibit 99.1
Slide: 1 Title: Goldman Sachs Basic Materials Conference 2011 May 24, 2011
Slide: 2 Other Placeholder: 2 Title: Cautionary Statement Regarding Forward-Looking Information Body: This document contains forward-looking statements within the meaning of the Private Securities Litigation Reform Act of 1995. Forward-looking statements are typically identified by words or phrases such as “may,” “will,” “anticipate,” “estimate,” “expect,” “project,” “intend,” “plan,” “believe,” “target,” “forecast,” and other words and terms of similar meaning. Forward-looking statements involve estimates, expectations, projections, goals, forecasts, assumptions, risks and uncertainties. RockTenn cautions readers that any forward-looking statement is not a guarantee of future performance and that actual results could differ materially from those contained in the forward-looking statement. Such forward-looking statements include, but are not limited to, statements regarding the anticipated closing date of the transaction, the successful closing of the transaction and the integration of Smurfit-Stone as well as opportunities for operational improvement including but not limited to cost reduction and capital investment, the strategic opportunity and perceived value to RockTenn and shareholders of the transaction, the opportunity to recognize benefits from Smurfit-Stone’s NOLs, the transaction’s impact on, among other things, RockTenn’s business mix, margins, transitional costs and integration to achieve the synergies and the timing of such costs and synergies and earnings. With respect to these statements, RockTenn and Smurfit-Stone have made assumptions regarding, among other things, whether and when the proposed transaction will be approved; whether and when the proposed transaction will close; the availability of financing on satisfactory terms; the amount of debt RockTenn will assume; the results and impacts of the acquisition; preliminary purchase price allocations which may include material adjustments to the preliminary fair values of the acquired assets and liabilities; economic, competitive and market conditions generally; volumes and price levels of purchases by customers; competitive conditions in RockTenn and Smurfit-Stone’s businesses and possible adverse actions of our respective customers, competitors and suppliers. Further, Rock-Tenn and Smurfit-Stone’s businesses are subject to a number of general risks that would affect any such forward-looking statements including, among others, decreases in demand for their products; increases in energy, raw materials, shipping and capital equipment costs; reduced supply of raw materials; fluctuations in selling prices and volumes; intense competition; the potential loss of certain customers; and adverse changes in general market and industry conditions. Such risks and other factors that may impact management’s assumptions are more particularly described in RockTenn and Smurfit-Stone’s filings with the Securities and Exchange Commission, including under the caption “Business – Forward-Looking Information” and “Risk Factors” in RockTenn’s Annual Report on Form 10-K for the most recently ended fiscal year and “Business – Risk Factors” and “Forward-Looking Information” in Smurfit-Stone’s Annual Report on Form 10-K for the most recently ended fiscal year. The information contained herein speaks as of the date hereof and neither RockTenn nor Smurfit-Stone have or undertake any obligation to update or revise its forward-looking statements, whether as a result of new information, future events or otherwise.
Slide: 3 Other Placeholder: 3 Title: Additional Information Body: Additional Information and Where to Find It In connection with the proposed transaction, RockTenn and Smurfit-Stone Container Corporation have made various filings with the Securities and Exchange Commission (the “SEC”), including the filing by RockTenn of a registration statement on Form S-4 that includes a joint proxy statement/prospectus of RockTenn and Smurfit-Stone Container Corporation that also constitutes a prospectus of RockTenn. RockTenn shareholders and Smurfit-Stone Container Corporation stockholders are urged to read the registration statement on Form S-4 and the related joint proxy statement/prospectus, as well as other documents filed with the SEC, because they contain important information. The final joint proxy statement/prospectus has been mailed to shareholders of RockTenn and stockholders of Smurfit-Stone on or about April 29, 2011. Investors and security holders may obtain free copies of these documents (when they are available) and other documents filed with the SEC at the SEC’s website at www.sec.gov, or by contacting RockTenn Investor Relations at 678-291-7900 or Smurfit-Stone Container Corporation Investor Relations at 314-656-5553. Participants in the Merger Solicitation RockTenn, Smurfit-Stone Container Corporation and their respective directors, executive officers and other members of management and employees may be deemed to be participants in the solicitation of proxies in respect of the transaction. Information concerning RockTenn’s executive officers and directors is set forth in its definitive proxy statement filed with the SEC on December 17, 2010. Information concerning Smurfit-Stone Container Corporation’s executive officers and directors is set forth in its Annual Report on Form 10-K for the year ended December 31, 2010, which was filed with the SEC on February 15, 2011, as amended by Smurfit-Stone’s Annual Report on Form 10-K/A filed on March 29, 2011. Additional information regarding the interests of participants of RockTenn and Smurfit-Stone Container Corporation in the solicitation of proxies in respect of the transaction is included in the above-referenced registration statement on Form S-4 and joint proxy statement/prospectus. You can obtain free copies of these documents from RockTenn and Smurfit-Stone Container Corporation using the contact information above.
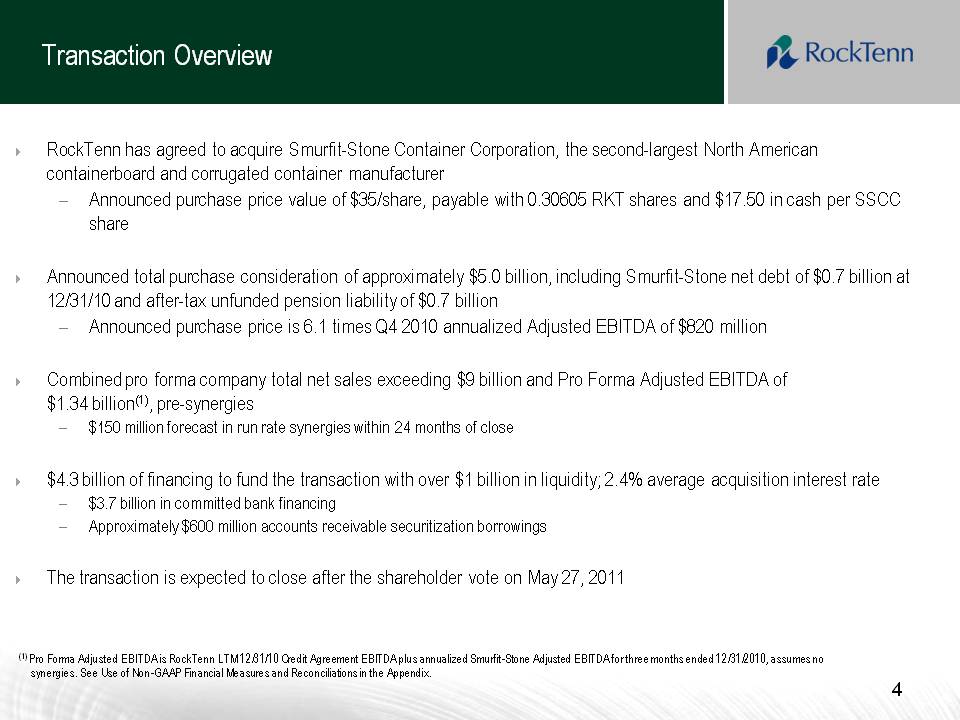
Slide: 4 Title: Transaction Overview 4 Other Placeholder: RockTenn has agreed to acquire Smurfit-Stone Container Corporation, the second-largest North American containerboard and corrugated container manufacturerAnnounced purchase price value of $35/share, payable with 0.30605 RKT shares and $17.50 in cash per SSCC shareAnnounced total purchase consideration of approximately $5.0 billion, including Smurfit-Stone net debt of $0.7 billion at 12/31/10 and after-tax unfunded pension liability of $0.7 billion Announced purchase price is 6.1 times Q4 2010 annualized Adjusted EBITDA of $820 millionCombined pro forma company total net sales exceeding $9 billion and Pro Forma Adjusted EBITDA of$1.34 billion(1), pre-synergies$150 million forecast in run rate synergies within 24 months of close$4.3 billion of financing to fund the transaction with over $1 billion in liquidity; 2.4% average acquisition interest rate$3.7 billion in committed bank financingApproximately $600 million accounts receivable securitization borrowingsThe transaction is expected to close after the shareholder vote on May 27, 2011 (1) Pro Forma Adjusted EBITDA is RockTenn LTM 12/31/10 Credit Agreement EBITDA plus annualized Smurfit-Stone Adjusted EBITDA for three months ended 12/31/2010, assumes no synergies. See Use of Non-GAAP Financial Measures and Reconciliations in the Appendix.
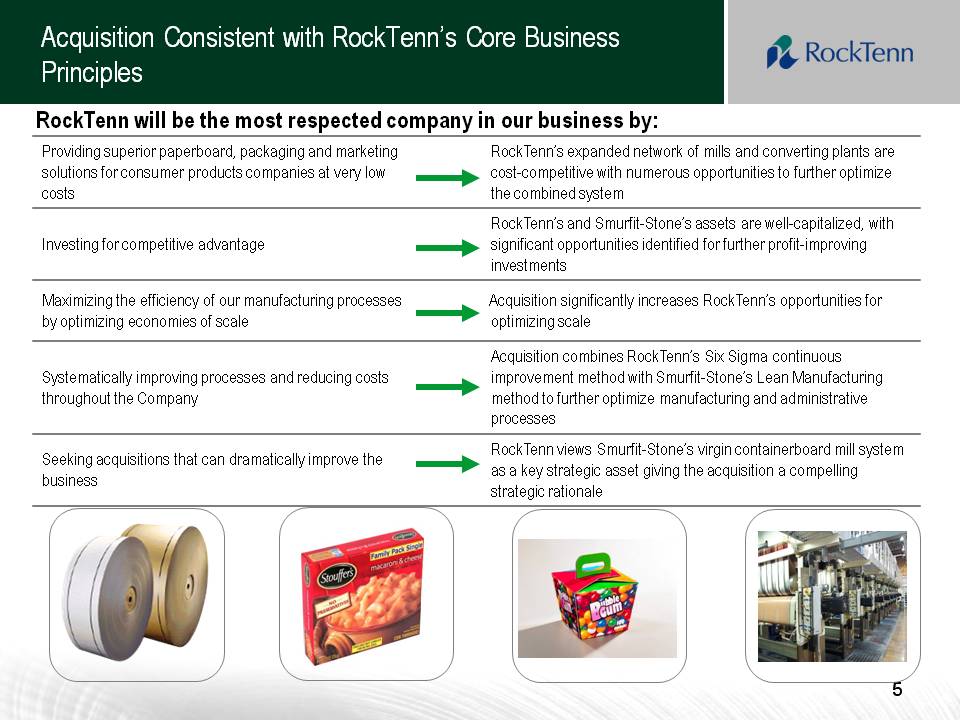
Slide: 5 5 Title: Acquisition Consistent with RockTenn’s Core Business Principles 5 5 RockTenn will be the most respected company in our business by:
Slide: 6 Title: Compelling Strategic Acquisition Other Placeholder: Containerboard has become a very good businessUS virgin containerboard is a highly strategic global assetSmurfit-Stone’s assets are much lower cost than before their transformationAmple opportunities to improve cost position through continued transformation of box plant system and investments in millsEstimated annual transaction synergies run rate of $150 million within 24 months after transaction closeOther Placeholder: 6 RockTenn’s customer-focused value approach to the market, disciplined execution and record of continuous operational and administrative excellence provide broad runway for operational gains
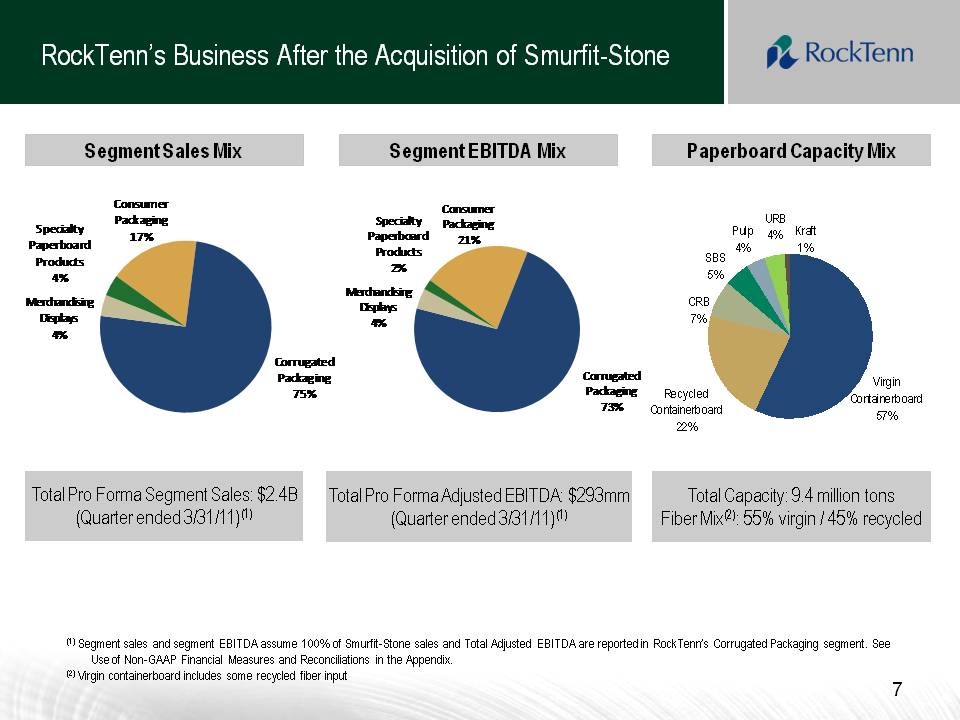
Slide: 7 Title: RockTenn’s Business After the Acquisition of Smurfit-Stone 7 Total Pro Forma Adjusted EBITDA: $293mm(Quarter ended 3/31/11)(1) Total Capacity: 9.4 million tonsFiber Mix(2): 55% virgin / 45% recycled Total Pro Forma Segment Sales: $2.4B(Quarter ended 3/31/11)(1) (1) Segment sales and segment EBITDA assume 100% of Smurfit-Stone sales and Total Adjusted EBITDA are reported in RockTenn’s Corrugated Packaging segment. See Use of Non-GAAP Financial Measures and Reconciliations in the Appendix.(2) Virgin containerboard includes some recycled fiber input Segment Sales Mix Segment EBITDA Mix Paperboard Capacity Mix
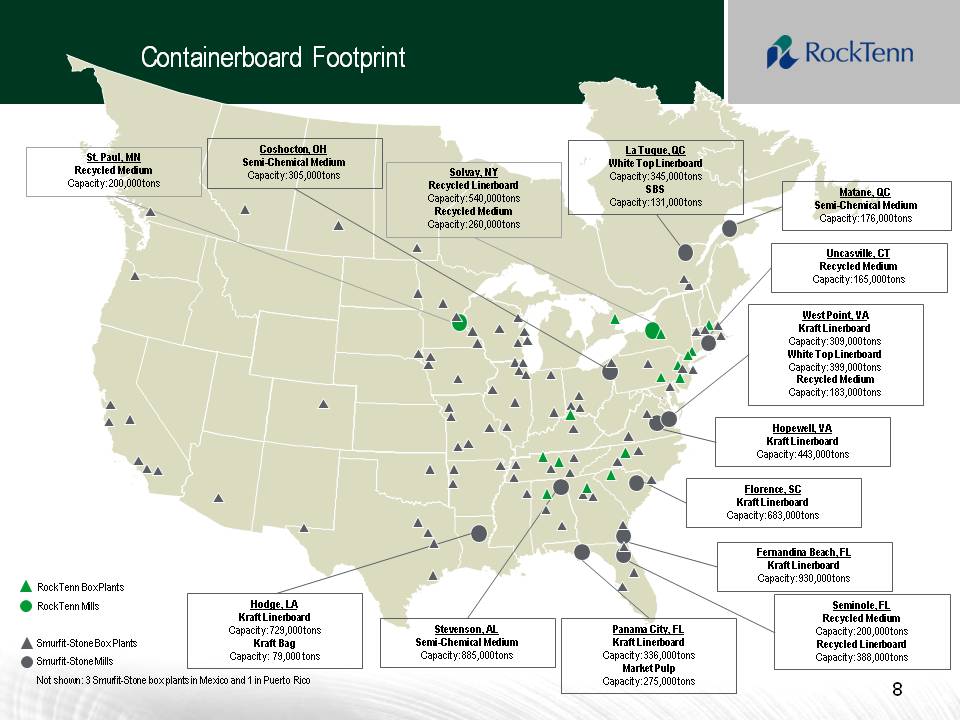
Slide: 8 8 Title: Containerboard Footprint RockTenn Box PlantsRockTenn MillsSmurfit-Stone Box PlantsSmurfit-Stone MillsNot shown: 3 Smurfit-Stone box plants in Mexico and 1 in Puerto Rico Hodge, LAKraft LinerboardCapacity: 729,000 tonsKraft BagCapacity: 79,000 tons Seminole, FLRecycled MediumCapacity: 200,000 tonsRecycled LinerboardCapacity: 388,000 tons Fernandina Beach, FLKraft LinerboardCapacity: 930,000 tons Stevenson, ALSemi-Chemical MediumCapacity: 885,000 tons Florence, SCKraft LinerboardCapacity: 683,000 tons Hopewell, VAKraft LinerboardCapacity: 443,000 tons West Point, VAKraft LinerboardCapacity: 309,000 tonsWhite Top LinerboardCapacity: 399,000 tonsRecycled MediumCapacity: 183,000 tons Uncasville, CTRecycled MediumCapacity: 165,000 tons Coshocton, OHSemi-Chemical MediumCapacity: 305,000 tons Solvay, NYRecycled LinerboardCapacity: 540,000 tonsRecycled MediumCapacity: 260,000 tons St. Paul, MNRecycled MediumCapacity: 200,000 tons Matane, QCSemi-Chemical MediumCapacity: 176,000 tons La Tuque, QCWhite Top LinerboardCapacity: 345,000 tonsSBSCapacity: 131,000 tons Panama City, FLKraft LinerboardCapacity: 336,000 tonsMarket PulpCapacity: 275,000 tons
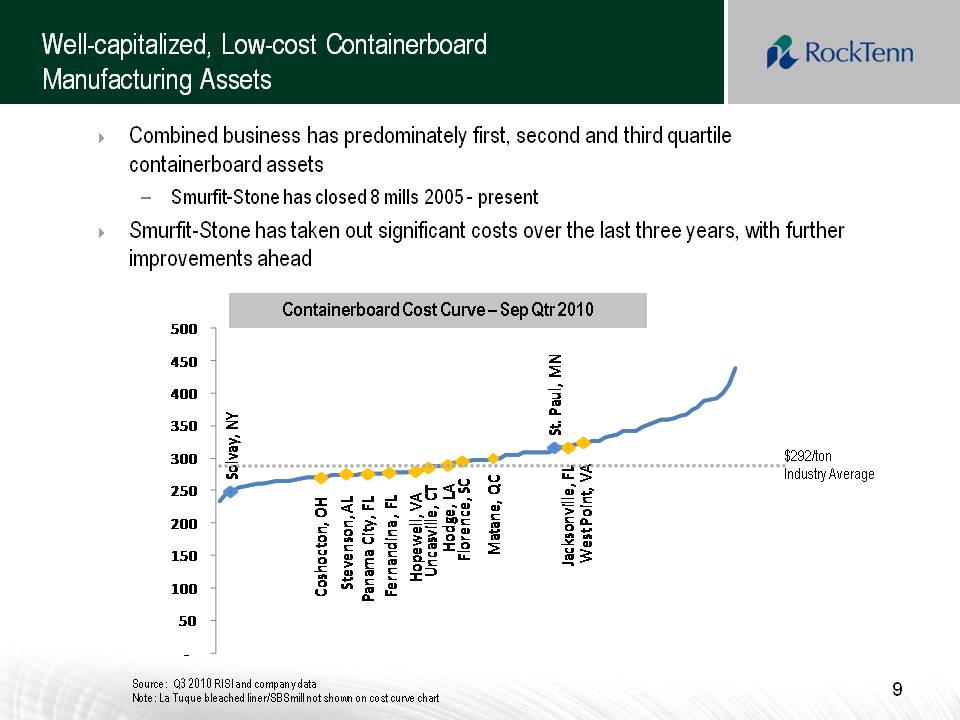
Slide: 9 Other Placeholder: Combined business has predominately first, second and third quartile containerboard assetsSmurfit-Stone has closed 8 mills 2005 - presentSmurfit-Stone has taken out significant costs over the last three years, with further improvements aheadTitle: Well-capitalized, Low-cost Containerboard Manufacturing Assets Other Placeholder: 9 $292/ton Industry Average Source: Q3 2010 RISI and company dataNote: La Tuque bleached liner/SBS mill not shown on cost curve chart Containerboard Cost Curve – Sep Qtr 2010
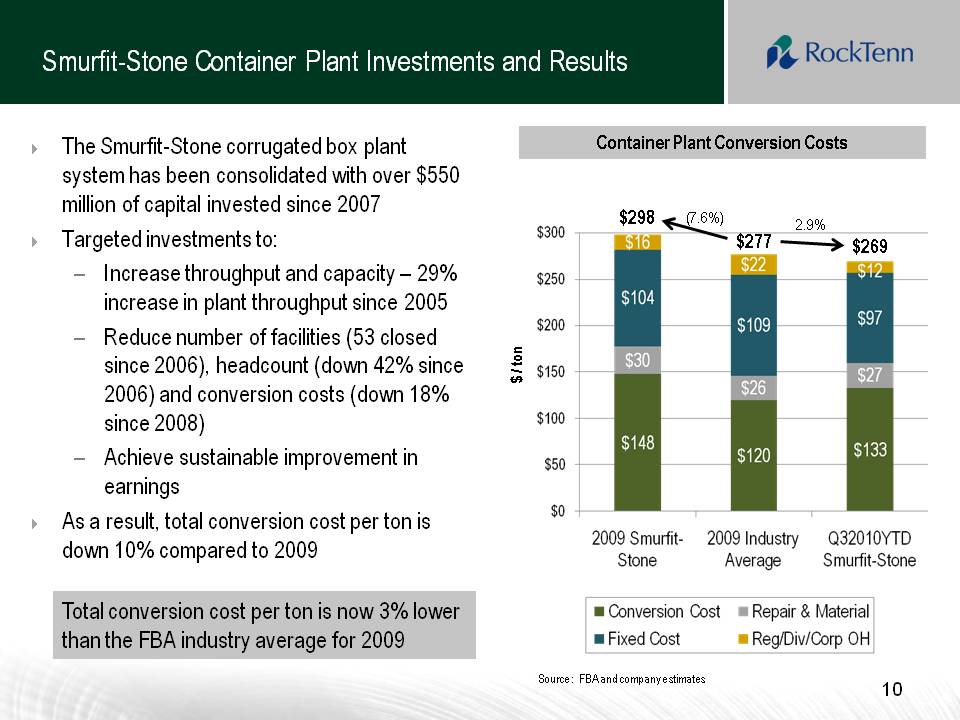
Slide: 10 Title: Smurfit-Stone Container Plant Investments and Results 10 Other Placeholder: The Smurfit-Stone corrugated box plant system has been consolidated with over $550 million of capital invested since 2007Targeted investments to:Increase throughput and capacity – 29% increase in plant throughput since 2005Reduce number of facilities (53 closed since 2006), headcount (down 42% since 2006) and conversion costs (down 18% since 2008) Achieve sustainable improvement in earningsAs a result, total conversion cost per ton is down 10% compared to 2009 $277 $298 $269 Container Plant Conversion Costs (7.6%) 2.9% Source: FBA and company estimates Total conversion cost per ton is now 3% lower than the FBA industry average for 2009 $ / ton
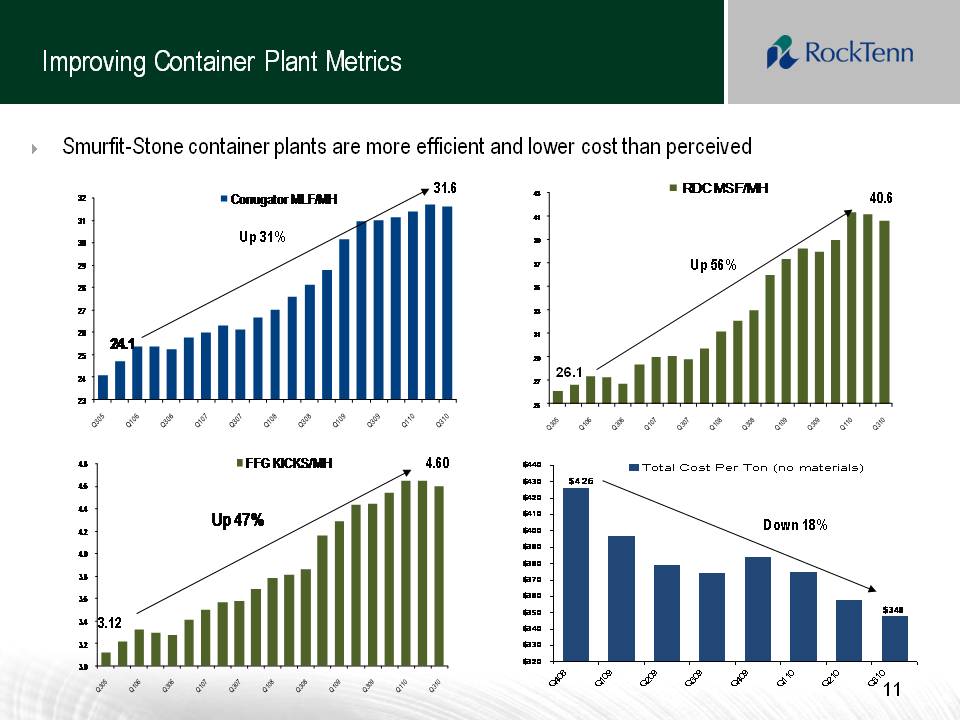
Slide: 11 Other Placeholder: 11 Title: Improving Container Plant Metrics 31.6 4.60 3.12 40.6 26.1 Up 56% Up 31% Down 18% Smurfit-Stone container plants are more efficient and lower cost than perceived
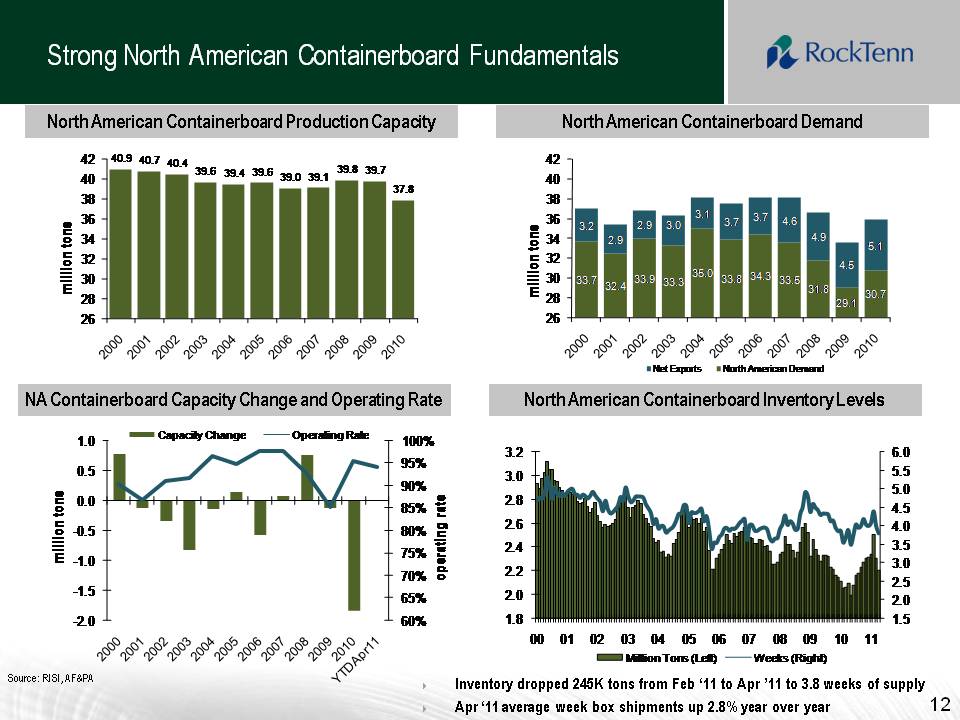
Slide: 12 Other Placeholder: Inventory dropped 245K tons from Feb ‘11 to Apr ’11 to 3.8 weeks of supplyApr ‘11 average week box shipments up 2.8% year over year Title: Strong North American Containerboard Fundamentals Other Placeholder: 12 North American Containerboard Demand North American Containerboard Production Capacity North American Containerboard Inventory Levels NA Containerboard Capacity Change and Operating Rate Source: RISI, AF&PA
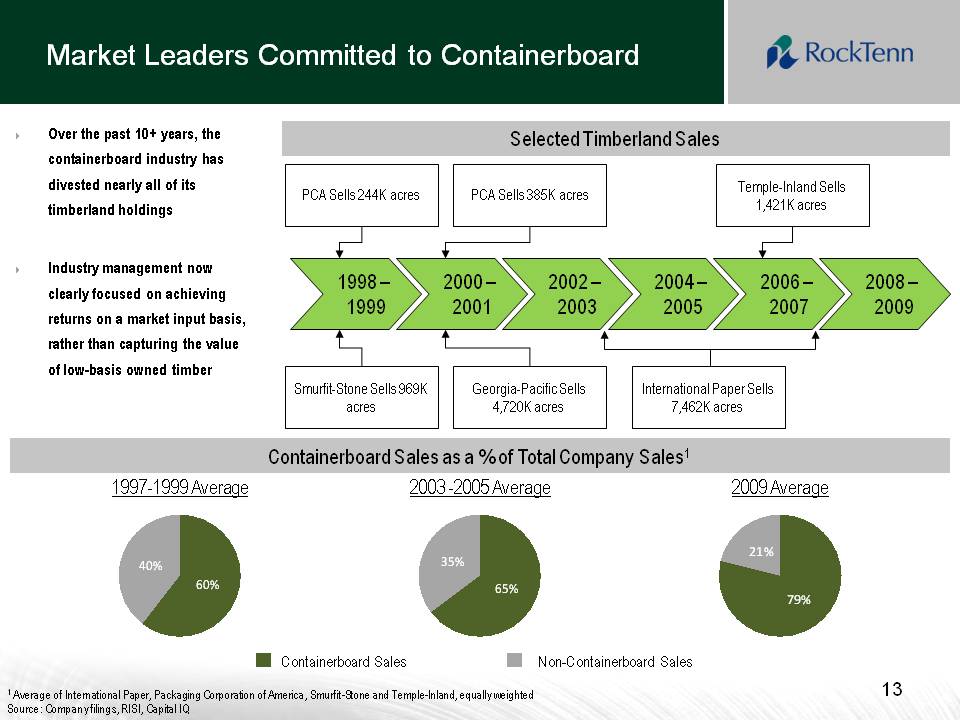
Slide: 13 Title: Market Leaders Committed to Containerboard 2000 – 2001 2002 – 2003 2004 – 2005 2006 – 2007 2008 – 2009 1998 – 1999 Smurfit-Stone Sells 969K acres PCA Sells 385K acres PCA Sells 244K acres Temple-Inland Sells 1,421K acres International Paper Sells 7,462K acres Georgia-Pacific Sells 4,720K acres Selected Timberland Sales Containerboard Sales as a % of Total Company Sales1 1997-1999 Average 2003 -2005 Average 2009 Average 1 Average of International Paper, Packaging Corporation of America, Smurfit-Stone and Temple-Inland, equally weightedSource: Company filings, RISI, Capital IQ (Gp:) Containerboard Sales (Gp:) Non-Containerboard Sales Over the past 10+ years, the containerboard industry has divested nearly all of its timberland holdings Industry management now clearly focused on achieving returns on a market input basis, rather than capturing the value of low-basis owned timber Other Placeholder: 13
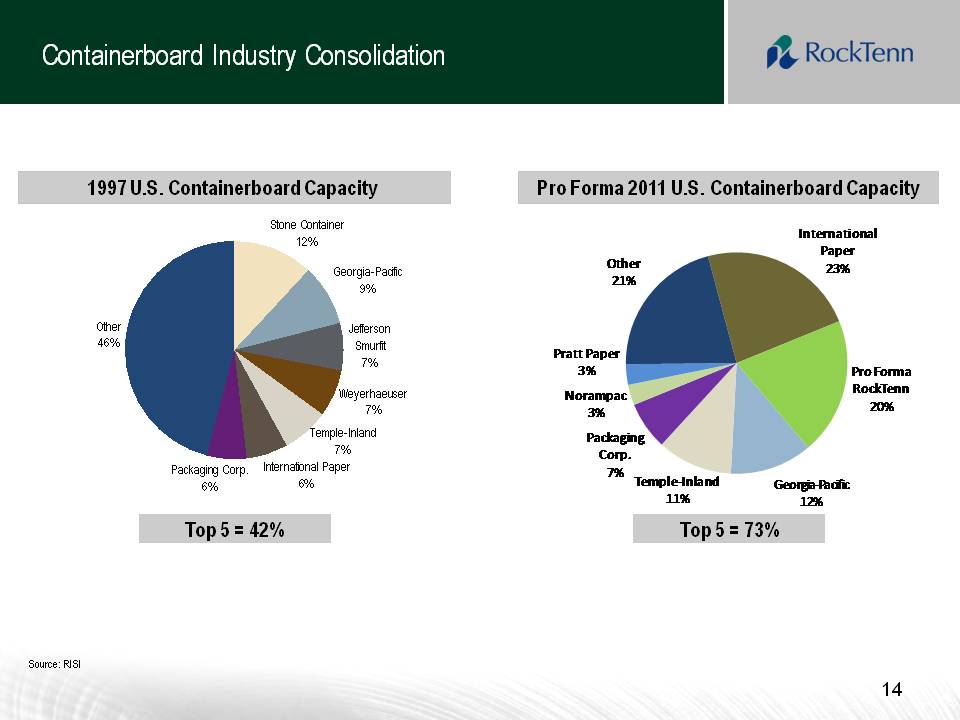
Slide: 14 Title: Containerboard Industry Consolidation Other Placeholder: 14 Source: RISI 1997 U.S. Containerboard Capacity Pro Forma 2011 U.S. Containerboard Capacity Top 5 = 42% Top 5 = 73%
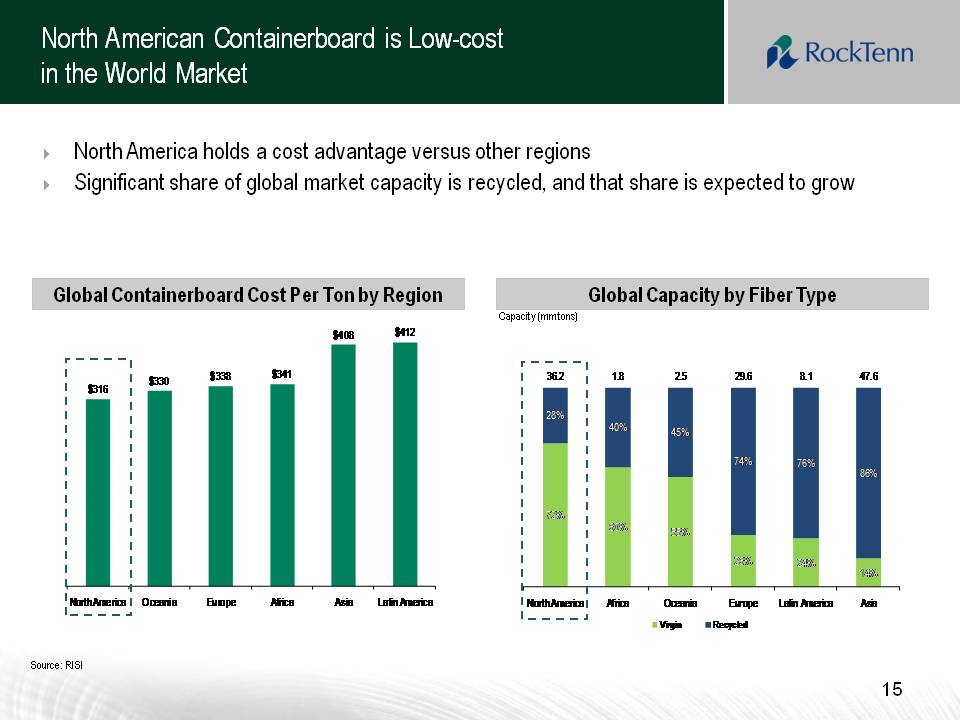
Slide: 15 Title: North American Containerboard is Low-cost in the World Market 15 Global Capacity by Fiber Type Global Containerboard Cost Per Ton by Region North America holds a cost advantage versus other regionsSignificant share of global market capacity is recycled, and that share is expected to grow Source: RISI Capacity (mm tons)
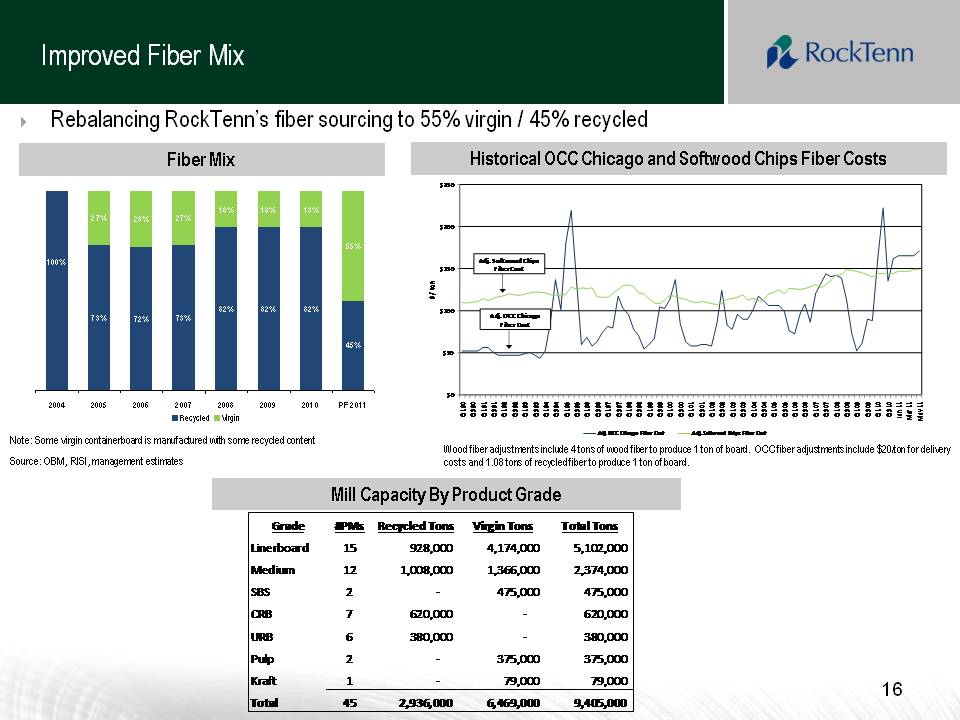
Slide: 16 Title: Improved Fiber Mix 16 Other Placeholder: Rebalancing RockTenn’s fiber sourcing to 55% virgin / 45% recycled Note: Some virgin containerboard is manufactured with some recycled content Source: OBM, RISI, management estimates Wood fiber adjustments include 4 tons of wood fiber to produce 1 ton of board. OCC fiber adjustments include $20/ton for delivery costs and 1.08 tons of recycled fiber to produce 1 ton of board. Fiber Mix Historical OCC Chicago and Softwood Chips Fiber Costs Mill Capacity By Product Grade
Slide: 17 Title: Management’s Successful Execution Track Record Other Placeholder: Extensive operational and industry experienceDemonstrated willingness to reduce debtOpening leverage of 2.8x; company plans to de-lever rapidlyProven track record of successfully integrating acquisitionsProven ability to meet or exceed stated financial objectivesCommitted to achieving and maintaining investment grade credit profileOther Placeholder: 17
Slide: 18 18 18 Smurfit-Stone’s corrugated assets will be combined with RockTenn’s corrugated assets under the leadership of Jim Porter with a five-pronged integration strategy:Opportunities to invest capital in the mill system and optimize the footprint to reduce cost and maximize production efficiencyComplete the box plant consolidation and optimization strategy initiated by SSCC managementApply the RockTenn business model to the box plant system, driving product innovation, customer satisfaction and low-cost manufacturing while maximizing sales revenueConsolidate the divisional entity into one RockTenn headquarters located in Atlanta, GABuild a single cultural model which inspires a high-performing corrugated business and creates the most respected company in the industryAdministrative integration to be led by Steve Voorhees, who led the successful Gulf States and Southern Container integrations Integration Strategy
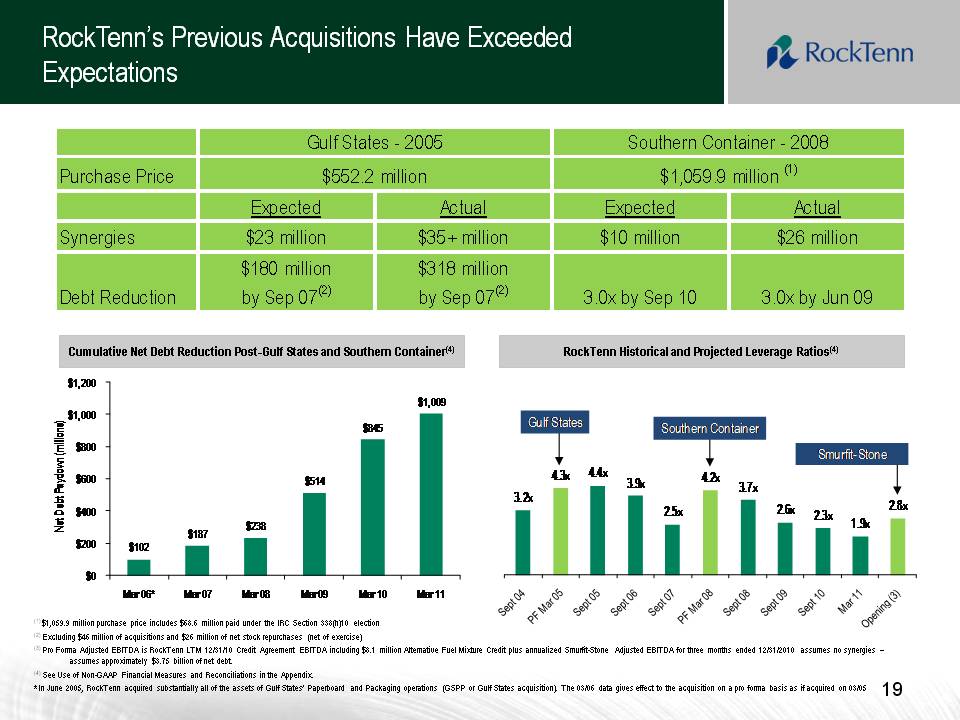
Slide: 19 RockTenn Historical and Projected Leverage Ratios(4) 19 19 (1) $1,059.9 million purchase price includes $68.6 million paid under the IRC Section 338(h)10 election(2) Excluding $46 million of acquisitions and $26 million of net stock repurchases (net of exercise)(3) Pro Forma Adjusted EBITDA is RockTenn LTM 12/31/10 Credit Agreement EBITDA including $8.1 million Alternative Fuel Mixture Credit plus annualized Smurfit-Stone Adjusted EBITDA for three months ended 12/31/2010 assumes no synergies – assumes approximately $3.75 billion of net debt.(4) See Use of Non-GAAP Financial Measures and Reconciliations in the Appendix.* In June 2005, RockTenn acquired substantially all of the assets of Gulf States’ Paperboard and Packaging operations (GSPP or Gulf States acquisition). The 03/06 data gives effect to the acquisition on a pro forma basis as if acquired on 03/05 RockTenn’s Previous Acquisitions Have Exceeded Expectations Cumulative Net Debt Reduction Post-Gulf States and Southern Container(4)
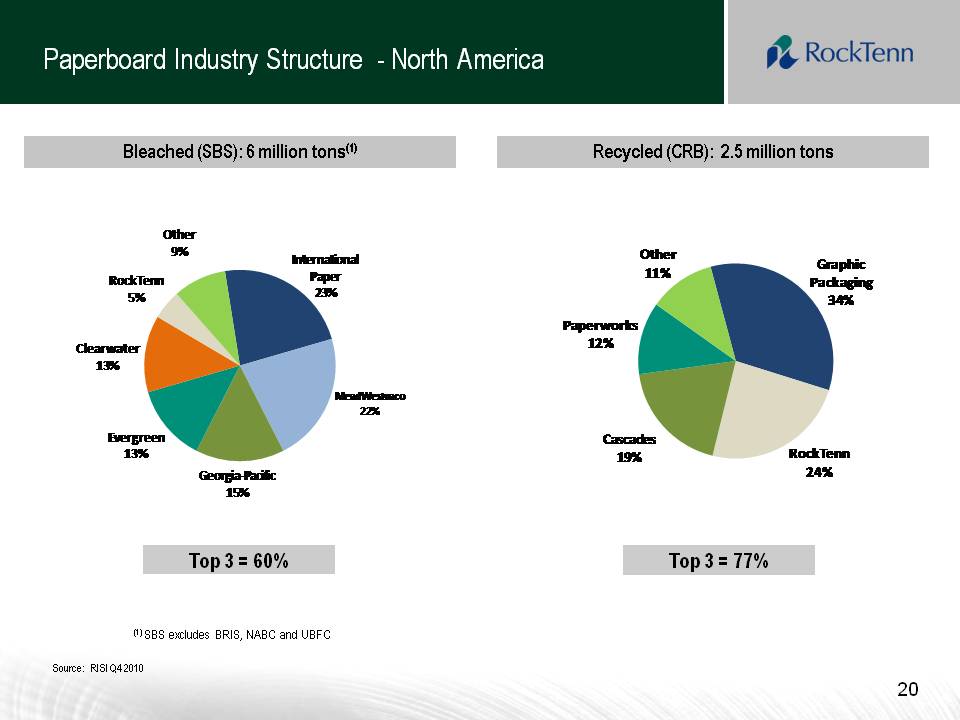
Slide: 20 20 Source: RISI Q4 2010 (1) SBS excludes BRIS, NABC and UBFC Bleached (SBS): 6 million tons(1) Recycled (CRB): 2.5 million tons Paperboard Industry Structure - North America Top 3 = 60% Top 3 = 77%
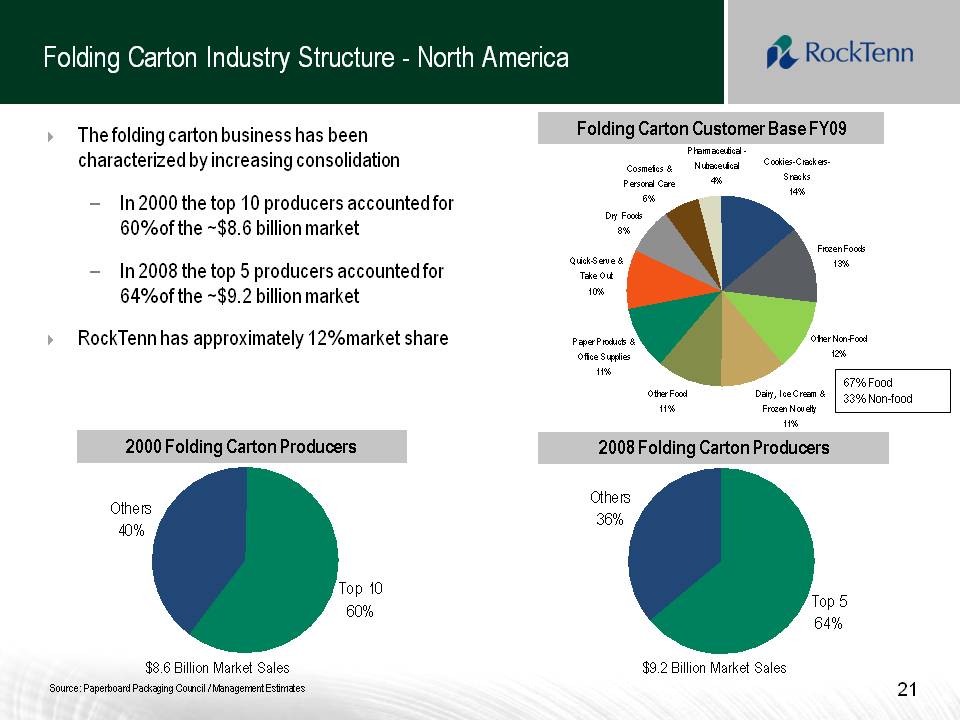
Slide: 21 21 Title: Folding Carton Industry Structure - North America Folding Carton Customer Base FY09 2000 Folding Carton Producers 2008 Folding Carton Producers 67% Food33% Non-food Source: Paperboard Packaging Council / Management Estimates $8.6 Billion Market Sales The folding carton business has been characterized by increasing consolidationIn 2000 the top 10 producers accounted for 60% of the ~$8.6 billion marketIn 2008 the top 5 producers accounted for 64% of the ~$9.2 billion marketRockTenn has approximately 12% market share $9.2 Billion Market Sales
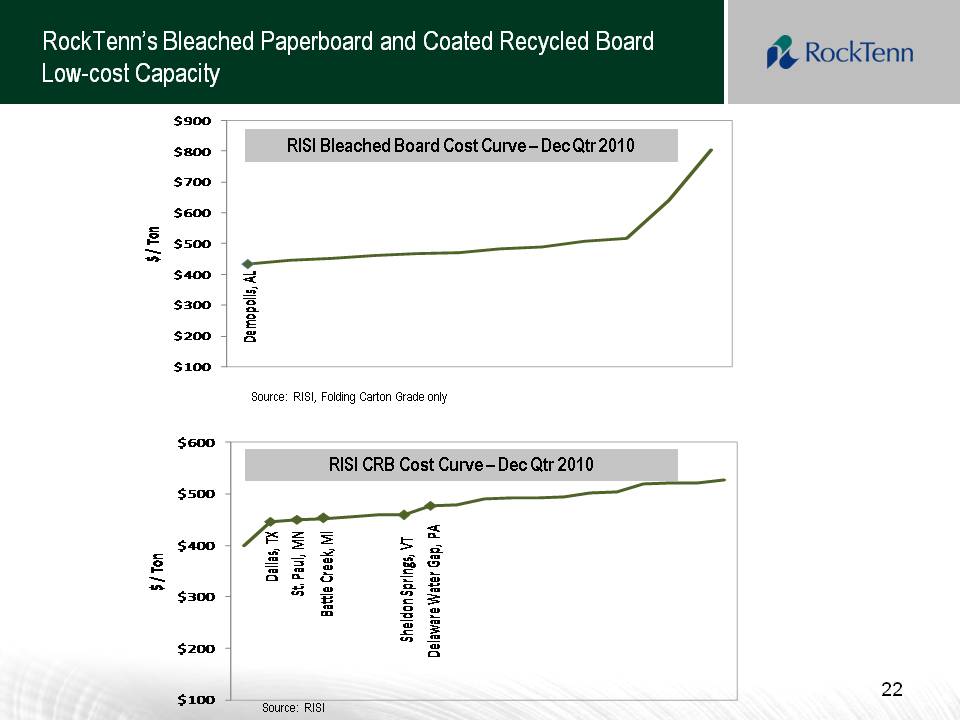
Slide: 22 Other Placeholder: 22 RockTenn’s Bleached Paperboard and Coated Recycled Board Low-cost Capacity Source: RISI, Folding Carton Grade only RISI Bleached Board Cost Curve – Dec Qtr 2010 RISI CRB Cost Curve – Dec Qtr 2010 Source: RISI
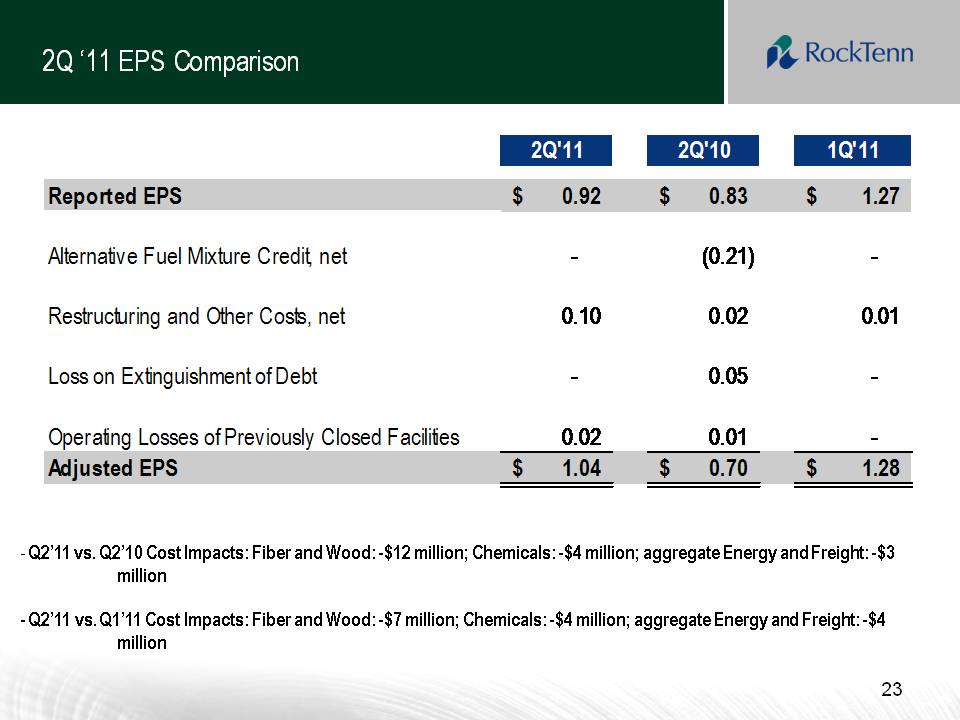
Slide: 23 Title: 2Q ‘11 EPS Comparison Other Placeholder: 23 Q2’11 vs. Q2’10 Cost Impacts: Fiber and Wood: -$12 million; Chemicals: -$4 million; aggregate Energy and Freight: -$3 million- Q2’11 vs. Q1’11 Cost Impacts: Fiber and Wood: -$7 million; Chemicals: -$4 million; aggregate Energy and Freight: -$4 million
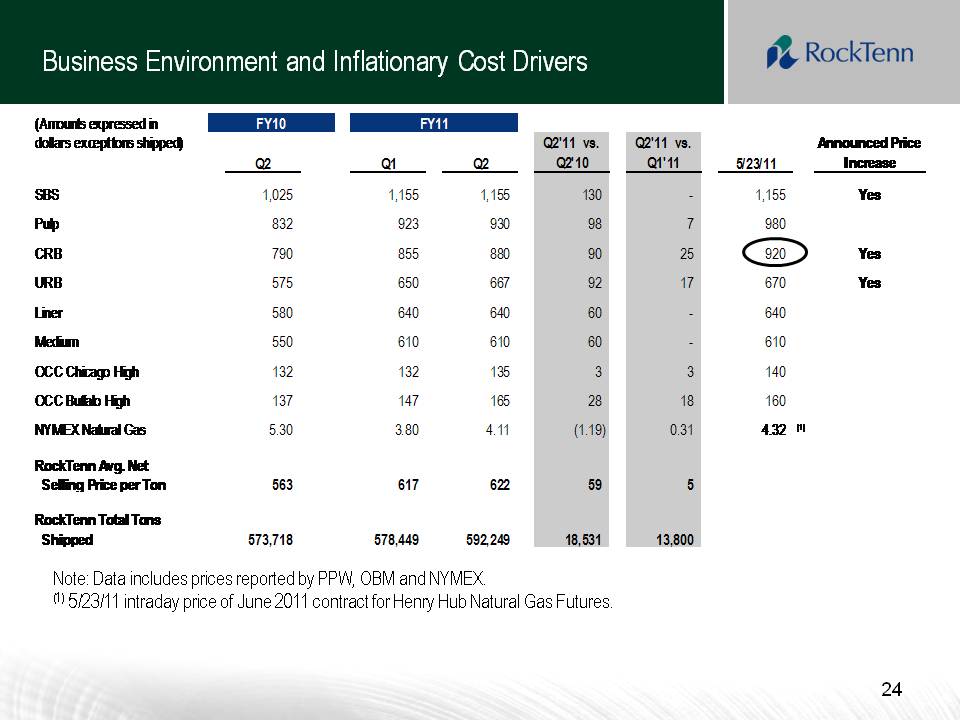
Slide: 24 Title: Business Environment and Inflationary Cost Drivers Other Placeholder: 24 Note: Data includes prices reported by PPW, OBM and NYMEX.(1) 5/23/11 intraday price of June 2011 contract for Henry Hub Natural Gas Futures.
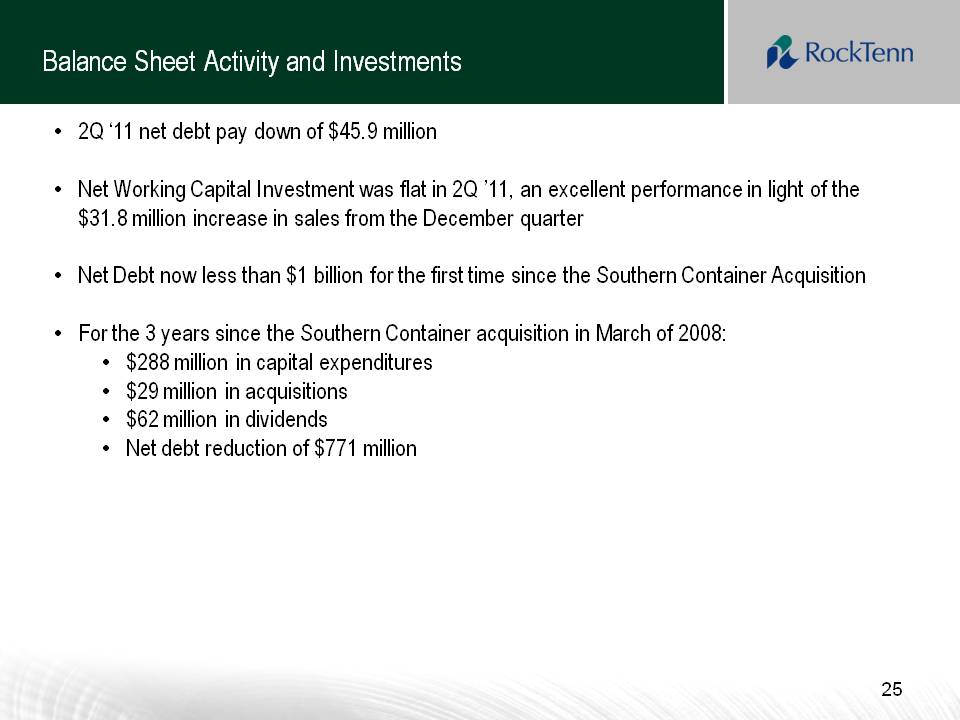
Slide: 25 Title: Balance Sheet Activity and Investments Other Placeholder: 25 2Q ‘11 net debt pay down of $45.9 millionNet Working Capital Investment was flat in 2Q ’11, an excellent performance in light of the $31.8 million increase in sales from the December quarterNet Debt now less than $1 billion for the first time since the Southern Container AcquisitionFor the 3 years since the Southern Container acquisition in March of 2008:$288 million in capital expenditures$29 million in acquisitions$62 million in dividendsNet debt reduction of $771 million
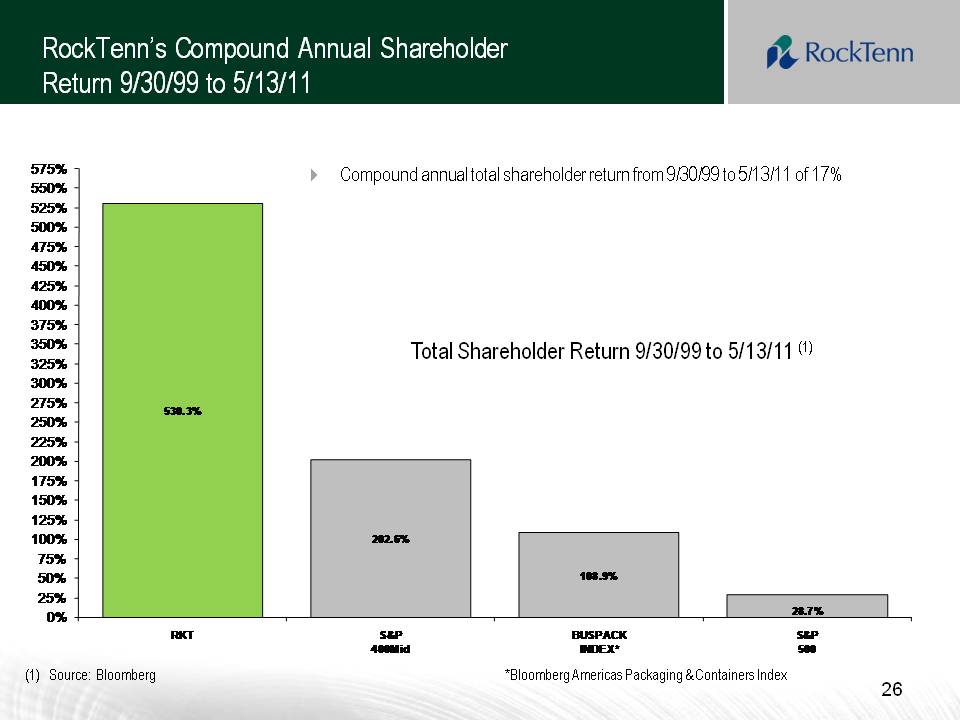
Slide: 26 Other Placeholder: 26 RockTenn’s Compound Annual Shareholder Return 9/30/99 to 5/13/11 Compound annual total shareholder return from 9/30/99 to 5/13/11 of 17% Total Shareholder Return 9/30/99 to 5/13/11 (1) Source: Bloomberg *Bloomberg Americas Packaging & Containers Index
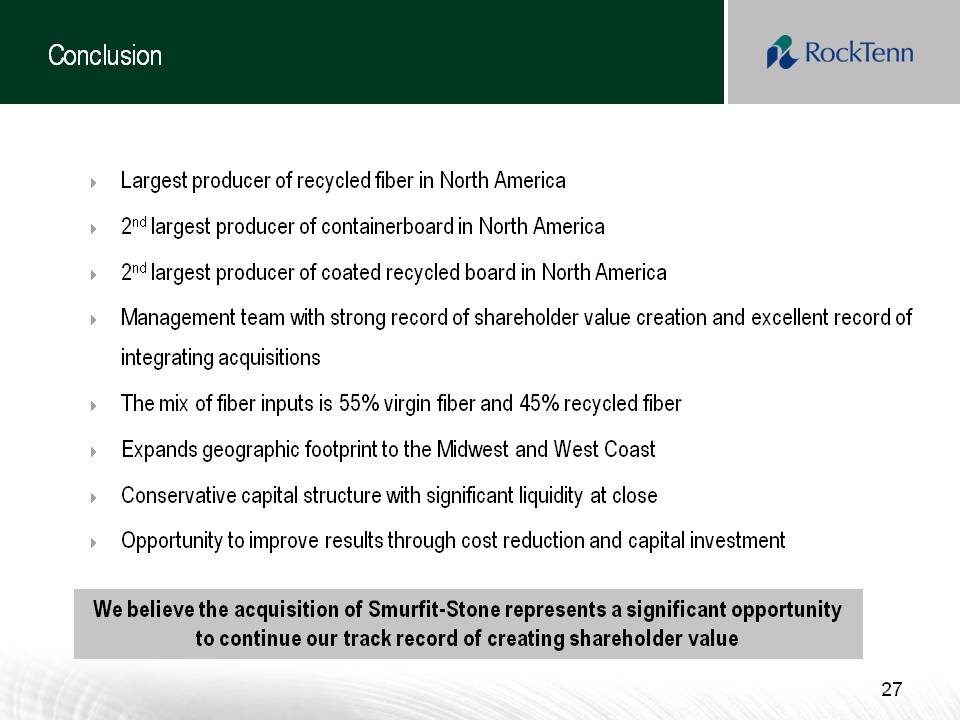
Slide: 27 Title: Conclusion Other Placeholder: Largest producer of recycled fiber in North America2nd largest producer of containerboard in North America2nd largest producer of coated recycled board in North AmericaManagement team with strong record of shareholder value creation and excellent record of integrating acquisitionsThe mix of fiber inputs is 55% virgin fiber and 45% recycled fiberExpands geographic footprint to the Midwest and West CoastConservative capital structure with significant liquidity at closeOpportunity to improve results through cost reduction and capital investmentOther Placeholder: 27 We believe the acquisition of Smurfit-Stone represents a significant opportunity to continue our track record of creating shareholder value

Slide: 28 Other Placeholder: 28 Appendix
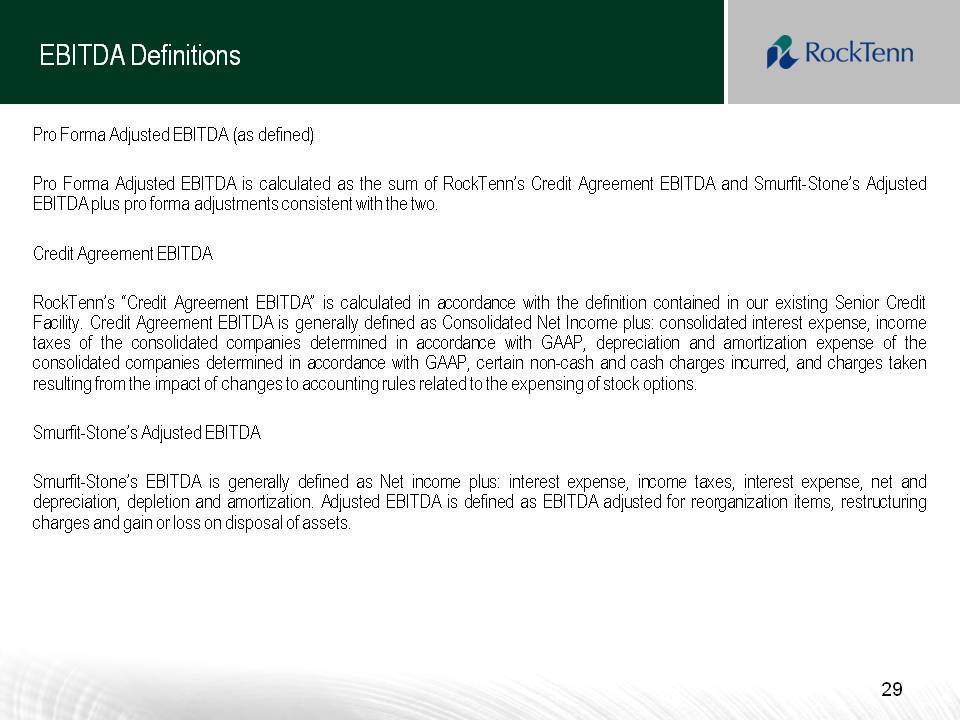
Slide: 29 Other Placeholder: 29 Title: EBITDA Definitions Body: Pro Forma Adjusted EBITDA (as defined) Pro Forma Adjusted EBITDA is calculated as the sum of RockTenn’s Credit Agreement EBITDA and Smurfit-Stone’s Adjusted EBITDA plus pro forma adjustments consistent with the two.Credit Agreement EBITDA RockTenn’s “Credit Agreement EBITDA” is calculated in accordance with the definition contained in our existing Senior Credit Facility. Credit Agreement EBITDA is generally defined as Consolidated Net Income plus: consolidated interest expense, income taxes of the consolidated companies determined in accordance with GAAP, depreciation and amortization expense of the consolidated companies determined in accordance with GAAP, certain non-cash and cash charges incurred, and charges taken resulting from the impact of changes to accounting rules related to the expensing of stock options. Smurfit-Stone’s Adjusted EBITDASmurfit-Stone’s EBITDA is generally defined as Net income plus: interest expense, income taxes, interest expense, net and depreciation, depletion and amortization. Adjusted EBITDA is defined as EBITDA adjusted for reorganization items, restructuring charges and gain or loss on disposal of assets.
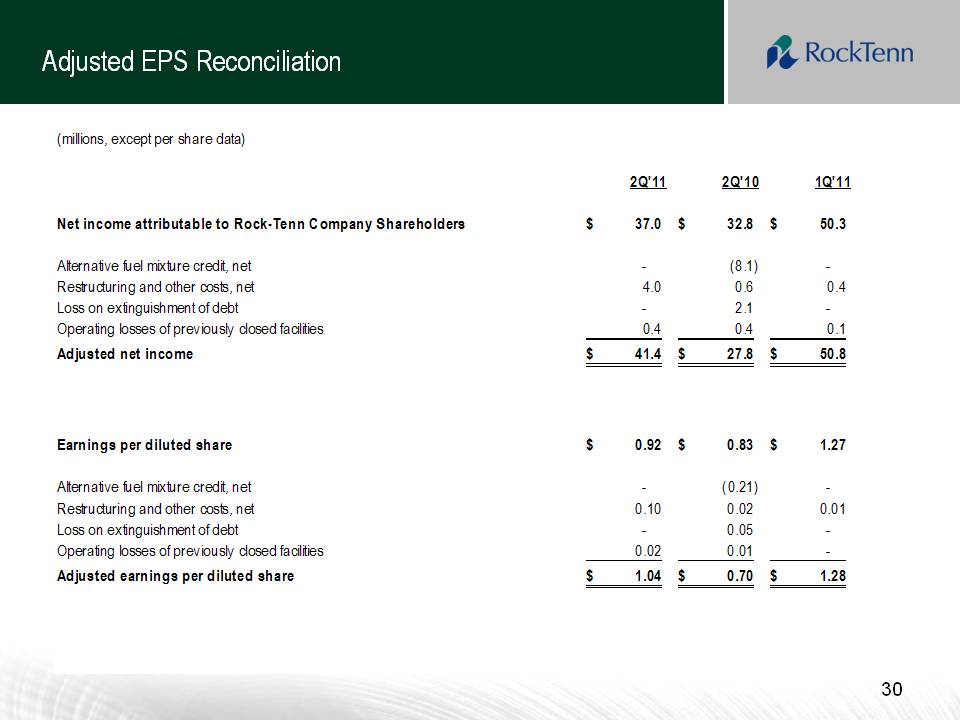
Slide: 30 Title: Adjusted EPS Reconciliation Other Placeholder: 30
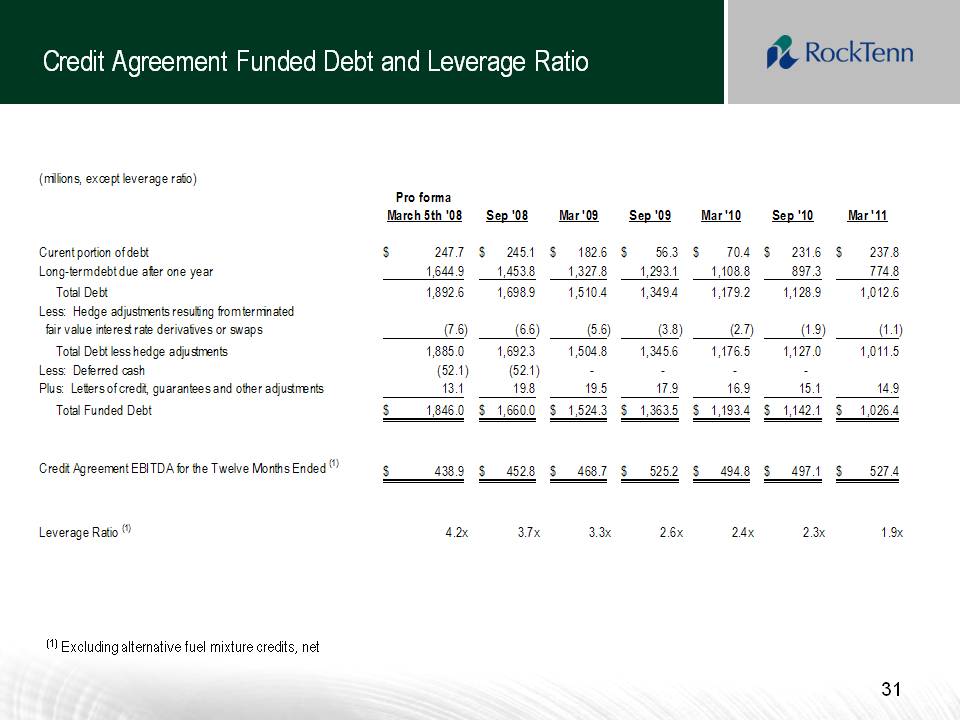
Slide: 31 Title: Credit Agreement Funded Debt and Leverage Ratio Other Placeholder: 31 (1) Excluding alternative fuel mixture credits, net
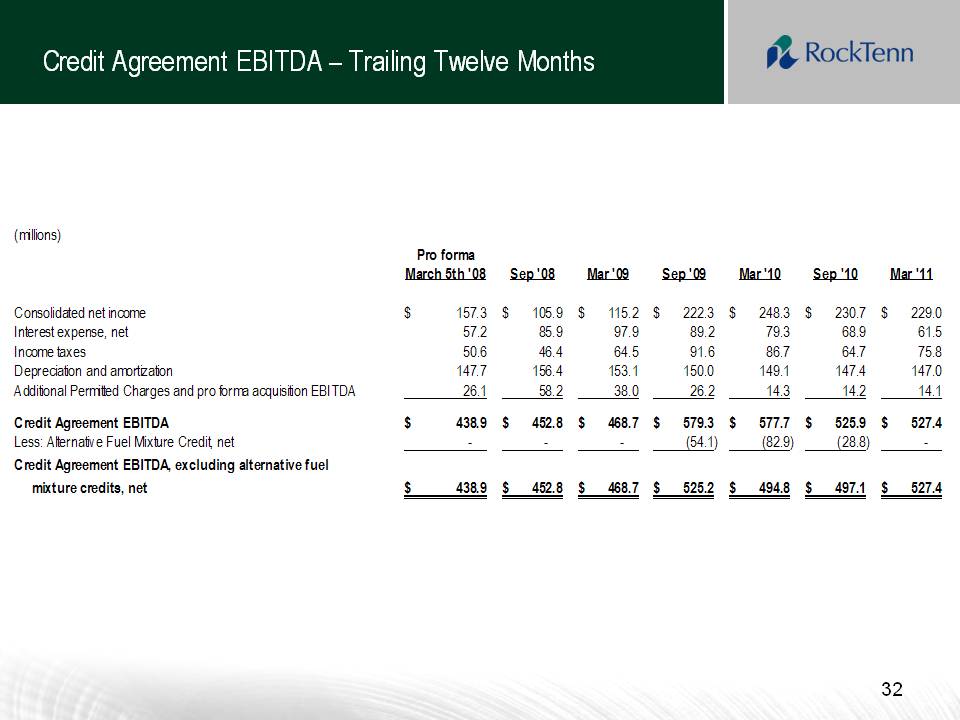
Slide: 32 Title: Credit Agreement EBITDA – Trailing Twelve Months Other Placeholder: 32
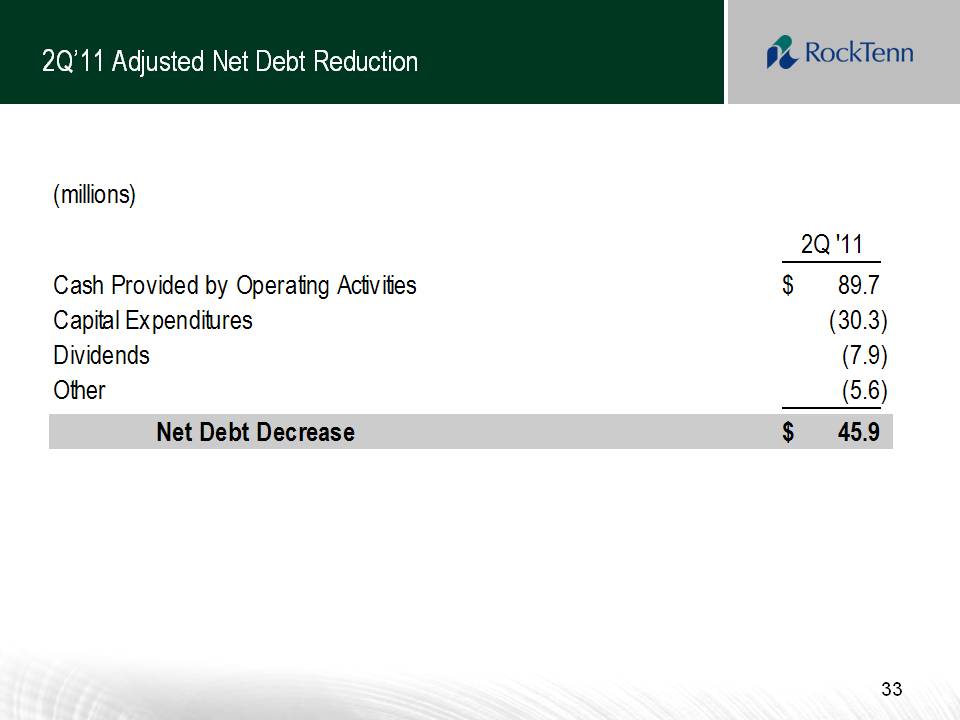
Slide: 33 Title: 2Q’11 Adjusted Net Debt Reduction Other Placeholder: 33
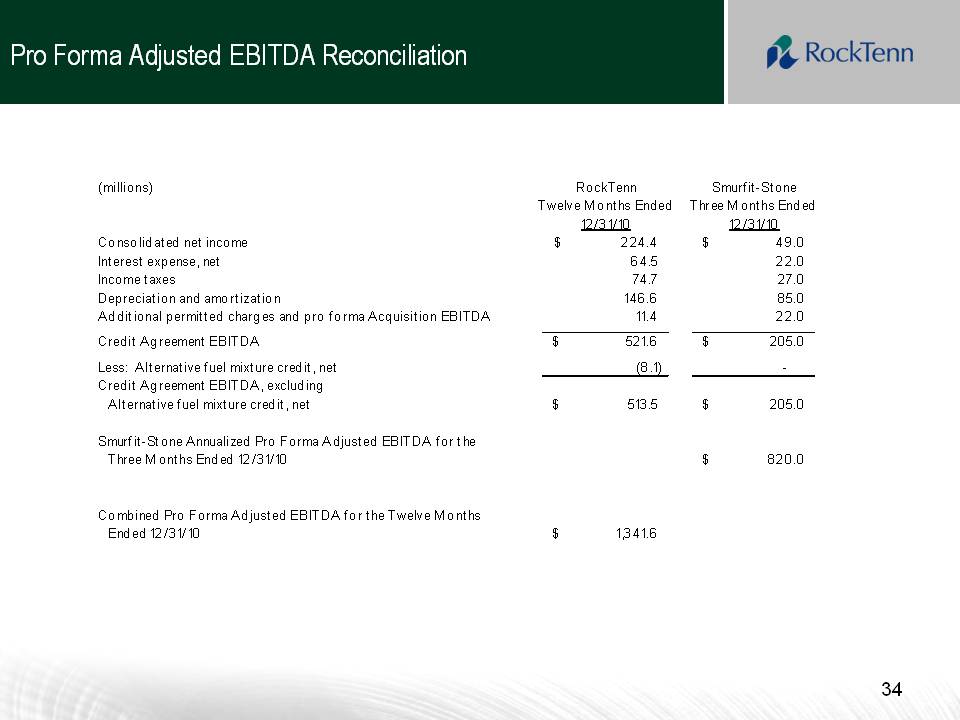
Slide: 34 Other Placeholder: 34 Title: Pro Forma Adjusted EBITDA Reconciliation
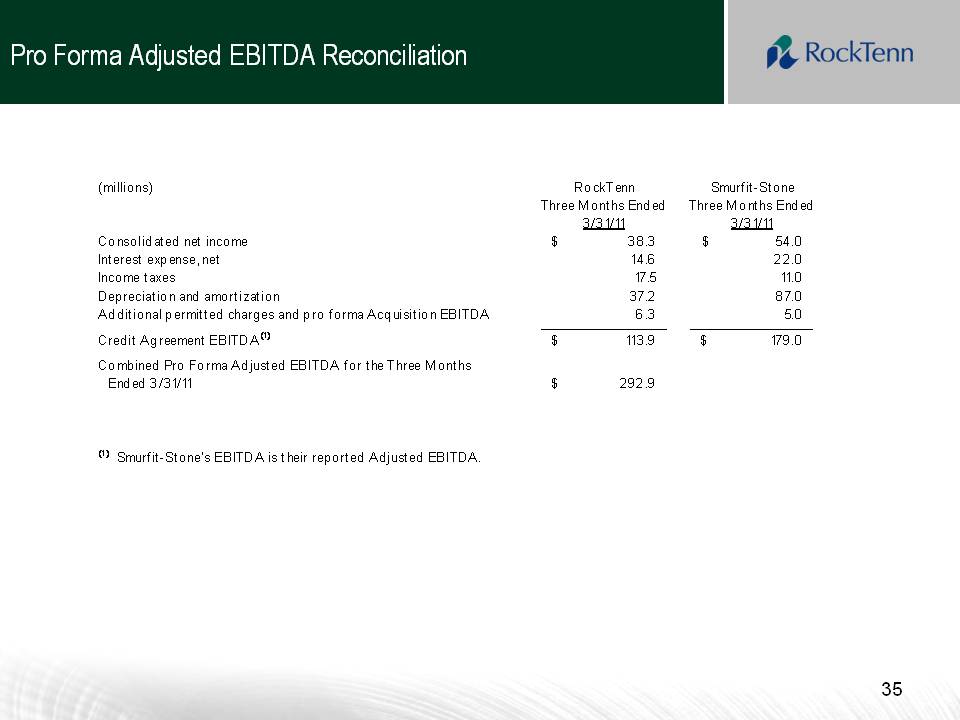
Slide: 35 Other Placeholder: 35 Title: Pro Forma Adjusted EBITDA Reconciliation
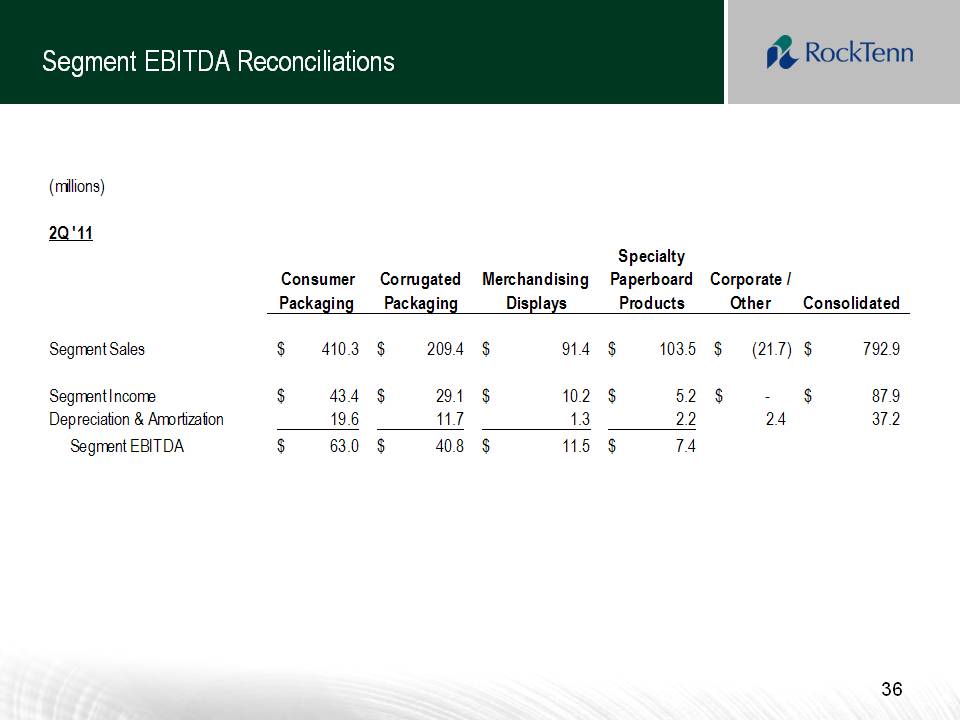
Slide: 36 Title: Segment EBITDA Reconciliations Other Placeholder: 36
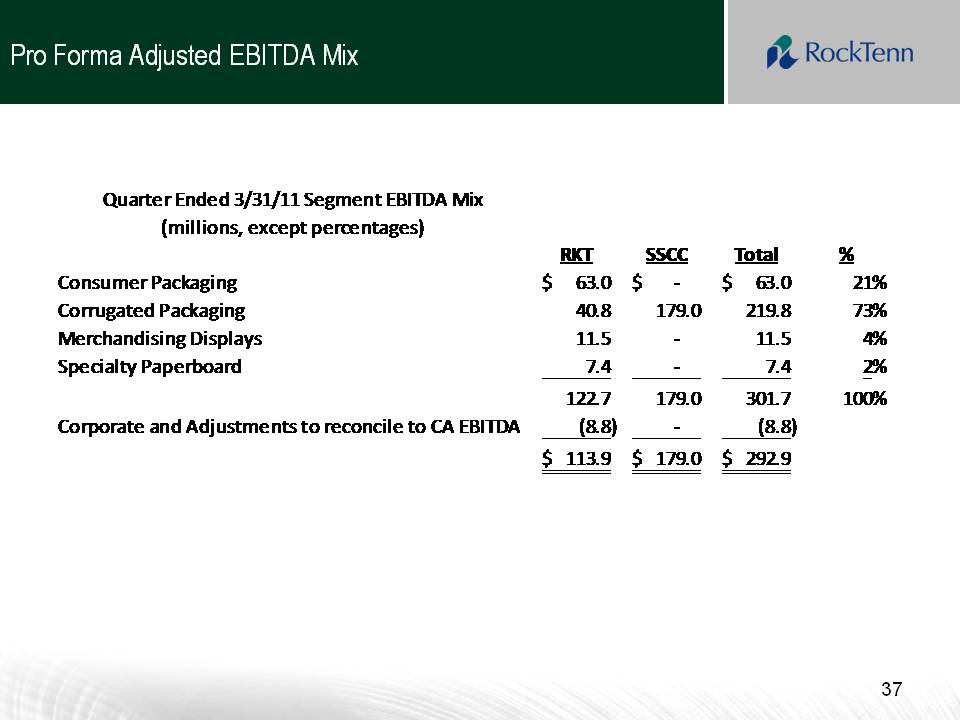
Slide: 37 Other Placeholder: 37 Title: Pro Forma Adjusted EBITDA Mix
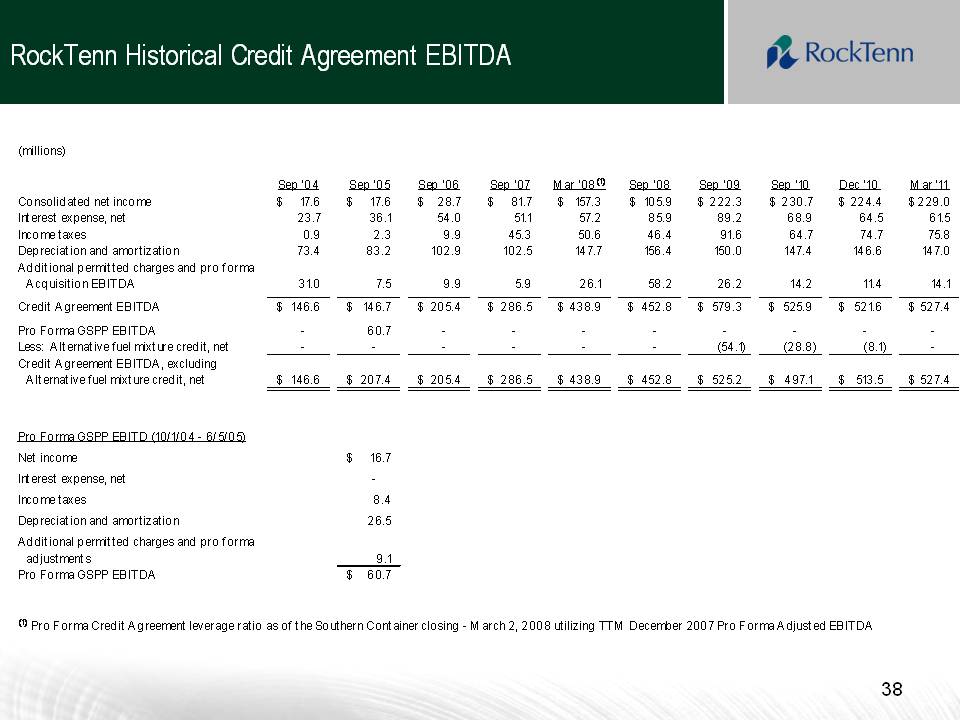
Slide: 38 Other Placeholder: 38 Title: RockTenn Historical Credit Agreement EBITDA
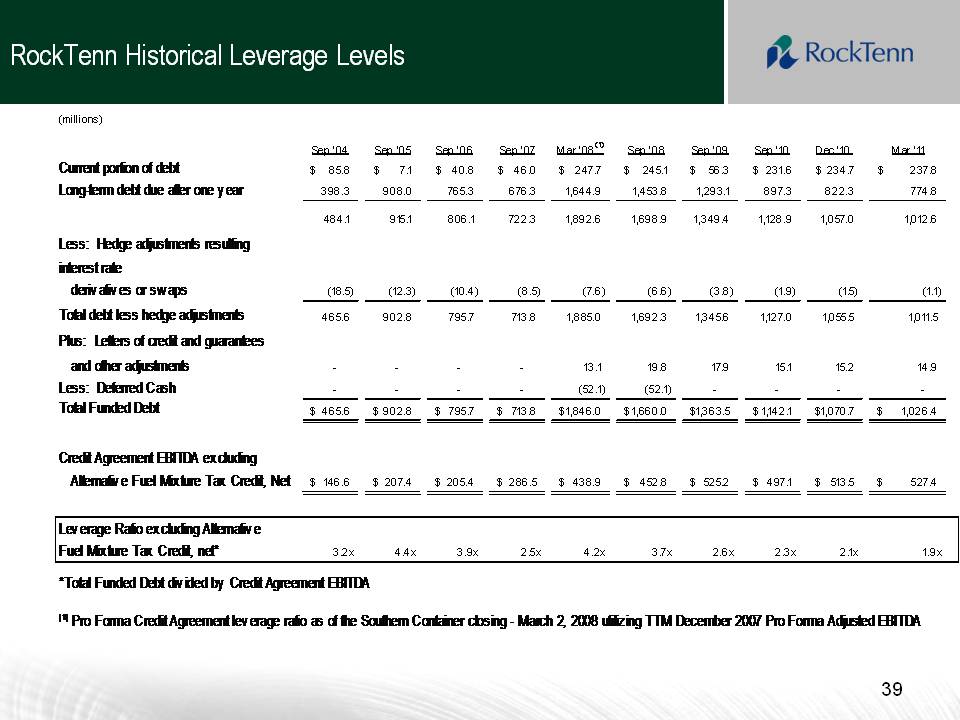
Slide: 39 Other Placeholder: 39 Title: RockTenn Historical Leverage Levels
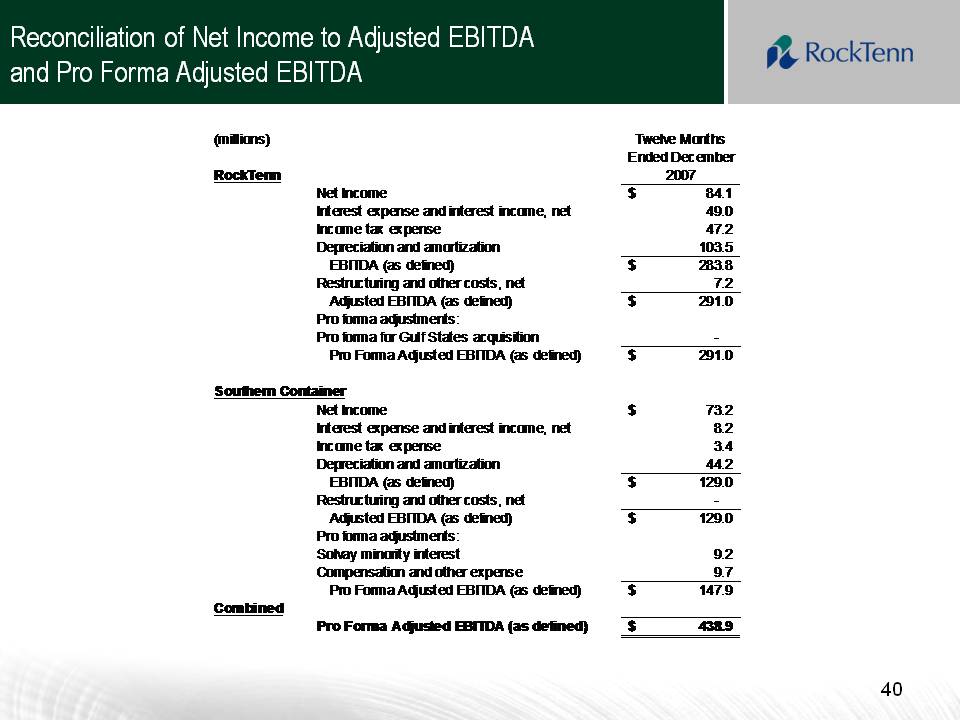
Slide: 40 Other Placeholder: 40 Reconciliation of Net Income to Adjusted EBITDA and Pro Forma Adjusted EBITDA
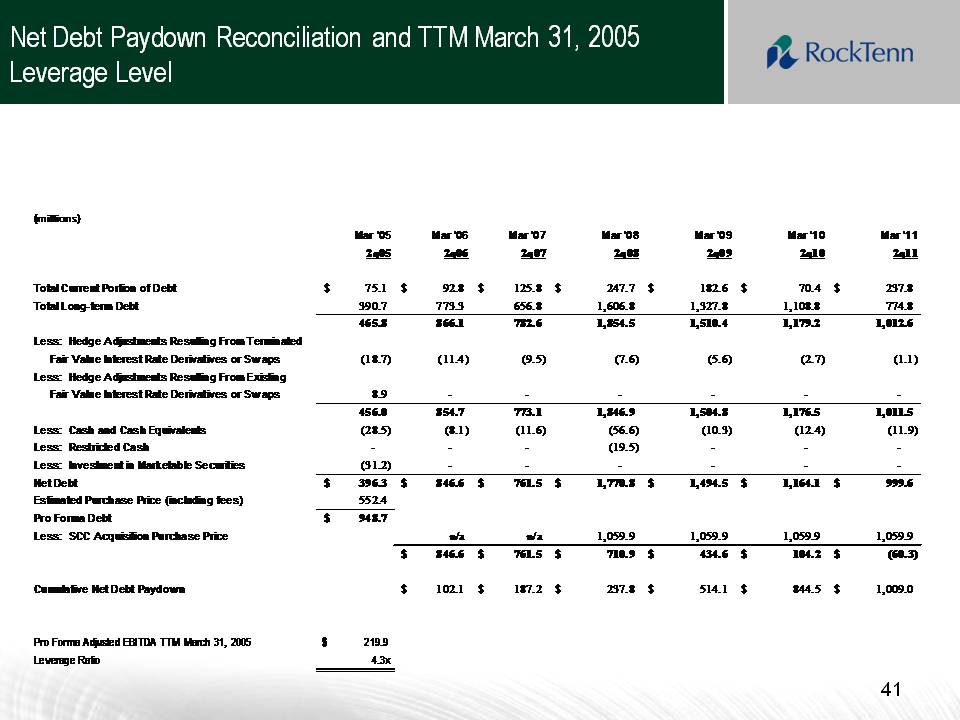
Slide: 41 Other Placeholder: 41 Title: Net Debt Paydown Reconciliation and TTM March 31, 2005 Leverage Level
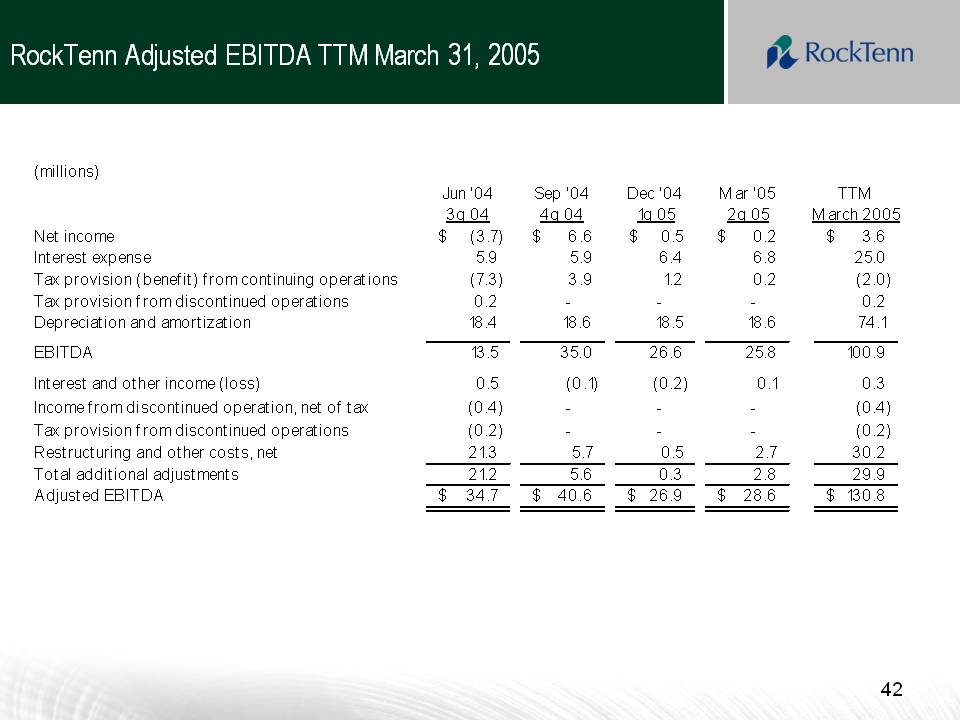
Slide: 42 Other Placeholder: 42 Title: RockTenn Adjusted EBITDA TTM March 31, 2005
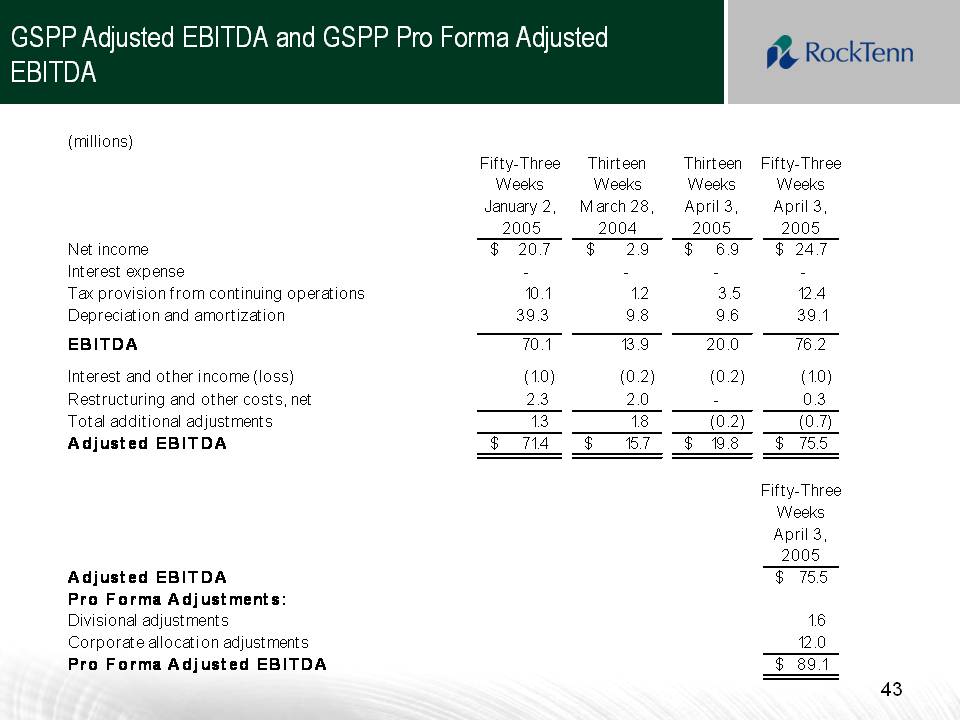
Slide: 43 Other Placeholder: 43 Title: GSPP Adjusted EBITDA and GSPP Pro Forma Adjusted EBITDA
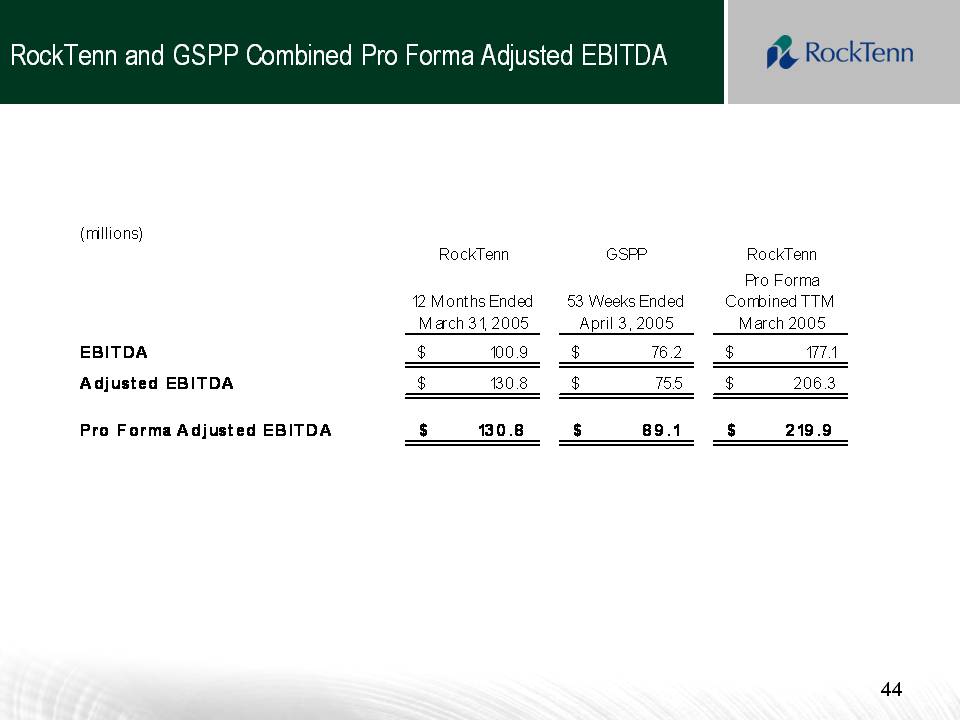
Slide: 44 Other Placeholder: 44 Title: RockTenn and GSPP Combined Pro Forma Adjusted EBITDA