Attached files
| file | filename |
|---|---|
| 8-K - FORM 8-K - Discover Financial Services | d8k.htm |
 Barclays Capital Americas Select Conference
Harit Talwar
President, U.S. Cards
May 24, 2011
Exhibit 99.1 |
 2
Notice
www.discoverfinancial.com.
Certain
reconciliations
are
also
included
at
the
end
of
this
presentation.
The following slides are part of a presentation by Discover Financial Services (the "Company")
and are intended to be viewed as part of that presentation. No representation is made that the
information in these slides is complete.
The information provided herein may include certain non-GAAP financial measures. The
reconciliations of such measures to the comparable GAAP figures are included in the
Company’s Annual Report on Form 10-K for the year ended November 30, 2010 and the
Company’s Current Report on Form 8-K dated March 22, 2011, each of which are on file
with the SEC and available on the Company’s website at
The presentation contains forward-looking statements. You are cautioned not to place undue
reliance on forward-looking statements, which speak only as of the date on which they are
made, which reflect management’s estimates, projections, expectations or beliefs at that
time and which are subject to risks and uncertainties that may cause actual results to differ
materially. For a discussion of certain risks and uncertainties that may affect the future
results of the Company, please see "Special Note Regarding Forward- Looking
Statements," "Risk Factors," "Business – Competition," "Business – Supervision and Regulation" and
"Management’s Discussion and Analysis of Financial Condition and Results of Operations"
in the Company’s Annual Report on Form 10-K for the year ended November 30, 2010 and
"Management’s Discussion and Analysis of Financial Condition and Results of
Operations" in the Company’s Form 10-Q for the quarter ended February 28, 2011,
which are on file with the SEC.
Certain historical financial information about the Company that we have included in this presentation
has been derived from Morgan Stanley’s consolidated financial statements and does not
necessarily reflect what our financial condition, results of operations or cash flows would
have been had we operated as a separate, stand-alone company during the periods presented. We own or have rights to use the
trademarks, trade names and service marks that we use in conjunction with
the
operation
of
our
business,
including,
but
not
limited
to:
Discover
®
,
PULSE
®
,
Cashback
Bonus
®
,
Discover
®
Network
and
Diners
Club
International
®
.
All
other
trademarks,
trade
names
and
service
marks
included
in
this
presentation are the property of their respective owners.
|
 Leverage our Direct Banking and Payments assets to
deliver profitable growth
CONSUMER
DEPOSITS
DISCOVER
CARD
CONSUMER
LOANS
PULSE
DEBIT
NETWORK
DINERS
CLUB
INTERNATIONAL
DISCOVER
NETWORK |
 4
Unique collection of well positioned assets
Note: Balances as of February 28, 2011; volume based on the trailing four
quarters ending 1Q11 •
$44Bn in receivables
•
Leading cash rewards
program
•
1 in 4 U.S. households
•
$22Bn consumer deposits
•
$7.3Bn personal and student
loans
Deposits and Other Lending
Deposits and Other Lending
U.S. Card Issuing
U.S. Card Issuing
•
$125Bn volume
•
4,400+ issuers
•
$104Bn volume
•
30+ issuers
•
$28Bn volume
•
50+ franchises
•
185 countries /
territories |
  5
Profitable long-term growth model
Asset Growth
EPS Growth /
Contribution
Card
2 - 4%
3 - 4%
Other Consumer Lending
20 - 25%
3 - 4%
Payments
NA
2%+/-
Organic Growth
5 - 6%
8 - 10%
Capital Management /
Acquisitions
0 - 4%
2 - 5%
Total Growth
5 - 10%
10 - 15%
Targets:
TCE / TA
(1)
~8%
ROE
15% +
Note(s)
1.
Defined as tangible common equity to tangible assets |
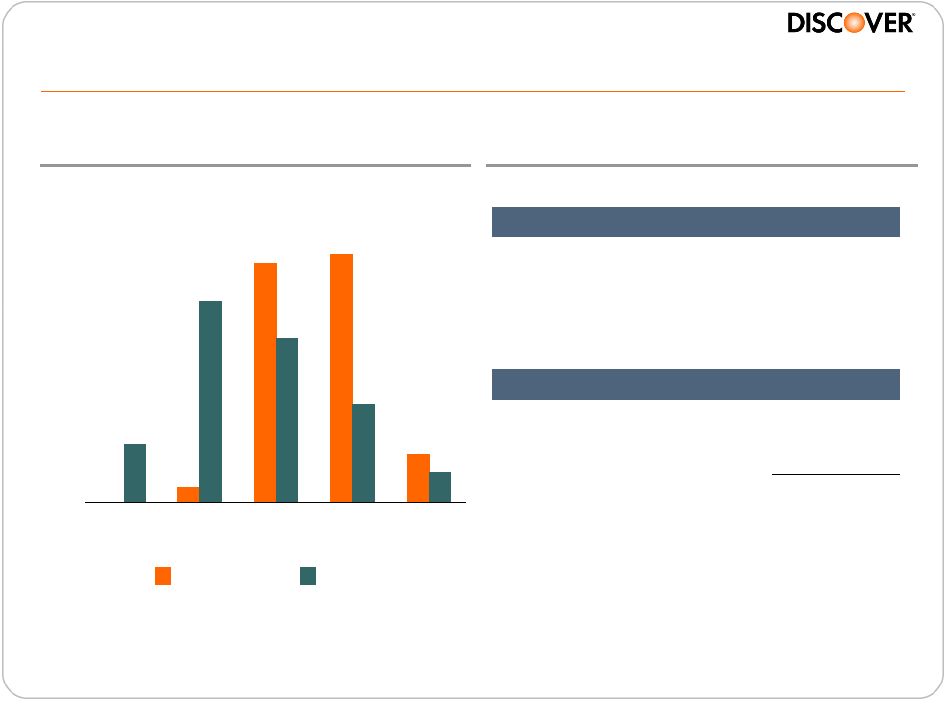
  6
Discover Card -
well positioned for profitable growth
•
Our business is positioned to generate a pre-tax ROA of 2.5%+ and
an ROE of 15%+ on a sustainable basis
•
Outperforming large general purpose card issuers over the last two
years (1Q09-1Q11)
Note(s)
1.
Comparison based on “managed basis”
receivables at March 31, 2009
2.
Calendar year data for sales and receivables
3.
Includes BAC, C, COF, and JPM
Source
Internal data and company filings
•
Strong growth in new accounts
•
Increasing usage and wallet share with existing customers
Sales
Receivables
(1)
1Q11
NCO Rate
Discover
(2)
+14%
-10%
5.96%
Peer Average
(3)
+8%
-20%
7.25% |
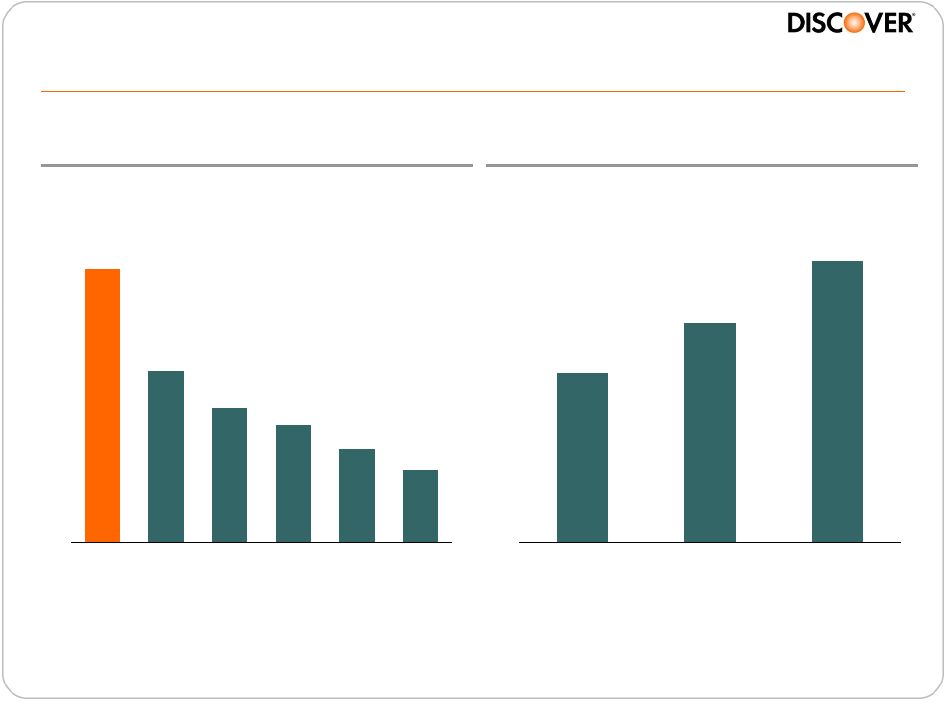
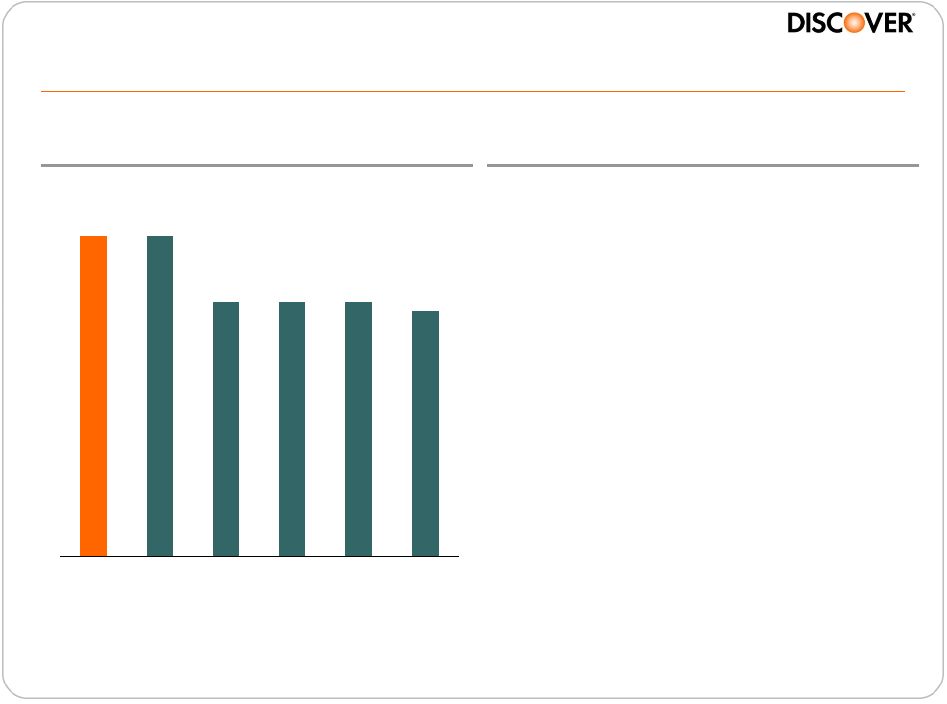 7
79%
79%
72%
72%
72%
71%
DFS
AXP
JPM
C
BAC
COF
Recommend to a Friend
(1)
Source
4Q ‘10 Brand Tracker study, Millward
Brown
Note(s)
1.
% of survey participants who strongly / somewhat agree with the statement “I
would recommend to a friend”; among cardholders who say they use that
brand’s card most often to make purchases
Discover brand resonates strongly with attractive
customer base
Customer Base & Target Profile
Large, seasoned customer base
Large, seasoned customer base
•
Highest average tenure in industry
•
Balanced customer base
–
~40% revolver / 60% transactor
•
Geographically diverse
•
Avg. age 44; avg. HHI $108K
•
75% married
•
74% attended college
•
85%+ own their home |
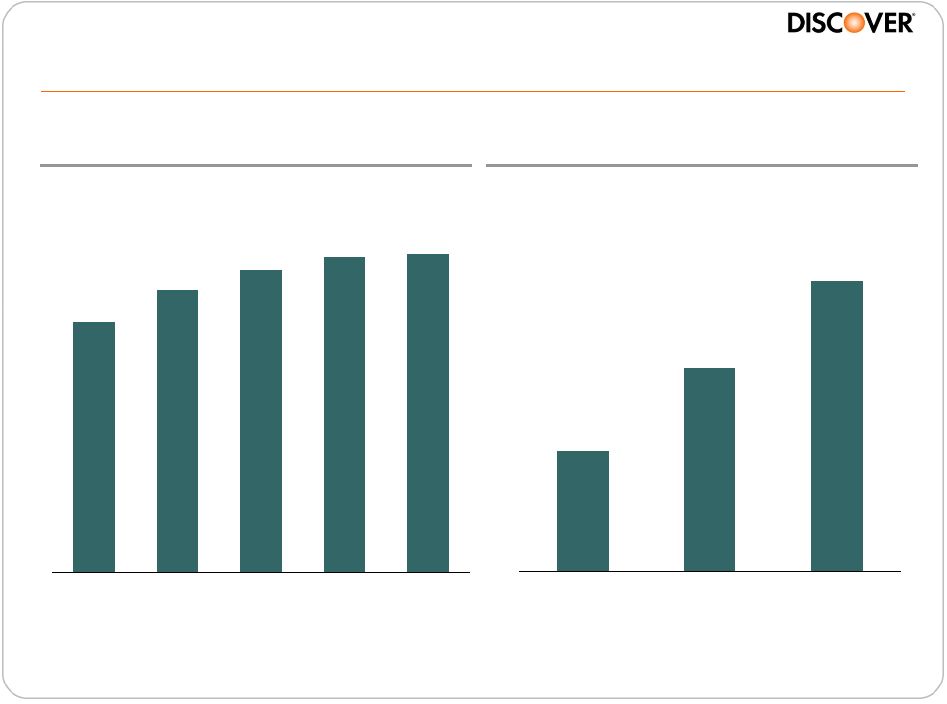
 8
Leading rewards programs driving record levels
of customer engagement
67%
42%
33%
29%
23%
18%
DFS
JPM
AXP
C
COF
BAC
Best Cash Rewards
(1)
Rewards Program
Enrollment (MM)
Source
4Q 2010 Brand Tracker study, Millward Brown
Note(s)
1.
% of unaided cardmembers who identify the brand with the statement “best cash
rewards”; among cardholders who say they use that brand’s card most often to make purchases
14
18
23
2008
2009
2010 |
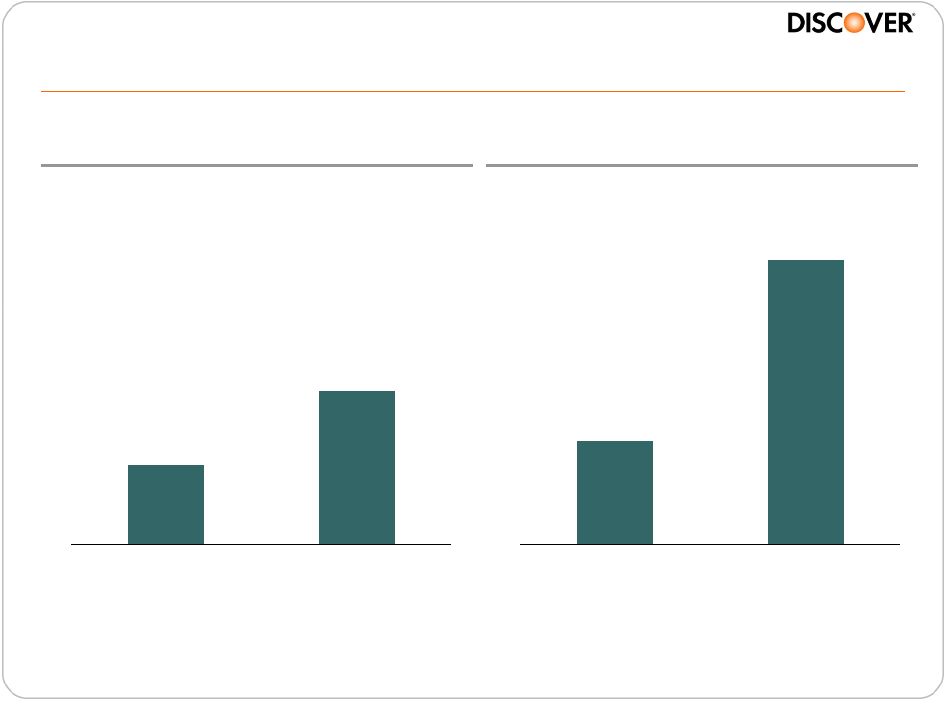
 9
Acceptance and marketing programs driving usage and sales
Sales Impact ($Bn)
(2)
$3.4
$2.4
$1.4
2008
2009
2010
Source
Internal data
Note(s)
1.
U.S. points of sale enabled for Discover acceptance based on internal
analysis 2.
Estimation based upon previously non-accepting and accelerated sign-up of
new merchants
Merchant Outlet Coverage
(1)
76%
86%
92%
96%
97%
2006
2007
2008
2009
2010 |
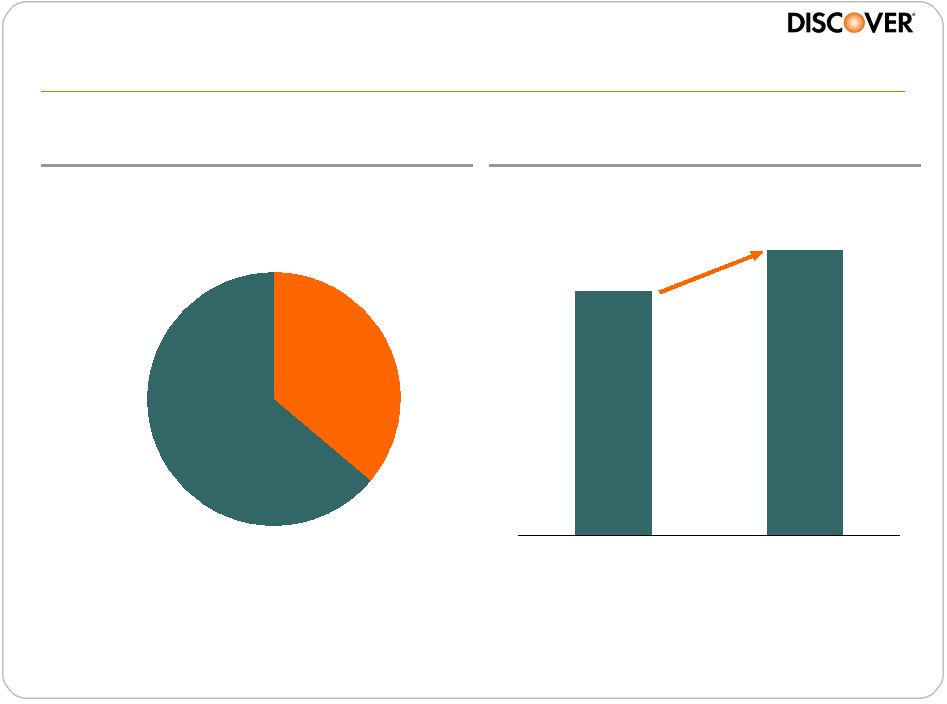
 10
Significantly increasing brand presence
6%
11%
Historical
2010
7%
20%
Historical
2010
Share of
Media Spend
(1)
Share of
Voice
(2)
Source
Nielsen
Note(s)
1.
Share
of
Spend
=
Discover
media
spend
vs.
AXP,
BAC,
C,
COF,
JPM,
V,
MA
2.
Share of Voice = Total Discover media impressions vs. AXP, BAC, C, COF, JPM, V,
MA 3.
Average of 2005-2009
(3)
(3) |
 11
Off-Us
On-Us
Loans
Discover
Opportunity for growth and proven ability to take wallet share
2008
2010
Wallet Share of Loans
16%
Sources
Internal calendar year data and public company data
Note(s)
Loans –
Credit bureau data and internal modeling
“On-Us”
represents
activity with Discover Card; “Off-Us”
represents activity by Discover
Cardmembers
with
other competitors
Wallet Share is the amount of customer loans with Discover vs. other cards in the
wallet; share based upon credit bureau data and internal modeling |
 12
Personal Loans –
natural adjacency with attractive returns
Origination by Credit Score
Industry
Discover
0%
10%
20%
30%
40%
50%
501-
600
601-
700
701-
800
801-
900
901-
990
Source
Industry -
credit bureau data (Vantage); Discover based on analysis of 2010
originations Select 1Q11 Stats
Personal Loans, ending
$2.0Bn
Growth (YOY)
40%
Loan Size, avg.
$16k
% with Discover Card
~75%
Targeted Returns
Net Interest Income
9%
Loss Provision
(4%)
Operating Expenses
(2%)
Target ROA
3%
Overview |
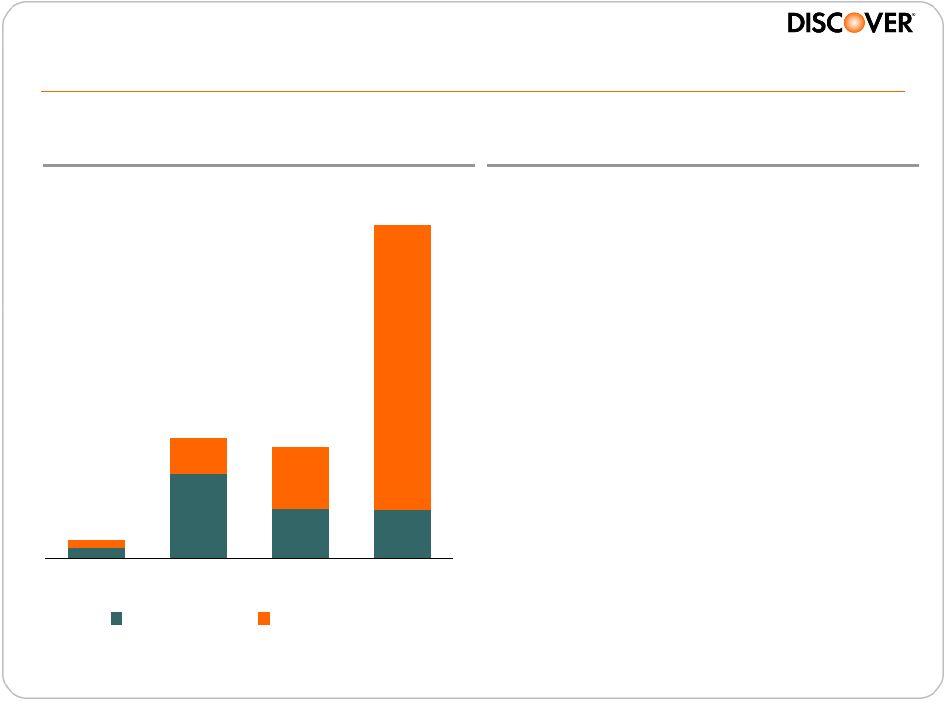 13
Overview
Private Student Loans –
strong growth in an
attractive business
Note(s)
1.
Federal student loan portfolio is held-for-sale as of 11/30/10 and
thereafter 2.
Includes The Student Loan Corporation purchased credit impaired loans and 1Q11
disbursements Student Loan Growth ($Bn)
0.6
1.0
4.5
$0.3
$1.9
$1.8
$5.3
0.8
0.8
1.3
0.2
0.1
2008
2009
2010
1Q11
Federal
Private
•
Asset class with long duration
and relatively low credit losses
•
Conservative underwriting
approach with high co-signer
rate and FICO
•
Acquisition of SLC diversified
total company portfolio
•
Expect to be top 3 originator of
private student loans in 2011
•
Students are an upwardly mobile
customer base offering important
cross-sell opportunity
(1)
(2) |
 14
Acquisition expanded penetration among target schools
SLC
350
Discover is on Preferred Lender List
at 1150 of 1350 Target Schools
Target Schools
200
DSL
250
550
Top School Penetration
(1)
•
83% of top 100 colleges
•
91% of top 50 Business schools
•
90% of top 50 Law schools
•
87% of top 50 Medical schools
Note(s)
1. Incorporates
U.S.
News
&
World
Report
-
Best
Rankings
for
2010 |
 15
Private student loans are on track to deliver targeted returns
Net Interest Income
Loss Provision
Operating Expenses
Target ROA
5%
(1%)
(1.5%)
2.5%
Targeted Returns
•
Integration of The Student Loan
Corporation is on track
•
Targeting net receivable growth of
$1Bn+ in 2011
•
Strong pipeline of repeat business
•
Competitive product set with
opportunities for expansion
•
Increased marketing to Card
customer base and new affinity
partnerships |
 16
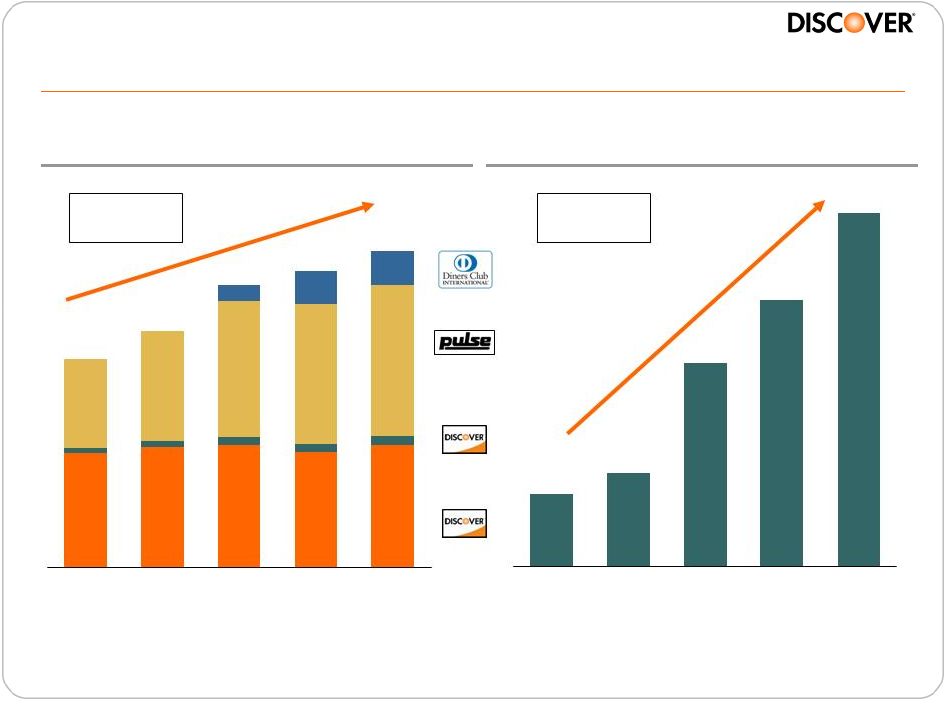
Payment Services –
double-digit volume and profit growth
Volume Growth ($Bn)
Pre-tax Profit ($MM)
Partner
Issuance
Proprietary
2006 –
2010
CAGR: 48%
2006 –
2010
CAGR: 11%
91
96
70
86
106
109
118
13
$163
$186
$221
$232
$248
90
94
96
7
6
6
5
3
26
27
2006
2007
2008
2009
2010
$141
$107
$81
$37
$29
2006
2007
2008
2009
2010 |
 17
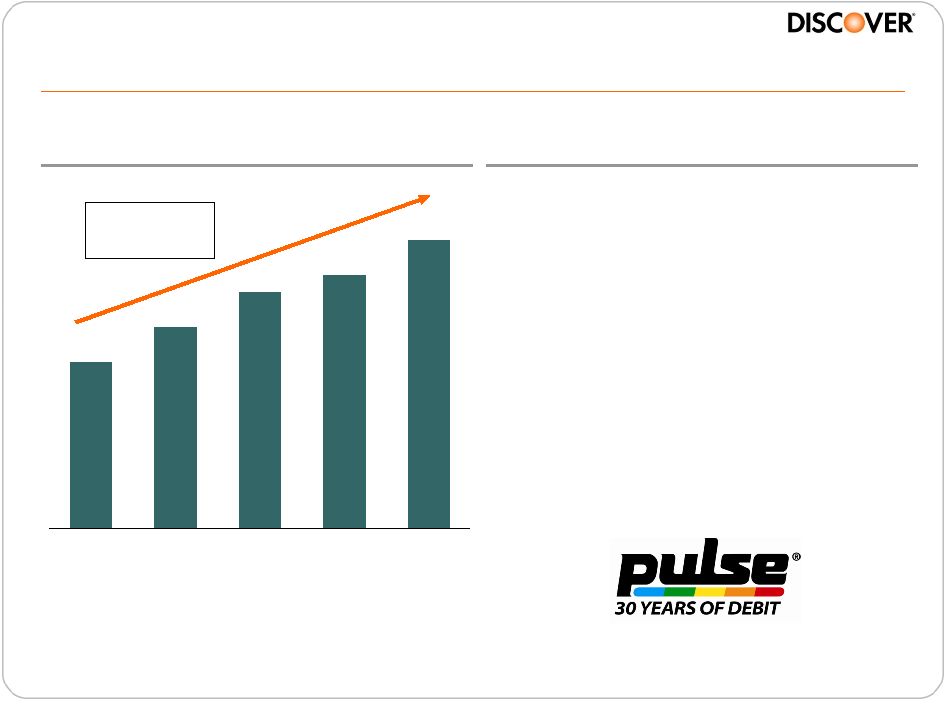
PULSE –
large player and gaining share
3.3
2.9
2.7
2.3
1.9
2006
2007
2008
2009
2010
Transactions (Bn)
2006 –
2010
CAGR: 15%
Overview
•
#3 market share in PIN debit
(1)
•
Strong transaction and volume
growth
•
Expanding international and
domestic ATM acceptance
•
Durbin
-
changes
in
network
participation requirements may
result in redistribution of PIN
debit volume
Note(s)
1.
Based
on
internal
analysis
which
used
the
following
sources:
EFT
Data
Book,
Federal
Reserve
and
SEC
Filings |
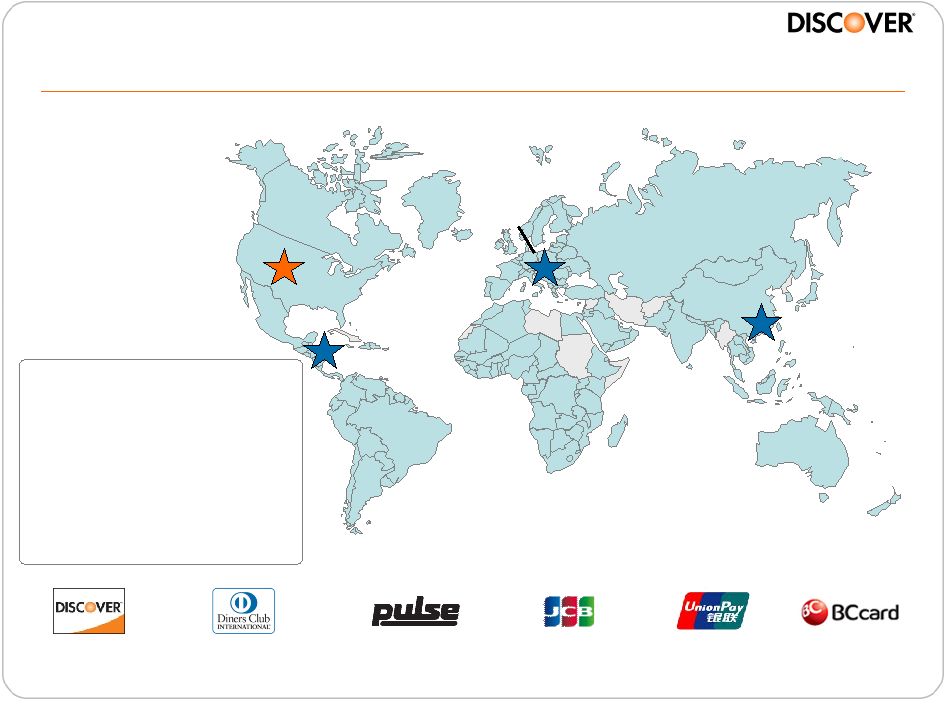 18
•
Complementary networks
with strong global presence
•
Expanding merchant
coverage
•
Operates in over 185
countries / territories
•
Over 780,000 ATMs in more
than 80 countries
Global acceptance footprint
Note(s)
1.
North
America
includes
U.S.,
Canada,
Mexico
&
Caribbean
North America
North America
(1)
(1)
8.1 MM
8.1 MM
EMEA
EMEA
2.0 MM
2.0 MM
Latin America
Latin America
2.3 MM
2.3 MM
Asia Pacific
Asia Pacific
6.2 MM
6.2 MM |
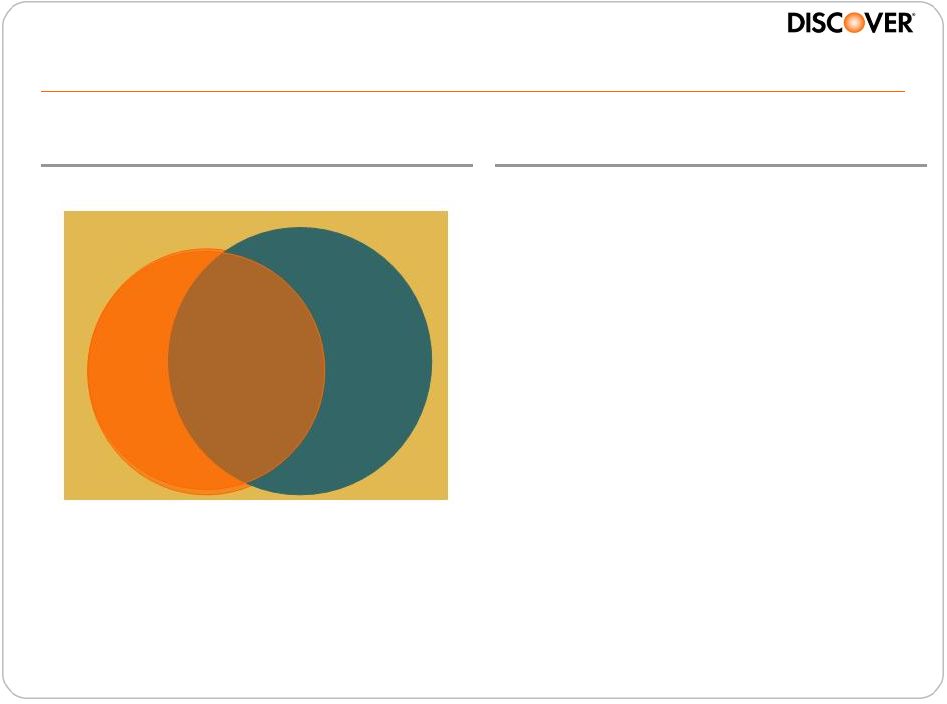
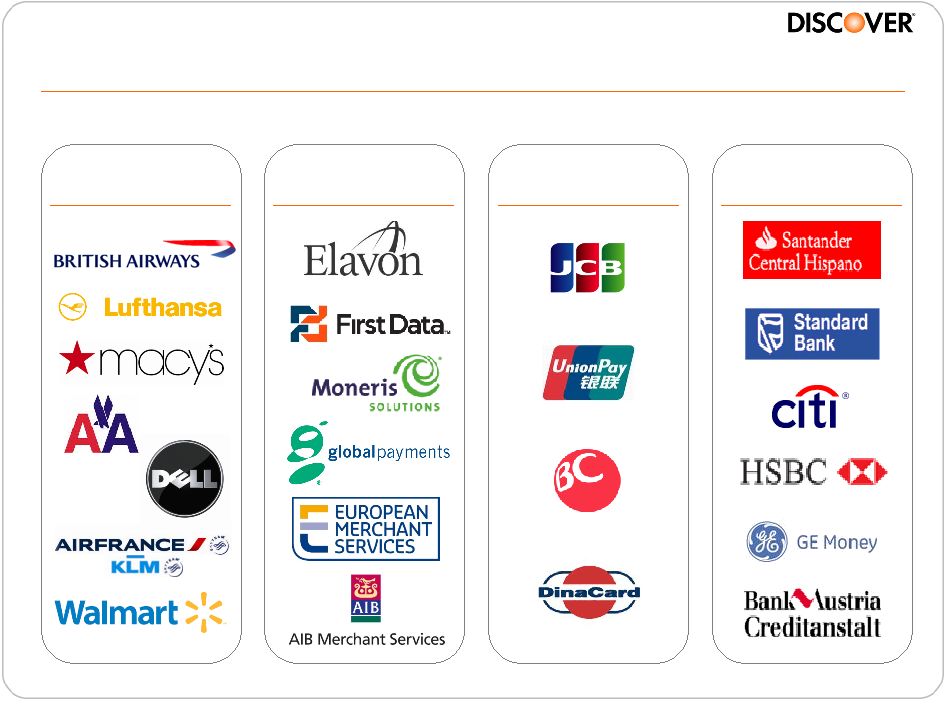 19
Global relationships are a competitive advantage
Merchants
Acquirers
Networks
Issuers |
 20
Financial performance
($ MM, except per share data)
1Q11
1Q10
Net Interest Income
$1,170
$1,145
$25
Other Operating Revenue
563
546
17
Total Revenue
$1,733
$1,691
$42
Provision for Loan Loss
418
1,387
(969)
Total Operating Expense
595
475
120
Pretax Income
$720
($171)
$891
Net Income (Loss)
$465
($104)
$569
ROE
28%
-6%
NM
Total Average Receivables
$51,488
$51,555
($68)
Net Interest Margin
9.22%
9.01%
21bps
YOY
Change |
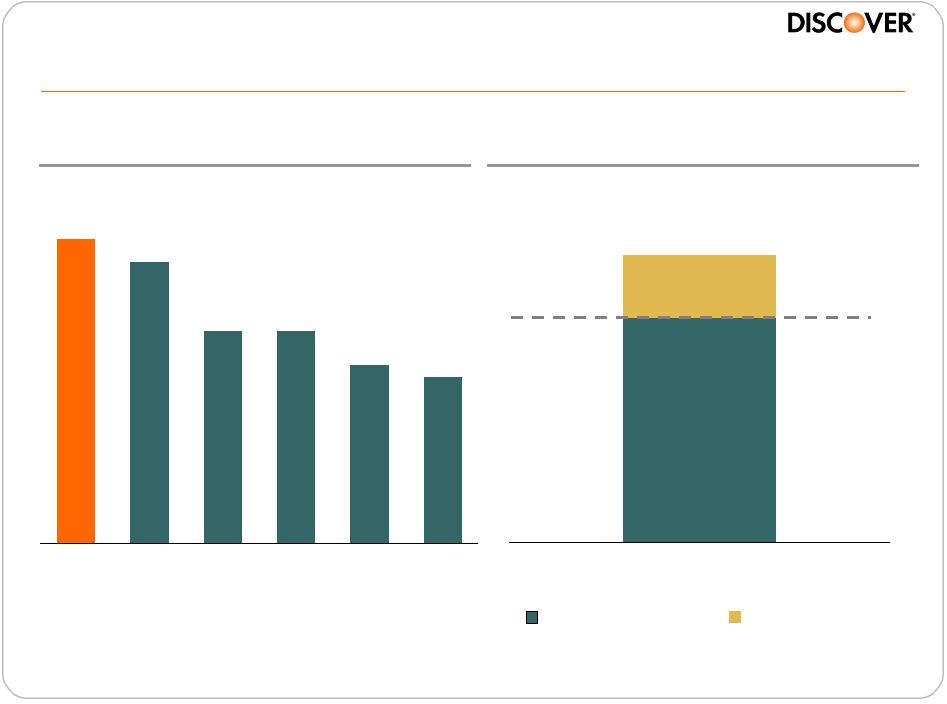 21
Capital position provides flexibility
Note(s)
1.
Tangible common equity to tangible assets; see appendix for Discover
reconciliation 2.
See appendix for reconciliation
$5.1
$1.4
3/31/11
Illustrative Target
Excess Capital
Tangible Common Equity
(2)
(Bn)
8%+/-
Target
10.2%
1Q11 TCE / TA Ratio
(1)
10.2%
9.4%
7.2%
7.1%
6.0%
5.6%
DFS
AXP
C
COF
BAC
JPM
Source
SNL, Regulatory Reports dated 3/31/11 |
 22
Concluding themes
•
Card business generating strong profitability
–
Credit trends provide flexibility to invest for growth
–
Leveraging brand, acceptance and risk management capabilities to
increase wallet share
•
Have continued to diversify our portfolio with the acquisition of The
Student Loan Corporation and expansion of personal loans
–
Other consumer lending receivables are now ~15% of total receivables
–
Leveraging unsecured lending and marketing capabilities to drive
more
rapid asset growth at attractive returns
•
Focused on increasing acceptance globally and exploiting opportunities
in debit and mobile
–
Targeting Payment Services long-term profit growth of 15-20% with 10%+
volume CAGR
•
We continue to generate excess capital and were one of the first
U.S.
financial services companies to restore the dividend
–
Excess capital provides significant flexibility |
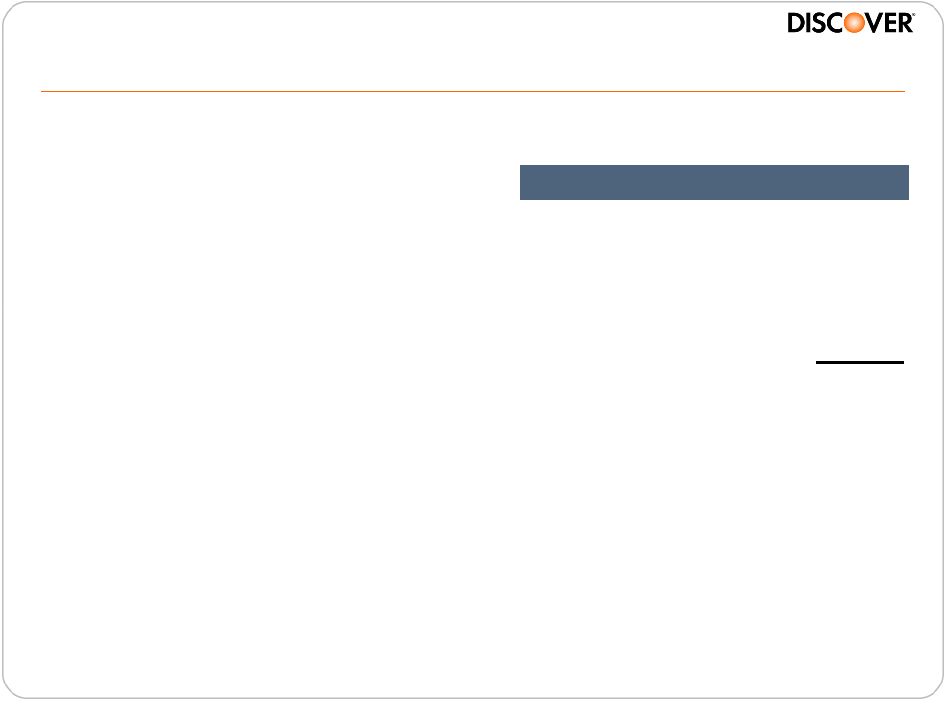
 Using our Direct Banking and Payments assets to deliver
profitable growth
CONSUMER
DEPOSITS
DISCOVER
CARD
CONSUMER
LOANS
PULSE
DEBIT
NETWORK
DINERS
CLUB
INTERNATIONAL
DISCOVER
NETWORK
Harit Talwar
President, U.S. Cards
May 24, 2011 |
 24
Reconciliations
($MM)
3/31/11
Tangible Common Equity Ratio Calculation:
Total Common Equity (TCE)
$7,002
Less: Goodwill and Intangibles
(448)
Tangible Common Equity
$6,554
Total Assets
$64,405
Less: Goodwill and Intangibles
(448)
Tangible Assets (TA)
$63,957
TCE/TA Ratio
10.2%
Note(s)
Tangible common equity ("TCE"), a non-GAAP financial measure, represents common equity
less goodwill and intangibles. A reconciliation of TCE to common equity, a GAAP financial
measure, is shown above. Other financial services companies may also use TCE and definitions may vary, so
we advise users of this information to exercise caution in comparing TCE of different companies.
TCE is included because management believes that common equity excluding goodwill and
intangibles is a more meaningful valuation to investors of the true net asset value of the company. |