Attached files
| file | filename |
|---|---|
| EX-32 - EXHIBIT 32 - URS CORP /NEW/ | ex32.htm |
| EX-31.2 - EXHIBIT 31.2 - URS CORP /NEW/ | ex31-2.htm |
| EX-31.1 - EXHIBIT 31.1 - URS CORP /NEW/ | ex31-1.htm |
| EX-23.1 - EXHIBIT 23.1 - URS CORP /NEW/ | ex23-1.htm |
UNITED STATES
SECURITIES AND EXCHANGE COMMISSION
Washington, D.C. 20549
_________________________
FORM 10-K/A
(Amendment No. 1)
_________________________
| x |
ANNUAL REPORT PURSUANT TO SECTION 13 or 15(d) OF THE SECURITIES EXCHANGE ACT OF 1934
|
For the fiscal year ended December 31, 2010
OR
|
o
|
TRANSITION REPORT PURSUANT TO SECTION 13 or 15(d) OF THE SECURITIES EXCHANGE ACT OF 1934
|
For the transition period from ______ to ______
Commission file number1-7567
_________________________
URS CORPORATION
(Exact name of registrant as specified in its charter)
|
Delaware
|
94-1381538
|
|
|
(State or other jurisdiction of incorporation or organization)
|
(I.R.S. Employer Identification No.)
|
|
|
600 Montgomery Street, 26th Floor
|
||
|
San Francisco, California
|
94111-2728
|
|
|
(Address of principal executive offices)
|
(Zip Code)
|
(415) 774-2700
(Registrant’s telephone number, including area code)
Securities registered pursuant to Section 12(b) of the Act:
|
Title of each class:
|
Name of each exchange on which registered:
|
|
|
Common Shares, par value $.01 per share
|
New York Stock Exchange
|
Securities registered pursuant to Section 12(g) of the Act: None
Indicate by check mark if the registrant is a well-known seasoned issuer, as defined in Rule 405 of the Securities Act.Yes x No o
Indicate by check mark if the registrant is not required to file reports pursuant to Section 13 or 15(d) of the Act.Yes o No x
Indicate by check mark whether the registrant (1) has filed all reports required to be filed by Section 13 or 15(d) of the Securities Exchange Act of 1934 during the preceding 12 months (or for such shorter period that the registrant was required to file such reports), and (2) has been subject to such filing requirements for the past 90 days. Yes x No o
Indicate by check mark whether the registrant has submitted electronically and posted on its corporate web site, if any, every Interactive Data File required to be submitted and posted pursuant to Rule 405 of Regulation S-T during the preceding 12 months (or for such shorter period that the registrant was required to submit and post such files). Yes x No o
Indicate by check mark if disclosure of delinquent filers pursuant to Item 405 of Regulation S-K is not contained herein, and will not be contained, to the best of registrant’s knowledge, in definitive proxy or information statements incorporated by reference in Part III of this Form 10-K or any amendment to this Form 10-K. x
Indicate by check mark whether the registrant is a large accelerated filer, an accelerated filer, a non-accelerated filer, or a smaller reporting company. See definition of “large accelerated filer,” “accelerated filer,” and “smaller reporting company” in Rule 12b-2 of the Exchange Act. (Check one): Large accelerated filer x Accelerated filer o Non-Accelerated filer o Smaller reporting company o
Indicate by check mark whether the registrant is a shell company (as defined in Rule 12b-2 of the Act). Yes o No x
The aggregate market value of the common stock of the registrant held by non-affiliates on February 21, 2011 and July 2, 2010 (the last business day of the registrant’s most recently completed second fiscal quarter) was $3,758.6 million and $3,105.0 million, respectively, based upon the closing sales price of the registrant’s common stock on such dates as reported in the consolidated transaction reporting system. On February 21, 2011, and July 2, 2010, there were 80,629,705 shares and 83,785,472 shares of the registrant’s common stock outstanding, respectively.
Documents Incorporated by Reference
Part III incorporates information by reference from the registrant’s definitive proxy statement for its 2011 Annual Meeting of Stockholders to be filed with the Securities and Exchange Commission.
Explanatory Note
This Amendment No. 1 to our Annual Report on Form 10-K/A for the fiscal year ended December 31, 2010 (this “Form 10-K/A”), originally filed on February 28, 2011 (the “Original Filing”), sets forth the Original Filing in its entirety except that an additional paragraph has been added to Part II, Item 9A, Controls and Procedures, to identify the framework used to evaluate the effectiveness of internal control over financial reporting, which was inadvertently omitted from the Original Filing. We are also filing an updated Consent of Independent Registered Public Accounting Firm at Exhibit 23.1, and corrected and updated certifications from our Chief Executive Officer and Chief Financial Officer at Exhibits 31.1 and 31.2 and an updated certification at Exhibit 32.
No attempt has been made in this Form 10-K/A to modify or update other disclosures presented in the Original Filing, other than updating the exhibit list and, where appropriate, changing references from “Form 10-K” to “Form 10-K/A.” This Form 10-K/A does not reflect events occurring after the filing of the Original Filing or modify or update disclosures, including the exhibits to the Original Filing, affected by subsequent events. Accordingly, this Form 10-K/A should be read in conjunction with our filings made with the Securities and Exchange Commission subsequent to the filing of the Original Filing, including our current and periodic reports.
URS CORPORATION AND SUBSIDIARIES
This Form 10-K/A contains forward-looking statements within the meaning of the Private Securities Litigation Reform Act of 1995. These forward-looking statements may be identified by words such as “anticipate,” “believe,” “estimate,” “expect,” “potential,” “intend,” “may,” “plan,” “predict,” “project,” “will,” and similar terms used in reference to our future revenues, services, project awards and other business trends; future accounting and actuarial estimates; future contract losses; future backlog and book of business conversion; future income tax payments; future stock-based compensation expenses; future bonus, pension and post-retirement expenses; future compliance with regulations; future legal proceedings and accruals; future bonding and insurance coverage; future interest debt payments; future integration costs; future capital expenditures, contractual obligations and commitments; future effectiveness of our disclosure and internal controls over financial reporting and future economic and industry conditions. We believe that our expectations are reasonable and are based on reasonable assumptions, however, we caution against relying on any of our forward-looking statements as such forward-looking statements by their nature involve risks and uncertainties. A variety of factors, including but not limited to the following, could cause our business and financial results, as well as the timing of events, to differ materially from those expressed or implied in our forward-looking statements: declines in client spending; changes in our book of business; our compliance with government contract procurement regulations; integration of acquisitions; employee, agent or partner misconduct; our ability to procure government contracts; liabilities for pending and future litigation; environmental liabilities; availability of bonding and insurance; our reliance on government appropriations; unilateral termination provisions in government contracts; our ability to make accurate estimates and assumptions; our accounting policies; workforce utilization; our and our partners’ ability to bid on, win, perform and renew contracts and projects; liquidated damages; our dependence on partners, subcontractors and suppliers; customer payment defaults; our ability to recover on claims; impact of target and fixed-priced contracts on earnings; the inherent dangers at our project sites; impairment of our goodwill; the impact of changes in laws and regulations; nuclear indemnifications and insurance; expert reports; a decline in defense spending; industry competition; our ability to attract and retain key individuals; retirement plan obligations; our leveraged position and the ability to service our debt; restrictive covenants in our credit agreement; risks associated with international operations; business activities in high security risk countries; third-party software risks; natural and man-made disaster risks; our relationships with labor unions; our ability to protect our intellectual property rights; anti-takeover risks and other factors discussed more fully in Management’s Discussion and Analysis of Financial Condition and Results of Operations beginning on page 39, Risk Factors beginning on page 17, as well as in other reports subsequently filed from time to time with the United States Securities and Exchange Commission. We assume no obligation to revise or update any forward-looking statements.
1
| Item 1. | ||
| Item 1A. | ||
| Item 1B. | ||
| Item 2. | ||
| Item 3. | ||
| Item 4. | ||
|
PART II
|
||
| Item 5. | ||
| Item 6. | ||
| Item 7. | ||
| Item 7A. | ||
|
PART III
|
||
|
PART IV
|
||
2
Summary
We are a leading international provider of engineering, construction and technical services. We offer a broad range of program management, planning, design, engineering, construction and construction management, operations and maintenance, and decommissioning and closure services to public agencies and private sector clients around the world. We also are a major United States (“U.S.”) federal government contractor in the areas of systems engineering and technical assistance, and operations and maintenance. We have approximately 47,000 employees in a global network of offices and contract-specific job sites in more than 40 countries.
We provide our services through three reporting segments, which we refer to as our Infrastructure & Environment, Federal Services and Energy & Construction businesses. Our Infrastructure & Environment business provides a wide range of program management, planning, design, engineering, construction and construction management, and operations and maintenance services to a variety of U.S. and international government agencies and departments, as well as to private sector clients. Our Federal Services business provides program management, planning, systems engineering and technical assistance, construction and construction management, operations and maintenance, and decommissioning and closure services to U.S. federal government agencies, primarily the Departments of Defense (“DOD”), the National Aeronautics and Space Administration (“NASA”), and the Department of Homeland Security (“DHS”). Our Energy & Construction business provides program management, planning, design, engineering, construction and construction management, operations and maintenance, and decommissioning and closure services to U.S. and international government agencies and departments, as well as to private sector clients.
On September 10, 2010, we completed the acquisition of Scott Wilson Group plc. (“Scott Wilson”), a United Kingdom (“U.K.”)-based infrastructure engineering and design firm with approximately 5,500 employees in a network of 80 offices worldwide. The acquisition has expanded our capabilities in the U.K. infrastructure market and in other key markets and regions around the world. At the close of the transaction, Scott Wilson’s operations became part of our Infrastructure & Environment business.
For information on our business by segment and geographic region, please refer to Note 15, “Segment and Related Information” to our “Consolidated Financial Statements and Supplementary Data,” which is included under Item 8 of this report and incorporated into this Item by reference. For information on risks related to our business, segments and geographic regions, including risks related to foreign operations, please refer to Item 1A, “Risk Factors” of this report.
Clients, Market Sectors and Services
We serve public agencies and private sector companies worldwide through our global network of offices including locations in the Americas, the U.K., continental Europe, the Middle East, India, China, Australia and New Zealand. Our clients include U.S. federal government agencies, national governments of other countries, state and local government agencies both in the U.S. and in other countries, and private sector clients representing a broad range of industries. See Note 15, “Segment and Related Information,” to our “Consolidated Financial Statements and Supplementary Data” included under Item 8 for financial information regarding geographic areas.
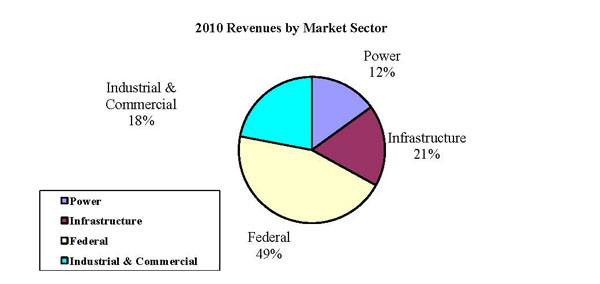
Our expertise is focused in four market sectors: power, infrastructure, federal, and industrial and commercial. Within these markets, we offer a broad range of services, including program management; planning, design and engineering; systems engineering and technical assistance; construction and construction management; operations and maintenance; and decommissioning and closure.
The following chart and table illustrate the percentage of our revenues by market sector for the year ended December 31, 2010, and representative services we provide in each of these markets.
|
Market Sector
|
|||||||||
|
Representative Services
|
Power
|
Infrastructure
|
Federal
|
Industrial &
Commercial
|
|||||
|
Program Management
|
ü
|
ü
|
ü
|
ü
|
|||||
|
Planning, Design and Engineering
|
ü
|
ü
|
ü
|
ü
|
|||||
|
Systems Engineering and Technical Assistance
|
— | — |
ü
|
— | |||||
|
Construction and Construction Management
|
ü
|
ü
|
ü
|
ü
|
|||||
|
Operations and Maintenance
|
ü
|
ü
|
ü
|
ü
|
|||||
|
Decommissioning and Closure
|
ü
|
— |
ü
|
ü
|
|||||
|
ü
|
the service is provided in the market sector.
|
|
—
|
the service is not provided in the market sector.
|
Market Sectors
The following table summarizes the primary market sectors served by our three businesses for the year ended December 31, 2010.
|
Business
|
|||||||
|
Market Sector
|
Infrastructure &
Environment
|
Federal Services
|
Energy &
Construction
|
||||
|
Power
|
ü
|
— |
ü
|
||||
|
Infrastructure
|
ü
|
— |
ü
|
||||
|
Federal
|
ü
|
ü
|
ü
|
||||
|
Industrial & Commercial
|
ü
|
— |
ü
|
||||
|
ü
|
a primary market sector for the business.
|
|
—
|
not a primary market sector for the business.
|
Power
We plan, design, engineer, construct, retrofit and maintain a wide range of power-generating facilities, as well as the systems that transmit and distribute electricity. Our services include planning, siting and licensing, permitting, engineering, procurement, construction and construction management, facility start-up, operations and maintenance, upgrades and modifications, and decommissioning and closure. We provide these services to utilities, industrial co-generators, independent power producers, original equipment manufacturers and government utilities. We also specialize in the development and installation of clean air technologies that reduce emissions at both new and existing fossil fuel power plants. These technologies help power-generating facilities comply with air quality regulations.
Our project expertise in our power market sector encompasses services related to the following:
|
·
|
Fossil fuel power generating facilities;
|
|
·
|
Nuclear power generating facilities;
|
|
·
|
Hydroelectric power generating facilities;
|
|
·
|
Alternative and renewable energy sources, including biomass, geothermal, solar energy and wind systems;
|
|
·
|
Transmission and distribution systems; and
|
|
·
|
Emissions control systems.
|
Infrastructure
We provide a broad range of the services required to build, expand and modernize infrastructure, including surface, air and rail transportation networks; ports and harbors; water supply, treatment and conveyance systems; and many types of facilities. We serve as the program manager, planner, architect, engineer, general contractor, constructor and/or construction manager for a wide variety of infrastructure projects, and we also provide operations and maintenance services when a project has been completed.
Our clients in our infrastructure market sector include local municipalities, community planning boards, state and municipal departments of transportation and public works, transit authorities, water and wastewater authorities, environmental protection agencies, school boards and authorities, colleges and universities, judiciary agencies, hospitals, ports and harbors authorities and owners, airport authorities and owners, and airline carriers.
Our project expertise in our infrastructure market sector encompasses services related to the following:
|
·
|
Highways, interchanges, bridges, tunnels and toll road facilities;
|
|
·
|
Intelligent transportation systems, such as traffic management centers;
|
|
·
|
Airport terminals, hangars, cargo facilities and people movers;
|
|
·
|
Air traffic control towers, runways, taxiways and aircraft fueling systems;
|
|
·
|
Baggage handling, baggage screening and other airport security systems;
|
|
·
|
Light rail, subways, bus rapid transit systems, commuter/intercity railroads, heavy rail and high-speed rail systems;
|
|
·
|
Rail transportation structures, including terminals, stations, multimodal facilities, parking facilities, bridges and tunnels;
|
|
·
|
Piers, wharves, seawalls, recreational marinas and small craft harbors;
|
|
·
|
Container terminals, liquid and dry bulk terminals and storage facilities;
|
|
·
|
Water supply, storage, distribution and treatment systems;
|
|
·
|
Municipal wastewater treatment and sewer systems;
|
|
·
|
Levees, watershed and stormwater management, flood control systems and coastal restoration;
|
|
·
|
Education, judicial, correctional, healthcare, retail, sports and recreational facilities; and
|
|
·
|
Industrial, manufacturing, research and office facilities.
|
Federal
As a major contractor to the U.S. federal government and national governments of other countries, we serve a wide variety of government departments and agencies, including the DOD, DHS, Department of Energy (“DOE”), as well as the General Services Administration, the Environmental Protection Agency, the National Aeronautics and Space Administration and other federal agencies. We also serve departments and agencies of other national governments, such as the U.K. Nuclear Decommissioning Authority (“NDA”). Our services range from program management; planning, design and engineering; and systems engineering and technical assistance to construction and construction management; operations and maintenance; and decommissioning and closure.
We modernize weapons systems, refurbish military vehicles and aircraft, train pilots and manage military and other government installations. We provide logistics support for military operations and help decommission former military bases for redevelopment. In the area of global threat reduction, we support programs to eliminate nuclear, chemical and biological weapons, and we assist the DOE and other nuclear regulatory agencies outside the U.S. in the management of complex programs and facilities.
Our project expertise in our federal market sector encompasses the following:
|
·
|
Operation and maintenance of complex government installations, including military bases and test ranges;
|
|
·
|
Logistics support for government supply and distribution networks, including warehousing, packaging, delivery and traffic management;
|
|
·
|
Weapons system design, maintenance and modernization, including acquisition support for new defense systems, and engineering and technical assistance for the modernization of existing systems;
|
|
·
|
Maintenance planning to extend the service life of weapons systems and other military equipment;
|
|
·
|
Maintenance, modification and overhaul of military aircraft and ground vehicles;
|
|
·
|
Training military pilots;
|
|
·
|
Management and operations and maintenance services for complex DOE and NDA programs and facilities;
|
|
·
|
Deactivation, decommissioning and disposal of nuclear weapons stockpiles and other nuclear waste;
|
|
·
|
Safety analyses for high-hazard facilities and licensing for DOE sites;
|
|
·
|
Threat assessments of public facilities and the development of force protection and security systems;
|
|
·
|
Planning and conducting emergency preparedness exercises;
|
|
·
|
First responder training for the military and other government agencies;
|
|
·
|
Management and operations and maintenance of chemical agent and chemical weapon disposal facilities;
|
|
·
|
Installation of monitoring technology to detect the movement of nuclear and radiological materials across national borders;
|
|
·
|
Planning, design and construction of aircraft hangars, barracks, military hospitals and other government buildings; and
|
|
·
|
Environmental remediation and restoration for the redevelopment of military bases and other government installations.
|
Industrial & Commercial
We provide a wide range of engineering, procurement and construction services for new industrial and commercial infrastructure and process facilities and the expansion, modification and upgrade of existing facilities. These services include front-end studies, engineering and process design, procurement, construction and construction management, facility management, and operations and maintenance. Our expertise also includes due diligence, permitting, compliance, environmental management, pollution control, health and safety, waste management and hazardous waste remediation. For facilities that are no longer in use, we provide site decommissioning and closure services.
Our industrial and commercial clients represent a broad range of industries, including automotive, chemical, consumer products, pharmaceutical, manufacturing, mining, power, oil and gas, and pipelines. Over the past several years, many of these companies have reduced the number of service providers they use, selecting larger, global multi-service contractors, like URS, in order to control overhead costs.
Our project expertise in our industrial and commercial market sector encompasses services related to the following:
|
·
|
Oil and gas refineries, processing and storage facilities, and pipelines;
|
|
·
|
Biotechnology and pharmaceutical research laboratories, pilot plants and production facilities;
|
|
·
|
Petrochemical, specialty chemical and polymer facilities;
|
|
·
|
Consumer products and food and beverage production facilities;
|
|
·
|
Automotive and other manufacturing facilities;
|
|
·
|
Pulp and paper production facilities; and
|
|
·
|
Mines and mining facilities for base and precious metals, industrial minerals and energy fuels.
|
Representative Services
We provide program management; planning, design and engineering; systems engineering and technical assistance; construction and construction management; operations and maintenance; and decommissioning and closure services to U.S. federal government agencies, national governments of other countries, state and local government agencies both in the U.S. and overseas, and private sector clients representing a broad range of industries. Although we are typically the prime contractor, in some cases, we provide services as a subcontractor or through joint ventures or partnership agreements with other service providers.
The following table summarizes the services provided by our businesses for the year ended December 31, 2010.
|
Business
|
|||||||
|
Services
|
Infrastructure & Environment
|
Federal Services
|
Energy &
Construction
|
||||
|
Program Management
|
ü
|
ü
|
ü
|
||||
|
Planning, Design and Engineering
|
ü
|
ü
|
ü
|
||||
|
Systems Engineering and Technical Assistance
|
— |
ü
|
— | ||||
|
Construction and Construction Management
|
ü
|
ü
|
ü
|
||||
|
Operations and Maintenance
|
ü
|
ü
|
ü
|
||||
|
Decommissioning and Closure
|
ü
|
ü
|
ü
|
||||
|
ü
|
the business provides the listed service.
|
|
—
|
the business does not provide the listed service.
|
Program Management. We provide the technical and administrative services required to manage, coordinate and integrate the multiple and concurrent assignments that comprise a large program – from conception through completion. For large military programs, which typically involve naval, ground, vessel and airborne platforms, our program management services include logistics planning, acquisition management, risk management of weapons systems, safety management and subcontractor management. We also provide program management services for large capital improvement programs, which typically involve the oversight of a wide variety of activities ranging from planning, coordination, scheduling and cost control to design, construction and commissioning.
Planning, Design and Engineering. The planning process is typically used to develop a blueprint or overall scheme for a project. Based on the project requirements identified during the planning process, detailed engineering drawings and calculations are developed, which may include material specifications, construction cost estimates and schedules. Our planning, design and engineering services include the following:
|
·
|
Master planning;
|
|
·
|
Land-use planning;
|
|
·
|
Transportation planning;
|
|
·
|
Technical and economic feasibility studies;
|
|
·
|
Environmental impact assessments;
|
|
·
|
Project development/design;
|
|
·
|
Permitting;
|
|
·
|
Quality assurance and validation;
|
|
·
|
Integrated safety management and analysis;
|
|
·
|
Alternative design analysis;
|
|
·
|
Conceptual and final design documents;
|
|
·
|
Technical specifications; and
|
|
·
|
Process engineering and design.
|
We provide planning, design and engineering services for the construction of new transportation projects and for the renovation and expansion of existing transportation infrastructure, including bridges, highways, roads, airports, mass transit systems and railroads, and ports and harbors. We also plan and design many types of facilities, such as schools, courthouses and hospitals; power generation, industrial and commercial facilities; waste treatment and disposal facilities; water supply and conveyance systems and wastewater treatment plants; and corporate offices and retail outlets. Our planning, design and engineering capabilities also support homeland security and global threat reduction programs; hazardous and radioactive waste clean-up activities at government sites and facilities; and environmental assessment, due diligence and permitting at government, commercial and industrial facilities. We also provide planning, design and engineering support to U.S. federal government clients for major research and development projects, as well as for technology development and deployment.
Systems Engineering and Technical Assistance. We provide a broad range of systems engineering and technical assistance to all branches of the U.S. military for the design and development of new weapons systems and the modernization of aging weapons systems. We have the expertise to support a wide range of platforms including aircraft and helicopters, tracked and wheeled vehicles, ships and submarines, shelters and ground support equipment. Representative systems engineering and technical assistance services include the following:
|
·
|
Defining operational requirements and developing specifications for new weapons systems;
|
|
·
|
Reviewing hardware and software design data; and
|
|
·
|
Developing engineering documentation for these systems.
|
We support a number of activities including technology insertion, system modification, installation of new systems/equipment, design of critical data packages, and configuration management.
Construction and Construction Management Services. We provide construction contracting and construction management services for projects involving transportation, environmental and waste management, power generation and transmission, industrial and manufacturing facilities, water resources and wastewater treatment, government buildings and facilities, and mining projects. As a contractor, we are responsible for the construction and completion of a project in accordance with its specifications and contracting terms. In this capacity, we often manage the procurement of materials, equipment and supplies; directly supervise craft labor; and manage and coordinate subcontractors. Our services typically include the following:
|
·
|
Procuring specified materials and equipment;
|
|
·
|
Managing project logistics;
|
|
·
|
Supervising and completing physical construction;
|
|
·
|
Managing project milestone and completion schedules;
|
|
·
|
Managing project cost controls and accounting;
|
|
·
|
Negotiating and expediting change orders;
|
|
·
|
Administering job site safety, security and quality control programs; and
|
|
·
|
Preparing and delivering as-built drawings.
|
As a construction manager, we serve as the client’s representative to ensure compliance with design specifications and contract terms. In performing these services, we may purchase equipment and materials on behalf of the client; monitor the progress, cost and quality of construction projects in process and oversee and coordinate the activities of construction contractors. Our services typically include the following:
|
·
|
Contract administration;
|
|
·
|
Change order management;
|
|
·
|
Cost and schedule management;
|
|
·
|
Safety program and performance monitoring;
|
|
·
|
Inspection;
|
|
·
|
Quality control and quality assurance;
|
|
·
|
Document control; and
|
|
·
|
Claims and dispute resolution.
|
Operations and Maintenance. We provide operations and maintenance services in support of large military installations and operations, and hazardous facilities, as well as for transportation systems, industrial and manufacturing facilities, and mining operations. Our services include the following:
|
·
|
Management of military base logistics, including overseeing the operation of government warehousing and distribution centers, as well as government property and asset management;
|
|
·
|
Maintenance, modification, overhaul and life service extension services for military vehicles, vessels and aircraft;
|
|
·
|
Management, maintenance and operation of chemical agent and chemical weapons disposal systems;
|
|
·
|
Comprehensive military flight training services;
|
|
·
|
Development and maintenance of high-security systems;
|
|
·
|
Management of high-risk, technically complex chemical and nuclear processing facilities;
|
|
·
|
Integrated facilities and logistics management for industrial and manufacturing facilities;
|
|
·
|
Toll road, light rail and airport operations;
|
|
·
|
Operating mine and metal and mineral processing facilities; and
|
|
·
|
Other miscellaneous services such as staffing, repair, renovation, predictive and preventive maintenance, and health and safety services.
|
Decommissioning and Closure. We provide decommissioning and closure services for nuclear power plants, nuclear research and test facilities, production sites and laboratories. Many of these facilities have been highly contaminated and contain significant inventories of chemical and nuclear materials. We also provide decommissioning and closure services for the DOD at chemical weapons depots and for military installations under the DOD’s Base Realignment and Closure program, as well as for industrial facilities and mining operations. Our services include the following:
|
·
|
Planning, scoping surveys and cost estimating;
|
|
·
|
Due diligence and permitting;
|
|
·
|
Environmental remediation;
|
|
·
|
Hazardous chemical and nuclear waste stabilization treatment and disposition;
|
|
·
|
Construction/demolition management; and
|
|
·
|
Redevelopment and reuse.
|
Major Customers
Our largest clients are from our federal market sector. Within this sector, we have multiple contracts with our two major customers: the U.S. Army and DOE. For the purpose of analyzing revenues from major customers, we do not consider the combination of all federal departments and agencies as one customer. The different federal agencies manage separate budgets. As such, reductions in spending by one federal agency do not affect the revenues we could earn from another federal agency. In addition, the procurement processes for federal agencies are not centralized, and procurement decisions are made separately by each federal agency. The loss of the federal government, the U.S. Army, or DOE as clients, would have a material adverse effect on our business; however, we are not dependent on any single contract on an ongoing basis. We believe that the loss of any single contract would not have a material adverse effect on our business.
Our revenues from the U.S. Army and DOE by business for the years ended December 31, 2010, January 1, 2010, and January 2, 2009 are presented below:
|
Year Ended
|
||||||||||||
|
(In millions, except percentages)
|
December 31,
2010
|
January 1,
2010
|
January 2,
2009
|
|||||||||
|
The U.S. Army (1)
|
||||||||||||
|
Infrastructure & Environment
|
$ | 167.0 | $ | 145.0 | $ | 110.1 | ||||||
|
Federal Services
|
1,408.7 | 1,403.1 | 1,407.1 | |||||||||
|
Energy & Construction
|
346.6 | 117.3 | 121.8 | |||||||||
|
Total U.S. Army
|
$ | 1,922.3 | $ | 1,665.4 | $ | 1,639.0 | ||||||
|
Revenues from the U.S. Army as a percentage of our consolidated revenues
|
21 | % | 18 | % | 16 | % | ||||||
|
DOE
|
||||||||||||
|
Infrastructure & Environment
|
$ | 7.2 | $ | 9.5 | $ | 12.4 | ||||||
|
Federal Services
|
13.7 | 37.4 | 64.9 | |||||||||
|
Energy & Construction
|
1,182.6 | 785.3 | 472.1 | |||||||||
|
Total DOE
|
$ | 1,203.5 | $ | 832.2 | $ | 549.4 | ||||||
|
Revenues from DOE as a percentage of our consolidated revenues
|
13 | % | 9 | % | 5 | % | ||||||
|
Revenues from the federal market sector as a percentage of our consolidated revenues
|
49 | % | 45 | % | 35 | % | ||||||
|
(1)
|
The U.S. Army includes U.S. Army Corps of Engineers.
|
Competition
Our industry is highly fragmented and intensely competitive. Our competitors are numerous, ranging from small private firms to multi-billion dollar companies. The technical and professional aspects of our services generally do not require large upfront capital expenditures and, therefore, provide limited barriers against new competitors. Some of our competitors have achieved greater market penetration in some of the markets in which we compete and have substantially more financial resources and/or financial flexibility than we do. To our knowledge, no individual company currently dominates any significant portion of our markets.
We believe that we are well positioned to compete in our markets because of our reputation, our cost effectiveness, long-term client relationships, extensive network of offices, employee expertise, and broad range of services. In addition, as a result of our national and international network of offices and contract-specific job sites in more than 40 countries, we can offer our government and private sector clients localized knowledge and expertise that is backed by the support of our worldwide professional staff.
Our Infrastructure & Environment, Federal Services, and Energy & Construction businesses operate in similar competitive environments. All three businesses compete based on performance, reputation, expertise, price, technology, customer relationships and a range of service offerings. In addition, our Infrastructure & Environment and Energy & Construction businesses compete through domestic and international office networks. The competitors for each of our businesses are numerous, ranging from small private firms to multi-billion dollar companies. The primary competitors of our Infrastructure & Environment business include AECOM Technology Corporation, CH2M HILL Companies, Ltd., Fluor Corporation, Jacobs Engineering Group Inc., Tetra Tech, Inc., and The Shaw Group Inc. The primary competitors of our Federal Services business include Bechtel Corporation, Computer Sciences Corporation, DynCorp International LLC, ITT Corporation, KBR, Inc., L-3 Communications Corporation, Northrop Grumman Corporation, Parsons and Science Applications International Corporation. The primary competitors of our Energy & Construction business include AMEC, Bechtel Corporation, Black & Veatch Corporation, CH2M HILL Companies, Ltd., EnergySolutions, Inc., Foster-Wheeler Corporation, Fluor Corporation, Granite Construction Company, Jacobs Engineering Group Inc., KBR, Inc., Kiewit Corporation, Skanska, The Babcock & Wilcox Company, The Shaw Group Inc and Worley Parsons, Ltd.
Book of Business
For the purpose of calculating our book of business, we determine the amounts of all contract awards that may potentially be recognized as revenues or equity in income of unconsolidated joint ventures over the life of the contracts. We categorize our book of business into backlog, option years and indefinite delivery contracts (“IDCs”), based on the nature of the award and its current status.
Backlog. Our contract backlog represents the monetary value of signed contracts, including task orders that have been issued and funded under IDCs and, where applicable, a notice to proceed has been received from the client that is expected to be recognized as revenues or equity in income of unconsolidated joint ventures when future services are performed.
The performance periods of our contracts vary widely from a few months to many years. In addition, contract durations differ significantly among our businesses, although some overlap exists. As a result, the amount of revenues that will be realized beyond one year also varies from business to business. As of December 31, 2010, we estimated that approximately 63% of our total backlog would not be realized within one year based upon the timing of awards and the long-term nature of many of our contracts; however, no assurance can be given that backlog will be realized at this rate.
Option Years. Our option years represent the monetary value of option periods under existing contracts in backlog, which are exercisable at the option of our clients without requiring us to go through an additional competitive bidding process and would be canceled only if a client decides to end the project (a termination for convenience) or through a termination for default. Option years are in addition to the “base periods” of these contracts. The base periods of these contracts can vary from one to five years.
Indefinite Delivery Contracts. Indefinite delivery contracts represent the expected monetary value to us of signed contracts under which we perform work only when the client awards specific task orders or projects to us. When agreements for such task orders or projects are signed and funded, we transfer their value into backlog. Generally, the terms of these contracts exceed one year and often include a maximum term and potential value. IDCs generally range from one to twenty years in length.
While the value of our book of business is a predictor of future revenues and equity in income of unconsolidated joint ventures, we have no assurance, nor can we provide assurance, that we will ultimately realize the maximum potential values for backlog, option years or IDCs. Based on our historical experience, our backlog has the highest likelihood of being converted into revenues or equity in income of unconsolidated joint ventures because it is based upon signed and executable contracts with our clients. Option years are not as certain as backlog because our clients may decide not to exercise one or more option years. Because we do not perform work under IDCs until specific task orders are issued, the value of our IDCs are not as likely to convert into revenues or equity in income of unconsolidated joint ventures as other categories of our book of business.
As of December 31, 2010, our total book of business was $29.1 billion, a net decrease of $0.3 billion, compared to $29.4 billion as of January 1, 2010. The following table summarizes our book of business:
|
(In billions)
|
Infrastructure
&
Environment
|
Federal
Services
|
Energy
&
Construction
|
Total
|
||||||||||||
|
As of December 31, 2010
|
||||||||||||||||
|
Backlog
|
$ | 3.3 | $ | 6.0 | $ | 7.3 | $ | 16.6 | ||||||||
|
Option years
|
0.4 | 2.3 | 2.1 | 4.8 | ||||||||||||
|
Indefinite delivery contracts
|
3.4 | 3.2 | 1.1 | 7.7 | ||||||||||||
|
Total book of business
|
$ | 7.1 | $ | 11.5 | $ | 10.5 | $ | 29.1 | ||||||||
|
As of January 1, 2010
|
||||||||||||||||
|
Backlog
|
$ | 2.7 | $ | 7.2 | $ | 7.4 | $ | 17.3 | ||||||||
|
Option years
|
0.4 | 2.1 | 2.5 | 5.0 | ||||||||||||
|
Indefinite delivery contracts
|
4.3 | 1.6 | 1.2 | 7.1 | ||||||||||||
|
Total book of business
|
$ | 7.4 | $ | 10.9 | $ | 11.1 | $ | 29.4 | ||||||||
Our backlog decreased from $17.3 billion as of January 1, 2010 to $16.6 billion as of December 31, 2010 mainly due to a decrease in our federal market sector backlog. This decrease was partially offset by an additional $0.4 billion of backlog resulting from our acquisition of Scott Wilson.
|
As of
|
||||||||
|
(In billions)
|
December 31,
2010
|
January 1,
2010
|
||||||
|
Backlog by market sector:
|
||||||||
|
Power
|
$ | 1.4 | $ | 1.3 | ||||
|
Infrastructure
|
2.6 | 2.6 | ||||||
|
Industrial and commercial
|
1.3 | 1.3 | ||||||
|
Federal
|
11.3 | 12.1 | ||||||
|
Total backlog
|
$ | 16.6 | $ | 17.3 | ||||
History
We were originally incorporated in California on May 1, 1957, under the former name of Broadview Research Corporation. On May 18, 1976, we re-incorporated in Delaware under the name URS Corporation. After several additional name changes, we re-adopted the name “URS Corporation” on February 21, 1990.
Regulations
We provide services for projects that are subject to government oversight, including environmental laws and regulations, general government procurement laws and regulations, and other government regulations and requirements. Below is a summary of some of the regulations that impact our business. For more information on risks associated with our government regulations, please refer to Item 1A, “Risk Factors,” of this report.
Environmental Regulations. A portion of our business involves the planning, design, construction management, and operation and maintenance of pollution control facilities, as well as the assessment, design and management of remediation activities at hazardous waste or Superfund sites and military bases. In addition, we have contracts with U.S. federal governmental entities to destroy hazardous and radioactive materials, including chemical agents and weapons stockpiles. These activities may require us to manage, handle, remove, treat, transport and dispose of toxic or hazardous substances.
Some environmental laws including the Resource Conservation and Recovery Act of 1976, as amended, and the Comprehensive Environmental Response Compensation and Liability Act of 1980, as amended, (“CERCLA”), as well as other governmental laws can impose liability for the entire cost of the clean-up of contaminated facilities or sites upon present and former owners and operators as well as generators, transporters and persons arranging for the treatment or disposal of such substances. While we strive to handle hazardous and toxic substances with care and in accordance with safe methods, the possibility of accidents, leaks, spills and the events of force majeure always exist. Humans exposed to these materials, including employees or subcontractors engaged in the transportation and disposal of hazardous materials, and persons in affected areas may be injured or become ill, resulting in lawsuits that expose us to liability and may result in substantial damage awards against us. Liabilities for contamination or human exposure to hazardous or toxic materials or a failure to comply with applicable regulations could result in substantial costs to us, including clean-up costs, fines and civil or criminal sanctions, third-party claims for property damage or personal injury, or cessation of remediation activities.
Some of our business operations are covered by Public Law 85-804, which provides for indemnification by the U.S federal government against claims and damages arising out of unusually hazardous or nuclear activities performed at the request of the U.S. federal government. Should public policies and laws be changed, however, U.S. federal government indemnification may not be available in the case of any future claims or liabilities relating to hazardous activities that we undertake to perform.
Government Procurement. The services we provide to the U.S. federal government are subject to the Federal Acquisition Regulation (“FAR”), the Truth in Negotiations Act, the Cost Accounting Standards (“CAS”), the American Recovery and Reinvestment Act (“ARRA”), the Service Contract Act, DOD security regulations, and other rules and regulations applicable to government contracts, each as amended. These laws and regulations affect how we transact business with our government clients and in some instances, impose added costs to our business operations. A violation of specific laws and regulations could lead to fines, contract termination or suspension of future contracts. Our government clients can also terminate, renegotiate, or modify any of their contracts with us at their convenience, and many of our government contracts are subject to renewal or extension annually.
Other regulations and requirements. We provide services to the DOD and other defense-related entities that often require specialized professional qualifications and security clearances. Our international business is also subject to the Foreign Corrupt Practices Act, as well as various export control, anti-boycott, and embargo laws. In addition, as engineering design services professionals, we are subject to a variety of local, state, federal and foreign licensing and permit requirements and ethics rules.
Sales and Marketing
Our Infrastructure & Environment business performs business development, sales and marketing activities primarily through our network of local offices around the world. For large, market-specific projects requiring diverse technical capabilities, we utilize the company-wide resources of specific disciplines. This often involves coordinating marketing efforts on a regional, national or global level. Our Federal Services business performs business development, sales and marketing activities primarily through its management groups, which address specific markets, such as homeland security and defense systems. In addition, our Federal Services business coordinates national marketing efforts on large projects, which often involve a multi-segment or multi-market scope. Our Energy & Construction business conducts business development, sales and marketing activities at a market sector level. For large complex projects, markets or clients that require broad-based capabilities, business development efforts are coordinated across our businesses. Over the past year, our businesses have been successful in marketing their combined capabilities to win new work with clients in the various markets we serve.
Seasonality
We experience seasonal trends in our business in connection with federal holidays, such as Memorial Day, Independence Day, Thanksgiving, Christmas and New Year’s Day. Our revenues are typically lower during these times of the year because many of our clients’ employees, as well as our own employees, do not work during these holidays, resulting in fewer billable hours worked on projects and thus lesser revenues recognized. In addition to holidays, our business also is affected by seasonal bad weather conditions, such as hurricanes, floods, snowstorms or other inclement weather, which may cause some of our offices and projects to temporarily reduce activities.
Raw Materials
We purchase most of the raw materials and components necessary to operate our business from numerous sources. However, the price and availability of raw materials and components may vary from year to year due to customer demand, production capacity, market conditions and material shortages. While we do not currently foresee the lack of availability of any particular raw materials in the near term, prolonged unavailability of raw materials necessary to our projects and services or significant price increases for those raw materials could have a material adverse effect on our business in the near term.
Government Contracts
Generally, our government contracts are subject to renegotiation or termination of contracts or subcontracts at the discretion of the U.S. federal, state or local governments, and national governments of other countries.
Trade Secrets and Other Intellectual Property
We rely principally on trade secrets, confidentiality policies and other contractual arrangements to protect much of our intellectual property where we do not believe that patent or copyright protection is appropriate or obtainable.
Research and Development
We have not incurred material costs for company-sponsored research and development activities.
Insurance
Generally, our insurance program covers workers’ compensation and employer’s liability, general liability, automobile liability, professional errors and omissions liability, property, marine property and liability, and contractor’s pollution liability (in addition to other policies for specific projects). Our insurance program includes deductibles or self-insured retentions for each covered claim. In addition, our insurance policies contain exclusions and sublimits that insurance providers may use to deny or restrict coverage. Excess liability, contractor’s pollution liability, and professional liability insurance policies provide for coverages on a “claims-made” basis, covering only claims actually made and reported during the policy period currently in effect. Thus, if we do not continue to maintain these policies, we will have no coverage for claims made after the termination date even for claims based on events that occurred during the term of coverage. While we intend to maintain these policies, we may be unable to maintain existing coverage levels.
Employees
The number of our employees varies with the volume, type and scope of our operations at any given time. As of January 28, 2011, we had approximately 47,000 employees, including temporary or part-time workers. The Infrastructure & Environment, Federal Services, and Energy & Construction businesses employed approximately 21,000, 13,000, and 13,000 persons (including temporary and part-time workers), respectively. At various times, we have employed up to several thousand workers on a temporary or part-time basis to meet our contractual obligations. Approximately 13% of our employees are covered by collective bargaining agreements or by specific labor agreements, which expire upon completion of the relevant project.
Executive Officers of the Registrant
|
Name
|
Position Held
|
Age
|
||||
|
Martin M. Koffel
|
Chief Executive Officer (“CEO”), President and Director since May 1989; Chairman of the Board since June 1989.
|
71 | ||||
|
Thomas W. Bishop
|
Senior Vice President, Infrastructure & Environment since January 2011; Vice President, Strategy since July 2003; Senior Vice President, Construction Services since March 2002.
|
64 | ||||
|
Hugh Blackwood
|
Senior Vice President, International Operations and Vice President since September 2010; Chief Executive Officer of Scott Wilson Group plc. since May 2006.
|
62 | ||||
|
Reed N. Brimhall
|
Chief Accounting Officer since May 2005; Vice President and Corporate Controller since May 2003.
|
57 | ||||
|
H. Thomas Hicks
|
Vice President and Chief Financial Officer (“CFO”) since March 2006; Vice President, Finance from September 2005 to March 2006.
|
60 | ||||
|
Gary V. Jandegian
|
President of the Infrastructure & Environment business and Vice President since July 2003.
|
58 | ||||
|
Susan B. Kilgannon
|
Vice President, Communications since October 1999.
|
52 | ||||
|
Joseph Masters
|
Secretary since March 2006; General Counsel since July 1997; and Vice President since July 1994.
|
54 | ||||
|
Randall A. Wotring
|
President of the Federal Services business and Vice President since November 2004.
|
54 | ||||
|
Thomas H. Zarges
|
Vice President since March 2008; President of the Energy & Construction business since January 2008; Senior Executive Vice President Operations of the Energy & Construction business from November 2007 through January 2008; Senior Executive Vice President – Operations of Washington Group International, Inc. from October 2002 through November 2007.
|
62 | ||||
Available Information
Our Annual Reports on Form 10-K, quarterly reports on Form 10-Q, current reports on Form 8-K and amendments to those reports filed or furnished pursuant to Section 13(a) or 15(d) of the Securities Exchange Act of 1934, as amended, are available free of charge on our web site at www.urs.com. These reports, and any amendments to these reports, are made available on our web site as soon as reasonably practicable after we electronically file or furnish the reports with the Securities and Exchange Commission (“SEC”). In addition, our Corporate Governance Guidelines, the charters for our Audit, Board Affairs and Compensation Committees, and our Code of Business Conduct and Ethics are available on our web site at www.urs.com under the “Corporate Governance” section. Any waivers or amendments to our Code of Business Conduct and Ethics will be posted on our web site. A printed copy of this information is also available without charge by sending a written request to: Corporate Secretary, URS Corporation, 600 Montgomery Street, 26th Floor, San Francisco, CA 94111-2728.
In addition to the other information included or incorporated by reference in this Form 10-K/A, the following factors also could affect our financial condition and results of operations:
Demand for our services is cyclical and vulnerable to economic downturns and reductions in government and private industry spending. If the economy remains weak or client spending declines further, then our revenues, profits and our financial condition may deteriorate.
Demand for our services is cyclical and vulnerable to economic downturns and reductions in government and private industry spending, which has resulted and may continue to result in clients delaying, curtailing or canceling proposed and existing projects. In fiscal years 2009 and 2010, our clients were affected by the weak economic conditions caused by the declines in the overall economy and constraints in the credit market. As a result, some clients delayed, curtailed or cancelled proposed and existing projects and may continue to do so. For example, for the year ended December 31, 2010, we did not experience growth in revenues or our book of business compared to fiscal year 2009. In addition, our clients may find it more difficult to raise capital in the future due to limitations on the availability of credit and other uncertainties in the federal, municipal and corporate credit markets. We expect our government clients will continue to be constrained by budget shortages. Also, our clients may demand more favorable pricing terms and find it increasingly difficult to timely pay invoices for our services, which would impact our future cash flows and liquidity. In addition, any rapid changes in the prices of commodities make it difficult for our clients and us to forecast future capital expenditures. Inflation or significant changes in interest rates could reduce the demand for our services. Any inability to timely collect our invoices may lead to an increase in our accounts receivables and potentially to increased write-offs of uncollectible invoices. If the economy remains weak or uncertain, or client spending declines further, then our revenues, book of business, net income and overall financial condition could deteriorate.
We may not realize the full amount of revenues reflected in our book of business, particularly in light of the current economic conditions, which could harm our operations and could significantly reduce our expected profits and revenues.
We account for all contract awards that may eventually be recognized as revenues or equity in income of unconsolidated joint ventures as our “book of business,” which includes backlog, option years and IDCs. As of December 31, 2010, our book of business was estimated at approximately $29.1 billion, which included $16.6 billion of our backlog. Our book of business estimates may not result in realized profits and revenues in any particular period because clients may delay, modify terms or terminate projects and contracts and may decide not to exercise contract options or issue task orders. This uncertainty is particularly acute in light of current economic conditions as the risk of contracts in backlog being delayed or cancelled is more likely to increase during periods of economic volatility. In addition, our government contracts or subcontracts are subject to renegotiation or termination at the convenience of the applicable U.S. federal, state or local governments, as well as national governments of other countries. Accordingly, if we do not realize a substantial amount of our book of business, our operations could be harmed and our expected profits and revenues could be significantly reduced.
As a government contractor, we must comply with various procurement laws and regulations and are subject to regular government audits; failure to comply with these laws and regulations could result in sanctions, contract termination, forfeiture of profit, harm to our reputation or loss of our status as an eligible government contractor. Any interruption or termination of our government contractor status could reduce our profits and revenues significantly.
As a government contractor, we enter into many contracts with federal, state and local government clients. For example, revenues from our federal market sector represented 49% of our total revenues for the year ended December 31, 2010. We are affected by and must comply with federal, state, local and foreign laws and regulations relating to the formation, administration and performance of government contracts. For example, we must comply with FAR, the Truth in Negotiations Act, CAS, ARRA, the Services Contract Act, export controls rules and DOD security regulations, as well as many other laws and regulations. In addition, we must also comply with other government regulations related to employment practices, environmental protection, health and safety, tax, accounting and anti-fraud, as well as many others in order to maintain our government contractor status. These laws and regulations affect how we transact business with our clients and in some instances, impose additional costs on our business operations. Even though we take precautions to prevent and deter fraud, misconduct and non-compliance, we face the risk that our employees or outside partners may engage in misconduct, fraud or other improper activities.
Government agencies, such as the U.S. Defense Contract Audit Agency (“DCAA”), routinely audit and investigate government contractors. These government agencies review and audit a government contractor’s performance under its contracts, a government contractor’s direct and indirect cost structure, and a government contractor’s compliance with applicable laws, regulations and standards. For example, during the course of its audits, the DCAA may question our incurred project costs and, if the DCAA believes we have accounted for these costs in a manner inconsistent with the requirements for the FAR or CAS, the DCAA auditor may recommend to our U.S. government corporate administrative contracting officer to disallow such costs. We can provide no assurance that the DCAA or other government audits will not result in material disallowances for incurred costs in the future. In addition, government contracts are subject to a variety of other socioeconomic requirements relating to the formation, administration, performance and accounting for these contracts. We may also be subject to qui tam litigation brought by private individuals on behalf of the government under the Federal Civil False Claims Act, which could include claims for treble damages. Government contract violations could result in the imposition of civil and criminal penalties or sanctions, contract termination, forfeiture of profit, and/or suspension of payment, any of which could make us lose our status as an eligible government contractor. We could also suffer serious harm to our reputation. Any interruption or termination of our government contractor status could reduce our profits and revenues significantly.
Employee, agent or partner misconduct or failure to comply with anti-bribery and other government laws and regulations could harm our reputation, reduce our revenues and profits, and subject us to criminal and civil enforcement actions.
Misconduct, fraud, non-compliance with applicable government laws and regulations, or other improper activities by one of our employees, agents or partners could have a significant negative impact on our business and reputation. Such misconduct could include the failure to comply with government procurement regulations, regulations regarding the protection of classified information, regulations prohibiting bribery and other foreign corrupt practices, regulations regarding the pricing of labor and other costs in government contracts, regulations on lobbying or similar activities, regulations pertaining to the internal controls over financial reporting, environmental laws and any other applicable laws or regulations. For example, the United States Foreign Corrupt Practices Act and similar anti-bribery laws in other jurisdictions generally prohibit companies and their intermediaries from making improper payments to foreign officials for the purpose of obtaining or retaining business. In addition, we regularly provide services that may be highly sensitive or that relate to critical national security matters; if a security breach were to occur, our ability to procure future government contracts could be severely limited.
Our policies mandate compliance with these regulation and laws, and we take precautions intended to prevent and detect misconduct. However, since our internal controls are subject to inherent limitations, including human error, it is possible that these controls could be intentionally circumvented or become inadequate because of changed conditions. As a result, we cannot assure that our controls will protect us from reckless or criminal acts committed by our employees and agents. Failure to comply with applicable laws or regulations or acts of misconduct could subject us to fines and penalties, loss of security clearances, and suspension or debarment from contracting, any or all of which could harm our reputation, reduce our revenues and profits and subject us to criminal and civil enforcement actions.
Legal proceedings, investigations and disputes could result in substantial monetary penalties and damages, which could affect us adversely, especially if such penalties and damages exceed or are excluded from existing insurance coverage.
We engage in engineering, construction and technical services that can result in substantial injury or damages that may expose us to legal proceedings, investigations and disputes. For example, in the ordinary course of our business, we may be involved in legal disputes regarding personal injury and wrongful death claims, employee or labor disputes, professional liability claims, and general commercial disputes involving project cost overruns and liquidated damages as well as other claims. See Note 16, “Commitments and Contingencies,” to our “Consolidated Financial Statements and Supplementary Data” included under Item 8 for a discussion of some of our legal proceedings. In addition, in the ordinary course of our business, we frequently make professional judgments and recommendations about environmental and engineering conditions of project sites for our clients. We may be deemed to be responsible for these judgments and recommendations if they are later determined to be inaccurate. Any unfavorable legal ruling against us could result in substantial monetary damages or even criminal violations. We maintain insurance coverage as part of our overall legal and risk management strategy to minimize our potential liabilities. Generally, our insurance program covers workers’ compensation and employer’s liability, general liability, automobile liability, professional errors and omissions liability, property, marine property and liability, and contractor’s pollution liability (in addition to other policies for specific projects). Our insurance program includes deductibles or self-insured retentions for each covered claim. In addition, our insurance policies contain exclusions and sublimits that insurance providers may use to deny us insurance coverage. Excess liability, contractor’s pollution liability, and professional liability insurance policies provide for coverages on a “claims-made” basis, covering only claims actually made and reported during the policy period currently in effect. If we sustain liabilities that exceed our insurance coverage or for which we are not insured, it could have a material adverse impact on our results of operations and financial condition, including our profits and revenues.
Unavailability or cancellation of third-party insurance coverage would increase our overall risk exposure as well as disrupt the management of our business operations.
We maintain insurance coverage from third-party insurers as part of our overall risk management strategy and because some of our contracts require us to maintain specific insurance coverage limits. If any of our third-party insurers fail, suddenly cancel our coverage or otherwise are unable to provide us with adequate insurance coverage, then our overall risk exposure and our operational expenses would increase and the management of our business operations would be disrupted. In addition, there can be no assurance that any of our existing insurance coverage will be renewable upon the expiration of the coverage period or that future coverage will be affordable at the required limits.
We may be subject to substantial liabilities under environmental laws and regulations.
A portion of our environmental business involves the planning, design, program management, construction and construction management, and operation and maintenance of pollution control and nuclear facilities, hazardous waste or Superfund sites and military bases. In addition, we have contracts with U.S. federal government entities to destroy hazardous materials, including chemical agents and weapons stockpiles, as well as to decontaminate and decommission nuclear facilities. These activities may require us to manage, handle, remove, treat, transport and dispose of toxic or hazardous substances. We must comply with a number of governmental laws that strictly regulate the handling, removal, treatment, transportation and disposal of toxic and hazardous substances. Under CERCLA and comparable state laws, we may be required to investigate and remediate regulated hazardous materials. CERCLA and comparable state laws typically impose strict, joint and several liabilities without regard to whether a company knew of or caused the release of hazardous substances. The liability for the entire cost of cleanup could be imposed upon any responsible party. Other principal federal environmental, health and safety laws affecting us include, but are not limited to, the Resource Conservation and Recovery Act, the National Environmental Policy Act, the Clean Air Act, the Clean Air Mercury Rule, the Occupational Safety and Health Act, the Toxic Substances Control Act and the Superfund Amendments and Reauthorization Act. Our business operations may also be subject to similar state and international laws relating to environmental protection. Our past waste management practices and contract mining activities, as well as our current and prior ownership of various properties, may also expose us to such liabilities. Liabilities related to environmental contamination or human exposure to hazardous substances, or a failure to comply with applicable regulations could result in substantial costs to us, including clean-up costs, fines and civil or criminal sanctions, third-party claims for property damage or personal injury or cessation of remediation activities. Our continuing work in the areas governed by these laws and regulations exposes us to the risk of substantial liability.
Our failure to conduct due diligence effectively or our inability to integrate acquisitions successfully could impede us from realizing all of the benefits of the acquisition, which could severely weaken our results of operations.
Historically, we have used acquisitions as one way to expand our business. If we fail to conduct due diligence on our potential targets effectively, we may, for example, not identify problems at target companies or fail to recognize incompatibilities or other obstacles to successful integration. Our inability to successfully integrate future acquisitions could impede us from realizing all of the benefits of those acquisitions and could severely weaken our business operations. The integration process may disrupt our business and, if implemented ineffectively, may preclude realization of the full benefits expected by us and could seriously harm our results of operations. In addition, the overall integration of two combining companies may result in unanticipated problems, expenses, liabilities, competitive responses, loss of customer relationships, and diversion of management’s attention, and may cause our stock price to decline. The difficulties of integrating an acquisition include, among others:
|
·
|
unanticipated issues in integrating information, communications and other systems;
|
|
·
|
unanticipated incompatibility of logistics, marketing and administration methods;
|
|
·
|
maintaining employee morale and retaining key employees;
|
|
·
|
integrating the business cultures of both companies;
|
|
·
|
preserving important strategic and customer relationships;
|
|
·
|
consolidating corporate and administrative infrastructures and eliminating duplicative operations;
|
|
·
|
the diversion of management’s attention from ongoing business concerns; and
|
|
·
|
coordinating geographically separate organizations.
|
In addition, even if the operations of an acquisition are integrated successfully, we may not realize the full benefits of the acquisition, including the synergies, cost savings, or sales or growth opportunities that we expect. These benefits may not be achieved within the anticipated time frame, or at all.
Our inability to win or renew government contracts during regulated procurement processes could harm our operations and reduce our profits and revenues.
Revenues from our federal market sector represented approximately 49% of our total revenues for the year ended December 31, 2010. Government contracts are awarded through a regulated procurement process. The federal government has increasingly relied upon multi-year contracts with pre-established terms and conditions, such as IDCs, that generally require those contractors that have previously been awarded the IDC to engage in an additional competitive bidding process before a task order is issued. The increased competition, in turn, may require us to make sustained efforts to reduce costs in order to realize revenues and profits under government contracts. If we are not successful in reducing the amount of costs we incur, our profitability on government contracts will be negatively impacted. In addition, the U.S. government has announced its intention to scale back outsourcing of services in favor of “insourcing” jobs to its employees, which could reduce our revenues. Moreover, even if we are qualified to work on a government contract, we may not be awarded the contract because of existing government policies designed to protect small businesses and under-represented minority contractors. Our inability to win or renew government contracts during regulated procurement processes could harm our operations and reduce our profits and revenues.
Each year, client funding for some of our government contracts may rely on government appropriations or public-supported financing. If adequate public funding is delayed or is not available, then our profits and revenues could decline.
Each year client funding for some of our government contracts may directly or indirectly rely on government appropriations or public-supported financing such as the ARRA, which provides funding for various clients’ state transportation projects. Legislatures may appropriate funds for a given project on a year-by-year basis, even though the project may take more than one year to perform. In addition, public-supported financing such as state and local municipal bonds, may be only partially raised to support existing infrastructure projects. As a result, a project we are currently working on may only be partially funded and thus additional public funding may be required in order to complete our contract. Public funds and the timing of payment of these funds may be influenced by, among other things, the state of the economy, competing political priorities, curtailments in the use of government contractors, a rise in the cost of raw materials, delays associated with a lack of a sufficient number of government staff to oversee contracts, budget constraints, the timing and amount of tax receipts and the overall level of government expenditures. If adequate public funding is not available or is delayed, then our profits and revenues could decline.
Our government contracts may give government agencies the right to modify, delay, curtail, renegotiate or terminate existing contracts at their convenience at any time prior to their completion, which may result in a decline in our profits and revenues.
Government projects in which we participate as a contractor or subcontractor may extend for several years. Generally, government contracts include the right for government agencies to modify, delay, curtail, renegotiate or terminate contracts and subcontracts at their convenience any time prior to their completion. Any decision by a government client to modify, delay, curtail, renegotiate or terminate our contracts at their convenience may result in a decline in our profits and revenues.
If we are unable to accurately estimate and control our contract costs, then we may incur losses on our contracts, which could decrease our operating margins and reduce our profits.
It is important for us to accurately estimate and control our contract costs so that we can maintain positive operating margins and profitability. We generally enter into four principal types of contracts with our clients: cost-plus, fixed-price, target-price and time-and-materials.
Under cost-plus contracts, which may be subject to contract ceiling amounts, we are reimbursed for allowable costs and fees, which may be fixed or performance-based. If our costs exceed the contract ceiling or are not allowable under the provisions of the contract or any applicable regulations, we may not be reimbursed for all of the costs we incur. Under fixed-price contracts, we receive a fixed price regardless of what our actual costs will be. Consequently, we realize a profit on fixed-price contracts only if we can control our costs and prevent cost over-runs on our contracts. Under target-price contracts, project costs are reimbursable and our fee is established against a target budget that is subject to changes in project circumstances and scope. Under time-and-materials contracts, we are paid for labor at negotiated hourly billing rates and for other expenses.
If we are unable to accurately estimate and manage our costs, we may incur losses on our contracts, which could decrease our operating margins and significantly reduce or eliminate our profits. Many of our contracts require us to satisfy specified design, engineering, procurement or construction milestones in order to receive payment for the work completed or equipment or supplies procured prior to achieving the applicable milestone. As a result, under these types of arrangements, we may incur significant costs or perform significant amounts of work prior to receipt of payment. If the customer determines not to proceed with the completion of the project or if the customer defaults on its payment obligations, we may encounter difficulties in collecting payment of amounts due to us for the costs previously incurred or for the amounts previously expended to purchase equipment or supplies.
Our actual business and financial results could differ from the estimates and assumptions that we use to prepare our financial statements, which may reduce our profits.
To prepare financial statements in conformity with generally accepted accounting principles, management is required to make estimates and assumptions, which affect the reported values of assets and liabilities, revenues and expenses, and disclosures of contingent assets and liabilities. For example, we may recognize revenue over the life of a contract based on the proportion of costs incurred to date compared to the total costs estimated to be incurred for the entire project. Areas requiring significant estimates by our management include:
|
·
|
the application of the percentage-of-completion method of revenue recognition on contracts, change orders and contract claims;
|
|
·
|
provisions for uncollectible receivables and customer claims and recoveries of costs from subcontractors, vendors and others;
|
|
·
|
provisions for income taxes and related valuation allowances;
|
|
·
|
impairment of goodwill and recoverability of other intangible assets;
|
|
·
|
valuation of assets acquired and liabilities assumed in connection with business combinations;
|
|
·
|
valuation of defined benefit pension plans and other employee benefit plans;
|
|
·
|
valuation of stock-based compensation expense; and
|
|
·
|
accruals for estimated liabilities, including litigation and insurance reserves.
|
Our actual business and financial results could differ from those estimates, which may reduce our profits.
Our profitability could suffer if we are not able to maintain adequate utilization of our workforce.
The cost of providing our services, including the extent to which we utilize our workforce, affects our profitability. The rate at which we utilize our workforce is affected by a number of factors, including:
|
·
|
our ability to transition employees from completed projects to new assignments and to hire and assimilate new employees;
|
|
·
|
our ability to forecast demand for our services and thereby maintain an appropriate headcount in each of our geographies and workforces;
|
|
·
|
our ability to manage attrition;
|
|
·
|
our need to devote time and resources to training, business development, professional development and other non-chargeable activities; and
|
|
·
|
our ability to match the skill sets of our employees to the needs of the marketplace.
|
If we overutilize our workforce, our employees may become disengaged, which will impact employee attrition. If we underutilize our workforce, our profit margin and profitability could suffer.
Our use of the percentage-of-completion method of revenue recognition could result in a reduction or reversal of previously recorded revenues and profits.
A substantial portion of our revenues and profits are measured and recognized using the percentage-of-completion method of revenue recognition. Our use of this accounting method results in recognition of revenues and profits ratably over the life of a contract, based generally on the proportion of costs incurred to date to total costs expected to be incurred for the entire project. The effects of revisions to revenues and estimated costs are recorded when the amounts are known or can be reasonably estimated. Such revisions could occur in any period and their effects could be material. Although we have historically made reasonably reliable estimates of the progress towards completion of long-term engineering, program management, construction management or construction contracts, the uncertainties inherent in the estimating process make it possible for actual costs to vary materially from estimates, including reductions or reversals of previously recorded revenues and profits.
Our failure to successfully bid on new contracts and renew existing contracts could reduce our profits.
Our business depends on our ability to successfully bid on new contracts and renew existing contracts with private and public sector clients. Contract proposals and negotiations are complex and frequently involve a lengthy bidding and selection process, which are affected by a number of factors, such as market conditions, financing arrangements and required governmental approvals. For example, a client may require us to provide a surety bond or letter of credit to protect the client should we fail to perform under the terms of the contract. If negative market conditions arise, or if we fail to secure adequate financial arrangements or the required governmental approval, we may not be able to pursue particular projects, which could adversely reduce or eliminate our profitability.
If we fail to timely complete, miss a required performance standard or otherwise fail to adequately perform on a project, then we may incur a loss on that project, which may reduce or eliminate our overall profitability.
We may commit to a client that we will complete a project by a scheduled date. We may also commit that a project, when completed, will achieve specified performance standards. If the project is not completed by the scheduled date or fails to meet required performance standards, we may either incur significant additional costs or be held responsible for the costs incurred by the client to rectify damages due to late completion or failure to achieve the required performance standards. In addition, performance of projects can be affected by a number of factors beyond our control, including unavoidable delays from governmental inaction, public opposition, inability to obtain financing, weather conditions, unavailability of vendor materials, changes in the project scope of services requested by our clients, industrial accidents, environmental hazards, labor disruptions and other factors. In some cases, should we fail to meet required performance standards, we may also be subject to agreed-upon financial damages, which are determined by the contract. To the extent that these events occur, the total costs of the project could exceed our estimates and we could experience reduced profits or, in some cases, incur a loss on a project, which may reduce or eliminate our overall profitability.
We may be required to pay liquidated damages if we fail to meet milestone requirements in our contracts.
We may be required to pay liquidated damages if we fail to meet milestone requirements in our contracts. Failure to meet any of the milestone requirements could result in additional costs, and the amount of such additional costs could exceed the projected profits on the project. These additional costs include liquidated damages paid under contractual penalty provisions, which can be substantial and can accrue on a regular basis.
If our partners fail to perform their contractual obligations on a project, we could be exposed to joint and several liability and financial penalties that could reduce our profits and revenues.
We often partner with unaffiliated third parties, individually or via a joint venture, to jointly bid on and perform a particular project. For example, for the year ended December 31, 2010, our equity in income of unconsolidated joint ventures amounted to $70.3 million. The success of our partnerships and joint ventures depends, in large part, on the satisfactory performance of contractual obligations by each member. In addition, when we operate through a joint venture in which we are a minority holder, we have limited control over many project decisions, including decisions related to the joint venture’s internal controls, which may not be subject to the same internal control procedures that we employ. If these unaffiliated third parties do not fulfill their contract obligations, the partnerships or joint ventures may be unable to adequately perform and deliver their contracted services. Under these circumstances, we may be obligated to pay financial penalties, provide additional services to ensure the adequate performance and delivery of the contracted services and may be jointly and severally liable for the other’s actions or contract performance. These additional obligations could result in reduced profits and revenues or, in some cases, significant losses for us with respect to the joint venture, which could also affect our reputation in the industries we serve.
Our dependence on third-party subcontractors and equipment and material providers could reduce our profits or result in project losses.
We rely on third-party subcontractors and equipment and material providers. For example, we procure heavy equipment and construction materials as needed when performing large construction and contract mining projects. To the extent that we cannot engage subcontractors or acquire equipment and materials at reasonable costs or if the amount we are required to pay exceeds our estimates, our ability to complete a project in a timely fashion or at a profit may be impaired. In addition, if a subcontractor or a manufacturer is unable to deliver its services, equipment or materials according to the negotiated terms for any reason, including the deterioration of its financial condition, we may be required to purchase the services, equipment or materials from another source at a higher price. This may reduce the profit to be realized or result in a loss on a project for which the services, equipment or materials are needed.
If we experience delays and/or defaults in client payments, we could suffer liquidity problems or we may be unable to recover all working capital or equity investments.
Because of the nature of our contracts, at times we may commit resources to a client’s projects before receiving payments to cover our expenditures. Sometimes, we incur and record expenditures for a client project before receiving any payment to cover our expenses. In addition, we may make equity investments in majority or minority controlled large-scale client projects and other long-term capital projects before the project completes operational status or completes its project financing. If a client is unable to make its payments on a project, we could incur losses including our working capital or equity investments.
The past tightening of credit could increase this risk, as more clients may be unable to secure sufficient liquidity to pay their obligations. If a client delays or defaults in making its payments on a project to which we have devoted significant resources, it could have an adverse effect on our financial position and cash flows.
Our failure to adequately recover on claims brought by us against project owners for additional contract costs could have a negative impact on our liquidity and profitability.
We have brought claims against project owners for additional costs exceeding the contract price or for amounts not included in the original contract price. These types of claims occur due to matters such as owner-caused delays or changes from the initial project scope, both of which may result in additional cost. Often, these claims can be the subject of lengthy arbitration or litigation proceedings, and it is difficult to accurately predict when these claims will be fully resolved. When these types of events occur and unresolved claims are pending, we have used working capital in projects to cover cost overruns pending the resolution of the relevant claims. A failure to promptly recover on these types of claims could have a negative impact on our liquidity and profitability.
Target-price and fixed-price contracts have increased the unpredictability and volatility of our earnings.
The federal government and some clients have increased the use of target-price and fixed-price contracts. Fixed-price contracts require cost and scheduling estimates that are based on a number of assumptions, including those about future economic conditions, costs and availability of labor, equipment and materials, and other exigencies. We could experience cost overruns if these estimates are originally inaccurate as a result of errors or ambiguities in the contract specifications, or become inaccurate as a result of a change in circumstances following the submission of the estimate due to, among other things, unanticipated technical problems, difficulties in obtaining permits or approvals, changes in local laws or labor conditions, weather delays, changes in the costs of raw materials, or inability of our vendors or subcontractors to perform. If cost overruns occur, we could experience reduced profits or, in some cases, a loss for that project. For example, one of our construction projects has experienced cost increases and schedule delays and we have recorded cumulative project losses of approximately $87.8 million as of December 31, 2010. If a project is significant, or if there are one or more common issues that impact multiple projects, costs overruns could increase the unpredictability and volatility of our earnings as well as have a material adverse impact on our business and earnings.
Maintaining adequate bonding capacity is necessary for us to successfully bid on and win fixed-price contracts.
In line with industry practice, we are often required to provide performance or payment bonds to clients under fixed-price contracts. These bonds indemnify the client should we fail to perform our obligations under the contract. If a bond is required for a particular project and we are unable to obtain an appropriate bond, we cannot pursue that project. We have bonding capacity but, as is typically the case, the issuance of a bond is at the surety’s sole discretion. Moreover, due to events that affect the insurance and bonding markets generally, bonding may be more difficult to obtain in the future or may only be available at significantly higher costs. There can be no assurance that our bonding capacity will continue to be available to us on reasonable terms. Our inability to obtain adequate bonding and, as a result, to bid on new fixed-price contracts could have a material adverse effect on our business, financial condition, results of operations and cash flows.
Construction and project sites are inherently dangerous workplaces. Failure to maintain safe work sites could result in employee deaths or injuries, reduced profitability, the loss of projects or clients and possible exposure to litigation.
Construction and maintenance sites often put our employees and others in close proximity with mechanized equipment, moving vehicles, chemical and manufacturing processes, and highly regulated materials. On many sites, we are responsible for safety and, accordingly, must implement safety procedures. If we fail to implement these procedures or if the procedures we implement are ineffective, we may suffer the loss of or injury to our employees, as well as expose ourselves to possible litigation. As a result, our failure to maintain adequate safety standards could result in reduced profitability or the loss of projects or clients, and could have a material adverse impact on our business, financial condition, and results of operations.
If our goodwill or intangible assets become impaired, then our profits will be reduced.
A decline in our stock price and market capitalization could result in an impairment of a material amount of our goodwill, which would reduce our earnings. Goodwill may be impaired if the estimated fair value of one or more of our reporting units’ goodwill is less than the carrying value of the unit’s goodwill. Because we have grown in part through acquisitions, goodwill and other intangible assets represent a substantial portion of our assets. Goodwill and other net intangible assets were $3.9 billion as of December 31, 2010. We perform an analysis on our goodwill balances to test for impairment on an annual basis and whenever events occur that indicate impairment could exist. There are several instances that may cause us to further test our goodwill for impairment between the annual testing periods including: (i) continued deterioration of market and economic conditions that may adversely impact our ability to meet our projected results; (ii) declines in our stock price caused by continued volatility in the financial markets that may result in increases in our weighted-average cost of capital or other inputs to our goodwill assessment; (iii) the occurrence of events that may reduce the fair value of a reporting unit below its carrying amount, such as the sale of a significant portion of one or more of our reporting units.
We also perform an analysis of our intangible assets to test for impairment whenever events occur that indicate impairment could exist. Examples of such events are i) significant adverse changes in the intangible asset’s market value, useful life, or in the business climate that could affect its value; ii) a current-period operating or cash flow loss or a projection or forecast that demonstrates continuing losses associated with the use of the intangible asset; and iii) a current expectation that, more likely than not, the intangible asset will be sold or otherwise disposed of before the end of its previously estimated useful life.
Changes in environmental, defense, or infrastructure industry laws could directly or indirectly reduce the demand for our services, which could in turn negatively impact our revenues.
Some of our services are directly or indirectly impacted by changes in federal, state, local or foreign laws and regulations pertaining to the environmental, defense or infrastructure industries. For example, passage of the Clean Air Mercury environmental rules increased demand for our emissions control services, and any repeal of these rules would have a negative impact on our revenues. Proposed climate change and greenhouse gas regulations, if adopted, could impact the services we provide to our clients, including services related to fossil fuel and industrial projects. Relaxation or repeal of laws and regulations, or changes in governmental policies regarding the environmental, defense or infrastructure industries could result in a decline in demand for our services, which could in turn negatively impact our revenues.
If we do not have adequate indemnification for our services related to nuclear materials, it could adversely affect our business and financial condition.
We provide services to the DOE relating to its nuclear weapons facilities and the nuclear energy industry in the ongoing maintenance and modification, as well as the decontamination and decommissioning, of its nuclear energy plants. Indemnification provisions under the Price-Anderson Act (“PAA”) available to nuclear energy plant operators and DOE contractors do not apply to all liabilities that we might incur while performing services as a radioactive materials cleanup contractor for the DOE and the nuclear energy industry. If the PAA’s indemnification protection does not apply to our services or our exposure occurs outside the U.S., our business and financial condition could be adversely affected either by our client’s refusal to retain us or by our inability to obtain commercially adequate insurance and indemnification.
We are subject to professional standards, duties and statutory obligations on professional reports and opinions we issue, which could subject us to monetary damages.
We issue reports and opinions to clients based on our professional engineering expertise, as well as our other professional credentials, that subject us to professional standards, duties and statutory obligations regulating the performance of our services. If our report or opinion is made public, we could also be liable to a third party even if we are not contractually obligated to the third party for the report. For example, we could deliver a public report to a government client or in a securities offering that may be relied upon by a third party, which could subject us to liability for significant monetary damages.
A decline in defense or other federal government spending or a change in budgetary priorities could reduce our profits and revenues.
Revenues from our federal market sector represented 49% of our total revenues and contracts, of which the DOD and other defense-related clients represented approximately 33% of our total revenues for the year ended December 31, 2010. Past increases in spending authorization for defense-related or other federal government programs and in outsourcing of federal government jobs to the private sector are not expected to be sustained on a long-term basis. For example, the DOD budget declined in the late 1980s and the early 1990s, resulting in DOD program delays and cancellations. Future levels of expenditures and authorizations for defense-related or other federal programs, including foreign military commitments, may decrease, remain constant or shift to programs in areas where we do not currently provide services. As a result, a general decline in defense or other federal spending or a change in budgetary priorities could reduce our profits and revenues.
Our overall market share and profits will decline if we are unable to compete successfully in our industry.
Our industry is highly fragmented and intensely competitive. For example, according to the publication Engineering News-Record, based on voluntarily reported information, the top ten U.S. engineering design firms accounted only for approximately 40% of the total top 500 U.S. design firm revenues in 2009. The top 25 U.S. contractors accounted for approximately 50% of the total top 400 U.S. contractors’ revenues in 2009, as reported by the Engineering News Record. Our competitors are numerous, ranging from small private firms to multi-billion dollar companies. In addition, the technical and professional aspects of some of our services generally do not require large upfront capital expenditures and provide limited barriers against new competitors.
Some of our competitors have achieved greater market penetration in some of the markets in which we compete and have substantially more financial resources and/or financial flexibility than we do. As a result of the number of competitors in the industry, our clients may select one of our competitors on a project due to competitive pricing or a specific skill set. If we are unable to maintain our competitiveness, our market share, revenues and profits will decline. If we are unable to meet these competitive challenges, we could lose market share to our competitors and experience an overall reduction in our profits.
Our failure to attract and retain key employees could impair our ability to provide services to our clients and otherwise conduct our business effectively.
As a professional and technical services company, we are labor intensive, and, therefore, our ability to attract, retain and expand our senior management and our professional and technical staff is an important factor in determining our future success. From time to time, it may be difficult to attract and retain qualified individuals with the expertise and in the timeframe demanded by our clients. For example, some of our government contracts may require us to employ only individuals who have particular government security clearance levels. We may occasionally enter into contracts before we have hired or retained appropriate staffing for that project. In addition, we rely heavily upon the expertise and leadership of our senior management. If we are unable to retain executives and other key personnel, the roles and responsibilities of those employees will need to be filled, which may require that we devote time and resources to identify, hire and integrate new employees. In addition, the failure to attract and retain key individuals could impair our ability to provide services to our clients and conduct our business effectively.
We may be required to contribute additional cash to meet any underfunded benefit obligations associated with multiemployer pension plans we participate in or retirement and post-retirement benefit plans we manage.
We have various employee retirement plan obligations that require us to make contributions to satisfy, over time, our underfunded benefit obligations, which are determined by calculating the projected benefit obligations minus the fair value of plan assets. For example, as of December 31, 2010, our defined benefit pension and post-retirement benefit plans were projected to be underfunded by $254.1 million. See Note 13, “Employee Retirement and Post-Retirement Benefit Plans,” to our “Consolidated Financial Statements and Supplementary Data” included under Item 8 of this annual report for additional disclosure. In the future, our retirement plan obligations may increase or decrease depending on changes in the levels of interest rates, pension plan asset performance and other factors. If we are required to contribute a significant amount of the deficit for underfunded benefit plans, our cash flows could be materially and adversely affected.
A multiemployer pension plan is typically established under a collective bargaining agreement with a union to cover the union-represented workers of various unrelated companies. Our collective bargaining agreements with unions typically require us to contribute to many multiemployer pension plans. For the year ended December 31, 2010, we contributed approximately $46.5 million to participate in multiemployer pension plans. Under the Employee Retirement Income Security Act, an employer who contributes to a multiemployer pension plan, absent an applicable exemption, may also be liable, upon termination or withdrawal from the plan, for its proportionate share of the multiemployer pension plan’s unfunded vested benefit. If we terminate or withdraw from a multiemployer plan, absent an applicable exemption (such as for some plans in the building and construction industry), we could be required to contribute a significant amount of cash to fund a multiemployer pension plan’s unfunded vested benefit, which could materially and adversely affect our financial results.
Our outstanding indebtedness could adversely affect our liquidity, cash flows and financial condition.
As of December 31, 2010, our outstanding balance under the Senior Secured Credit Facility (“2007 Credit Facility”) was $625.0 million. Our next scheduled payment of $105.0 million is due in March 2012. This level of debt might:
|
·
|
increase our vulnerability to, and limit flexibility in planning for, adverse economic and industry conditions;
|
|
·
|
adversely affect our ability to obtain surety bonds;
|
|
·
|
limit our ability to obtain additional financing to fund future working capital, capital expenditures, additional acquisitions and other general corporate initiatives; and
|
|
·
|
limit our ability to apply proceeds from an asset sale to purposes other than the servicing and repayment of debt.
|
Our access to credit markets may be limited.
We expect to refinance our 2007 Credit Facility prior to its earliest maturity date. We may not be able to refinance our 2007 Credit Facility at rates and on terms that are favorable to us. Currently, the debt markets remain volatile, and our successful refinancing may depend on variables that impact the overall credit markets, regardless of our inherent qualifications to secure financing.
We may not be able to generate or borrow enough cash to service our indebtedness, which could result in bankruptcy or otherwise impair our ability to maintain sufficient liquidity to continue our operations.
We rely primarily on our ability to generate cash from operations to service our indebtedness in the future. If we do not generate sufficient cash flows to meet our debt service and working capital requirements, we may need to seek additional financing. If we are unable to obtain financing on terms that are acceptable to us, we could be forced to sell our assets or those of our subsidiaries to make up for any shortfall in our payment obligations under unfavorable circumstances. Our 2007 Credit Facility limits our ability to sell assets and also restricts our use of the proceeds from any such sale. If we default on our debt obligations, our lenders could require immediate repayment of our entire outstanding debt. If our lenders require immediate repayment on the entire principal amount, we will not be able to repay them in full, and our inability to meet our debt obligations could result in bankruptcy or otherwise impair our ability to maintain sufficient liquidity to continue our operations.
Because we are a holding company, we may not be able to service our debt if our subsidiaries do not make sufficient distributions to us.
We have no direct operations and no significant assets other than investments in the stock of our subsidiaries. Because we conduct our business operations through our operating subsidiaries, we depend on those entities for payments and dividends to generate the funds necessary to meet our financial obligations. Legal restrictions, including state and local tax regulations and other contractual obligations could restrict or impair our subsidiaries’ ability to pay dividends or make loans or other distributions to us. The earnings from, or other available assets of, these operating subsidiaries may not be sufficient to make distributions to enable us to pay interest on our debt obligations when due or to pay the principal of such debt at maturity.
Restrictive covenants in our 2007 Credit Facility may restrict our ability to pursue business strategies.
Our 2007 Credit Facility and our other outstanding indebtedness include covenants limiting our ability to, among other things:
|
·
|
incur additional indebtedness;
|
|
·
|
pay dividends to our stockholders;
|
|
·
|
repurchase or redeem our stock;
|
|
·
|
repay indebtedness that is junior to our 2007 Credit Facility;
|
|
·
|
make investments and other restricted payments;
|
|
·
|
create liens securing debt or other encumbrances on our assets;
|
|
·
|
enter into sale-leaseback transactions;
|
|
·
|
enter into transactions with our stockholders and affiliates; and
|
|
·
|
sell or exchange assets.
|
Our 2007 Credit Facility also requires that we maintain various financial ratios, which we may not be able to achieve. The covenants may impair our ability to finance future operations or capital needs or to engage in other favorable business activities.
Our international operations are subject to a number of risks that could significantly reduce our profits and revenues or subject us to criminal and civil enforcement actions.
As a multinational company, we have operations in more than 40 countries and we derived 9% of our revenues from international operations for the year ended December 31, 2010. International business is subject to a variety of risks, including:
|
·
|
lack of developed legal systems to enforce contractual rights;
|
|
·
|
greater risk of uncollectible accounts and longer collection cycles;
|
|
·
|
foreign currency exchange volatility;
|
|
·
|
uncertain and changing tax rules, regulations and rates;
|
|
·
|
logistical and communication challenges;
|
|
·
|
potentially adverse changes in laws and regulatory practices;
|
|
·
|
changes in labor conditions;
|
|
·
|
general economic, political and financial conditions in foreign markets; and
|
|
·
|
exposure to civil or criminal liability under the Foreign Corrupt Practices Act, anti-boycott rules, trade and export control regulations, and the Corporate Manslaughter and Corporate Homicide Act as well as other international regulations.
|
International risks and violations of international regulations may significantly reduce our profits and revenues and subject us to criminal or civil enforcement actions, including fines, suspensions or disqualification from future U.S. federal procurement contracting. Although we have policies and procedures to monitor legal and regulatory compliance, our employees, subcontractors and agents could take actions that violate these requirements. As a result, our international risk exposure may be more or less than the percentage of revenues attributed to our international operations.
We could be adversely affected by violations of the U.S. Foreign Corrupt Practices Act, the U.K. Bribery Act of 2010 and similar worldwide anti-bribery laws.
The U.S. Foreign Corrupt Practices Act and similar anti-bribery laws, such as the U.K. Bribery Act of 2010, generally prohibit companies and their intermediaries from making improper payments to foreign government officials for the purpose of obtaining or retaining business. Practices in the local business community of many countries outside the U.S. have a level of government corruption that is greater than that found in the developed world. Our policies mandate compliance with these anti-bribery laws and we have established policies and procedures designed to monitor compliance with these anti-bribery law requirements; however we cannot assure that our policies and procedures will protect us from potential reckless or criminal acts committed by individual employees or agents. If we are found to be liable for anti-bribery law violations we could suffer from criminal or civil penalties or other sanctions that could have a material adverse effect on our business.
We could be adversely impacted if we fail to comply with domestic and international export laws.
To the extent we export technical services, data and products outside of the United States, we are subject to U.S. and international laws and regulations governing international trade and exports, including but not limited to the International Traffic in Arms Regulations, the Export Administration Regulations and trade sanctions against embargoed countries, which are administered by the Office of Foreign Assets Control of the Department of Treasury. A failure to comply with these laws and regulations could result in civil or criminal sanctions, including the imposition of fines, the denial of export privileges and suspension or debarment from participation in U.S. government contracts, which could have a material adverse effect on our business.
Our international operations may require our employees to travel to and work in high security risk countries, which may result in employee death or injury, repatriation costs or other unforeseen costs.
As a multinational company, some of our employees often travel to and work in high security risk countries around the world that are undergoing political, social and economic upheavals resulting in war, civil unrest, criminal activity, acts of terrorism, or public health crises. For example, we have employees working in high security risk countries located in the Middle East and Southwest Asia. As a result, we risk loss of or injury to our employees and may be subject to costs related to employee death or injury, repatriation or other unforeseen circumstances.
We rely on information technology to run our business, including third-party internal and outsourced software to run our critical accounting, project management and financial information systems. Any sudden loss, breach of security, disruption or unexpected data or vendor loss could significantly increase our operational expense and disrupt our business operations.
We rely on information technology to run our business. If we are unable to maintain and upgrade our systems and network infrastructure, our business operation could be interrupted or delayed. We also rely on third-party internal and outsourced software to run our critical accounting, project management and financial information systems. For example, we rely on one software vendor’s products to process a majority of our total revenues. We also depend on our software vendors to provide long-term software maintenance support for our information systems. Software vendors may decide to discontinue further development, integration or long-term software maintenance support for our information systems, in which case, we may need to abandon one or more of our current information systems and migrate some or all of our accounting, project management and financial information to other systems, thus increasing our operational expense as well as disrupting the management of our business operations. Any system interruption, delay, breach of security, loss of data or loss of a vendor could also adversely affect our operating results.
Force majeure events, including natural disasters and terrorists’ actions have negatively impacted and could further negatively impact our business, which may affect our financial condition, results of operations or cash flows.
Force majeure or extraordinary events beyond the control of the contracting parties, such as natural and man-made disasters, as well as terrorist actions, could negatively impact the economies in which we operate. For example, in August 2005, Hurricane Katrina caused several of our Gulf Coast offices to close, interrupted a number of active client projects and forced the relocation of our employees in that region from their homes. In addition, during the September 11, 2001 terrorist attacks, many client records were destroyed when our office at the World Trade Center was destroyed.
We typically remain obligated to perform our services after such extraordinary events unless the contract contains a force majeure clause relieving us of our contractual obligations in such an extraordinary event. If we are not able to react quickly to force majeure events, our operations may be affected significantly, which would have a negative impact on our financial condition, results of operations and/or cash flows.
Negotiations with labor unions and possible work actions could divert management attention and disrupt operations. In addition, new collective bargaining agreements or amendments to agreements could increase our labor costs and operating expenses.
As of January 28, 2011, approximately 13% of our employees were covered by collective bargaining agreements. The outcome of any future negotiations relating to union representation or collective bargaining agreements may not be favorable to us. We may reach agreements in collective bargaining that increase our operating expenses and lower our net income as a result of higher wages or benefit expenses. In addition, negotiations with unions could divert management attention and disrupt operations, which may adversely affect our results of operations. If we are unable to negotiate acceptable collective bargaining agreements, we may have to address the threat of union-initiated work actions, including strikes. Depending on the nature of the threat or the type and duration of any work action, these actions could disrupt our operations and adversely affect our operating results.
We have a limited ability to protect our intellectual property rights, which are important to our success. Our failure to protect our intellectual property rights could adversely affect our competitive position.
Our success depends, in part, upon our ability to protect our proprietary information and other intellectual property. We rely principally on a combination of trade secrets, confidentiality policies and other contractual arrangements to protect much of our intellectual property. Trade secrets are generally difficult to protect. Although our employees are subject to confidentiality obligations, this protection may be inadequate to deter or prevent misappropriation of our confidential information. In addition, we may be unable to detect unauthorized use of our intellectual property or otherwise take appropriate steps to enforce our rights. Failure to obtain or maintain our intellectual property rights would adversely affect our competitive business position. In addition, if we are unable to prevent third parties from infringing or misappropriating our intellectual property, our competitive position could be adversely affected.
Delaware law and our charter documents may impede or discourage a merger, takeover or other business combination even if the business combination would have been in the best interests of our stockholders.
We are a Delaware corporation and the anti-takeover provisions of Delaware law impose various impediments to the ability of a third party to acquire control of us, even if a change in control would be beneficial to our stockholders. In addition, our Board of Directors has the power, without stockholder approval, to designate the terms of one or more series of preferred stock and issue shares of preferred stock, which could be used defensively if a takeover is threatened. Our incorporation under Delaware law, the ability of our Board of Directors to create and issue a new series of preferred stock and provisions in our certificate of incorporation and bylaws, such as those relating to advance notice of certain stockholder proposals and nominations, could impede a merger, takeover or other business combination involving us or discourage a potential acquirer from making a tender offer for our common stock, even if the business combination would have been in the best interests of our current stockholders.
Our stock price could become more volatile and stockholders’ investments could lose value.
In addition to the macroeconomic factors that have recently affected the prices of many securities generally, all of the factors discussed in this section could affect our stock price. The timing of announcements in the public markets regarding new services or potential problems with the performance of services by us or our competitors or any other material announcements could affect our stock price. Speculation in the media and analyst community, changes in recommendations or earnings estimates by financial analysts, changes in investors’ or analysts’ valuation measures for our stock and market trends unrelated to our stock can cause the price of our stock to change. Continued volatility in the financial markets could also cause further declines in our stock price, which could trigger an impairment of the goodwill of our individual reporting units that could be material to our consolidated financial statements. A significant drop in the price of our stock could also expose us to the risk of securities class action lawsuits, which could result in substantial costs and divert managements’ attention and resources, which could adversely affect our business.
MINING SAFETY INFORMATION
Section 1503 of the Dodd-Frank Wall Street Reform and Consumer Protection Act requires domestic mine operators to disclose violations and orders issued under the Federal Mine Safety and Health Act of 1977 (the “Mine Act”) by the federal Mine Safety and Health Administration (“MSHA”). We do not act as the owner of any mines, but we may act as a mining operator as defined under the Mine Act where we may be a lessee of a mine, a person who operates, controls or supervises such mine, or as an independent contractor performing services or construction of such mine.
The following tables provide information for the three months and year ended December 31, 2010.
|
Mine (1)
|
Mine Act
§104
Violations (2)
|
Mine Act
§104(b)
Orders (3)
|
Mine
Act
§104(d)
Citations
and
Orders (4)
|
Mine Act
§110(b)(2)
Violations (5)
|
Mine Act
§107(a)
Orders (6)
|
Proposed
Assessments
from MSHA
(In dollars
($))
|
Mining
Related
Fatalities
|
Mine
Act
§104(e)
Notice
(yes/no) (7)
|
Pending
Legal
Action
before
Federal
Mine
Safety
and Health
Review
Commission
(yes/no)
|
|||||||||||||||||||||
|
Three Months Ended December 31, 2010
|
||||||||||||||||||||||||||||||
|
Black Thunder Project
|
0 | 0 | 0 | 0 | 0 | $ | 0 | 0 |
No
|
No
|
||||||||||||||||||||
|
Monsanto Quarry
|
0 | 0 | 0 | 0 | 0 | $ | 0 | 0 |
No
|
No
|
||||||||||||||||||||
|
Pipestone Quarry
|
0 | 0 | 0 | 0 | 0 | $ | 0 | 0 |
No
|
No
|
||||||||||||||||||||
|
Year Ended December 31, 2010
|
||||||||||||||||||||||||||||||
|
Black Thunder Project
|
3 | 0 | 0 | 0 | 0 | $ | 376 | 0 |
No
|
No
|
||||||||||||||||||||
|
Monsanto Quarry
|
1 | 0 | 0 | 0 | 0 | $ | 100 | 0 |
No
|
No
|
||||||||||||||||||||
|
Pipestone Quarry
|
3 | 0 | 0 | 0 | 0 | $ | 308 | 0 |
No
|
Yes
|
||||||||||||||||||||
|
(1)
|
United States mines.
|
|
(2)
|
The total number of violations received from MSHA under §104 of the Mine Act, which includes citations for health or safety standards that could significantly and substantially contribute to a serious injury if left unabated.
|
|
(3)
|
The total number of orders issued by MSHA under §104(b) of the Mine Act, which represents a failure to abate a citation under §104 (a) within the period of time prescribed by MSHA.
|
|
(4)
|
The total number of citations and orders issued by MSHA under §104 (d) of the Mine Act for unwarrantable failure to comply with mandatory health or safety standards.
|
|
(5)
|
The total number of flagrant violations issued by MSHA under §110(b)(2) of the Mine Act.
|
|
(6)
|
The total number of orders issued by MSHA under §107(a) of the Mine Act for situations in which MSHA determined an imminent danger existed.
|
|
(7)
|
A written notice from the MSHA regarding a pattern of violations, or a potential to have such pattern under §104 (e) of the Mine Act.
|
None.
As of December 31, 2010, we owned four properties and had approximately 707 facility leases in locations throughout the world. The lease terms range from a minimum of month-to-month to a maximum of 25 years with options for renewal, expansions, contraction and termination, sublease rights and allowances for improvements. Our significant lease agreements expire at various dates through the year 2023. We believe that our current facilities are sufficient for the operation of our business and that suitable additional space in various local markets is available to accommodate any reasonable foreseeable needs that may arise. The following table summarizes our ten most significant leased properties by location based on annual rental expenses:
|
Property Location
|
Reporting Segment
|
|
|
Princeton, NJ
|
Energy & Construction
|
|
|
Tampa, FL
|
Infrastructure & Environment
|
|
|
Denver, CO
|
Energy & Construction/
Infrastructure & Environment
|
|
|
New York, NY
|
Infrastructure & Environment
|
|
|
Gaithersburg, MD
|
Infrastructure & Environment
|
|
|
Austin, TX
|
Infrastructure & Environment
|
|
|
San Francisco, CA
|
Corporate / Infrastructure & Environment
|
|
|
Boise, ID
|
Energy & Construction
|
|
|
Oakland, CA
|
Infrastructure & Environment
|
|
|
Fort Mill, SC
|
Energy & Construction
|
Various legal proceedings are pending against us and our affiliates. The resolution of outstanding claims and litigation is subject to inherent uncertainty, and it is reasonably possible that resolution of any of the outstanding claims or litigation matters could have a material adverse effect on us. See Note 16, “Commitments and Contingencies,” to our “Consolidated Financial Statements and Supplementary Data” included under Item 8 of this report for a discussion of our legal proceedings, the discussion of which is incorporated into this item by reference.
None.
PART II
Market information
Our common stock is listed on the New York Stock Exchange under the symbol “URS.” As of February 21, 2011, we had approximately 3,086 stockholders of record. The following table sets forth the high and low sale prices of our common stock for the periods indicated.
|
2010
|
2009
|
|||||||||||||||
|
Sale Price per Share
|
Low
|
High
|
Low
|
High
|
||||||||||||
|
First Quarter
|
$ | 42.67 | $ | 50.47 | $ | 27.66 | $ | 44.80 | ||||||||
|
Second Quarter
|
$ | 37.49 | $ | 53.25 | $ | 38.67 | $ | 53.12 | ||||||||
|
Third Quarter
|
$ | 35.09 | $ | 43.26 | $ | 41.05 | $ | 51.58 | ||||||||
|
Fourth Quarter
|
$ | 37.65 | $ | 43.92 | $ | 38.03 | $ | 45.83 | ||||||||
We have not paid cash dividends since 1986, and at the present time, we do not anticipate paying dividends on our outstanding common stock in the near future. In addition, we are precluded by provisions in our 2007 Credit Facility from paying cash dividends on our outstanding common stock until our Consolidated Leverage Ratio is equal to or less than 1.00:1.00. Please refer to Note 9, “Indebtedness” and Note 14, “Stockholders’ Equity” to our “Consolidated Financial Statements and Supplementary Data” included under Item 8 of this report.
Stock Purchases
The following table sets forth all purchases made by us or any “affiliated purchaser” as defined in Rule 10b-18(a)(3) of the Securities Exchange Act of 1934, as amended, of our common stock during the fourth quarter of 2010.
|
Period (In thousands, except average price paid per share)
|
(a) Total Number of Shares Purchased (1)
|
(b) Average Price Paid per Share
|
(c) Total Number of Shares Purchased as Part of Publicly Announced Plans or Programs (2)
|
(d) Maximum Number of Shares that May Yet be Purchased Under the Plans or Programs (2)
|
||||||||||||
|
October 2, 2010 – October 29, 2010
|
— | $ | — | — | ||||||||||||
|
October 30, 2010 – November 26, 2010
|
— | $ | — | — | ||||||||||||
|
November 27, 2010 – December 31, 2010
|
23 | $ | 43.09 | 1,000 | 2,000 | |||||||||||
|
Total
|
23 | 1,000 | 2,000 | |||||||||||||
|
(1)
|
Reflects purchases of shares previously issued pursuant to awards issued under our equity incentive plans, which allow our employees to surrender shares of our common stock as payment toward the exercise cost and tax withholding obligations associated with the exercise of stock options or the vesting of restricted or deferred stock.
|
|
(2)
|
On March 26, 2007, we announced that our Board of Directors approved a common stock repurchase program that will allow the repurchase of up to one million shares of our common stock plus additional shares issued or deemed issued under our stock incentive plans and Employee Stock Purchase Plan for the period from December 30, 2006 through January 1, 2010 (excluding shares issuable upon the exercise of options granted prior to December 30, 2006). On February 26, 2010, the Board of Directors approved to extend the stock repurchase period from January 2, 2010 through December 28, 2012. On September 10, 2010, the Board of Directors approved an increase and extension of the stock repurchase program that conformed to the terms of our 2007 Credit Facility, as amended. Under the modified stock repurchase program, we were authorized to repurchase, in each of the fiscal years during the period from January 2, 2010 through January 2, 2015, up to three million shares of our common stock, plus the number of shares of common stock equal to the excess, if any, of three million shares over the actual number of shares repurchased during the prior fiscal year. In addition, we are subject to covenants under our 2007 Credit Facility that may limit our ability to repurchase our common stock if we do not maintain various designated financial criteria. During the year ended December 31, 2010, we repurchased an aggregate of 3.0 million shares of our common stock. On February 25, 2011, our Board of Directors authorized an increase in the number of our common shares that we may repurchase in fiscal year 2011 from 3.0 million shares to 8.0 million shares, which was reflected in our third amendment to the 2007 Credit Facility.
|
The following selected financial data was derived from our consolidated financial statements. You should read the selected financial data presented below in conjunction with the information contained in Item 7, “Management’s Discussion and Analysis of Financial Condition and Results of Operations,” and our consolidated financial statements and the notes thereto contained in Item 8, “Consolidated Financial Statements and Supplementary Data,” of this report.
|
(In millions, except per share data)
|
Year Ended December 31,
2010 (1,2)
|
Year Ended January 1,
2010 (1)
|
Year Ended January 2,
2009 (1)
|
Year Ended December 28,
2007 (1,3)
|
Year Ended December 29,
2006 (1)
|
|||||||||||||||
|
Income Statement Data:
|
||||||||||||||||||||
|
Revenues
|
$ | 9,177.1 | $ | 9,249.1 | $ | 10,086.3 | $ | 5,383.0 | $ | 4,222.9 | ||||||||||
|
Cost of revenues
|
(8,609.5 | ) | (8,772.4 | ) | (9,608.8 | ) | (5,095.2 | ) | (3,978.1 | ) | ||||||||||
|
General and administrative expenses
|
(71.0 | ) | (75.8 | ) | (78.7 | ) | (56.5 | ) | (43.3 | ) | ||||||||||
|
Acquisition-related expenses (2)
|
(11.9 | ) | — | — | — | — | ||||||||||||||
|
Restructuring costs (4)
|
(10.6 | ) | — | — | — | — | ||||||||||||||
|
Impairment of an intangible asset (5)
|
— | (32.8 | ) | — | — | — | ||||||||||||||
|
Equity in income of unconsolidated joint ventures (6)
|
70.3 | 100.9 | 106.3 | 31.5 | 17.3 | |||||||||||||||
|
Operating income
|
544.4 | 469.0 | 505.1 | 262.8 | 218.8 | |||||||||||||||
|
Other income, net (7)
|
— | 47.9 | — | — | — | |||||||||||||||
|
Net income attributable to URS
|
287.9 | 269.1 | 219.8 | 132.2 | 113.0 | |||||||||||||||
|
Earnings per share:
|
||||||||||||||||||||
|
Basic
|
$ | 3.56 | $ | 3.31 | $ | 2.61 | $ | 2.33 | $ | 2.19 | ||||||||||
|
Diluted
|
$ | 3.54 | $ | 3.29 | $ | 2.59 | $ | 2.30 | $ | 2.15 | ||||||||||
|
Balance Sheet Data (As of the end of period):
|
||||||||||||||||||||
|
Total assets
|
$ | 7,351.4 | $ | 6,904.4 | $ | 7,001.2 | $ | 6,930.0 | $ | 2,581.0 | ||||||||||
|
Total long-term debt
|
$ | 641.3 | $ | 689.7 | $ | 1,091.5 | $ | 1,288.8 | $ | 149.5 | ||||||||||
|
Total URS stockholders’ equity (8)
|
$ | 4,117.2 | $ | 3,905.8 | $ | 3,624.6 | $ | 3,478.6 | $ | 1,506.7 | ||||||||||
|
Total noncontrolling interests
|
$ | 83.8 | $ | 44.7 | $ | 31.1 | $ | 25.1 | $ | 3.5 | ||||||||||
|
Total stockholders’ equity
|
$ | 4,200.9 | $ | 3,950.5 | $ | 3,655.8 | $ | 3,503.7 | $ | 1,510.2 | ||||||||||
|
(1)
|
Our fiscal year is the 52/53-week period ending on the Friday closest to December 31. Our fiscal year ended January 2, 2009 contained 53 weeks.
|
|
(2)
|
In September 2010, we completed the acquisition of Scott Wilson. The operating results of Scott Wilson from the acquisition date through December 31, 2010 are included in our consolidated financial statements under the Infrastructure & Environment business. The total purchase consideration for this acquisition was $343 million. During the year ended December 31, 2010, we incurred acquisition-related expenses of $11.9 million. For further discussion, see Note 7, “Acquisition,” to our “Consolidated Financial Statements and Supplementary Data” included under Item 8 of this annual report.
|
|
(3)
|
In November 2007, we acquired Washington Group International, Inc. (“WGI”), resulting in the inclusion of WGI’s results of operations for the six-week period from November 16, 2007, the effective date of the acquisition for financial reporting purposes, through December 28, 2007, in our 2007 results of operations.
|
In connection with the WGI acquisition, we issued approximately 29.5 million shares of common stock valued at $1.8 billion and borrowed $1.4 billion under the 2007 Credit Facility. The 2007 Credit Facility provides for two term loan facilities in the aggregate amount of $1.4 billion and a revolving credit facility in the amount of $700.0 million.
|
(4)
|
For the year ended December 31, 2010, we recorded restructuring costs in our international businesses. For further discussion, see Note 16, “Commitments and Contingencies,” to our “Consolidated Financial Statements and Supplementary Data” included under Item 8 of this annual report.
|
|
(5)
|
For the year ended January 1, 2010, we recorded a $32.8 million charge for the impairment of our intangible asset related to the “Washington” trade name. On a net, after-tax basis, this transaction resulted in decreases to net income and diluted earnings per share (“EPS”) of $19.6 million and $0.24, respectively, for the year ended January 1, 2010. For further discussion, see Note 8, “Goodwill and Intangible Assets” to our “Consolidated Financial Statements and Supplementary Data” included under Item 8 of this annual report.
|
|
(6)
|
For the year ended December 31, 2010, we recorded a pre-tax non-cash asset impairment charge of $25.0 million or $0.18 per share on an after-tax basis on the SR-125 road project in California as a result of an adverse legal ruling. For further discussion, see Note 16, “Commitments and Contingencies,” to our “Consolidated Financial Statements and Supplementary Data” included under Item 8 of this annual report.
|
|
(7)
|
During fiscal year 2009, we recorded $47.9 million of other income, net, consisting of a $75.6 million gain associated with the sale of our equity investment in MIBRAG mbH (“MIBRAG”), net of $5.2 million of sale-related costs. This gain was partially offset by a $27.7 million loss on the settlement of a foreign currency forward contract, which primarily hedged our net investment in MIBRAG. On a net, after-tax basis, these two transactions resulted in increases to net income and diluted EPS of $30.6 million and $0.37, respectively, for the year ended January 1, 2010. For further discussion, see Note 5, “Joint Ventures” and Note 9, “Indebtedness” to our “Consolidated Financial Statements and Supplementary Data” included under Item 8 of this annual report.
|
|
(8)
|
We have not paid cash dividends to our stockholders since 1986 and we are precluded from paying cash dividends to our stockholders on outstanding common stock under the provisions of our 2007 Credit Facility until our Consolidated Leverage Ratio is equal to or less than 1.00:1.00.
|
The following discussion contains, in addition to historical information, forward-looking statements that involve risks and uncertainties. Our actual results could differ materially from those described herein. You should read this section in conjunction with Item 1A, “Risk Factors,” of this report beginning on page 17 and the consolidated financial statements and notes thereto contained in Item 8, “Consolidated Financial Statements and Supplementary Data,” of this report.
BUSINESS SUMMARY
We are a leading international provider of engineering, construction and technical services. We offer a broad range of program management, planning, design, engineering, construction and construction management, operations and maintenance, and decommissioning and closure services to public agencies and private sector clients around the world. We also are a major U.S. federal government contractor in the areas of systems engineering and technical assistance, and operations and maintenance. We have more than 47,000 employees in a global network of offices and contract-specific job sites in more than 40 countries. We provide services through three businesses: Infrastructure & Environment, Federal Services and Energy & Construction.
We generate revenues by providing fee-based professional and technical services and by executing construction contracts. As a result, our professional and technical services are primarily labor intensive and our construction projects are labor and capital intensive. To derive income from our revenues, we must effectively manage our costs.
Our revenues are dependent upon our ability to attract and retain qualified and productive employees, identify business opportunities, allocate our labor resources to profitable markets, secure new contracts, execute existing contracts and maintain existing client relationships. Moreover, as a professional services company, the quality of the work generated by our employees is integral to our revenue generation.
Our cost of revenues is comprised of the compensation we pay to our employees, including fringe benefits; the cost of subcontractors, construction materials and other project-related expenses; as well as segment administrative, marketing, sales, bid and proposal, rental and other overhead costs.
We report our financial results on a consolidated basis and for our three reporting segments: the Infrastructure & Environment business, the Federal Services business and the Energy & Construction business.
OVERVIEW AND BUSINESS TRENDS
Fiscal Year 2010 Results
Consolidated revenues for the year ended December 31, 2010 were $9.2 billion, a decrease of $72.0 million or 0.8% compared to revenues for fiscal year 2009. During the 2010 fiscal year, revenues grew in our federal and infrastructure market sectors, while we experienced a decline in revenues in our power and industrial and commercial market sectors, compared to our 2009 fiscal year. Net income attributable to URS increased 7.0% from $269.1 million for the year ended January 1, 2010 to $287.9 million for the year ended December 31, 2010.
Income tax expense
Our effective income tax rate for the year ended December 31, 2010 decreased to 30.1% from 37.9% for the year ended January 1, 2010. This reduction in the effective income tax rate increased net income attributable to URS by $42.1 million. See Note 12, “Income Taxes,” to our “Consolidated Financial Statements and Supplementary Data” included under Item 8 of this annual report for additional disclosure.
Cash Flows and Debt
During the year ended December 31, 2010, we generated $527.5 million in net cash from operations. (See “Consolidated Statements of Cash Flows” to our “Consolidated Financial Statements and Supplementary Data” included under Item 8 of this report.) Cash flows from operations decreased by $124.1 million for fiscal year 2010 compared with fiscal year 2009. This decrease was primarily due to the timing of payments from clients on accounts receivable; the use of advance payments from clients as projects moved towards completion; the timing of project performance payments and an increase in income tax payments. The decrease was partially offset by the timing of joint venture, vendor and subcontractor payments and lower interest payments in fiscal year 2010.
We also had the following cash outflows related to investing and financing activities:
|
·
|
payments of $291.7 million, net of cash acquired of $14.6 million, to fund the acquisition of Scott Wilson;
|
|
·
|
net payments of $174.7 million on long-term debt, lines of credit, short-term notes, and capital lease obligations;
|
|
·
|
net distributions of $107.2 million to noncontrolling interests; and
|
|
·
|
repurchases of common stock totaling $128.2 million.
|
Our ratio of debt to total capitalization (total debt divided by the sum of debt and total stockholders’ equity) decreased from 17% at January 1, 2010 to 14% at December 31, 2010. This financial ratio provides information that we believe to be useful regarding our leverage and financial solvency risk exposure.
On September 10, 2010, we completed the acquisition of Scott Wilson for total purchase consideration of $343 million. The operating results of Scott Wilson from the acquisition date through December 31, 2010 are included in our consolidated financial statements under the Infrastructure & Environment business. The operating results generated from this newly acquired business during this period were not material to our consolidated results for the year ended December 31, 2010. During the year ended December 31, 2010, we incurred acquisition-related expenses of $11.9 million. In addition, we accrued $10.6 million of restructuring costs for the year ended December 31, 2010. The majority of the restructuring costs, which consisted primarily of costs for severance and associated benefits, resulted from the integration of Scott Wilson into our existing U.K. and European business. The integration is expected to be completed in fiscal year 2011. We expect to incur additional restructuring costs related to the closure of excess facilities during fiscal year 2011.
Book of Business
As of December 31, 2010 and January 1, 2010, our total book of business was $29.1 billion and $29.4 billion, respectively. Please see Book of Business on page 13 for more information.
Business Trends
Given the current economic uncertainty, it is difficult to predict the impact of continuing global economic weakness on our business. In fiscal 2010, we experienced a modest decline in revenues compared to our 2009 fiscal year as many of our private sector clients continued to restrict capital spending. We are continuing to monitor the situation carefully to determine the potential impact on our business during our 2011 fiscal year. However, the continuing global uncertainty and challenging economic conditions may impair our ability to forecast the following business trends accurately.
We believe that our expectations regarding business trends are reasonable and are based on reasonable assumptions. However, such forward-looking statements, by their nature, involve risks and uncertainties and, in the current economic climate, may be subject to an unusual degree of uncertainty. You should read this discussion of business trends in conjunction with Item 1A, “Risk Factors,” of this report, which begins on page 17.
Power
Although revenues in our power market sector declined during the 2010 fiscal year, we expect revenues in this sector to grow during our 2011 fiscal year, based on increased procurement activity and recent contract awards in a number of markets. For example, we are seeing increased procurement activity and contract awards for our air quality and emissions control services as utilities make preparations to comply with consent decrees and federal emissions reduction deadlines.
In the nuclear power market, we expect continued demand for the types of services we provide to retrofit and upgrade nuclear power plants to increase the generating capacity and efficiency of these facilities. In addition, the Administration’s proposed 2012 budget request includes an additional $36 billion for loan guarantees for the development of new nuclear power plants. This would triple the current size of the DOE’s loan guarantee program. We also expect to continue to benefit from investments in transmission and distribution systems, as utilities invest in these systems to improve reliability and accommodate the delivery of renewable energy sources.
Infrastructure
Revenues in our infrastructure market grew during the 2010 fiscal year, and, given the diversity of funding sources for infrastructure programs, we expect revenues to grow in fiscal year 2011. Because of the economic downturn and lower tax revenues, many state and local governments have reduced spending for key infrastructure programs. As a result, an increasing proportion of our infrastructure work is being funded through sources other than tax revenues, such as bond measures, federal matching grants and dedicated tax measures. For example, many state and local governments have continued to raise capital for infrastructure programs by issuing bonds to fund a variety of transportation, education and public facilities projects. In addition, federal support for high-speed rail and other infrastructure projects remains strong. At the end of 2010, the Department of Transportation redirected $1.2 billion in ARRA funding to support high-speed rail projects in 13 states. Also, the Administration recently submitted a $556 billion budget request that would reauthorize the Safe, Accountable, Flexible, Efficient Transportation Equity Act: A Legacy for Users (“SAFETEA-LU”) for the next six years. SAFETEA-LU provides federal matching funds to state governments for highway and transit projects. At the same time, the outcome of ongoing political debate in Congress over government spending could result in reductions in the funding proposed by the Administration for infrastructure projects.
In addition, the acquisition of Scott Wilson has enhanced our infrastructure capabilities outside the U.S., which we anticipate will create new opportunities to increase our revenues from the infrastructure market sector. For example, in the U.K., where Scott Wilson has a major presence, the U.K. Coalition Government has introduced a five-year National Infrastructure Plan. The plan includes investments of more than $320 billion for infrastructure projects from 2011 through 2015.
Federal
Revenues from our federal government clients increased during 2010, and we expect revenues in this market sector to continue to grow in the 2011 fiscal year based on the diversification of our federal business, steady demand for outsourced services from the DOD and DOE, and relatively stable funding for the type of work we perform. Although the Administration has announced plans to reduce defense spending, the DOD’s fiscal 2012 budget request includes relatively stable funding for many of the budget line items that support our DOD work. This includes $204.4 billion for the operations and maintenance line item, a 10% increase over the 2011 continuing resolution amount and $75.3 billion for the research, development, test and evaluation line item, 6% lower than the 2011 continuing resolution amount. These proposed funding levels are consistent with the DOD’s practice of outsourcing the types of specialized engineering and technical services we provide.
In addition, we anticipate sustained funding for the environmental and nuclear management services we provide to the DOE and U.K NDA. The DOE’s fiscal 2012 budget request includes $6.1 billion for environmental management programs, a $132 million increase from the fiscal 2011 continuing resolution funding level and an increase of $124 million from fiscal 2010. In the U.K., we also expect to continue to benefit from stable funding for the work we perform for the NDA. Despite budget cuts for many agencies, the U.K. Coalition Government has provided $4.6 billion in annual funding for the NDA over the next four years.
Industrial and Commercial
Although revenues from our industrial and commercial sector declined in fiscal year 2010, we expect revenues from this sector to grow in fiscal 2011, as a result of increased procurement activity and potential contract awards, particularly in the oil and gas and mining markets. With the stabilization of oil prices, several of our clients are moving forward with projects in the Canadian oil sands region and on the Trans-Alaska Pipeline project. As a result, we are beginning to provide preliminary engineering and design services for projects that had previously been postponed. We believe our ability to support the initial phases of these projects positions us well to capture larger assignments as they move into the engineering and construction phases.
In the mining market, rising commodity prices for base and precious metals, largely driven by demand from India and China, is accelerating our work on mining projects in Australia. In addition, we expect revenues will continue to grow from the environmental and engineering work we perform under our long-term Master Service Agreements (“MSAs”) with multinational clients, and the acquisition of Scott Wilson provides us with additional resources to support our MSA clients outside the United States.
Other Business Trends
The diversification of our business and changes in the mix and timing of our fixed-price, target-price and other contracts can cause earnings and profit margins to vary between periods. For example, we continue to experience an increase in the number of fixed-price contracts, particularly among clients in the federal sector. This increase in fixed-price contracting creates additional risks of incurring losses and opportunities for achieving higher margins on these contracts. In addition, earnings recognition on many contracts is measured based on progress achieved as a percentage of the total project effort or upon the completion of milestones or performance criteria rather than evenly or linearly over the period of performance. Our government clients are increasingly using IDCs that require us to engage in a competitive procurement process before any task orders are issued as compared to traditional award contracts. This trend changes the relationship between backlog and revenues, although revenues from IDC task orders can equal those from traditional contracts. Increases in IDCs will typically lower our reported backlog and increase our reported IDC in our book of business.
We cannot determine if proposed climate change and greenhouse gas regulations would materially impact our business or our clients’ businesses at this time; however, any new regulations could impact the demand for the services we provide to our clients. For example, depending on legislation enacted, we could see reduced client demand for our services related to fossil fuel and industrial projects, and increased demand for environmental, infrastructure and nuclear and alternative energy related services.
The Year Ended December 31, 2010 Compared with the Year Ended January 1, 2010
Consolidated
|
Year Ended
|
||||||||||||||||
|
(In millions, except percentages and per share amounts)
|
December 31,
2010
|
January 1,
2010
|
Increase (Decrease)
|
Percentage Increase (Decrease)
|
||||||||||||
|
Revenues
|
$ | 9,177.1 | $ | 9,249.1 | $ | (72.0 | ) | (0.8 | %) | |||||||
|
Cost of revenues
|
(8,609.5 | ) | (8,772.4 | ) | (162.9 | ) | (1.9 | %) | ||||||||
|
General and administrative expenses
|
(71.0 | ) | (75.8 | ) | (4.8 | ) | (6.4 | %) | ||||||||
|
Acquisition-related expenses
|
(11.9 | ) | — | 11.9 | N/M | |||||||||||
|
Restructuring costs
|
(10.6 | ) | — | 10.6 | N/M | |||||||||||
|
Impairment of an intangible asset
|
— | (32.8 | ) | (32.8 | ) | N/M | ||||||||||
|
Equity in income of unconsolidated joint ventures
|
70.3 | 100.9 | (30.6 | ) | (30.4 | %) | ||||||||||
|
Operating income
|
544.4 | 469.0 | 75.4 | 16.1 | % | |||||||||||
|
Interest expense
|
(30.6 | ) | (48.4 | ) | (17.8 | ) | (36.9 | %) | ||||||||
|
Other income, net
|
— | 47.9 | (47.9 | ) | N/M | |||||||||||
|
Income before income taxes
|
513.8 | 468.5 | 45.3 | 9.7 | % | |||||||||||
|
Income tax expense
|
(154.9 | ) | (177.6 | ) | (22.7 | ) | (12.8 | %) | ||||||||
|
Net income
|
358.9 | 290.9 | 68.0 | 23.4 | % | |||||||||||
|
Noncontrolling interests in income of consolidated subsidiaries, net of tax
|
(71.0 | ) | (21.8 | ) | 49.2 | 225.9 | % | |||||||||
|
Net income attributable to URS
|
$ | 287.9 | $ | 269.1 | $ | 18.8 | 7.0 | % | ||||||||
|
Diluted earnings per share
|
$ | 3.54 | $ | 3.29 | $ | 0.25 | 7.6 | % | ||||||||
N/M = Not meaningful
The following table presents our consolidated revenues by market sector and business for the years ended December 31, 2010 and January 1, 2010.
| Year Ended | ||||||||||||||||
|
(In millions, except percentages)
|
December 31,
2010
|
January 1,
2010
|
Increase (Decrease)
|
Percentage Increase (Decrease)
|
||||||||||||
|
Revenues
|
||||||||||||||||
|
Power sector
|
||||||||||||||||
|
Infrastructure & Environment
|
$ | 156.5 | $ | 144.2 | $ | 12.3 | 8.5 | % | ||||||||
|
Federal Services
|
— | — | — | — | ||||||||||||
|
Energy & Construction
|
952.7 | 1,248.0 | (295.3 | ) | (23.7 | %) | ||||||||||
|
Power Total
|
1,109.2 | 1,392.2 | (283.0 | ) | (20.3 | %) | ||||||||||
|
Infrastructure sector
|
||||||||||||||||
|
Infrastructure & Environment
|
1,402.8 | 1,400.4 | 2.4 | 0.2 | % | |||||||||||
|
Federal Services
|
— | — | — | — | ||||||||||||
|
Energy & Construction
|
499.6 | 262.8 | 236.8 | 90.1 | % | |||||||||||
|
Infrastructure Total
|
1,902.4 | 1,663.2 | 239.2 | 14.4 | % | |||||||||||
|
Federal sector
|
||||||||||||||||
|
Infrastructure & Environment
|
682.7 | 675.7 | 7.0 | 1.0 | % | |||||||||||
|
Federal Services
|
2,581.2 | 2,558.1 | 23.1 | 0.9 | % | |||||||||||
|
Energy & Construction
|
1,259.5 | 907.0 | 352.5 | 38.9 | % | |||||||||||
|
Federal Total
|
4,523.4 | 4,140.8 | 382.6 | 9.2 | % | |||||||||||
|
Industrial and commercial sector
|
||||||||||||||||
|
Infrastructure & Environment
|
972.2 | 901.0 | 71.2 | 7.9 | % | |||||||||||
|
Federal Services
|
— | — | — | — | ||||||||||||
|
Energy & Construction
|
669.9 | 1,151.9 | (482.0 | ) | (41.8 | %) | ||||||||||
|
Industrial and Commercial Total
|
1,642.1 | 2,052.9 | (410.8 | ) | (20.0 | %) | ||||||||||
|
Total revenues, net of eliminations
|
$ | 9,177.1 | $ | 9,249.1 | $ | (72.0 | ) | (0.8 | %) | |||||||
Businesses
|
(In millions, except percentages)
|
Infrastructure & Environment
|
Federal Services
|
Energy & Construction
|
Eliminations
|
Corporate
|
Total
|
||||||||||||||||||
|
Year ended December 31, 2010
|
||||||||||||||||||||||||
|
Revenues
|
$ | 3,248.5 | $ | 2,582.8 | $ | 3,420.6 | $ | (74.8 | ) | $ | — | $ | 9,177.1 | |||||||||||
|
Cost of revenues
|
(3,006.0 | ) | (2,423.1 | ) | (3,255.2 | ) | 74.8 | — | (8,609.5 | ) | ||||||||||||||
|
General and administrative expenses
|
— | — | — | — | (71.0 | ) | (71.0 | ) | ||||||||||||||||
|
Acquisition-related expenses
|
(11.9 | ) | — | — | — | — | (11.9 | ) | ||||||||||||||||
|
Restructuring costs
|
(10.6 | ) | — | — | — | — | (10.6 | ) | ||||||||||||||||
|
Equity in income of unconsolidated joint ventures
|
2.9 | 5.9 | 61.5 | — | — | 70.3 | ||||||||||||||||||
|
Operating income (loss)
|
$ | 222.9 | $ | 165.6 | $ | 226.9 | $ | — | $ | (71.0 | ) | $ | 544.4 | |||||||||||
|
Year ended January 1, 2010
|
||||||||||||||||||||||||
|
Revenues
|
$ | 3,170.4 | $ | 2,561.3 | $ | 3,583.9 | $ | (66.5 | ) | $ | — | $ | 9,249.1 | |||||||||||
|
Cost of revenues
|
(2,920.9 | ) | (2,420.0 | ) | (3,498.0 | ) | 66.5 | — | (8,772.4 | ) | ||||||||||||||
|
General and administrative expenses
|
— | — | — | — | (75.8 | ) | (75.8 | ) | ||||||||||||||||
|
Impairment of an intangible asset
|
— | (3.8 | ) | (29.0 | ) | — | — | (32.8 | ) | |||||||||||||||
|
Equity in income of unconsolidated joint ventures
|
6.2 | 5.7 | 89.0 | — | — | 100.9 | ||||||||||||||||||
|
Operating income (loss)
|
$ | 255.7 | $ | 143.2 | $ | 145.9 | $ | — | $ | (75.8 | ) | $ | 469.0 | |||||||||||
|
Increase (decrease) for the year ended December 31, 2010
vs. the year ended January 1, 2010
|
||||||||||||||||||||||||
|
Revenues
|
$ | 78.1 | $ | 21.5 | $ | (163.3 | ) | $ | 8.3 | $ | — | $ | (72.0 | ) | ||||||||||
|
Cost of revenues
|
85.1 | 3.1 | (242.8 | ) | 8.3 | — | (162.9 | ) | ||||||||||||||||
|
General and administrative expenses
|
— | — | — | — | (4.8 | ) | (4.8 | ) | ||||||||||||||||
|
Acquisition-related expenses
|
11.9 | — | — | — | — | 11.9 | ||||||||||||||||||
|
Restructuring costs
|
10.6 | — | — | — | — | 10.6 | ||||||||||||||||||
|
Impairment of an intangible asset
|
— | (3.8 | ) | (29.0 | ) | — | — | (32.8 | ) | |||||||||||||||
|
Equity in income of unconsolidated joint ventures
|
(3.3 | ) | 0.2 | (27.5 | ) | — | — | (30.6 | ) | |||||||||||||||
|
Operating income (loss)
|
(32.8 | ) | 22.4 | 81.0 | — | 4.8 | 75.4 | |||||||||||||||||
|
Percentage increase (decrease) for the year ended December 31, 2010
vs. the year ended January 1, 2010
|
||||||||||||||||||||||||
|
Revenues
|
2.5 | % | 0.8 | % | (4.6 | %) | 12.5 | % | — | (0.8 | %) | |||||||||||||
|
Cost of revenues
|
2.9 | % | 0.1 | % | (6.9 | %) | 12.5 | % | — | (1.9 | %) | |||||||||||||
|
General and administrative expenses
|
— | — | — | — | (6.4 | %) | (6.4 | %) | ||||||||||||||||
|
Acquisition-related expenses
|
N/M | — | — | — | — | N/M | ||||||||||||||||||
|
Restructuring costs
|
N/M | N/M | N/M | — | — | N/M | ||||||||||||||||||
|
Impairment of an intangible asset
|
— | N/M | N/M | — | — | N/M | ||||||||||||||||||
|
Equity in income of unconsolidated joint ventures
|
(53.2 | %) | 3.5 | % | (30.9 | %) | — | — | (30.4 | %) | ||||||||||||||
|
Operating income (loss)
|
(12.8 | %) | 15.6 | % | 55.5 | % | — | 6.4 | % | 16.1 | % | |||||||||||||
N/M = Not meaningful
Revenues
Our consolidated revenues for the year ended December 31, 2010 were $9.2 billion, a decrease of $72.0 million or 0.8%, compared with the year ended January 1, 2010. Revenues from our Infrastructure & Environment business for the year ended December 31, 2010 were $3.2 billion, an increase of $78.1 million or 2.5%, compared with the year ended January 1, 2010. Revenues from our Federal Services business for the year ended December 31, 2010 were $2.6 billion, an increase of $21.5 million or 0.8%, compared with the year ended January 1, 2010. Revenues from our Energy & Construction business for the year ended December 31, 2010 were $3.4 billion, a decrease of $163.3 million or 4.6%, compared with the year ended January 1, 2010.
The revenues reported above for each of our businesses are presented prior to the elimination of inter-segment transactions. Our analysis of these changes in revenues is set forth below.
Power
Consolidated revenues from our power market sector were $1.1 billion, a decrease of $283.0 million or 20.3%, for the year ended December 31, 2010 compared with the year ended January 1, 2010. The decline in revenues in the power sector reflects the completion of several major emissions control projects that experienced high levels of activity and generated significant revenues during the 2009 fiscal year. Projects of this type, which involve the retrofit of coal-fired power plants with clean air technology to reduce sulfur dioxide, mercury and other emissions, are driven by the timing of regulatory mandates to reduce emissions, such as the Clean Air Interstate Rule. Many of our clients completed projects to meet the 2010 deadline for emissions reductions and there has been a delay in the start-up of new projects. In addition, as a result of the economic downturn, some of our power clients have deferred or cancelled large capital improvement projects. This decrease in revenues was partially offset by strong demand for the engineering and construction services we provide to develop natural gas-fired power plants. Revenues also increased from large component replacement projects at existing nuclear power plants to increase the generating capacity and extend the service life of these facilities, as well as from the engineering support services we provide for the development of new nuclear power facilities.
The Infrastructure & Environment business’ revenues from our power market sector were $156.5 million, an increase of $12.3 million or 8.5%, for the year ended December 31, 2010 compared with the year ended January 1, 2010. The increase in revenues was primarily due to strong demand for the engineering, compliance, permitting and remediation services we provide to utilities to assist them in meeting regulatory requirements and mitigating the environmental impact of their operations. This increase in revenues was partially offset by a decline in activity on several emissions control projects.
The Energy & Construction business’ revenues from our power market sector were $952.7 million, a decrease of $295.3 million or 23.7%, for the year ended December 31, 2010 compared with the year ended January 1, 2010. The decline in revenues was primarily due to the completion of several major projects involving the retrofit of coal-fired power plants with clean air technologies, which accounted for a decrease in revenues of $441.1 million; a decrease in various power generation projects, which accounted for a decrease of $153.3 million; and the completion of a project to construct a uranium enrichment facility, which accounted for a decrease of $33.9 million. This decrease was partially offset by a revenue increase of $54.0 million from a new gas power plant project, an increase of $78.2 million due to high levels of activity on two clean air projects, and an increase of $34.9 million from new nuclear projects. Revenues also increased by $161.9 million as a result of the consolidation of a joint venture that provides engineering, procurement, maintenance, and construction services for large component replacement projects at nuclear power plants. This joint venture was previously accounted for under the equity method of accounting.
Infrastructure
Consolidated revenues from our infrastructure market sector were $1.9 billion, an increase of $239.2 million or 14.4%, for the year ended December 31, 2010 compared with the year ended January 1, 2010. The increase in revenues from our infrastructure market sector was primarily due to high levels of activity on a contract to construct a flood protection wall in Louisiana, as well as a dam construction project in Illinois. During the year, revenues also increased from the program management, planning, design, engineering and construction management services we provide to expand and modernize air transportation infrastructure, rail/transit and high-speed rail systems, and ports and harbors. Although the economic downturn and lower tax revenues have led to reductions in infrastructure spending by many state and local governments, an increasing portion of our infrastructure work is being funded through a variety of other sources, such as bonds, users’ fees, dedicated tax measures, the ARRA and other government funding.
The Infrastructure & Environment business’ revenues from our infrastructure market sector were $1.4 billion, including $92.8 million from Scott Wilson, an increase of $2.4 million or 0.2%, for the year ended December 31, 2010 compared with the year ended January 1, 2010. Excluding the results from Scott Wilson, our Infrastructure & Environment business experienced a decline in revenues from the infrastructure market sector. However, revenues increased from the program management, planning, design engineering and construction management services we provide to expand and modernize air transportation infrastructure, rail/transit and high-speed rail systems, and ports and harbors. Many of these projects are being funded by bonds, users’ fees, dedicated tax measures and the ARRA, helping to offset declines in spending by state and local governments. By contrast, revenues declined from the services we provide to develop and modernize surface transportation systems, schools and other public facilities.
The Energy & Construction business’ revenues from our infrastructure market sector were $499.6 million, an increase of $236.8 million or 90.1%, for the year ended December 31, 2010 compared with the year ended January 1, 2010. The increase was driven by high levels of activity on a new construction project to build a flood protection wall in Louisiana, which increased revenues by $189.4 million; a large dam construction project on the Ohio River, which increased revenues by $40.8 million; and the consolidation of four joint ventures that provide engineering, procurement, construction management, and operations and maintenance services, which increased revenues by $52.3 million. These joint ventures were previously accounted for under the equity method of accounting. This increase was partially offset by a decrease of $17.2 million related to market sector reclassifications from infrastructure to federal and two events recorded in the comparable period in the previous year: a $21.0 million favorable settlement of subcontractor claims and close-out activities for a highway construction project in California and a $7.0 million one-time award fee for a transit project in Washington, D.C.
Federal
Consolidated revenues from our federal market sector were $4.5 billion, an increase of $382.6 million or 9.2%, for the year ended December 31, 2010 compared with the year ended January 1, 2010. The increase in revenues reflects continued growth in the services we provide to the DOD, DOE, NASA and other U.S. federal government agencies. We continued to benefit from strong demand for systems engineering and technical assistance services to modernize aging weapons systems and develop new systems. Our revenues increased as a result of the restructuring of a DOE contract to provide nuclear management services for the treatment and disposal of high-level liquid waste. Revenues also increased from the operations and installations management support services we provide at military bases, test ranges, space flight centers and other government installations. In addition, revenues increased from our work managing chemical demilitarization programs to eliminate chemical and biological weapons. By contrast, we experienced a decline in revenues from the engineering and construction services we provide to build military infrastructure at installations in the United States and overseas in support of DOD activities to realign military bases and redeploy troops to meet the security needs of the post-Cold War era. This decrease was primarily due to the timing of several design-build contracts for military infrastructure, including the construction of a military hospital. These contracts experienced higher levels of activity and generated higher revenues during the 2009 fiscal year. Revenues also declined from the services we provide to maintain, modify and overhaul military aircraft and ground vehicles.
The Infrastructure & Environment business’ revenues from our federal market sector were $682.7 million, an increase of $7.0 million or 1.0%, for the year ended December 31, 2010 compared with the year ended January 1, 2010. We continued to experience strong demand for the engineering, construction and environmental services we provide to a variety of U.S. federal government agencies, including the General Services Administration, the Department of Veterans Affairs and the U.S. Fish and Wildlife Service. Revenues also increased from our work for the Department of Homeland Security, primarily due to high levels of activity on a Federal Emergency Management Agency contract to provide mapping and risk analysis of flood hazards in support of the National Flood Insurance Program. By contrast, we experienced a decline in revenues from the engineering and construction services we provide to the DOD to build military infrastructure at installations in the United States and overseas. This decrease was primarily due to the timing of several design-build contracts, including the construction of a military hospital, which experienced higher levels of activity and generated higher revenues during the 2009 fiscal year.
The Federal Services business’ revenues from our federal market sector were $2.6 billion, an increase of $23.1 million or 0.9%, for the year ended December 31, 2010 compared with the year ended January 1, 2010. We continued to benefit from strong demand for the systems engineering and technical assistance services we provide to the DOD for the development, testing and evaluation of new weapons systems and the modernization of aging weapons systems. In addition, revenues increased from our work managing the destruction of chemical weapons stockpiles at Army demilitarization facilities throughout the United States. These results also reflect strong demand for the operations and installations management services we provide to the DOD, NASA and other federal agencies in support of complex government and military installations, such as military bases, test ranges and space flight centers. By contrast, revenues declined from the services we provide to maintain, modify and overhaul military aircraft and ground vehicles.
The Energy & Construction business’ revenues from our federal market sector were $1.3 billion, an increase of $352.5 million or 38.9%, for the year ended December 31, 2010 compared with the year ended January 1, 2010. The increase was primarily driven by the restructuring of a DOE contract to provide nuclear management services for the treatment and disposal of high-level liquid waste, which resulted in an increase in revenues of $241.0 million compared to the same period in fiscal year 2009. The increase resulted from a change in the structure of the rebid contract from an agency contract to an at-risk contract. Revenues also increased by $72.3 million from a new contract to provide management and operations services to a federal energy technology laboratory, by $23.6 million from increased activity at a DOE nuclear waste treatment construction project, and by $17.2 million related to market sector reclassifications from infrastructure to federal.
Industrial and Commercial
Consolidated revenues from our industrial and commercial market sector were $1.6 billion, a decrease of $410.8 million or 20.0%, for the year ended December 31, 2010 compared with the year ended January 1, 2010. Our industrial and commercial market sector, which includes the work we perform for oil and gas, mining and manufacturing clients, continued to be the most exposed to the economic downturn during our 2010 fiscal year. We experienced a decline in revenues due largely to the delay or cancellation of major capital expenditure programs and the completion of several large-scale contracts that have not been replaced by comparable assignments. Revenues also decreased from the services we provide to develop and operate mines. During the 2009 fiscal year, many of our mining clients curtailed or suspended mine activities as a result of lower prices for metals and mineral resources; these contracts have not been replaced by comparable projects during fiscal year 2010. By contrast, revenues increased from the environmental work we provide under long-term MSAs with multinational corporations, as well as from the facilities management services we provide to manufacturing clients.
The Infrastructure & Environment business’ revenues from our industrial and commercial market sector were $972.2 million, an increase of $71.2 million or 7.9%, for the year ended December 31, 2010 compared with the year ended January 1, 2010. Revenues increased from the environmental and engineering work we provide under MSAs to multinational corporations, particularly among clients in the oil and gas industry. Because this work typically is driven by regulatory requirements and supports existing facility operations, it tends to be less susceptible to economic downturns and reductions in capital spending. Revenues also increased from the environmental services we provide to mining clients. By contrast, we experienced a decrease in demand for the engineering and construction-related services related to major capital improvement projects.
The Energy & Construction business’ revenues from our industrial and commercial market sector were $669.9 million, a decrease of $482.0 million or 41.8%, for the year ended December 31, 2010 compared with the year ended January 1, 2010. The decrease was primarily driven by the completion of major construction projects, including a $190.7 million decrease related to a cement manufacturing plant and a $271.5 million decrease related to various oil and gas projects. Also, due to the economic downturn and the decline in the prices of metals and mineral resources during 2009, many of our mining clients curtailed mining operations and, in some cases, closed mines. We have not replaced these contracts to develop and operate mines with comparable assignments, resulting in a $112.4 million decrease in our mining revenues compared to the prior year. This decrease was partially offset by a revenue increase of $40.1 million due to increased activity on a refinery construction project, an increase of $43.8 million from new oil and gas projects, and an increase of $13.1 million from increased activity at a facility management project.
Cost of Revenues
Our consolidated cost of revenues, which consists of labor, subcontractor costs and other expenses related to projects, and services provided to our clients, decreased by 1.9% for the year ended December 31, 2010 compared with the year ended January 1, 2010. Because our revenues are primarily service-based, the factors that caused revenues to decline also drove a corresponding decrease in our cost of revenues. Consolidated cost of revenues as a percent of revenues decreased from 94.8% for the year ended January 1, 2010 to 93.8% for the year ended December 31, 2010. See “Operating Income” for further discussion.
General and Administrative Expenses
Our consolidated general and administrative (“G&A”) expenses for the year ended December 31, 2010 decreased by 6.4% compared with the year ended January 1, 2010. The decrease was primarily caused by the reversal of a payroll tax liability of $2.8 million related to a prior acquisition and reductions in employee benefit costs of $5.3 million. These decreases were partially offset by foreign currency losses of $2.0 million and a $1.7 million increase in consulting services. Consolidated G&A expenses as a percent of revenues decreased slightly from 0.82% for the year ended January 1, 2010 to 0.77% for the year ended December 31, 2010.
Acquisition-related Expenses
Our consolidated acquisition-related expenses for the year ended December 31, 2010 were $11.9 million resulting from our acquisition of Scott Wilson on September 10, 2010. These expenses included legal fees, bank fees, consultation fees, travel expenses, and other miscellaneous direct and incremental administrative expenses associated with the acquisition.
Restructuring costs
Restructuring costs for the year ended December 31, 2010 were $10.6 million, which consisted primarily of costs for severance and associated benefits. The majority of the restructuring costs were accrued in the fourth quarter of fiscal year 2010 and resulted from the integration of Scott Wilson into our existing U.K. and European business. The integration is expected to be completed in fiscal year 2011. We expect to incur additional restructuring costs related to the closure of excess facilities during fiscal year 2011.
Impairment of an Intangible Asset
Impairment of an intangible asset for the year ended January 1, 2010 resulted in a fourth quarter charge of $32.8 million related to the “Washington” trade name due to our rebranding initiative. On a net, after-tax basis, this transaction resulted in decreases to net income and diluted EPS of $19.6 million and $0.24, respectively, for the year ended January 1, 2010.
Equity in Income of Unconsolidated Joint Ventures
Our consolidated equity in income of unconsolidated joint ventures for the year ended December 31, 2010 decreased by $30.6 million or 30.4% compared with the year ended January 1, 2010. The decrease was attributable primarily to the Energy & Construction business’ unconsolidated joint ventures as described below.
The Infrastructure & Environment business’ equity in income of unconsolidated joint ventures for the year ended December 31, 2010 decreased by $3.3 million or 53.2% compared with the year ended January 1, 2010, primarily due to the completion of several projects, including FEMA post-disaster response projects that have not been replaced.
The Energy & Construction business’ equity in income of unconsolidated joint ventures for the year ended December 31, 2010 decreased by $27.5 million or 30.9% compared with the year ended January 1, 2010 resulting from the following:
|
·
|
a $25.0 million decrease due to a charge taken on the SR-125 highway project as a result of an adverse legal ruling;
|
|
·
|
an $18.7 million decrease in equity in income reflecting the sale on June 10, 2009 of our equity investment in MIBRAG; and
|
|
·
|
a $26.0 million decrease as a result of the consolidation of a joint venture involved in a DOE nuclear clean-up project in Washington State, the consolidation of a joint venture that provides engineering, procurement, maintenance, and construction services for large nuclear component replacement projects and the consolidation of two joint ventures that provide construction management and operations and maintenance services. All of these joint ventures were not consolidated in the comparable period in fiscal year 2009.
|
These decreases were partially offset by:
|
·
|
a $32.9 million increase from the consolidation of a U.K. joint venture whose sole operations consist of an investment in another U.K. joint venture, which the initial joint venture did not consolidate during the year ended January 1, 2010;
|
|
·
|
a $5.7 million increase from a joint venture light rail project in Southern California, in which we recognized a loss in the comparable period in fiscal year 2009. We began to consolidate this joint venture at the beginning of fiscal year 2010; and
|
|
·
|
a $3.5 million increase from the consolidation of a second U.K. joint venture whose sole operations consist of an investment in another U.K. joint venture, which it consolidated during the year ended January 1, 2010 but did not consolidate during the year ended December 31, 2010.
|
Operating Income
Our consolidated operating income for the year ended December 31, 2010 increased by $75.4 million or 16.1% compared with the year ended January 1, 2010. Operating income as a percentage of revenues was 5.9% for fiscal year 2010 compared to 5.1% for fiscal year 2009. The increase in operating income was due to the consolidation of joint ventures at the beginning of our fiscal year 2010, a loss recognized in fiscal year 2009 on a common sulfur project, a write-off of the “Washington” trade name intangible asset in fiscal year 2009, higher award fees and performance-based incentive fees earned on various projects, as well as favorable price finalization and performance on a fixed-price U.S. government contract, a recovery related to legacy workers’ compensation and general liability insurance programs, foreign currency gains, and reductions in overhead costs resulting from the implementation of cost-control measures.
These increases in operating income were partially offset by a charge taken on the SR-125 highway project, acquisition-related expenses in connection with our acquisition of Scott Wilson, and restructuring costs resulting from the integration of Scott Wilson into our existing U.K. and European business. In addition, our operating income in fiscal year 2009 included earnings from MIBRAG, which was sold on June 10, 2009. These items are discussed in more detail below.
The Infrastructure & Environment business’ operating income for the year ended December 31, 2010 decreased by $32.8 million or 12.8% compared with the year ended January 1, 2010. The decrease in operating income was primarily due to $11.9 million of acquisition-related expenses in connection with our acquisition of Scott Wilson, $10.6 million of restructuring costs resulting from the integration of Scott Wilson into our existing U.K. and European business, and $4.8 million of amortization of intangible assets related to the acquisition of Scott Wilson. Overhead costs as a percentage of revenues, which excludes acquisition-related expenses and restructuring costs, increased from 30.8% for the year ended January 1, 2010 to 31.2% for the year ended December 31, 2010. The increase in overhead costs was primarily due to increases in insurance expense and employee benefit costs. In addition, we also experienced a decrease in equity in income of unconsolidated joint ventures as previously discussed. The decline in operating income was partially offset by $8.8 million of foreign currency gains. Operating income as a percentage of revenues was 6.9% for fiscal year 2010 compared to 8.1% in fiscal year 2009.
The Federal Services business’ operating income for the year ended December 31, 2010 increased by $22.4 million or 15.6% compared with the year ended January 1, 2010. The increase in operating income was primarily due to higher award fees and performance-based incentive fees earned on various DOD projects, as well as favorable price finalization and performance on a fixed-price U.S. government contract. This increase included $32.7 million in early completion incentive fees, and accelerated base and award fees earned on a chemical demilitarization contract. These increases in operating income were partially offset by declining revenues associated with military support activities in Iraq, a $7.1 million charge associated with cost growth on a fixed-price U.S. government contract, and delayed contract awards. Operating income as a percentage of revenues was 6.4% for fiscal year 2010 compared to 5.6% in fiscal year 2009.
The Energy & Construction business’ operating income for the year ended December 31, 2010 increased by $81.0 million or 55.5% compared with the year ended January 1, 2010. The increase in operating income was primarily due to the following:
|
·
|
a $31.1 million reduction in losses relative to the prior year resulting from our sulfur processing facility where we recognized a loss of $5.8 million for the year ended December 31, 2010 compared to a loss of $36.9 million for the year ended January 1, 2010;
|
|
·
|
a $64.7 million increase resulting from the consolidation of joint ventures during fiscal year 2010, which were not consolidated during fiscal year 2009;
|
|
·
|
an increase of $22.5 million related to favorable performance on a target-price clean air contract;
|
|
·
|
an increase of $10.0 million due to the achievement and recognition of a schedule incentive on a clean air project;
|
|
·
|
a $54.6 million increase due to new projects initiated during our 2010 fiscal year;
|
|
·
|
a $29.0 million reduction in charges relative to the prior year due to the write-off of the “Washington” trade name intangible asset during fiscal year 2009; and
|
|
·
|
a $10.9 million recovery in fiscal year 2010 related to legacy workers’ compensation and general liability insurance programs.
|
These increases in operating income were partially offset by a $25.0 million charge taken on the SR-125 highway project, decreases in revenues in our industrial and commercial market sector as previously described, a decrease of $20.1 million from various power generation projects and an $11.1 million charge on a DOE decontamination and decommissioning project in New York that has experienced cost growth due in part to certain environmental contamination events. The contract was modified from a cost-reimbursable arrangement to a target cost with a cap. The $11.1 million charge is based on our current estimate of costs to complete the project. In addition, our operating income in fiscal year 2009 included $18.7 million in earnings from MIBRAG, which was sold on June 10, 2009, $13.4 million from a contract to construct a cement manufacturing facility, which was completed in 2009, and $26.3 million from various contract mining projects that were completed or terminated during the prior year. Furthermore, the increase in operating income was partially offset by the following events that also occurred during fiscal year 2009, but did not recur during fiscal year 2010:
|
·
|
a $16.0 million change order recovery and close out activities on a highway project;
|
|
·
|
a contract termination fee of $9.0 million on a cancelled contract mining project; and
|
|
·
|
a $7.0 million project development success fee on a transit project.
|
Operating income as a percentage of revenues was 6.6% for fiscal year 2010 compared to 4.1% in fiscal year 2009.
Interest Expense
Our consolidated interest expense for the year ended December 31, 2010 decreased by 36.9% compared with the year ended January 1, 2010. The decrease was primarily due to lower debt balances, lower LIBOR interest rates and lower interest rate margins in 2010, and to a lesser extent, adjustments to interest expense related to our uncertain tax positions.
Other Income, Net
Our consolidated other income, net for the year ended January 1, 2010 consisted of a $75.6 million gain associated with the sale of our equity investment in MIBRAG, net of $5.2 million of sale-related costs, that was completed during the second quarter of 2009. This gain was partially offset by a $27.7 million loss on the settlement of a foreign currency forward contract during the second quarter of 2009, which primarily hedged our net investment in MIBRAG. On a net, after-tax basis, these two transactions resulted in increases to net income and diluted EPS of $30.6 million and $0.37, respectively, for the year ended January 1, 2010.
Income Tax Expense
Our effective income tax rate for the year ended December 31, 2010 decreased to 30.1% from 37.9% for the year ended January 1, 2010. (See further discussion in the “Income Taxes” section below.)
Noncontrolling Interests in Income of Consolidated Subsidiaries, Net of Tax
Our noncontrolling interests in income of consolidated subsidiaries, net of tax for the year ended December 31, 2010 increased by $49.2 million or 225.9% compared with the year ended January 1, 2010. The increase in noncontrolling interests in income of consolidated subsidiaries, net of tax was primarily due to the consolidation of joint ventures at the beginning of our 2010 fiscal year and new projects initiated during our 2010 fiscal year. These increases included $29.6 million from the consolidation of a U.K. joint venture, $10.9 million from the consolidation of a joint venture involved in a DOE nuclear clean-up project in Washington State, and $5.1 million from the consolidation of a joint venture that provides engineering, procurement, maintenance, and construction services for large nuclear component replacement projects. These increases were partially offset by the completion of projects by our consolidated joint ventures during our 2010 fiscal year.
The Year Ended January 1, 2010 Compared with the Year Ended January 2, 2009
Consolidated
|
Year Ended
|
||||||||||||||||
|
(In millions, except percentages and per share amounts)
|
January 1,
2010
|
January 2,
2009
|
Increase (Decrease)
|
Percentage Increase (Decrease)
|
||||||||||||
|
Revenues
|
$ | 9,249.1 | $ | 10,086.3 | $ | (837.2 | ) | (8.3 | %) | |||||||
|
Cost of revenues
|
(8,772.4 | ) | (9,608.8 | ) | (836.4 | ) | (8.7 | %) | ||||||||
|
General and administrative expenses
|
(75.8 | ) | (78.7 | ) | (2.9 | ) | (3.7 | %) | ||||||||
|
Impairment of an intangible asset
|
(32.8 | ) | — | 32.8 | N/M | |||||||||||
|
Equity in income of unconsolidated joint ventures
|
100.9 | 106.3 | (5.4 | ) | (5.1 | %) | ||||||||||
|
Operating income
|
469.0 | 505.1 | (36.1 | ) | (7.1 | %) | ||||||||||
|
Interest expense
|
(48.4 | ) | (90.7 | ) | (42.3 | ) | (46.6 | %) | ||||||||
|
Other income, net
|
47.9 | — | 47.9 | N/M | ||||||||||||
|
Income before income taxes
|
468.5 | 414.4 | 54.1 | 13.1 | % | |||||||||||
|
Income tax expense
|
(177.6 | ) | (172.8 | ) | 4.8 | 2.8 | % | |||||||||
|
Net income
|
290.9 | 241.6 | 49.3 | 20.4 | % | |||||||||||
|
Noncontrolling interests in income of consolidated subsidiaries, net of tax
|
(21.8 | ) | (21.8 | ) | — | — | ||||||||||
|
Net income attributable to URS
|
$ | 269.1 | $ | 219.8 | $ | 49.3 | 22.4 | % | ||||||||
|
Diluted earnings per share
|
$ | 3.29 | $ | 2.59 | $ | 0.70 | 27.0 | % | ||||||||
N/M = Not meaningful
The following table presents our consolidated revenues by market sector and business for the years ended January 1, 2010 and January 2, 2009.
|
Year Ended
|
||||||||||||||||
|
(In millions, except percentages)
|
January 1,
2010
|
January 2,
2009
|
Increase (Decrease)
|
Percentage Increase (Decrease)
|
||||||||||||
|
Revenues
|
||||||||||||||||
|
Power sector
|
||||||||||||||||
|
Infrastructure & Environment
|
$ | 144.2 | $ | 246.0 | $ | (101.8 | ) | (41.4 | %) | |||||||
|
Federal Services
|
— | — | — | — | ||||||||||||
|
Energy & Construction
|
1,248.0 | 1,616.1 | (368.1 | ) | (22.8 | %) | ||||||||||
|
Power Total
|
1,392.2 | 1,862.1 | (469.9 | ) | (25.2 | %) | ||||||||||
|
Infrastructure sector
|
||||||||||||||||
|
Infrastructure & Environment
|
1,400.4 | 1,419.8 | (19.4 | ) | (1.4 | %) | ||||||||||
|
Federal Services
|
— | — | — | — | ||||||||||||
|
Energy & Construction
|
262.8 | 335.5 | (72.7 | ) | (21.7 | %) | ||||||||||
|
Infrastructure Total
|
1,663.2 | 1,755.3 | (92.1 | ) | (5.2 | %) | ||||||||||
|
Federal sector
|
||||||||||||||||
|
Infrastructure & Environment
|
675.7 | 602.8 | 72.9 | 12.1 | % | |||||||||||
|
Federal Services
|
2,558.1 | 2,413.9 | 144.2 | 6.0 | % | |||||||||||
|
Energy & Construction
|
907.0 | 540.8 | 366.2 | 67.7 | % | |||||||||||
|
Federal Total
|
4,140.8 | 3,557.5 | 583.3 | 16.4 | % | |||||||||||
|
Industrial and commercial sector
|
||||||||||||||||
|
Infrastructure & Environment
|
901.0 | 1,104.3 | (203.3 | ) | (18.4 | %) | ||||||||||
|
Federal Services
|
— | — | — | — | ||||||||||||
|
Energy & Construction
|
1,151.9 | 1,807.1 | (655.2 | ) | (36.3 | %) | ||||||||||
|
Industrial and Commercial Total
|
2,052.9 | 2,911.4 | (858.5 | ) | (29.5 | %) | ||||||||||
|
Total revenues, net of eliminations
|
$ | 9,249.1 | $ | 10,086.3 | $ | (837.2 | ) | (8.3 | %) | |||||||
Businesses
|
(In millions, except percentages)
|
Infrastructure & Environment
|
Federal Services
|
Energy & Construction
|
Eliminations
|
Corporate
|
Total
|
||||||||||||||||||
|
Year ended January 1, 2010
|
||||||||||||||||||||||||
|
Revenues
|
$ | 3,170.4 | $ | 2,561.3 | $ | 3,583.9 | $ | (66.5 | ) | $ | — | $ | 9,249.1 | |||||||||||
|
Cost of revenues
|
(2,920.9 | ) | (2,420.0 | ) | (3,498.0 | ) | 66.5 | — | (8,772.4 | ) | ||||||||||||||
|
General and administrative expenses
|
— | — | — | — | (75.8 | ) | (75.8 | ) | ||||||||||||||||
|
Impairment of an intangible asset
|
— | (3.8 | ) | (29.0 | ) | — | — | (32.8 | ) | |||||||||||||||
|
Equity in income of unconsolidated joint ventures
|
6.2 | 5.7 | 89.0 | — | — | 100.9 | ||||||||||||||||||
|
Operating income (loss)
|
$ | 255.7 | $ | 143.2 | $ | 145.9 | $ | — | $ | (75.8 | ) | $ | 469.0 | |||||||||||
|
Year ended January 2, 2009
|
||||||||||||||||||||||||
|
Revenues
|
$ | 3,395.6 | $ | 2,415.7 | $ | 4,328.9 | $ | (53.9 | ) | $ | — | $ | 10,086.3 | |||||||||||
|
Cost of revenues
|
(3,164.7 | ) | (2,292.9 | ) | (4,205.1 | ) | 53.9 | — | (9,608.8 | ) | ||||||||||||||
|
General and administrative expenses
|
— | — | — | — | (78.7 | ) | (78.7 | ) | ||||||||||||||||
|
Equity in income of unconsolidated joint ventures
|
11.8 | 7.3 | 87.2 | — | — | 106.3 | ||||||||||||||||||
|
Operating income (loss)
|
$ | 242.7 | $ | 130.1 | $ | 211.0 | $ | — | $ | (78.7 | ) | $ | 505.1 | |||||||||||
|
Increase (decrease) for the year ended January 1, 2010
vs. the year ended January 2, 2009
|
||||||||||||||||||||||||
|
Revenues
|
$ | (225.2 | ) | $ | 145.6 | $ | (745.0 | ) | $ | 12.6 | $ | — | $ | (837.2 | ) | |||||||||
|
Cost of revenues
|
(243.8 | ) | 127.1 | (707.1 | ) | 12.6 | — | (836.4 | ) | |||||||||||||||
|
General and administrative expenses
|
— | — | — | — | (2.9 | ) | (2.9 | ) | ||||||||||||||||
|
Impairment of an intangible asset
|
— | 3.8 | 29.0 | — | — | 32.8 | ||||||||||||||||||
|
Equity in income of unconsolidated joint ventures
|
(5.6 | ) | (1.6 | ) | 1.8 | — | — | (5.4 | ) | |||||||||||||||
|
Operating income (loss)
|
13.0 | 13.1 | (65.1 | ) | — | 2.9 | (36.1 | ) | ||||||||||||||||
|
Percentage increase (decrease) for the year ended January 1, 2010
vs. the year ended January 2, 2009
|
|
|||||||||||||||||||||||
|
Revenues
|
(6.6 | %) | 6.0 | % | (17.2 | %) | 23.4 | % | — | (8.3 | %) | |||||||||||||
|
Cost of revenues
|
(7.7 | %) | 5.5 | % | (16.8 | %) | 23.4 | % | — | (8.7 | %) | |||||||||||||
|
General and administrative expenses
|
— | — | — | — | (3.7 | %) | (3.7 | %) | ||||||||||||||||
|
Impairment of an intangible asset
|
— | N/M | N/M | — | — | — | ||||||||||||||||||
|
Equity in income of unconsolidated joint ventures
|
(47.5 | %) | (21.9 | %) | 2.1 | % | — | — | (5.1 | %) | ||||||||||||||
|
Operating income (loss)
|
5.4 | % | 10.1 | % | (30.9 | %) | — | 3.7 | % | (7.1 | %) | |||||||||||||
N/M = Not meaningful
Revenues
Our consolidated revenues for the year ended January 1, 2010 were $9.2 billion, a decrease of $837.2 million or 8.3%, compared with the year ended January 2, 2009. Revenues from our Infrastructure & Environment business for the year ended January 1, 2010 were $3.2 billion, a decrease of $225.2 million or 6.6% compared with the year ended January 2, 2009. Revenues from our Federal Services business for the year ended January 1, 2010 were $2.6 billion, an increase of $145.6 million or 6.0% compared with the year ended January 2, 2009. Revenues from our Energy & Construction business for the year ended January 1, 2010 were $3.6 billion, a decrease of $745.0 billion or 17.2% compared with the year ended January 2, 2009.
The revenues reported above for each of our businesses are presented prior to the elimination of inter-segment transactions. Our analysis of these changes in revenues is set forth below.
Power
Consolidated revenues from our power market sector were $1.4 billion, a decrease of $469.9 million or 25.2%, for the year ended January 1, 2010 compared with the year ended January 2, 2009. The decline in revenues in the power sector reflects the completion of several major emissions control projects that experienced high levels of activity and generated significant revenues during the 2008 fiscal year. Projects of this type, which involve the retrofit of coal-fired power plants with clean air technology to reduce sulfur dioxide, mercury and other emissions, are driven by the timing of regulatory mandates to reduce emissions, such as the Clean Air Interstate Rule. Many of our clients have completed, or will soon complete, projects to meet a 2010 deadline for emissions reductions. We have experienced a delay in the start-up of new projects to meet the Rule’s 2015 deadline for additional reductions. In addition, as a result of the economic downturn, some of our power clients have deferred or cancelled large capital improvement projects. The impact of these factors was partially offset by strong demand for engineering and construction services we provide to develop new natural gas-fired power plants and to increase generating capacity and efficiency at both nuclear and fossil fuel power facilities. We also benefited from strong demand to upgrade transmission and distribution systems to improve reliability and support the delivery of renewable energy.
The Infrastructure & Environment business’ revenues from our power market sector were $144.2 million, a decrease of $101.8 million or 41.4%, for the year ended January 1, 2010 compared with the year ended January 2, 2009. The decrease in power revenues for the Infrastructure & Environment business was related to the completion of several large emissions control projects that had higher levels of activities during the 2008 fiscal year. Additionally, as we win new emissions control work, these projects are typically being performed by our Energy & Construction business. This decline in revenues from emissions control work was partially offset by steady demand for the engineering and environmental services provided by the Infrastructure & Environment business to expand and modernize power transmission and distribution facilities.
The Energy & Construction business’ revenues from our power market sector were $1.2 billion, a decrease of $368.1 million or 22.8%, for the year ended January 1, 2010 compared with the year ended January 2, 2009. The decrease was primarily due to the completion of several major projects involving retrofitting coal-fired power plants with clean air technologies and a project to construct a uranium enrichment facility. The completion of these projects resulted in a $695.5 million decline in revenues compared with the same period in fiscal 2008. The impact of these factors was partially offset by an increase in revenues of $291.6 million from new and continuing projects to provide engineering and construction services for the expansion of generating capacity at existing fossil fuel power plants and the development of new facilities, particularly natural gas-fired power plants. In addition, we experienced an increase in revenues of $21.6 million from ongoing projects to provide engineering and maintenance services at nuclear power generating facilities.
Infrastructure
Consolidated revenues from our infrastructure market sector were $1.7 billion, a decrease of $92.1 million or 5.2%, for the year ended January 1, 2010 compared with the year ended January 2, 2009. The decrease in revenues from our infrastructure market sector was primarily the result of the timing of work on several major infrastructure projects, which generated significant revenues during our 2008 fiscal year. These projects were largely completed during fiscal 2008 and did not generate significant revenues during our 2009 fiscal year. In addition, the current economic downturn has, in some cases, led to reduced spending by state and local governments on infrastructure programs, and ARRA funding for the types of projects we support has not been awarded as quickly as expected. As a result, we experienced a decline in revenues from surface transportation projects. By contrast, we continued to benefit from strong demand for the services we provide to expand and modernize airports and rail/transit infrastructure because many of these projects are being funded through alternative funding sources, such as bond sales, dedicated tax measures and user fees.
The Infrastructure & Environment business’ revenues from our infrastructure market sector were $1.4 billion, a decrease of $19.4 million or 1.4%, for the year ended January 1, 2010 compared with the year ended January 2, 2009. The moderate decline in revenues was largely the result of spending reductions by state and local government agencies on key infrastructure programs, as well as the delay in ARRA funding for the types of infrastructure projects we support. While revenues decreased from the services we provide to expand and modernize surface transportation, these declines were partially offset by increased demand for program management, planning, design and engineering services for airport and rail/transit projects. Revenues also increased from the program and construction management services we provide for capital improvement projects involving schools, healthcare facilities and government buildings.
The Energy & Construction business’ revenues from our infrastructure market sector were $262.8 million, a decrease of $72.7 million or 21.7%, for the year ended January 1, 2010 compared with the year ended January 2, 2009. A decrease in revenues of $53.6 million compared to fiscal 2008 was due to the completion of a highway project in California and a project to expand a transit system in Texas. Additionally, we completed work on projects to expand a prison in Idaho, to design the infrastructure at an oil sands site in Canada and to rebuild infrastructure in Iraq resulting in a $41.5 million decline in revenues, compared with fiscal 2008. The impact of the completion of these projects was partially offset by the receipt of a $7.0 million project development success fee for a transit project in Washington, D.C., which occurred in the first quarter of fiscal 2009, as well as revenues of $20.1 million generated from a new water project in California.
Federal
Consolidated revenues from our federal market sector were $4.1 billion, an increase of $583.3 million or 16.4%, for the year ended January 1, 2010 compared with the year ended January 2, 2009. The increase in revenues reflects strong demand for the services we provide to the DOD, DOE, NASA and other U.S. federal government agencies. We continued to benefit from strong demand for systems engineering and technical assistance services to modernize aging weapons systems and develop new systems. Revenues also increased from the operations and installations management support services we provide at military bases, test ranges, space flight centers and other government installations. In addition, revenues increased from our work managing chemical demilitarization programs to eliminate chemical and biological weapons, as well as from the environmental and nuclear management services we provide for the storage, treatment and disposal of radioactive waste. We also benefited from increased demand for the engineering, construction and environmental services we provide at U.S. military installations in the United States and overseas in support of DOD activities to realign military bases and redeploy troops to meet the evolving security needs of the post-Cold War era.
The Infrastructure & Environment business’ revenues from our federal market sector were $675.7 million, an increase of $72.9 million or 12.1%, for the year ended January 1, 2010 compared with the year ended January 2, 2009. We continued to experience strong demand for the engineering, construction and environmental services we provide to the DOD at installations in the United States and internationally. Many of these assignments support the DOD’s long-term Military Transformation initiative to realign military bases and redeploy troops to meet evolving security needs. Our work typically involves the design and construction of aircraft hangars, barracks, military hospitals and other facilities, as well as environmental remediation and restoration for the redevelopment of military bases and other government installations. Revenues also increased from the services we provide to the Federal Emergency Management Agency for recovery services following natural disasters, as well as for the mapping and risk analysis of flood hazards in support of the National Flood Insurance Program.
The Federal Services business’ revenues from our federal market sector were $2.6 billion, an increase of $144.2 million or 6.0%, for the year ended January 1, 2010 compared with the year ended January 2, 2009. We continued to benefit from strong demand for the systems engineering and technical assistance services we provide to the DOD for the development, testing and evaluation of new weapons systems and the modernization of aging weapons systems. In addition, revenues increased from our work managing the destruction of chemical weapons stockpiles at Army demilitarization facilities throughout the United States. We also experienced strong demand for the operations and installations management services we provide to the DOD, NASA and other federal agencies in support of complex government and military installations, such as military bases, test ranges and space flight centers.
The Energy & Construction business’ revenues from our federal market sector were $907.0 million, an increase of $366.2 million or 67.7%, for the year ended January 1, 2010 compared with the year ended January 2, 2009. The increase in federal revenues in the Energy & Construction business was primarily due to a new DOE contract to provide nuclear waste management services, which resulted in an increase in revenues of $263.0 million during 2009. Revenues also increased by $127.8 million as a result of the acceleration of activities under several other nuclear waste management services contracts for the DOE. In addition, we experienced revenue growth of $59.0 million from projects awarded during our 2008 fiscal year to provide nuclear cleanup and waste management services in the U.K. The impact of these factors was partially offset by a decrease in revenues of $50.3 million due to the loss of a DOE management services contract and a decrease in revenues of $27.2 million on a DOE nuclear waste processing facility construction project that recognized additional revenues in 2008 as a result of a contract modification.
Industrial and Commercial
Consolidated revenues from our industrial and commercial market sector were $2.1 billion, a decrease of $858.5 million or 29.5%, for the year ended January 1, 2010 compared with the year ended January 2, 2009. Our industrial and commercial market sector, which includes the work we perform for oil and gas, mining and manufacturing clients, continues to be the most exposed to the economic downturn because many of our clients in this sector are dependent on oil and gas or other commodity prices to support capital expenditure programs. During our 2009 fiscal year, we experienced a significant decline in revenues, primarily due to a decrease in activity on several large construction projects that are nearing completion or have been completed, as well as the delay or deferral of new, large-scale capital improvement projects as a result of the economic downturn. In addition, demand decreased for the services we provide to develop and operate mines. In the past fiscal year, the decline in the prices of metals and mineral resources resulted in the curtailment of mining activities and, in some cases, mine closures. Revenues also declined from the planning and environmental services we provide to industrial clients to support existing plant operations, reflecting lower levels of activity at these facilities.
The Infrastructure & Environment business’ revenues from our industrial and commercial market sector were $901.0 million, a decrease of $203.3 million or 18.4%, for the year ended January 1, 2010 compared with the year ended January 2, 2009. Revenues declined due to a decrease in demand for the engineering and construction-related services we provide to oil and gas and manufacturing clients related to major capital improvement projects. In addition, we experienced a decrease in demand for the planning and environmental services we provide in support of existing plant operations, reflecting decreased levels of activities at these facilities. Due to the economic downturn and its effect on the business of our commercial clients, such as real estate developers, transportation/freight carriers, telecommunications providers and financial services providers, demand also decreased for the environmental, engineering and construction management services we provide to these clients.
The Energy & Construction business’ revenues from our industrial and commercial market sector were $1.2 billion, a decrease of $655.2 million or 36.3%, for the year ended January 1, 2010 compared with the year ended January 2, 2009. Revenues declined by $553.4 million due to the completion of major construction projects, including projects to build a cement manufacturing plant and natural gas production facility. Revenues for services we provide to develop and operate mines also declined by $123.8 million. As the prices of metals and mineral resources fell, several of our mining clients curtailed their operations and, in some cases, mines were closed.
Cost of Revenues
Our consolidated cost of revenues, which consist of labor, subcontractor costs and other expenses related to projects, and services provided to our clients, decreased by 8.7% compared with the year ended January 2, 2009. Because our revenues are primarily service-based, the factors that caused revenues to decline also drove a corresponding decrease in our cost of revenues. Consolidated cost of revenues as a percent of revenues decreased from 95.3% for the year ended January 2, 2009 to 94.8% for the year ended January 1, 2010.
Impairment of an Intangible Asset
Impairment of an intangible asset for the year ended January 1, 2010 resulted in a fourth quarter charge of $32.8 million related to the “Washington” trade name due to our rebranding initiative. On a net, after-tax basis, this transaction resulted in decreases to net income and diluted EPS of $19.6 million and $0.24, respectively, for the year ended January 1, 2010.
General and Administrative Expenses
Our consolidated general and administrative expenses for the year ended January 1, 2010 decreased by 3.7% compared with the year ended January 2, 2009. The decrease was primarily due to reductions in external services. Consolidated G&A expenses as a percent of revenues remained the same at 0.8% for the years ended January 1, 2010 and January 2, 2009.
Equity in Income of Unconsolidated Joint Ventures
Our consolidated equity in income of unconsolidated joint ventures for the year ended January 1, 2010 decreased by $5.4 million or 5.1% compared with the year ended January 2, 2009. This decrease was primarily due to the sale of our equity investment in MIBRAG on June 10, 2009 and the timing and completion of projects.
The Infrastructure & Environment business’ equity in income of unconsolidated joint ventures for the year ended January 1, 2010 decreased by $5.6 million or 47.5% compared with the year ended January 2, 2009, primarily due to the completion of several projects.
The Energy & Construction business’ equity in income of unconsolidated joint ventures for the year ended January 1, 2010 increased by $1.8 million or 2.1% compared with the year ended January 2, 2009. The increase resulted primarily from a new contract to provide nuclear cleanup and waste management services in the U.K., which generated $21.8 million more equity income during 2009 than in 2008. This increase was partially offset by a decrease of $12.9 million resulting from the sale of our equity investment in MIBRAG and the timing and completion of projects, which resulted in decreases in equity income, including a decrease of $12.2 million from a joint venture that replaces major components at nuclear power plants.
Operating Income
Our consolidated operating income for the year ended January 1, 2010 decreased by $36.1 million or 7.1% compared with the year ended January 2, 2009. Operating income as a percentage of revenues was 5.1% for fiscal year 2009 compared to 5.0% for fiscal year 2008. The decrease in operating income was caused primarily by the decrease in revenues and a charge for the impairment of an intangible asset as previously described. In addition, the decline in earnings was due to various completed, delayed, or cancelled projects that generated operating income in fiscal year 2008. Furthermore, during fiscal year 2009, earnings decreased on a DOE nuclear waste processing facility construction project; during the 2008 fiscal year, we recognized significantly higher earnings on the project due to successful negotiations with the DOE to modify the overall fee and structure of the contract. These decreases were partially offset by reductions in overhead costs resulting from the implementation of cost-control measures. These items are discussed in more detail below.
The Infrastructure & Environment business’ operating income for the year ended January 1, 2010 increased by $13.0 million or 5.4% compared with the year ended January 2, 2009. While revenues declined, we improved our operating income by reducing the use of subcontractors and purchases of project-related materials, which provide lower profit margins than activities performed directly by our employees. In addition, the implementation of cost-control measures reduced our overhead costs. This reduction was partially offset by an increase in business development costs incurred for the pursuit of new business opportunities. The increase in operating income was partially offset by the decrease in equity in income of unconsolidated joint ventures. Overhead costs as a percentage of revenues was 30.8% for the year ended January 1, 2010 compared to 31.4% for the year ended January 2, 2009. Operating income as a percentage of revenues was 8.1% for fiscal year 2009 compared to 7.1% in fiscal year 2008.
The Federal Services business’ operating income for the year ended January 1, 2010 increased by $13.1 million or 10.1% compared with the year ended January 2, 2009. The increase was primarily due to the increase in revenue volume previously described and award fees and performance-based incentive fees earned on various DOD projects. In addition, higher billing rates related to the performance of project activities requiring specialized labor skills and efficiency improvements on some fixed-price contracts performed by our Federal Service business also contributed to the increase in operating income. The increase in operating income was partially offset by the higher use of subcontractors and an increase in other direct costs, which provide lower profit margins, and by a $3.8 million impairment charge of an intangible asset as previously discussed. Operating income as a percentage of revenues was 5.6% for fiscal year 2009 compared to 5.4% in fiscal year 2008.
The Energy & Construction business’ operating income for the year ended January 1, 2010 decreased by $65.1 million or 30.9% compared with the year ended January 2, 2009. The decrease in operating income was primarily due to the following:
|
·
|
a $52.6 million decline in earnings due to the completion of several major projects in fiscal year 2009 that generated higher operating income during fiscal year 2008, combined with delays of new projects, primarily in the power and industrial and commercial market sectors;
|
|
·
|
earnings of $35.1 million recognized in the prior year on a DOE nuclear waste processing facility construction project as a result of negotiations with the DOE to modify the overall fee and structure;
|
|
·
|
a $29.0 million write-off of the “Washington” trade name intangible asset; and
|
|
·
|
a $13.7 million decrease due to the loss of a DOE management services contract.
|
These decreases were partially offset by higher contract earnings on some projects caused by events we do not expect to recur on a regular basis. These included a $9.0 million contract termination fee related to a mining contract, a $7.0 million project development success fee related to a transit project and a $4.8 million global settlement of legacy project matters. During fiscal year 2009, we recorded charges of $36.9 million on an oil and gas construction project that has experienced cost increases and schedule delays, compared with charges of $52.7 million in fiscal year 2008. In addition, overhead costs decreased by $33.5 million as a result of lower business development costs related to the timing of major proposals, costs savings resulting from the integration of the Energy & Construction business into our overall operations, and the implementation of cost-control measures in response to the current economic downturn. Operating income as a percentage of revenues was 4.1% for fiscal year 2009 compared to 4.9% in fiscal year 2008.
Interest Expense
Our consolidated interest expense for the year ended January 1, 2010 decreased by 46.6% compared with the year ended January 2, 2009. The decrease was due to lower debt balances as a result of discretionary debt payments made on our 2007 Credit Facility, in addition to lower LIBOR interest rates and lower interest rate margins in 2009.
Other Income, Net
Our consolidated other income, net for the year ended January 1, 2010 consisted of a $75.6 million gain associated with the sale of our equity investment in MIBRAG, net of $5.2 million of sale-related costs, that was completed during the second quarter of 2009. This gain was partially offset by a $27.7 million loss on the settlement of a foreign currency forward contract during the second quarter of 2009, which primarily hedged our net investment in MIBRAG. On a net, after-tax basis, these two transactions resulted in increases to net income and diluted EPS of $30.6 million and $0.37, respectively, for the year ended January 1, 2010.
Income Tax Expense
Our effective income tax rate for the year ended January 1, 2010 decreased to 37.9% from 41.7% for the year ended January 2, 2009. (See further discussion in the “Income Taxes” section below.)
|
(In millions)
|
Year Ended December 31, 2010
|
Year Ended January 1, 2010
|
Year Ended January 2, 2009
|
|||||||||
|
Cash flows from operating activities
|
$ | 527.5 | $ | 651.6 | $ | 374.2 | ||||||
|
Cash flows from investing activities
|
(299.8 | ) | 205.1 | (133.3 | ) | |||||||
|
Cash flows from financing activities
|
(375.1 | ) | (360.0 | ) | (273.4 | ) | ||||||
Overview
For the year ended December 31, 2010, our primary sources of liquidity were cash flows from operations, dividends from our unconsolidated joint ventures and the maturity of our short-term investments. Our primary uses of cash were to fund our working capital; to fund our acquisition of Scott Wilson; to service our debt; to repurchase our common stock; to fund distributions to noncontrolling interests; and to fund our capital expenditures. For the years ended January 1, 2010 and January 2, 2009, our primary sources of liquidity were cash flows from operations, proceeds from the sale of our equity investment in MIBRAG, as well as proceeds from the sale of mining equipment and other assets located in Bolivia following the termination of a mining contract, and borrowing under our credit lines. For the year ended January 1, 2010, our primary use of cash was to fund our working capital, capital expenditures, and short term investments; to invest in our unconsolidated joint ventures; to service our debt; to purchase treasury stock; and to fund distributions to the noncontrolling interests in our consolidated subsidiaries. For the year ended January 2, 2009, our primary use of cash was to fund our working capital and capital expenditures; to service our debt; and to purchase treasury stock.
Our cash flows from operations are primarily impacted by fluctuations in working capital, which is affected by numerous factors, including the billing and payment terms of our contracts, stage of completion of contracts performed by us, the timing of payments to vendors, subcontractors, and joint ventures, and the changes in income tax and interest payments, or unforeseen events or issues that may have an impact on our working capital.
Liquidity
Cash and cash equivalents include all highly liquid investments with maturities of 90 days or less at the date of purchase, including interest-bearing bank deposits and money market funds. Restricted cash is included in other current assets because it was not material. At December 31, 2010 and January 1, 2010, cash and cash equivalents included $85.6 million and $112.4 million, respectively, of cash held by our consolidated joint ventures.
Accounts receivable and costs and accrued earnings in excess of billings on contracts represent our primary sources of operational cash inflows. Costs and accrued earnings in excess of billings on contracts represent amounts that will be billed to clients as soon as invoice support can be assembled, reviewed and provided to our clients, or when specific contractual billing milestones are achieved. In some cases, unbilled amounts may not be billable for periods generally extending from two to six months and, rarely, beyond a year. At December 31, 2010 and January 1, 2010, significant unapproved change orders and claims, which are included in costs and accrued earnings in excess of billings on contracts, collectively represented approximately 2% and 4%, respectively, of our accounts receivable and accrued earnings in excess of billings on contracts.
All costs and accrued earnings in excess of billings on contracts are evaluated on a regular basis to assess the risk of collectability and allowances are provided as deemed appropriate. Based on the nature of our contracts and customer base, including U.S. federal, state and local governments and large reputable companies, we have not historically experienced significant write-offs related to receivables and costs and accrued earnings in excess of billings. The size of our allowance for uncollectible receivables as a percentage of the combined total of our accounts receivable and accrued earnings in excess of billings on contracts is indicative of our history of successfully billing costs and accrued earnings in excess of billings on contracts and collecting the billed amounts from our clients.
As of December 31, 2010 and January 1, 2010, our receivable allowances represented 1.89% and 2.45%, respectively, of the combined total accounts receivable and costs and accrued earnings in excess of billings on contracts. We believe that our allowance for doubtful accounts receivable as of December 31, 2010 is adequate. We have placed significant emphasis on collection efforts and continually monitor our receivable allowance. However, future economic conditions may adversely impact some of our clients’ ability to pay our bills or the timeliness of their payments; consequently, it may also affect our ability to consistently collect cash from our clients and meet our operating needs. The other significant factors that typically affect the realization of our accounts receivable include the billing and payment terms of our contracts, as well as the stage of completion of our performance under the contracts. Changes in contract terms or the position within the collection cycle of contracts, for which our joint ventures, partnerships and partially-owned limited liability companies have received advance payments, can affect our operating cash flows. In addition, substantial advance payments or billings in excess of costs also have an impact on our liquidity. Billings in excess of costs as of December 31, 2010 and January 1, 2010 were $275.8 million and $235.3 million, respectively.
We use Days Sales Outstanding (“DSO”) to monitor the average time, in days, that it takes us to convert our accounts receivable into cash. DSO is a useful tool for investors to measure our liquidity and understand our average collection period. We calculate DSO by dividing net accounts receivable less billings in excess of costs and accrued earnings on contracts as of the end of the quarter into the amount of revenues recognized during the quarter, and multiplying the result of that calculation by the number of days in that quarter. Our DSO increased from 72 days as of January 1, 2010 to 74 days as of December 31, 2010, which was primarily due to an increase in the timing of payments from clients on our accounts receivable.
We believe that we have sufficient resources to fund our operating and capital expenditure requirements, as well as to service our debt, for at least the next twelve months. In the ordinary course of our business, we may experience various loss contingencies including, but not limited to the pending legal proceedings identified in Note 16, “Commitments and Contingencies,” to our Consolidated Financial Statements included under Item 8 of this report, which may adversely affect our liquidity and capital resources.
On February 25, 2011, our Board of Directors authorized an increase in the number of our common shares that we may repurchase in fiscal year 2011 from 3.0 million shares to 8.0 million shares effected through open market purchases or privately negotiated transactions as permitted by securities laws and other legal and contractual requirements, and subject to market conditions and other factors. The Board of Directors may modify, suspend, extend or terminate the program at any time. This increase in the stock repurchase authorization was reflected in the third amendment to the 2007 Credit Facility. Any repurchase of shares will reduce our available cash balances.
Operating Activities
The decrease in cash flows from operating activities for the year ended December 31, 2010 compared with the year ended January 1, 2010 was primarily due to the timing of payments from clients on accounts receivable, the use of advance payments from clients as projects moved towards completion, the timing of project performance payments and an increase in income tax payments. The decrease in cash flows from operating activities was partially offset by the timing of payments to joint ventures, the timing of payments to vendors and subcontractors, and a decrease in interest payments.
The increase in cash flows from operating activities for the year ended January 1, 2010 compared with the year ended January 2, 2009 was primarily due to decreases in receivables, partially offset by decreases in payables. Receivables decreased as a result of the decline in revenues from various completed, delayed, or cancelled projects and the timing of payments from clients on accounts receivable. In addition to the impact of various completed, delayed, or cancelled projects on payables, the timing of payments to vendors and subcontractors, and the timing of payroll payments relative to our fiscal year-ends also impacted payables. Decreases in income tax and interest payments further contributed to the increase in operating cash flows.
We received a $30 million tax refund in March 2009 due to an overpayment of estimated taxes in 2008. Our actual net operating losses (“NOL”) available for deduction were higher than we estimated during 2008. In addition, deferred tax assets related to depreciation expense and the timing of income from partnerships were lower than we originally estimated during 2008. We were able to claim more actual tax depreciation expense than we originally anticipated, thus reducing the amount of income taxes we owed for fiscal year 2008.
During the first quarter of 2011, we expect to make estimated payments of $83 million to pension, post-retirement, defined contribution and multiemployer plans and bonuses.
Investing Activities
Included in our investing activities during the year ended December 31, 2010 was a cash outflow of $291.7 million related to our acquisition of Scott Wilson, net of cash acquired of $14.6 million. Our capital expenditures are primarily for construction equipment and information systems to support our professional and technical services and administrative needs. During the years ended December 31, 2010, January 1, 2010, and January 2, 2009, capital expenditures, excluding purchases financed through capital leases and equipment notes, were $45.2 million, $41.6 million, and $91.7 million, respectively. In addition, we disbursed $6.1 million, $16.3 million and $34.3 million in cash related to investments in and advances to unconsolidated joint ventures for the years ended December 31, 2010, January 1, 2010, and January 2, 2009, respectively.
Our cash balance increased by $20.7 million at the beginning of our fiscal year 2010 as a result of newly consolidated joint ventures. In addition, short-term investments of $30.2 million matured during the year ended December 31, 2010. Furthermore, our restricted cash balance increased by $16.1 million primarily due to restrictions on cash balances of $28.0 million that collateralize the five-year loan notes (“Loan Notes”), which we issued to shareholders of Scott Wilson as an alternative to cash consideration, partially offset by the removal of restrictions on $11.9 million in cash held at a project.
On June 10, 2009, we completed the sale of our equity investment in MIBRAG and we received €206.1 million (equivalent to U.S. $287.8 million) in cash proceeds from the sale and incurred sale-related costs of $5.2 million. In addition, we settled our foreign currency forward contract, which primarily hedged our net investment in MIBRAG, at a loss of $27.7 million. For the year ended January 1, 2010, we used $57.0 million of the net proceeds from the sale to pay down debt.
During the third quarter of our 2009 fiscal year, an Energy & Construction business mining contract located in Bolivia was terminated at our former client’s discretion. Pursuant to the termination, we received $47.4 million primarily related to the sale of the mining equipment and other related assets.
For the fiscal year 2011, we expect to incur approximately $73.0 million in capital expenditures, a portion of which will be financed through capital leases or equipment notes.
Financing Activities
The increase in net cash flows used for financing activities for the year ended December 31, 2010, compared to the year ended January 1, 2010, was primarily due to an increase in repurchases of our common stock and an increase in distributions to noncontrolling interests, partially offset by a decrease in term loan payments made on our 2007 Credit Facility.
Cash flows used for financing activities of $375.1 million during the year ended December 31, 2010 consisted of the following significant activities:
|
·
|
Payments of $150.0 million of the term loans under our 2007 Credit Facility;
|
|
·
|
Repurchases of our common stock of $128.2 million; and
|
|
·
|
Distributions to noncontrolling interests of $107.2 million.
|
Cash flows used for financing activities of $360.0 million during the year ended January 1, 2010 consisted of the following significant activities:
|
·
|
Payments of $300.0 million of the term loans under our 2007 Credit Facility;
|
|
·
|
Repurchases of our common stock of $41.2 million; and
|
|
·
|
Distributions to noncontrolling interests of $41.4 million.
|
Cash flows used for financing activities of $273.4 million during the year ended January 2, 2009 consisted of the following significant activities:
|
·
|
Payments of $200.0 million of the term loans under our 2007 Credit Facility; and
|
|
·
|
Purchases of treasury stock of $42.3 million.
|
Other Contractual Obligations and Commitments
The following table contains information about our contractual obligations and commercial commitments as of December 31, 2010.
|
Contractual Obligations
(Debt payments include principal only) (In millions)
|
Payments and Commitments Due by Period
|
|||||||||||||||||||||||
|
Total
|
Less Than 1 Year
|
1-3 Years
|
4-5 Years
|
After
5 Years
|
Other
|
|||||||||||||||||||
|
As of December 31, 2010:
|
||||||||||||||||||||||||
|
2007 Credit Facility (1,2)
|
$ | 625.0 | $ | — | $ | 625.0 | $ | — | $ | — | $ | — | ||||||||||||
|
Capital lease obligations (1)
|
19.4 | 7.5 | 10.1 | 1.8 | — | — | ||||||||||||||||||
|
Notes payable, foreign credit lines and other indebtedness (1)
|
62.8 | 53.0 | 7.8 | 2.0 | — | — | ||||||||||||||||||
|
Total debt
|
707.2 | 60.5 | 642.9 | 3.8 | — | — | ||||||||||||||||||
|
Operating lease obligations (3)
|
600.3 | 145.4 | 213.4 | 125.4 | 116.1 | — | ||||||||||||||||||
|
Pension and other retirement plans funding requirements (4)
|
461.5 | 60.6 | 87.4 | 79.1 | 234.4 | — | ||||||||||||||||||
|
Interest (5)
|
30.5 | 12.8 | 16.6 | 1.1 | — | — | ||||||||||||||||||
|
Purchase obligations (6)
|
13.0 | 5.3 | 7.7 | — | — | — | ||||||||||||||||||
|
Asset retirement obligations (7)
|
4.9 | 2.0 | 2.0 | 0.5 | 0.4 | — | ||||||||||||||||||
|
Other contractual obligations (8)
|
43.3 | 15.9 | 4.8 | 0.1 | 0.1 | 22.4 | ||||||||||||||||||
|
Total contractual obligations
|
$ | 1,860.7 | $ | 302.5 | $ | 974.8 | $ | 210.0 | $ | 351.0 | $ | 22.4 | ||||||||||||
|
(1)
|
Amounts shown exclude unamortized debt issuance costs of $5.4 million for the 2007 Credit Facility. For capital lease obligations, amounts shown exclude interest of $1.0 million.
|
|
(2)
|
On February 16, 2010, we entered into a consent to our 2007 Credit Facility, which allows us to utilize the funds from the sale of our equity investment in MIBRAG for general operating purposes. Accordingly, we were not required to remit $100.0 million as repayment on our 2007 Credit Facility in fiscal year 2010. Our next scheduled payment is expected to be due in March 2012.
|
|
(3)
|
Operating leases are predominantly real estate leases.
|
|
(4)
|
Amounts consist of pension and other retirement plan funding requirements for various pension, post-retirement, and other retirement plans.
|
|
(5)
|
Interest for the next five years, which excludes non-cash interest, is determined based on the current outstanding balance of our debt and payment schedule at the estimated interest rate.
|
|
(6)
|
Purchase obligations consist primarily of software maintenance contracts.
|
|
(7)
|
Asset retirement obligations represent the estimated costs of removing and restoring the leased properties to the original condition pursuant to our real estate lease agreements.
|
|
(8)
|
Other contractual obligations include net liabilities for anticipated settlements and interest under our tax liabilities, accrued benefit for our CEO pursuant to his employment agreement, our contractual obligations to joint ventures, and the purchase consideration of our acquisition of Scott Wilson for vested shares exercisable under Scott Wilson’s employee equity plans. Generally, it is not practicable to forecast or estimate the payment dates for the above-mentioned tax liabilities. Therefore, we included the estimated liabilities under “Other” column above.
|
Off-balance Sheet Arrangements
In the ordinary course of business, we may use off-balance sheet arrangements if we believe that such an arrangement would be an efficient way to lower our cost of capital or help us manage the overall risks of our business operations. We do not believe that such arrangements have had a material adverse effect on our financial position or our results of operations.
The following is a list of our off-balance sheet arrangements:
|
·
|
Letters of credit and bank guarantees are used primarily to support project performance, insurance programs, bonding arrangements and real estate leases. We are required to reimburse the issuers of letters of credit and bank guarantees for any payments they make under the outstanding letters of credit or bank guarantees. Our 2007 Credit Facility and our international credit facilities cover the issuance of our standby letters of credit and bank guarantees and are critical for our normal operations. If we default on the 2007 Credit Facility or international credit facilities, our ability to issue or renew standby letters of credit and bank guarantees would impair our ability to maintain normal operations. As of December 31, 2010, we had $160.6 million in standby letters of credit outstanding under our 2007 Credit Facility and $27.3 million in bank guarantees outstanding under international credit facilities and other banking arrangements.
|
|
·
|
We have guaranteed a letter of credit issued on behalf of one of our unconsolidated joint ventures. The total amount of the letter of credit was $7.2 million as of December 31, 2010.
|
|
·
|
We have guaranteed several of our foreign credit facilities and bank guarantee lines. The aggregate amount of these guarantees was $16.1 million as of December 31, 2010.
|
|
·
|
From time to time, we provide guarantees and indemnifications related to our services or work. If our services under a guaranteed or indemnified project are later determined to have resulted in a material defect or other material deficiency, then we may be responsible for monetary damages or other legal remedies. When sufficient information about claims on guaranteed or indemnified projects is available and monetary damages or other costs or losses are determined to be probable, we recognize such guarantee losses.
|
|
·
|
In the ordinary course of business, we enter into various agreements providing performance assurances and guarantees to clients on behalf of certain unconsolidated subsidiaries, joint ventures, and other jointly executed contracts. We enter into these agreements primarily to support the project execution commitments of these entities. The potential payment amount of an outstanding performance guarantee is typically the remaining cost of work to be performed by or on behalf of third parties under engineering and construction contracts. However, we are not able to estimate other amounts that may be required to be paid in excess of estimated costs to complete contracts and, accordingly, the total potential payment amount under our outstanding performance guarantees cannot be estimated. For cost-plus contracts, amounts that may become payable pursuant to guarantee provisions are normally recoverable from the client for work performed under the contract. For lump sum or fixed-price contracts, this amount is the cost to complete the contracted work less amounts remaining to be billed to the client under the contract. Remaining billable amounts could be greater or less than the cost to complete. In those cases where costs exceed the remaining amounts payable under the contract, we may have recourse to third parties, such as owners, co-venturers, subcontractors or vendors, for claims.
|
|
·
|
In the ordinary course of business, our clients may request that we obtain surety bonds in connection with contract performance obligations that are not required to be recorded in our Consolidated Balance Sheets. We are obligated to reimburse the issuer of our surety bonds for any payments made thereunder. Each of our commitments under performance bonds generally ends concurrently with the expiration of our related contractual obligation.
|
2007 Credit Facility
Our 2007 Credit Facility provides for two term loan facilities, originally consisting of a term loan A of $1.1 billion and a term loan B of $300.0 million, in the aggregate amount of $1.4 billion and a revolving credit facility in the amount of $700.0 million, which is also available for issuing letters of credit. The revolving credit facility is a five-year facility. Term loan A and the revolving credit facility will mature and expire on November 15, 2012 and term loan B will mature on May 15, 2013. We expect to refinance our 2007 Credit Facility prior to its earliest maturity date.
On September 10, 2010, the Board of Directors approved an increase and extension of the stock repurchase program that conformed to the terms of our 2007 Credit Facility, as amended. Under the modified stock repurchase program, we are authorized to repurchase, in each of the fiscal years during the period from January 2, 2010 through January 2, 2015, up to three million shares of our common stock, plus the number of shares of common stock equal to the excess, if any, of three million shares over the actual number of shares repurchased during the prior fiscal year. In addition, we are subject to covenants under our 2007 Credit Facility that may limit our ability to repurchase stock if we do not maintain various designated financial criteria. During the fiscal year 2010, we repurchased 3.0 million shares of our common stock. On February 25, 2011, our Board of Directors authorized an increase in the number of our common shares that we may repurchase in fiscal year 2011 from 3.0 million shares to 8.0 million shares, which was reflected in our third amendment to the 2007 Credit Facility.
Under the terms of our 2007 Credit Facility, we are generally required to remit as debt payments any proceeds we receive from the sale of assets and the issuance of debt. On February 16, 2010, we entered into a consent to our 2007 Credit Facility, which allows us to use the funds from the sale of our equity investment in MIBRAG for general operating purposes. As a result of this consent, we were not required to remit a payment relating to this transaction in the first quarter of 2010 and our next scheduled payment is expected to be due in March 2012.
As of December 31, 2010 and January 1, 2010, the outstanding balance of term loan A was $490.0 million and $607.6 million at interest rates of 1.26% and 1.25%, respectively. As of December 31, 2010 and January 1, 2010, the outstanding balance of term loan B was $135.0 million and $167.4 million at interest rates of 2.51% and 2.50%, respectively. We did not have an outstanding debt balance on our revolving line of credit as of the end of our fiscal years 2010 and 2009.
The original scheduled principal payments under the term loans began on December 28, 2007 and are due quarterly. Equal quarterly payments for term loan A will be required in aggregate annual amounts expressed as a percentage of the original principal amount of term loan A as follows:
|
Year
|
Percentage
|
|||||
|
2008
|
5 | % | ||||
|
2009
|
5 | % | ||||
|
2010
|
10 | % | ||||
|
2011
|
10 | % | ||||
|
2012
|
70 | % | ||||
|
Total
|
100 | % | ||||
Quarterly payments for term loan B will be 0.25%, or 1% on an annual basis, until the last four quarters prior to maturity, of the original aggregate principal amount of the term loan B. Over the four quarters prior to maturity, the remaining principal balance of term loan B will be payable in equal quarterly amounts. We have the option to prepay the term loans at anytime without penalty.
Under our 2007 Credit Facility, we are subject to two financial covenants: 1) a maximum consolidated leverage ratio, which is calculated by dividing consolidated total debt by consolidated earnings before interest, taxes, depreciation and amortization (“EBITDA”), as defined below, and 2) a minimum interest coverage ratio, which is calculated by dividing consolidated cash interest expense into consolidated EBITDA. Both calculations are based on the financial data of our most recent four fiscal quarters.
All loans outstanding under our 2007 Credit Facility bear interest, at our option, at either the base rate or LIBOR, plus in each case an applicable margin. The applicable margin will adjust according to a performance pricing grid based on our ratio of consolidated total funded debt to consolidated EBITDA, referred to as the “Consolidated Leverage Ratio.”
For purposes of our 2007 Credit Facility, consolidated EBITDA is defined as consolidated net income attributable to URS plus interest, depreciation and amortization expense, amounts set aside for taxes, and other non-cash items (including impairments of goodwill or intangible assets).
As of December 31, 2010, our consolidated leverage ratio was 1.1, which did not exceed the maximum consolidated leverage ratio of 2.0, and our consolidated interest coverage ratio was 25.4, which exceeded the minimum consolidated interest coverage ratio of 5.5. During the first quarter of 2010, Moody’s Investor Services upgraded our credit rating to Ba1. On April 16, 2010, Standard and Poor’s upgraded our credit rating to BB+. As a result of these upgrades in our credit ratings in the first nine months of 2010, some of our non-financial covenants such as the ability to acquire other companies, are no longer applicable or became less restrictive. We were in compliance with the covenants of our 2007 Credit Facility as of December 31, 2010.
Substantially all of our operating domestic subsidiaries jointly and severally guarantee the 2007 Credit Facility. Our consolidated obligations are collateralized by a first priority security interest in the capital stock of our subsidiary guarantors. As a result of the rating agency changes discussed above, the first priority interest in existing personal property has been released by the parties to the 2007 Credit Facility as allowed, and we are no longer required to include future acquired property as security.
Revolving Line of Credit
Our revolving line of credit is used to fund daily operating cash needs and to support our standby letters of credit. During the ordinary course of business, the use of our revolving line of credit is a function of collection and disbursement activities. Our daily cash needs generally follow a predictable pattern that parallels our payroll cycles, which dictate, as necessary, our short-term borrowing requirements.
We did not have an outstanding debt balance on our revolving line of credit as of December 31, 2010 and January 1, 2010. As of December 31, 2010, we issued $160.6 million of letters of credit, leaving $539.4 million available on our revolving credit facility. If we elected to borrow the remaining amounts available under our revolving line of credit as of December 31, 2010, we would remain in compliance with the covenants of our 2007 Credit Facility.
Our revolving line of credit information was summarized as follows:
|
Year Ended
|
||||||||||||
|
(In millions, except percentages)
|
December 31,
2010
|
January 1,
2010
|
January 2,
2009
|
|||||||||
|
Effective average interest rates paid on the revolving line of credit
|
3.0 | % | 3.2 | % | 5.6 | % | ||||||
|
Average daily revolving line of credit balances
|
$ | 0.3 | $ | — | $ | 0.2 | ||||||
|
Maximum amounts outstanding at any one point
|
$ | 12.1 | $ | 0.3 | $ | 7.7 | ||||||
Other Indebtedness
Notes payable, foreign credit lines and Loan Notes. As of December 31, 2010 and January 1, 2010, we had outstanding amounts of $62.8 million and $24.6 million, respectively, in notes payable, Loan Notes, and foreign lines of credit. The weighted average interest rates of the notes were approximately 2.3% and 5.6% as of December 31, 2010 and January 1, 2010, respectively. Notes payable primarily include notes used to finance the purchase of office equipment, computer equipment and furniture.
The Loan Notes of £17.9 million (equivalent to U.S. $27.9 million as of December 31, 2010) were issued to shareholders of Scott Wilson as an alternative to cash consideration. The Loan Notes are collateralized by cash held in trust and are redeemable at each note holder’s option in whole or in part on each of the interest payment dates falling six months after September 10, 2010, the issuance date. The Loan Notes will expire and be fully redeemed on September 10, 2015. The Loan Notes will pay interest semi-annually at the prevailing six-month pound sterling LIBOR rate less 0.25% set on each March and September 10th. See Note 7, “Acquisition,” to our “Consolidated Financial Statements and Supplementary Data” included under Item 8 of this report for more information regarding this acquisition.
We maintain foreign lines of credit, which are collateralized by the assets of our foreign subsidiaries and in some cases, parent guarantees. As part of our acquisition of Scott Wilson, we assumed various credit lines, the largest being £40.0 million (equivalent to U.S. $62.0 million as of December 31, 2010) to allow for borrowing capacity in the U.K. and for worldwide guarantee usage.
As of December 31, 2010 and January 1, 2010, we had $88.1 million and $15.8 million in lines of credit available under these facilities, respectively. As of December 31, 2010, the total outstanding debt balance of our credit lines was $16.1 million.
Capital Leases. As of December 31, 2010 and January 1, 2010, we had approximately $19.4 million and $16.5 million in obligations under our capital leases, respectively, consisting primarily of leases for office equipment, computer equipment and furniture.
Operating Leases. As of December 31, 2010 and January 1, 2010, we had approximately $600.3 million and $489.8 million, respectively, in obligations under our operating leases, consisting primarily of real estate leases.
Other Activities
Interest Rate Instruments. Our 2007 Credit Facility is a floating-rate facility. We had a floating-for-fixed interest rate swap with a notional amount of $200.0 million, which expired on December 31, 2010, to hedge against changes in floating interest rates. As of December 31, 2010 and January 1, 2010, the fair values of our interest rate instruments were $1.0 million and $7.1 million, respectively, which were recorded in “Other current liabilities” on our Consolidated Balance Sheets. The adjustment to the fair value of the swap liability was recorded in “Accumulated other comprehensive loss.” We recorded no gain or loss on our Consolidated Statements of Operations as our interest rate swap was an effective hedge. For other interest rate instruments, we recorded immaterial amounts to our Consolidated Statements of Operations.
Foreign Currency Forward Contract. We operate our business globally and our foreign subsidiaries conduct businesses in various foreign currencies. Therefore, we are subject to foreign currency risk. From time to time, we purchase derivative financial instruments in the form of foreign currency exchange contracts to manage specific foreign currency exposures. Currently, we have several immaterial foreign currency contracts to cover the risks associated with our international operations.
On March 4, 2009, we entered into a foreign currency forward contract with a notional amount of €196.0 million (equivalent to U.S. $246.1 million per the contract) with a maturity window from April 15, 2009 to July 31, 2009. The primary objective of the contract was to manage our exposure to foreign currency transaction risk related to the Euro proceeds we received from the sale of our equity investment in MIBRAG, which was completed on June 10, 2009. We designated €128.0 million (equivalent to U.S. $160.7 million at contract rate) of the contract as a hedge of our net investment in MIBRAG. On June 12, 2009, we settled our foreign currency forward contract. For the year ended January 1, 2010, we recorded a loss on the settlement of this contract of $27.7 million in “Other income, net” in our Consolidated Statements of Operations.
As of December 31, 2010 and January 1, 2010, we had remaining tax deductible goodwill of $338.0 million and $421.6 million, respectively, resulting from acquisitions by WGI before our acquisition of WGI, as well as from our other prior acquisitions. The amortization of this tax goodwill is deductible over various periods ranging up to 12 years. The tax deduction for goodwill for 2011 is expected to be approximately $85 million and is expected to decrease slightly over the next three years and to be substantially lower after four years.
As of December 31, 2010, our federal NOL carryover was approximately $22.2 million. These federal NOL carryovers expire in years 2020 through 2025. In addition to the federal NOL carryovers, there are also state income tax NOL carryovers in various taxing jurisdictions of approximately $395.2 million. These state NOL carryovers expire in years 2011 through 2027. There are also foreign NOL carryovers in various jurisdictions of approximately $365.3 million. The majority of the foreign NOL carryovers have no expiration date. At December 31, 2010, the federal, state and foreign NOL carryovers resulted in a deferred tax asset of $111.9 million with a valuation allowance of $94.5 million established against this tax asset. None of the remaining deferred tax assets related to NOL carryovers is individually material. Full recovery of our NOL carryovers will require that the appropriate legal entity generate taxable income in the future at least equal to the amount of the NOL carryovers within the applicable taxing jurisdiction.
Valuation allowances for deferred tax assets are established when necessary to reduce deferred tax assets to the amount expected to be realized. Based on expected future operating results, we believe that realization of deferred tax assets in excess of our valuation allowances is more likely than not.
We have indefinitely reinvested $363.8 million of undistributed earnings of our foreign operations outside of our U.S. tax jurisdiction as of December 31, 2010. No deferred tax liability has been recognized for the remittance of such earnings to the U.S. since it is our intention to utilize these earnings in our foreign operations. The determination of the amount of deferred taxes on these earnings is not practicable since the computation would depend on a number of factors that cannot be known unless a decision to repatriate the earnings is made.
The effective income tax rates for the years ended December 31, 2010, January 1, 2010, and January 2, 2009 are as follows:
|
Year Ended
|
Effective Income Tax Rates
|
|||||
|
December 31, 2010
|
30.1 | % | ||||
|
January 1, 2010
|
37.9 | % | ||||
|
January 2, 2009
|
41.7 | % | ||||
The reduction in the effective income tax rate for the year ended January 1, 2010 was due primarily to our determination made during the year that the undistributed earnings of those foreign subsidiaries we owned prior to the WGI acquisition that were previously indefinitely reinvested would no longer be indefinitely reinvested offshore. This determination resulted in the accrual of deferred U.S. tax liabilities on the undistributed earnings of these foreign subsidiaries and also the recognition of future foreign tax credits associated with their undistributed earnings. Because the foreign tax credits significantly exceeded our accrual of deferred U.S. tax liabilities on these undistributed earnings, our effective tax rate for the year was reduced. This rate reduction was partially offset by the establishment during the year of valuation allowances against existing deferred tax assets, and also by the write-off of foreign income tax receivables associated with prior earnings of some of our foreign subsidiaries that we determined during the year could not be collected.
During the first quarter of 2010, we determined that our plans to expand our international presence would require that we indefinitely reinvest the earnings of all of our foreign subsidiaries offshore. On February 16, 2010, we entered into a consent with our lenders related to our 2007 Credit Facility that permitted us to utilize the funds received in June 2009 from the sale of our equity investment in MIBRAG for general operating purposes. This consent allowed these funds to be indefinitely reinvested offshore to facilitate the implementation of our international growth strategy. The reduction in the effective income tax rate for the year ended December 31, 2010 was primarily due to the determination to reinvest the earnings of all of our foreign subsidiaries offshore, which resulted in the reversal of the net U.S. deferred tax liability on the undistributed earnings of all foreign subsidiaries. This reduction in the effective income tax rate increased net income attributable to URS by $42.1 million. See Note 12, “Income Taxes,” to our “Consolidated Financial Statements and Supplementary Data” included under Item 8 of this annual report for additional disclosure.
For fiscal year 2008, our foreign subsidiaries distributed cash to their U.S. shareholders of $8.3 million, which was taxable in the U.S. No cash distributions were made from our foreign subsidiaries to their U.S. shareholders in fiscal year 2009 or 2010. In the fourth quarter of 2009 and the third quarter of 2010, some distributions were made between our foreign subsidiaries, which resulted in foreign earnings being subject to U.S. taxation of $16.0 million and $6.4 million, respectively.
As of December 31, 2010 and January 1, 2010, we had $21.5 million and $25.2 million of unrecognized tax benefits, respectively. Included in the balance of unrecognized tax benefits at the end of fiscal year 2010 were $17.2 million of tax benefits, which, if recognized, would affect our effective tax rate. A reconciliation of the beginning and ending amount of unrecognized tax benefits is as follows:
|
(In millions)
|
December 31,
2010
|
January 1,
2010
|
January 2,
2009
|
|||||||||
|
Unrecognized tax benefits beginning balance
|
$ | 25.2 | $ | 51.3 | $ | 39.7 | ||||||
|
Gross increase – tax positions in prior years
|
1.1 | 3.0 | 13.0 | |||||||||
|
Gross decrease – tax positions in prior years
|
(0.1 | ) | (0.2 | ) | (1.1 | ) | ||||||
|
Gross increase – current period tax positions
|
1.4 | 0.5 | 1.7 | |||||||||
|
Settlements
|
(1.6 | ) | (27.6 | ) | (1.0 | ) | ||||||
|
Lapse of statute of limitations
|
(5.3 | ) | (1.8 | ) | (1.0 | ) | ||||||
|
Unrecognized tax benefits acquired in current year
|
0.8 | — | — | |||||||||
|
Unrecognized tax benefits ending balance
|
$ | 21.5 | $ | 25.2 | $ | 51.3 | ||||||
We recognize accrued interest related to unrecognized tax benefits in interest expense and penalties as a component of tax expense. During the years ended December 31, 2010, January 1, 2010, and January 2, 2009, we recognized $1.5 million, $0.5 million, and $1.6 million, respectively, in interest and penalties. We have accrued approximately $8.1 million and $5.6 million in interest and penalties as of December 31, 2010 and January 1, 2010, respectively. The unrecognized tax benefits settled during the year ended January 1, 2010 included all of the unrecognized tax benefits acquired in the WGI acquisition. With a few exceptions, in jurisdictions where our tax liability is immaterial, we are no longer subject to U.S. federal, state, local or foreign examinations by tax authorities for years before 2004.
It is reasonably possible that we will recognize up to $2.1 million in previously unrecognized tax benefits within the next twelve months as a result of the settlement of state and federal tax audits. The timing and amounts of these audit settlements are uncertain, but we do not expect any of these settlements to have a significant impact on our financial position or results of operations.
Other Comprehensive Income (Loss)
Our other comprehensive income (loss), net of tax for the year ended December 31, 2010 was comprised of pension and post-retirement adjustments, foreign currency translation adjustments, and an unrealized gain on interest rate swaps. The 2010 pension and post-retirement adjustment of $0.7 million, net of tax, was caused primarily by net actuarial investment losses and amortization. The 2010 foreign currency translation adjustment of $8.8 million, net of tax, resulted from the significant strengthening of the U.S. dollar against foreign currencies. The interest rate swap charge of $4.2 million, net of tax, resulted from the expiration of our floating-for-fixed interest rate swap. See Note 17, “Other Comprehensive Income (Loss) and Accumulated Other Comprehensive Income (Loss)” to our “Consolidated Financial Statements and Supplementary Data” included under Item 8 of this report for more disclosure about our other comprehensive loss.
CRITICAL ACCOUNTING POLICIES AND ESTIMATES
The preparation of consolidated financial statements in conformity with generally accepted accounting principles requires us to make estimates and assumptions in the application of certain accounting policies that affect amounts reported in our consolidated financial statements and related footnotes included in Item 8 of this report. In preparing these financial statements, we have made our best estimates and judgments of certain amounts, after considering materiality. Application of these accounting policies, however, involves the exercise of judgment and the use of assumptions as to future uncertainties. Consequently, actual results could differ from our estimates, and these differences could be material.
The accounting policies that we believe are most critical to an investor’s understanding of our financial results and condition and that require complex judgments by management are described below. There were no material changes to these critical accounting policies during the year ended December 31, 2010. However, we adopted two new accounting standards relating to transfers of financial assets and consolidation of VIEs. See the discussion regarding the adoption of the new accounting standards, as well as our discussion of VIEs and goodwill below.
Consolidation of Variable Interest Entities
We participate in joint ventures, which include partnerships and partially-owned limited liability companies to bid, negotiate and complete specific projects. We are required to consolidate these joint ventures if we hold the majority voting interest or if we meet the criteria under the variable interest model as described below.
A variable interest entity (“VIE”) is an entity with one or more of the following characteristics (a) the total equity investment at risk is not sufficient to permit the entity to finance its activities without additional financial support; (b) as a group, the holders of the equity investment at risk lack the ability to make certain decisions, the obligation to absorb expected losses or the right to receive expected residual returns; or (c) the equity investors have voting rights that are not proportional to their economic interests.
Our VIEs may be funded through contributions, loans and/or advances from the joint venture partners or by advances and/or letters of credit provided by our clients. Our VIEs may be directly governed, managed, operated and administered by the joint venture partners. Others have no employees and, although these entities own and hold the contracts with the clients, the services required by the contracts are typically performed by the joint venture partners or by other subcontractors.
If we are determined to be the primary beneficiary of the VIE, we are required to consolidate it. We are considered to be the primary beneficiary if we have the power to direct the activities that most significantly impact the VIE’s economic performance and the obligation to absorb losses or the right to receive benefits of the VIE that could potentially be significant to the VIE. In determining whether we are the primary beneficiary, we take into consideration the following:
|
·
|
Identifying the significant activities and the parties that would perform them;
|
|
·
|
Reviewing the governing board composition and participation ratio;
|
|
·
|
Determining the equity, profit and loss ratio;
|
|
·
|
Determining the management-sharing ratio;
|
|
·
|
Reviewing employment terms, including which joint venture partner provides the project manager; and
|
|
·
|
Reviewing the funding and operating agreements.
|
Examples of our significant activities include the following:
|
·
|
Engineering services;
|
|
·
|
Procurement services;
|
|
·
|
Construction;
|
|
·
|
Construction management; and
|
|
·
|
Operations and maintenance services.
|
Based on the above, if we determine that the power to direct the significant activities is shared by two or more joint venture parties, then there is no primary beneficiary and no party consolidates the VIE. In making the shared-power determination, we analyze the key contractual terms, governance, related party and de facto agency as they are defined in the accounting standard, and other arrangements to determine if the shared power exists.
As a result of our analysis under the current accounting standard for consolidation, we determined that we were the primary beneficiary of, and therefore, must consolidate twelve joint ventures in which we did not have a majority voting interest as of and for the year ended December 31, 2010. Six of these joint ventures were consolidated within our Infrastructure & Environment segment and six were consolidated within our Energy & Construction segment.
Total revenues of these joint ventures for the year ended December 31, 2010 was less than 10% of our total consolidated revenues. The net impact of these joint ventures on segment revenues for the year ended December 31, 2010 was less than 15% of total segment revenues for each segment. There was no impact on our debt as a result of consolidating these joint ventures.
As required by the accounting standard, we perform a quarterly re-assessment of our status as primary beneficiary. This evaluation may result in a newly consolidated joint venture or in deconsolidating a previously consolidated joint venture. Subsequent to our adoption of the standard at the beginning of fiscal year 2010, we concluded that no unconsolidated joint ventures should be consolidated and that no consolidated joint ventures should be de-consolidated. See Note 5, “Joint Ventures,” to our “Consolidated Financial Statements and Supplementary Data” included under Item 8 of this report for further information on our VIEs.
Revenue Recognition
We recognize revenues from engineering, construction and construction-related contracts using the percentage-of-completion method as project progress occurs. Service-related contracts, including operations and maintenance services and a variety of technical assistance services, are accounted for using the proportionate performance method as project progress occurs.
Percentage of Completion. Under the percentage-of-completion method, revenue is recognized as contract performance progresses. We estimate the progress towards completion to determine the amount of revenue and profit to recognize. We generally utilize a cost-to-cost approach in applying the percentage-of-completion method, where revenue is earned in proportion to total costs incurred, divided by total costs expected to be incurred. Costs are generally determined from actual hours of labor effort expended at per-hour labor rates calculated using a labor dollar multiplier that includes direct labor costs and allocable overhead costs. Direct non-labor costs are charged as incurred plus any mark-up permitted under the contract.
For some contracts, using the cost-to-cost method in estimating the percentage of completion may misstate the progress of the project. For instance, in a project where a large amount of permanent materials are purchased, including the costs of these materials in calculating the percentage of completion may overstate the actual progress on the project. For projects where the cost-to-cost method does not appropriately reflect the progress on the projects, we use alternative methods, including labor hours, labor dollars, efforts expended, units of production, or value added for measuring progress on the project and recognize revenue accordingly.
Under the percentage-of-completion method, recognition of profit is dependent upon the accuracy of a variety of estimates, including engineering progress, materials quantities, and achievement of milestones, incentives, penalty provisions, labor productivity, cost estimates and others. Such estimates are based on various professional judgments we make with respect to those factors and are subject to change as the project proceeds and new information becomes available.
Proportional Performance. Our service contracts are accounted for using the proportional performance method, under which revenue is recognized in proportion to the number of service activities performed, in proportion to the direct costs of performing the service activities, or evenly across the period of performance depending upon the nature of the services provided.
Revenues from all contracts may vary based on the actual number of labor hours worked and other actual contract costs incurred. If actual labor hours and other contract costs exceed the original estimate agreed to by our client, we generally obtain a change order, contract modification or successfully prevail in a claim in order to receive and recognize additional revenues relating to the additional costs (see “Change Orders and Claims” below).
If estimated total costs on any contract indicate a loss, we charge the entire estimated loss to operations in the period the loss becomes known. The cumulative effect of revisions to revenue, estimated costs to complete contracts, including penalties, incentive awards, change orders, claims, anticipated losses, and others are recorded in the accounting period in which the events indicating a loss or change in estimates are known and the loss can be reasonably estimated. Such revisions could occur at any time and the effects may be material.
We have a history of making reasonably dependable estimates of the extent of progress towards completion, contract revenue and contract completion costs on our long-term engineering and construction contracts. However, due to uncertainties inherent in the estimation process, it is possible that actual completion costs may vary from estimates.
Change Orders and Claims. Change orders and/or claims occur when changes are experienced once contract performance is underway, and may arise under any of the contract types described below.
Change orders are modifications of an original contract that effectively change the existing provisions of the contract without adding new scope or terms. Change orders may include changes in specifications or designs, manner of performance, facilities, equipment, materials, sites and period of completion of the work. Either we or our clients may initiate change orders. Client agreement as to the terms of change orders is, in many cases, reached prior to work commencing; however, sometimes circumstances require that work progress without obtaining client agreement. Costs related to change orders are recognized as incurred. Revenues attributable to change orders that are unapproved as to price or scope are recognized to the extent that costs have been incurred if the amounts can be reliably estimated and their realization is probable. Revenues in excess of the costs attributable to change orders that are unapproved as to price or scope are recognized only when realization is assured beyond a reasonable doubt. Change orders that are unapproved as to both price and scope are evaluated as claims.
Claims are amounts in excess of agreed contract prices that we seek to collect from our clients or others for customer-caused delays, errors in specifications and designs, contract terminations, change orders that are either in dispute or are unapproved as to either scope or price, or other causes of unanticipated additional contract costs. Claims are included in total estimated contract revenues when the contract or other evidence provides a legal basis for the claim, when the additional costs are caused by circumstances that were unforeseen at the contract date and are not the result of the deficiencies in the contract performance, when the costs associated with the claim are identifiable, and when the evidence supporting the claim is objective and verifiable. Revenue on claims is recognized only to the extent that contract costs related to the claims have been incurred and when it is probable that the claim will result in a bona fide addition to contract value which can be reliably estimated. No profit is recognized on claims until final settlement occurs. As a result, costs may be recognized in one period while revenues may be recognized when client agreement is obtained or claims resolution occurs, which can be in subsequent periods.
“At-risk” and “Agency” Contracts. The amount of revenues we recognize also depends on whether the contract or project represents an at-risk or an agency relationship between the client and us. Determination of the relationship is based on characteristics of the contract or the relationship with the client. For at-risk relationships where we act as the principal to the transaction, the revenue and the costs of materials, services, payroll, benefits, and other costs are recognized at gross amounts. For agency relationships, where we act as an agent for our client, only the fee revenue is recognized, meaning that direct project costs and the related reimbursement from the client are netted. From time to time, we may also collaborate with other parties by sharing our assets, services and knowledge for a joint marketing and business development arrangement, or we may enter into other third-party contractual agreements to perform other services or specific activities required by our clients. Significant accounting presentation and measurements are determined at inception based on the structure of the legal entity and the contractual agreement. If we determine that these agreements are collaborative arrangements that are not accounted for as specified under the consolidation or equity method and joint venture investments guidance, then we account for the arrangement at gross amounts for at-risk relationships or at net amounts for agency relationships. For the years ended December 31, 2010, January 1, 2010, and January 2, 2009, we recognized immaterial amounts of revenues from agency contracts and collaborative arrangements.
In classifying contracts or projects as either at-risk or agency, we consider the following primary characteristics to be indicative of at-risk relationships: (i) we acquire the related goods and services using our procurement resources, (ii) we assume the risk of loss under the contract and (iii) we are responsible for insurance coverage, employee-related liabilities and the performance of subcontractors.
We consider the following primary characteristics to be indicative of agency relationships: (i) our client owns the work facilities utilized under the contract, (ii) we act as a procurement agent for goods and services acquired with client funds, (iii) our client is invoiced for our fees, (iv) our client is exposed to the risk of loss and maintains insurance coverage, and (v) our client is responsible for employee-related benefit plan liabilities and any remaining liabilities at the end of the contract.
Contract Types
Our contract types include cost-plus, target-price, fixed-price, and time-and-materials contracts. Revenue recognition is determined based on the nature of the service provided, irrespective of the contract type, with engineering, construction and construction-related contracts accounted for under the percentage-of-completion method and service-related contracts accounted for under the proportional performance method.
Cost-Plus Contracts. We enter into four major types of cost-plus contracts. Revenue for the majority of our cost-plus contracts is recognized using the percentage-of-completion method:
Cost-Plus Fixed Fee. Under cost-plus fixed fee contracts, we charge our clients for our costs, including both direct and indirect costs, plus a fixed negotiated fee.
Cost-Plus Fixed Rate. Under our cost-plus fixed rate contracts, we charge clients for our direct costs plus negotiated rates based on our indirect costs.
Cost-Plus Award Fee. Some cost-plus contracts provide for award fees or penalties based on performance criteria in lieu of a fixed fee or fixed rate. Other contracts include a base fee component plus a performance-based award fee. In addition, we may share award fees with subcontractors and/or our employees. We accrue fee sharing on a monthly basis as related award fee revenue is earned. We take into consideration the award fee or penalty on contracts when estimating revenues and profit rates, and we record revenues related to the award fees when there is sufficient information to assess anticipated contract performance. On contracts that represent higher than normal risk or technical difficulty, we defer all award fees until an award fee letter is received. Once an award fee letter is received, the estimated or accrued fees are adjusted to the actual award amount.
Cost-Plus Incentive Fee. Some of our cost-plus contracts provide for incentive fees based on performance against contractual milestones. The amount of the incentive fees vary, depending on whether we achieve above-, at- or below-target results. We recognize incentive fees revenues as milestones are achieved, assuming that we will achieve at-target results, unless our estimates indicate our cost at completion to be significantly above or below target.
Target-Price Contracts. Under our target-price contracts, project costs are reimbursable. Our fee is established against a target budget that is subject to changes in project circumstances and scope. Should the project costs exceed the target budget within the agreed-upon scope, we generally degrade a portion of our fee or profit to mitigate the excess cost; however, the customer reimburses us for the costs that we incur if costs continue to escalate beyond our expected fee. If the project costs are less than the target budget, we generally recover a portion of the project cost savings as additional fee or profit. We recognize revenues on target-price contracts using the percentage-of-completion method.
Fixed-Price Contracts. We enter into two major types of fixed-price contracts:
Firm Fixed-Price (“FFP”). Under FFP contracts, our clients pay us an agreed fixed-amount negotiated in advance for a specified scope of work. We generally recognize revenues on FFP contracts using the percentage-of-completion method. If the nature or circumstances of the contract prevent us from preparing a reliable estimate at completion, we will delay profit recognition until adequate information about the contract’s progress becomes available. Prior to completion, our recognized profit margins on any FFP contract depend on the accuracy of our estimates and will increase to the extent that our current estimates of aggregate actual costs are below amounts previously estimated. Conversely, if our current estimated costs exceed prior estimates, our profit margins will decrease and we may realize a loss on a project.
Fixed-Price Per Unit (“FPPU”). Under our FPPU contracts, clients pay us a set fee for each service or production transaction that we complete. We recognize revenues under FPPU contracts as we complete the related service or production transactions for our clients generally using the proportional performance method. Some of our FPPU contracts are subject to maximum contract values.
Time-and-Materials Contracts. Under our time-and-materials contracts, we negotiate hourly billing rates and charge our clients based on the actual time that we spend on a project. In addition, clients reimburse us for our actual out-of-pocket costs of materials and other direct incidental expenditures that we incur in connection with our performance under the contract. The majority of our time-and-material contracts are subject to maximum contract values and, accordingly, revenues under these contracts are generally recognized under the percentage-of-completion method. However, time and materials contracts that are service-related contracts are accounted for utilizing the proportional performance method. Revenues on contracts that are not subject to maximum contract values are recognized based on the actual number of hours we spend on the projects plus any actual out-of-pocket costs of materials and other direct incidental expenditures that we incur on the projects. Our time-and-materials contracts also generally include annual billing rate adjustment provisions.
Goodwill and Intangible Assets Impairment Review
Goodwill may be impaired if the estimated fair value of one or more of our reporting units’ goodwill is less than the carrying value of the unit’s goodwill. Because we have grown through acquisitions, goodwill and other intangible assets represent a substantial portion of our total assets. Goodwill and other net intangible assets were $3.9 billion as of December 31, 2010. We perform an analysis on our goodwill balances to test for impairment on an annual basis and whenever events occur or circumstances change that indicate impairment could exist. There are several instances that may cause us to further test our goodwill for impairment between the annual testing periods including: (i) continued deterioration of market and economic conditions that may adversely impact our ability to meet our projected results; (ii) declines in our stock price caused by continued volatility in the financial markets that may result in increases in our weighted-average cost of capital or other inputs to our goodwill assessment; and (iii) the occurrence of events that may reduce the fair value of a reporting unit below its carrying amount, such as the sale of a significant portion of one or more of our reporting units.
Our 2010 annual reviews indicated that no impairment of goodwill for any of our reporting units existed, as our reporting units had carrying values greater than zero and their fair values exceeded their carrying values. For the year ended December 31, 2010, no triggering events occurred that would have required us to perform an interim impairment review of our goodwill.
We believe the methodology that we use to review impairment of goodwill, which includes a significant amount of judgment and estimates, provides us with a reasonable basis to determine whether impairment has occurred. However, many of the factors employed in determining whether our goodwill is impaired are outside of our control, and it is reasonably likely that assumptions and estimates will change in future periods. These changes could result in future impairments.
Goodwill impairment reviews involve a two-step process. The first step is a comparison of each reporting unit’s fair value to its carrying value. We estimate fair value using market information and discounted cash flow analyses, referred to as the income approach. The income approach uses a reporting unit’s projection of estimated operating results and discounts those back to the present using a weighted-average cost of capital that reflects current market conditions. To arrive at our cash flow projections, we use estimates of economic and market information over a projection period of ten years, including growth rates in revenues, costs, estimates of future expected changes in operating margins and cash expenditures. Other significant estimates and assumptions include terminal value growth rates, future estimates of capital expenditures and changes in future working capital requirements.
We validate our estimate of fair value of each reporting unit under the income approach by comparing the resulting values to fair value estimates using a market approach. A market approach estimates fair value by applying cash flow multiples to the reporting unit's operating performance. The multiples are derived from comparable publicly traded companies with operating and investment characteristics similar to those of the reporting units. When performing our annual impairment analysis, we also reconcile the total of the fair values of our reporting units with our market capitalization to determine if the sum of the individual fair values is reasonable compared to the external market indicators. If our reconciliation indicates a significant difference between our external market capitalization and the fair values of our reporting units, we review and adjust, if appropriate, our weighted-average cost of capital and consider if the implied control premium is reasonable in light of current market conditions.
If the carrying value of the reporting unit is higher than its fair value, there is an indication that impairment may exist and the second step must be performed to measure the amount of impairment. The amount of impairment is determined by comparing the implied fair value of the reporting unit’s goodwill to the carrying value of the goodwill calculated in the same manner as if the reporting unit were being acquired in a business combination. If the implied fair value of goodwill is less than the recorded goodwill, we would record an impairment charge for the difference.
We also perform an analysis on our intangible assets to test for impairment whenever events occur that indicate impairment could exist.
See Note 8, “Goodwill and Intangible Assets” to our “Consolidated Financial Statements and Supplementary Data” included under Item 8 of this report for more disclosure about our goodwill impairment reviews.
Allowance for Uncollectible Accounts Receivable
We reduce our accounts receivable and costs and accrued earnings in excess of billings on contracts by establishing an allowance for amounts that, in the future, may become uncollectible or unrealizable, respectively. We determine our estimated allowance for uncollectible amounts based on management’s judgments regarding our operating performance related to the adequacy of the services performed or products delivered, the status of change orders and claims, our experience settling change orders and claims and the financial condition of our clients, which may be dependent on the type of client and current economic conditions to which the client may be subject.
Deferred Income Taxes
We use the asset and liability approach for financial accounting and reporting for income taxes. Deferred income tax assets and liabilities are computed annually for differences between the financial statement and tax bases of assets and liabilities that will result in taxable or deductible amounts in the future based on enacted tax laws and rates applicable to the periods in which the differences are expected to affect taxable income. Valuation allowances based on our judgments and estimates are established when necessary to reduce deferred tax assets to the amount expected to be realized in future operating results. Management believes that realization of deferred tax assets in excess of the valuation allowance is more likely than not. Our estimates are based on facts and circumstances in existence as well as interpretations of existing tax regulations and laws applied to the facts and circumstances, with the help of professional tax advisors. Therefore, we estimate and provide for amounts of additional income taxes that may be assessed by the various taxing authorities.
Self-insurance Reserves
Self-insurance reserves represent reserves established as a result of insurance programs under which we have self-insured portions of our business risks. We carry substantial premium-paid, traditional risk transfer insurance for our various business risks; however, we self-insure and establish reserves for the retentions on workers’ compensation insurance, general liability, automobile liability, and professional errors and omissions liability.
Defined Benefit and Post-retirement Benefit Plans
We account for our defined benefit pension plans and post-retirement benefits using actuarial valuations that are based on assumptions, including discount rates, long-term rates of return on plan assets, and rates of change in participant compensation levels. We evaluate the funded status of each of our defined benefit pension plans and post-retirement benefit plans using these assumptions, consider applicable regulatory requirements, tax deductibility, reporting considerations and other relevant factors, and thereby determine the appropriate funding level for each period. The discount rate used to calculate the present value of the pension benefit obligation is assessed at least annually. The discount rate represents the rate inherent in the price at which the plans’ obligations are intended to be settled at the measurement date.
Holding all other assumptions constant, changes in the discount rate assumption that we used in our annual analysis would have the following estimated effect on the benefit obligations of our defined benefit and post-retirement benefit plans as shown in the table below.
|
Change in an Assumption
(In millions)
|
Domestic Defined Benefit Plans
|
Foreign Defined Benefit Plan
|
Post-retirement Benefit Plans
|
|||||||||
|
25 basis point increase in discount rate
|
$ | (9.9 | ) | $ | (18.8 | ) | $ | — | ||||
|
25 basis point decrease in discount rate
|
$ | 10.2 | $ | 20.1 | $ | — | ||||||
Hypothetical changes in all other key assumptions of 25 basis points have an immaterial impact on the benefit obligations of our defined benefit and post-retirement benefit plans. Hypothetical changes in key assumptions of 25 basis points also have an immaterial impact on net periodic pension costs of these plans.
Business Combinations
We account for business combinations under the purchase accounting method. The cost of an acquired company is assigned to the tangible and intangible assets purchased and the liabilities assumed on the basis of their fair values at the date of acquisition. The determination of fair values of assets and liabilities acquired requires us to make estimates and use valuation techniques when market value is not readily available. Any excess of purchase price over the fair value of the tangible and intangible assets acquired is allocated to goodwill. The transaction costs associated with business combinations are expensed as they are incurred.
ADOPTED AND OTHER RECENTLY ISSUED ACCOUNTING STANDARDS
A new accounting standard on transfers of financial assets became effective for us at the beginning of our 2010 fiscal year. This standard eliminates the concept of a qualifying special-purpose entity, limits the circumstances under which a financial asset is derecognized and requires additional disclosures concerning a transferor's continuing involvement with transferred financial assets. The adoption of this standard did not have a material impact on our consolidated financial statements.
A new accounting standard on consolidation of VIEs became effective for us at the beginning of our 2010 fiscal year. This standard amends the accounting and disclosure requirements for the consolidation of a VIE. It requires additional disclosures about the significant judgments and assumptions used in determining whether to consolidate a VIE, the restrictions on a consolidated VIE’s assets and on the settlement of a VIE’s liabilities, the risk associated with involvement in a VIE, and the financial impact on a company due to its involvement with a VIE. As the standard requires ongoing quarterly evaluation of the application of the new requirements, changes in circumstances could result in the identification of additional VIEs to be consolidated or existing VIEs to be deconsolidated in any reporting period. We adopted this standard prospectively and based on the carrying values of the entities at the date of adoption. The adoption of this standard did not have a material impact on our consolidated financial statements. For additional disclosures, see Note 5, “Joint Ventures,” to our “Consolidated Financial Statements and Supplementary Data” included under Item 8 of this report.
An accounting standard update related to recurring and nonrecurring fair value measurements was issued. This update requires new disclosures on significant transfers of assets and liabilities between Level 1 and Level 2 of the fair value hierarchy (including the reasons for these transfers) and the reasons for any transfers in or out of Level 3. It also requires a reconciliation of recurring Level 3 measurements including purchases, sales, issuances and settlements on a gross basis. The accounting update clarifies certain existing disclosure requirements and requires fair value measurement disclosures for each class of assets and liabilities as opposed to each major category of assets and liabilities. It also clarifies that entities are required to disclose information about both the valuation techniques and inputs used in estimating Level 2 and Level 3 fair value measurements. Except for the disclosures on the reconciliation of recurring Level 3 measurements, the other new disclosures and clarifications of existing disclosures were effective for us beginning with the first quarter of our 2010 fiscal year. The adoption of this standard did not have a material impact on our consolidated financial statements. See Note 10, “Fair Values of Debt Instruments, Investments and Derivative Instruments,” to our “Consolidated Financial Statements and Supplementary Data” included under Item 8 of this report for our fair value measurement disclosure. The information about the activity in Level 3 fair value measurements on a gross basis will be effective for us beginning with the first quarter of our 2011 fiscal year. We currently do not expect that the adoption of this portion of the standard will have a material impact on our consolidated financial statements.
An accounting standard update related to disclosures about the credit quality of financing receivables and the allowance for credit losses was issued. This update is intended to provide additional disclosures on a disaggregated basis about the nature of credit risk inherent in the company’s portfolio of financing receivables, how the risk is analyzed and assessed in arriving at the allowance for credit losses, and the changes and reasons for those changes in the allowance for credit losses. We adopted the additional disclosures required by this accounting standard update at the end of our 2010 fiscal year. See Note 1, “Business, Basis of Presentation, and Accounting Policies” to our “Consolidated Financial Statements and Supplementary Data” included under Item 8 of this report for the additional disclosures. The adoption of this standard did not have a material impact on our consolidated financial statements. The additional disclosures related to the activity during the reporting period will be effective for us beginning with the first quarter of our 2011 fiscal year. We do not expect that the adoption of this portion of the standard will have a material impact on our consolidated financial statements.
An accounting standard update related to the way companies test for impairment of goodwill was issued. Pursuant to this accounting update, goodwill of the reporting unit is not impaired if the carrying amount of a reporting unit is greater than zero and its fair value exceeds its carrying amount. Hence, the second step of the impairment test is not required. However, if the carrying amount of a reporting unit is zero or negative, the second step of the impairment test is required to be performed to measure the amount of impairment loss, if any, when it is more likely than not that goodwill impairment exists. In considering whether it is more likely than not that a goodwill impairment exists, a company must evaluate whether there are adverse qualitative factors. Consistent with before, this test must be performed annually or in the interim if an event occurs or circumstances exist that indicate that it is more likely than not that goodwill impairment exists. This standard is effective for us beginning in the first quarter of our 2011 fiscal year. We currently do not expect that the adoption of this standard will have a material impact on our consolidated financial statements.
Interest Rate Risk
We are exposed to changes in interest rates as a result of our borrowings under our 2007 Credit Facility. Based on the outstanding indebtedness of $625.0 million under our 2007 Credit Facility at December 31, 2010, if market rates used to calculate interest expense were to average 1% higher in the next twelve months, our net-of-tax interest expense would increase by approximately $3.7 million. As market rates are at historically low levels, the index rate used to calculate our interest expense cannot drop by the full 1% as our current variable index is 0.29%. We have taken market rate expectations, which are below 1%, into consideration and, as a result, would lower our net-of-tax interest expense by approximately $1.1 million. This analysis is computed taking into account the current outstanding balances of our 2007 Credit Facility, assumed interest rates and current scheduled debt payment. The result of this analysis would change if the underlying assumptions were modified.
Foreign Currency Risk
The majority of our transactions are in U.S. dollars; however, our foreign subsidiaries conduct businesses in various foreign currencies. Therefore, we are subject to currency exposures and volatility because of currency fluctuations. We attempt to minimize our exposure to foreign currency fluctuations by matching our revenues and expenses in the same currency for our contracts. From time to time, we purchase derivative financial instruments in the form of foreign currency exchange contracts to manage specific foreign currency exposures. Currently, we have several immaterial foreign currency contracts to cover the risks associated with our international operations. We had foreign currency translation gains, net of tax, of $8.8 million, foreign currency translation gains, net of tax, of $8.0 million, and foreign currency translation losses, net of tax, $28.0 million for the years ended December 31, 2010, January 1, 2010, and January 2, 2009, respectively.
REPORT OF INDEPENDENT REGISTERED PUBLIC ACCOUNTING FIRM
To the Board of Directors and Stockholders of URS Corporation:
In our opinion, the consolidated financial statements listed in the index appearing under Item 15(a)(1) present fairly, in all material respects, the financial position of URS Corporation and its subsidiaries (the "Company") at December 31, 2010 and January 1, 2010, and the results of their operations and their cash flows for each of the three years in the period ended December 31, 2010 in conformity with accounting principles generally accepted in the United States of America. Also in our opinion, the Company maintained, in all material respects, effective internal control over financial reporting as of December 31, 2010, based on criteria established in Internal Control - Integrated Framework issued by the Committee of Sponsoring Organizations of the Treadway Commission (COSO). The Company's management is responsible for these financial statements, for maintaining effective internal control over financial reporting and for its assessment of the effectiveness of internal control over financial reporting, included in Management's Annual Report on Internal Control over Financial Reporting appearing under Item 9A. Our responsibility is to express opinions on these financial statements and on the Company's internal control over financial reporting based on our integrated audits. We conducted our audits in accordance with the standards of the Public Company Accounting Oversight Board (United States). Those standards require that we plan and perform the audits to obtain reasonable assurance about whether the financial statements are free of material misstatement and whether effective internal control over financial reporting was maintained in all material respects. Our audits of the financial statements included examining, on a test basis, evidence supporting the amounts and disclosures in the financial statements, assessing the accounting principles used and significant estimates made by management, and evaluating the overall financial statement presentation. Our audit of internal control over financial reporting included obtaining an understanding of internal control over financial reporting, assessing the risk that a material weakness exists, and testing and evaluating the design and operating effectiveness of internal control based on the assessed risk. Our audits also included performing such other procedures as we considered necessary in the circumstances. We believe that our audits provide a reasonable basis for our opinions.
As discussed in Note 2 to the consolidated financial statements, the Company adopted a new accounting standard that required it to change the manner in which it accounts for variable interest entities in 2010.
A company’s internal control over financial reporting is a process designed to provide reasonable assurance regarding the reliability of financial reporting and the preparation of financial statements for external purposes in accordance with generally accepted accounting principles. A company’s internal control over financial reporting includes those policies and procedures that (i) pertain to the maintenance of records that, in reasonable detail, accurately and fairly reflect the transactions and dispositions of the assets of the company; (ii) provide reasonable assurance that transactions are recorded as necessary to permit preparation of financial statements in accordance with generally accepted accounting principles, and that receipts and expenditures of the company are being made only in accordance with authorizations of management and directors of the company; and (iii) provide reasonable assurance regarding prevention or timely detection of unauthorized acquisition, use, or disposition of the company’s assets that could have a material effect on the financial statements.
Because of its inherent limitations, internal control over financial reporting may not prevent or detect misstatements. Also, projections of any evaluation of effectiveness to future periods are subject to the risk that controls may become inadequate because of changes in conditions, or that the degree of compliance with the policies or procedures may deteriorate.
As described in Management's Annual Report on Internal Control over Financial Reporting, management has excluded Scott Wilson from its assessment of internal control over financial reporting as of December 31, 2010 because it was acquired by the Company in a purchase business combination during 2010. We have also excluded Scott Wilson from our audit of internal control over financial reporting. Scott Wilson is a wholly-owned subsidiary whose total assets and total revenues represent 7.9% and 1.6%, respectively, of the related consolidated financial statement amounts as of and for the year ended December 31, 2010.
/s/ PricewaterhouseCoopers LLP
San Francisco, California
URS CORPORATION AND SUBSIDIARIES
(In thousands, except per share data)
|
December 31, 2010
|
January 1, 2010
|
|||||||
|
ASSETS
|
||||||||
|
Current assets:
|
||||||||
|
Cash and cash equivalents
|
$ | 573,266 | $ | 720,621 | ||||
|
Short-term investments
|
450 | 30,682 | ||||||
|
Accounts receivable, including retentions of $70,718 and $41,771, respectively
|
1,102,762 | 924,271 | ||||||
|
Costs and accrued earnings in excess of billings on contracts
|
1,157,117 | 1,024,215 | ||||||
|
Less receivable allowances
|
(42,802 | ) | (47,651 | ) | ||||
|
Net accounts receivable
|
2,217,077 | 1,900,835 | ||||||
|
Deferred tax assets
|
83,270 | 98,198 | ||||||
|
Other current assets
|
134,963 | 130,484 | ||||||
|
Total current assets
|
3,009,026 | 2,880,820 | ||||||
|
Investments in and advances to unconsolidated joint ventures
|
65,509 | 93,874 | ||||||
|
Property and equipment at cost, net
|
266,136 | 258,950 | ||||||
|
Intangible assets, net
|
514,125 | 425,860 | ||||||
|
Goodwill
|
3,393,198 | 3,170,031 | ||||||
|
Other assets
|
103,361 | 74,881 | ||||||
|
Total assets
|
$ | 7,351,355 | $ | 6,904,416 | ||||
|
LIABILITIES AND EQUITY
|
||||||||
|
Current liabilities:
|
||||||||
|
Current portion of long-term debt
|
$ | 60,534 | $ | 115,261 | ||||
|
Accounts payable and subcontractors payable, including retentions of $46,548 and $51,475, respectively
|
673,854 | 586,783 | ||||||
|
Accrued salaries and employee benefits
|
420,559 | 435,456 | ||||||
|
Billings in excess of costs and accrued earnings on contracts
|
275,815 | 235,268 | ||||||
|
Other current liabilities
|
214,323 | 156,746 | ||||||
|
Total current liabilities
|
1,645,085 | 1,529,514 | ||||||
|
Long-term debt
|
641,283 | 689,725 | ||||||
|
Deferred tax liabilities
|
326,946 | 324,711 | ||||||
|
Self-insurance reserves
|
105,938 | 101,338 | ||||||
|
Pension and post-retirement benefit obligations
|
245,896 | 172,248 | ||||||
|
Other long-term liabilities
|
185,270 | 136,415 | ||||||
|
Total liabilities
|
3,150,418 | 2,953,951 | ||||||
|
Commitments and contingencies (Note 16)
|
||||||||
|
URS stockholders’ equity:
|
||||||||
|
Preferred stock, authorized 3,000 shares; no shares outstanding
|
— | — | ||||||
|
Common shares, par value $.01; authorized 200,000 shares; 86,907 and 86,071 shares issued, respectively; and 81,855 and 84,019 shares outstanding, respectively
|
869 | 860 | ||||||
|
Treasury stock, 5,052 and 2,052 shares at cost, respectively
|
(212,059 | ) | (83,810 | ) | ||||
|
Additional paid-in capital
|
2,924,345 | 2,884,941 | ||||||
|
Accumulated other comprehensive loss
|
(36,932 | ) | (49,239 | ) | ||||
|
Retained earnings
|
1,440,951 | 1,153,062 | ||||||
|
Total URS stockholders’ equity
|
4,117,174 | 3,905,814 | ||||||
|
Noncontrolling interests
|
83,763 | 44,651 | ||||||
|
Total stockholders’ equity
|
4,200,937 | 3,950,465 | ||||||
|
Total liabilities and stockholders’ equity
|
$ | 7,351,355 | $ | 6,904,416 | ||||
See Notes to Consolidated Financial Statements
URS CORPORATION AND SUBSIDIARIES
(In thousands, except per share data)
|
Year Ended
|
||||||||||||
|
December 31,
2010
|
January 1,
2010
|
January 2,
2009
|
||||||||||
|
Revenues
|
$ | 9,177,051 | $ | 9,249,088 | $ | 10,086,289 | ||||||
|
Cost of revenues
|
(8,609,492 | ) | (8,772,416 | ) | (9,608,779 | ) | ||||||
|
General and administrative expenses
|
(70,987 | ) | (75,826 | ) | (78,654 | ) | ||||||
|
Acquisition-related expenses (Note 7)
|
(11,900 | ) | — | — | ||||||||
|
Restructuring costs (Note 16)
|
(10,577 | ) | — | — | ||||||||
|
Impairment of an intangible asset (Note 8)
|
— | (32,825 | ) | — | ||||||||
|
Equity in income of unconsolidated joint ventures
|
70,262 | 100,933 | 106,277 | |||||||||
|
Operating income
|
544,357 | 468,954 | 505,133 | |||||||||
|
Interest expense
|
(30,548 | ) | (48,393 | ) | (90,763 | ) | ||||||
|
Other income, net (Note 5)
|
— | 47,914 | — | |||||||||
|
Income before income taxes
|
513,809 | 468,475 | 414,370 | |||||||||
|
Income tax expense
|
(154,884 | ) | (177,556 | ) | (172,813 | ) | ||||||
|
Net income including noncontrolling interests
|
358,925 | 290,919 | 241,557 | |||||||||
|
Noncontrolling interests in income of consolidated subsidiaries, net of tax
|
(71,036 | ) | (21,799 | ) | (21,766 | ) | ||||||
|
Net income attributable to URS
|
$ | 287,889 | $ | 269,120 | $ | 219,791 | ||||||
|
Earnings per share (Note 3):
|
||||||||||||
|
Basic
|
$ | 3.56 | $ | 3.31 | $ | 2.61 | ||||||
|
Diluted
|
$ | 3.54 | $ | 3.29 | $ | 2.59 | ||||||
|
Weighted-average shares outstanding (Note 3):
|
||||||||||||
|
Basic
|
80,951 | 81,401 | 81,878 | |||||||||
|
Diluted
|
81,291 | 81,842 | 82,376 | |||||||||
See Notes to Consolidated Financial Statements
URS CORPORATION AND SUBSIDIARIES
(In thousands)
|
Year Ended
|
||||||||||||
|
December 31,
2010
|
January 1,
2010
|
January 2,
2009
|
||||||||||
|
Comprehensive income (loss) (Note 17):
|
||||||||||||
|
Net income including noncontrolling interests
|
$ | 358,925 | $ | 290,919 | $ | 241,557 | ||||||
|
Pension and post-retirement related adjustments, net of tax
|
(690 | ) | (11,670 | ) | (37,460 | ) | ||||||
|
Foreign currency translation adjustments, net of tax
|
8,773 | 8,048 | (28,049 | ) | ||||||||
|
Foreign currency translation adjustment due to sale of investment in unconsolidated joint venture, net of tax
|
— | 5,115 | — | |||||||||
|
Unrealized loss on foreign currency forward contract, net of tax
|
— | (10,728 | ) | — | ||||||||
|
Reclassification of unrealized loss on foreign currency forward contract, net of tax
|
— | 10,728 | — | |||||||||
|
Unrealized gain (loss) on interest rate swaps, net of tax
|
4,224 | 5,134 | (6,992 | ) | ||||||||
|
Comprehensive income
|
371,232 | 297,546 | 169,056 | |||||||||
|
Noncontrolling interests in comprehensive income of consolidated subsidiaries, net of tax
|
(71,036 | ) | (21,799 | ) | (21,766 | ) | ||||||
|
Comprehensive income attributable to URS
|
$ | 300,196 | $ | 275,747 | $ | 147,290 | ||||||
See Notes to Consolidated Financial Statements
URS CORPORATION AND SUBSIDIARIES
(In thousands)
|
Common Stock
|
Treasury
Stock
|
Additional
Paid-in
Capital
|
Accumulated
Other
Comprehensive
Income (Loss)
|
Retained
Earnings
|
Total URS
Stockholders’
Equity
|
Noncontrolling
Interests
|
Total
Equity
|
|||||||||||||||||||||||||||||
|
Shares
|
Amount
|
|||||||||||||||||||||||||||||||||||
|
Balances, December 28, 2007
|
83,303 | $ | 833 | $ | (287 | ) | $ | 2,797,238 | $ | 16,635 | $ | 664,151 | $ | 3,478,570 | $ | 25,086 | $ | 3,503,656 | ||||||||||||||||||
|
Employee stock purchases and exercises of stock options
|
915 | 10 | — | 27,176 | — | — | 27,186 | — | 27,186 | |||||||||||||||||||||||||||
|
Stock repurchased in connection with exercises of stock options and vesting of restricted stock awards
|
(490 | ) | (5 | ) | — | (20,928 | ) | — | — | (20,933 | ) | — | (20,933 | ) | ||||||||||||||||||||||
|
Stock-based compensation
|
1,224 | 12 | — | 30,313 | — | — | 30,325 | — | 30,325 | |||||||||||||||||||||||||||
|
Excess tax benefits from stock-based compensation
|
— | — | — | 4,491 | — | — | 4,491 | — | 4,491 | |||||||||||||||||||||||||||
|
Foreign currency translation adjustments, net of tax
|
— | — | — | — | (28,049 | ) | — | (28,049 | ) | — | (28,049 | ) | ||||||||||||||||||||||||
|
Pension and post-retirement related adjustments, net of tax
|
— | — | — | — | (37,460 | ) | — | (37,460 | ) | — | (37,460 | ) | ||||||||||||||||||||||||
|
Interest rate swaps, net of tax
|
— | — | — | — | (6,992 | ) | — | (6,992 | ) | — | (6,992 | ) | ||||||||||||||||||||||||
|
Repurchases of common stock
|
(1,000 | ) | — | (42,298 | ) | — | — | — | (42,298 | ) | — | (42,298 | ) | |||||||||||||||||||||||
|
Distributions to noncontrolling interests, net of tax
|
— | — | — | — | — | — | — | (15,107 | ) | (15,107 | ) | |||||||||||||||||||||||||
|
Other transactions with noncontrolling interests
|
— | — | — | — | — | — | — | (620 | ) | (620 | ) | |||||||||||||||||||||||||
|
Net income including noncontrolling interests
|
— | — | — | — | — | 219,791 | 219,791 | 21,766 | 241,557 | |||||||||||||||||||||||||||
|
Balances, January 2, 2009
|
83,952 | $ | 850 | $ | (42,585 | ) | $ | 2,838,290 | $ | (55,866 | ) | $ | 883,942 | $ | 3,624,631 | $ | 31,125 | $ | 3,655,756 | |||||||||||||||||
See Notes to Consolidated Financial Statements
URS CORPORATION AND SUBSIDIARIES
CONSOLIDATED STATEMENTS OF CHANGES IN STOCKHOLDERS’ EQUITY (continued)
(In thousands)
|
Common Stock
|
Treasury
Stock
|
Additional
Paid-in
Capital
|
Accumulated
Other
Comprehensive
Income (Loss)
|
Retained
Earnings
|
Total URS
Stockholders’
Equity
|
Noncontrolling
Interests
|
Total
Equity
|
|||||||||||||||||||||||||||||
|
Shares
|
Amount
|
|||||||||||||||||||||||||||||||||||
|
Balances, January 2, 2009
|
83,952 | $ | 850 | $ | (42,585 | ) | $ | 2,838,290 | $ | (55,866 | ) | $ | 883,942 | $ | 3,624,631 | $ | 31,125 | $ | 3,655,756 | |||||||||||||||||
|
Employee stock purchases and exercises of stock options
|
477 | 5 | — | 15,719 | — | — | 15,724 | — | 15,724 | |||||||||||||||||||||||||||
|
Stock repurchased in connection with exercises of stock options and vesting of restricted stock awards
|
(279 | ) | (3 | ) | — | (11,801 | ) | — | — | (11,804 | ) | — | (11,804 | ) | ||||||||||||||||||||||
|
Stock-based compensation
|
869 | 8 | — | 41,201 | — | — | 41,209 | — | 41,209 | |||||||||||||||||||||||||||
|
Excess tax benefits from stock-based compensation
|
— | — | — | 1,532 | — | — | 1,532 | — | 1,532 | |||||||||||||||||||||||||||
|
Foreign currency translation adjustments, net of tax
|
— | — | — | — | 8,048 | — | 8,048 | — | 8,048 | |||||||||||||||||||||||||||
|
Foreign currency translation adjustment due to sale of investment in unconsolidated joint venture, net of tax
|
— | — | — | — | 5,115 | — | 5,115 | — | 5,115 | |||||||||||||||||||||||||||
|
Pension and post-retirement related adjustments, net of tax
|
— | — | — | — | (11,670 | ) | — | (11,670 | ) | — | (11,670 | ) | ||||||||||||||||||||||||
|
Interest rate swaps, net of tax
|
— | — | — | — | 5,134 | — | 5,134 | — | 5,134 | |||||||||||||||||||||||||||
|
Repurchases of common stock
|
(1,000 | ) | — | (41,225 | ) | — | — | — | (41,225 | ) | — | (41,225 | ) | |||||||||||||||||||||||
|
Unrealized loss on foreign currency forward contract, net of tax
|
— | — | — | — | (10,728 | ) | — | (10,728 | ) | — | (10,728 | ) | ||||||||||||||||||||||||
|
Reclassification of unrealized loss on foreign currency forward contract, net of tax
|
— | — | — | — | 10,728 | — | 10,728 | — | 10,728 | |||||||||||||||||||||||||||
|
Distributions to noncontrolling interests, net of tax
|
— | — | — | — | — | — | — | (26,760 | ) | (26,760 | ) | |||||||||||||||||||||||||
|
Contributions and advances from noncontrolling interests
|
— | — | — | — | — | — | — | 18,739 | 18,739 | |||||||||||||||||||||||||||
|
Other transactions with noncontrolling interests
|
— | — | — | — | — | — | — | (252 | ) | (252 | ) | |||||||||||||||||||||||||
|
Net income including noncontrolling interests
|
— | — | — | — | — | 269,120 | 269,120 | 21,799 | 290,919 | |||||||||||||||||||||||||||
|
Balances, January 1, 2010
|
84,019 | $ | 860 | $ | (83,810 | ) | $ | 2,884,941 | $ | (49,239 | ) | $ | 1,153,062 | $ | 3,905,814 | $ | 44,651 | $ | 3,950,465 | |||||||||||||||||
See Notes to Consolidated Financial Statements
URS CORPORATION AND SUBSIDIARIES
CONSOLIDATED STATEMENTS OF CHANGES IN STOCKHOLDERS’ EQUITY (continued)
(In thousands)
|
Common Stock
|
Treasury
Stock
|
Additional
Paid-in
Capital
|
Accumulated
Other
Comprehensive
Income (Loss)
|
Retained
Earnings
|
Total URS
Stockholders’
Equity
|
Noncontrolling
Interests
|
Total
Equity
|
|||||||||||||||||||||||||||||
|
Shares
|
Amount
|
|||||||||||||||||||||||||||||||||||
|
Balances, January 1, 2010
|
84,019 | $ | 860 | $ | (83,810 | ) | $ | 2,884,941 | $ | (49,239 | ) | $ | 1,153,062 | $ | 3,905,814 | $ | 44,651 | $ | 3,950,465 | |||||||||||||||||
|
Employee stock purchases and exercises of stock options
|
344 | 3 | — | 11,266 | — | — | 11,269 | — | 11,269 | |||||||||||||||||||||||||||
|
Stock repurchased in connection with exercises of stock options and vesting of restricted stock awards
|
(355 | ) | (4 | ) | — | (17,141 | ) | — | — | (17,145 | ) | — | (17,145 | ) | ||||||||||||||||||||||
|
Stock-based compensation
|
847 | 10 | — | 43,973 | — | — | 43,983 | — | 43,983 | |||||||||||||||||||||||||||
|
Excess tax benefits from stock-based compensation
|
— | — | — | 1,306 | — | — | 1,306 | — | 1,306 | |||||||||||||||||||||||||||
|
Foreign currency translation adjustments, net of tax
|
— | — | — | — | 8,773 | — | 8,773 | — | 8,773 | |||||||||||||||||||||||||||
|
Pension and post-retirement related adjustments, net of tax
|
— | — | — | — | (690 | ) | — | (690 | ) | — | (690 | ) | ||||||||||||||||||||||||
|
Interest rate swap, net of tax
|
— | — | — | — | 4,224 | — | 4,224 | — | 4,224 | |||||||||||||||||||||||||||
|
Repurchases of common stock
|
(3,000 | ) | — | (128,249 | ) | — | — | — | (128,249 | ) | — | (128,249 | ) | |||||||||||||||||||||||
|
Newly consolidated joint ventures
|
— | — | — | — | — | — | — | 40,978 | 40,978 | |||||||||||||||||||||||||||
|
Distributions to noncontrolling interests, net of tax
|
— | — | — | — | — | — | — | (79,942 | ) | (79,942 | ) | |||||||||||||||||||||||||
|
Contributions and advances from noncontrolling interests
|
— | — | — | — | — | — | — | 7,567 | 7,567 | |||||||||||||||||||||||||||
|
Other transactions with noncontrolling interests
|
— | — | — | — | — | — | — | (527 | ) | (527 | ) | |||||||||||||||||||||||||
|
Net income including noncontrolling interests
|
— | — | — | — | — | 287,889 | 287,889 | 71,036 | 358,925 | |||||||||||||||||||||||||||
|
Balances, December 31, 2010
|
81,855 | $ | 869 | $ | (212,059 | ) | $ | 2,924,345 | $ | (36,932 | ) | $ | 1,440,951 | $ | 4,117,174 | $ | 83,763 | $ | 4,200,937 | |||||||||||||||||
See Notes to Consolidated Financial Statements
URS CORPORATION AND SUBSIDIARIES
(In thousands)
|
Year Ended
|
||||||||||||
|
December 31,
2010
|
January 1,
2010
|
January 2,
2009
|
||||||||||
|
Cash flows from operating activities:
|
||||||||||||
|
Net income including noncontrolling interests
|
$ | 358,925 | $ | 290,919 | $ | 241,557 | ||||||
|
Adjustments to reconcile net income to net cash from operating activities:
|
||||||||||||
|
Depreciation
|
84,250 | 86,937 | 89,984 | |||||||||
|
Amortization of intangible assets
|
49,172 | 52,823 | 52,640 | |||||||||
|
Amortization of debt issuance costs
|
9,218 | 7,820 | 8,455 | |||||||||
|
Loss on settlement of foreign currency forward contract
|
— | 27,675 | — | |||||||||
|
Net gain on sale of investment in unconsolidated joint venture
|
— | (75,589 | ) | — | ||||||||
|
Impairment of an intangible asset
|
— | 32,825 | — | |||||||||
|
Restructuring costs
|
10,577 | — | — | |||||||||
|
Normal profit
|
1,188 | (10,969 | ) | (7,219 | ) | |||||||
|
Provision for doubtful accounts
|
6,727 | 5,781 | 5,046 | |||||||||
|
Deferred income taxes
|
10,876 | 107,646 | 107,601 | |||||||||
|
Stock-based compensation
|
43,983 | 41,209 | 30,325 | |||||||||
|
Excess tax benefits from stock-based compensation
|
(1,306 | ) | (1,532 | ) | (4,491 | ) | ||||||
|
Equity in income of unconsolidated joint ventures
|
(70,262 | ) | (100,933 | ) | (106,277 | ) | ||||||
|
Dividends received from unconsolidated joint ventures
|
92,537 | 85,555 | 96,141 | |||||||||
|
Changes in operating assets, liabilities and other, net of effects of consolidation and/or deconsolidation of joint ventures and acquisitions:
|
||||||||||||
|
Accounts receivable and costs and accrued earnings in excess of billings on contracts
|
(46,358 | ) | 214,199 | (100,366 | ) | |||||||
|
Other current assets
|
29,750 | 30,700 | (12,012 | ) | ||||||||
|
Advances to unconsolidated joint ventures
|
(1,644 | ) | 10,387 | (15,932 | ) | |||||||
|
Accounts payable, accrued salaries and employee benefits, and other current liabilities
|
(40,332 | ) | (144,503 | ) | (80,650 | ) | ||||||
|
Billings in excess of costs and accrued earnings on contracts
|
(30,208 | ) | (11,966 | ) | 17,625 | |||||||
|
Other long-term liabilities
|
22,482 | (6,589 | ) | 37,278 | ||||||||
|
Other assets, net
|
(2,071 | ) | 9,210 | 14,518 | ||||||||
|
Total adjustments and changes
|
168,579 | 360,686 | 132,666 | |||||||||
|
Net cash from operating activities
|
527,504 | 651,605 | 374,223 | |||||||||
|
Cash flows from investing activities:
|
||||||||||||
|
Payments for business acquisitions, net of cash acquired
|
(291,667 | ) | (14,228 | ) | (26,383 | ) | ||||||
|
Changes in cash related to consolidation and/or deconsolidation of joint ventures
|
20,696 | — | — | |||||||||
|
Proceeds from disposal of property and equipment
|
8,247 | 54,473 | 17,442 | |||||||||
|
Proceeds from sale of investment in unconsolidated joint venture, net of related selling costs
|
— | 282,584 | — | |||||||||
|
Payment in settlement of foreign currency forward contract
|
— | (273,773 | ) | — | ||||||||
|
Receipt in settlement of foreign currency forward contract
|
— | 246,098 | — | |||||||||
|
Investments in unconsolidated joint ventures
|
(6,052 | ) | (16,301 | ) | (34,299 | ) | ||||||
|
Changes in restricted cash
|
(16,062 | ) | (1,551 | ) | 1,611 | |||||||
|
Capital expenditures, less equipment purchased through capital leases and equipment notes
|
(45,168 | ) | (41,569 | ) | (91,658 | ) | ||||||
|
Purchases of short-term investments
|
— | (195,682 | ) | — | ||||||||
|
Maturities of short-term investments
|
30,232 | 165,000 | — | |||||||||
|
Net cash from investing activities
|
(299,774 | ) | 205,051 | (133,287 | ) | |||||||
See Notes to Consolidated Financial Statements
URS CORPORATION AND SUBSIDIARIES
CONSOLIDATED STATEMENTS OF CASH FLOWS (continued)
(In thousands)
|
Year Ended
|
||||||||||||
|
December 31,
2010
|
January 1,
2010
|
January 2,
2009
|
||||||||||
|
Cash flows from financing activities:
|
||||||||||||
|
Payments on long-term debt
|
(159,588 | ) | (310,519 | ) | (209,286 | ) | ||||||
|
Net payments under lines of credit and short-term notes
|
(7,607 | ) | (597 | ) | (261 | ) | ||||||
|
Net change in overdrafts
|
14,400 | 4,376 | (15,200 | ) | ||||||||
|
Payments on capital lease obligations
|
(7,497 | ) | (6,415 | ) | (7,713 | ) | ||||||
|
Excess tax benefits from stock-based compensation
|
1,306 | 1,532 | 4,491 | |||||||||
|
Proceeds from employee stock purchases and exercises of stock options
|
11,269 | 15,654 | 27,186 | |||||||||
|
Distributions to noncontrolling interests
|
(107,239 | ) | (41,414 | ) | (30,997 | ) | ||||||
|
Contributions and advances from noncontrolling interests
|
8,120 | 18,575 | 638 | |||||||||
|
Repurchases of common stock
|
(128,249 | ) | (41,225 | ) | (42,298 | ) | ||||||
|
Net cash from financing activities
|
(375,085 | ) | (360,033 | ) | (273,440 | ) | ||||||
|
Net increase (decrease) in cash and cash equivalents
|
(147,355 | ) | 496,623 | (32,504 | ) | |||||||
|
Cash and cash equivalents at beginning of period
|
720,621 | 223,998 | 256,502 | |||||||||
|
Cash and cash equivalents at end of period
|
$ | 573,266 | $ | 720,621 | $ | 223,998 | ||||||
|
Supplemental information:
|
||||||||||||
|
Interest paid
|
$ | 23,971 | $ | 40,316 | $ | 81,588 | ||||||
|
Taxes paid
|
$ | 79,315 | $ | 58,850 | $ | 58,716 | ||||||
|
Taxes refunded
|
$ | — | $ | 31,244 | $ | — | ||||||
|
Supplemental schedule of noncash investing and financing activities:
|
||||||||||||
|
Loan Notes issued and estimated consideration for vested shares exercisable in connection with an acquisition
|
$ | 30,903 | $ | — | $ | — | ||||||
|
Equipment acquired with capital lease obligations and equipment note obligations
|
$ | 12,914 | $ | 8,640 | $ | 12,429 | ||||||
See Notes to Consolidated Financial Statements
Business
The terms “we,” “us,” and “our” used in these financial statements refer to URS Corporation and its consolidated subsidiaries unless otherwise indicated. We are a leading international provider of engineering, construction and technical services. We offer a broad range of program management, planning, design, engineering, construction and construction management, operations and maintenance, and decommissioning and closure services to public agencies and private sector clients around the world. We also are a major United States (“U.S.”) federal government contractor in the areas of systems engineering and technical assistance, and operations and maintenance. Headquartered in San Francisco, we have approximately 47,000 employees in a global network of offices and contract-specific job sites in more than 40 countries. We operate through three reporting segments: the Infrastructure & Environment business, the Federal Services business and the Energy & Construction business.
Our fiscal year is the 52/53-week period ending on the Friday closest to December 31. Our fiscal year ended January 2, 2009 contained 53 weeks.
Principles of Consolidation and Basis of Presentation
Our consolidated financial statements include the financial position, results of operations and cash flows of URS Corporation and our majority-owned subsidiaries and joint ventures required to be consolidated.
On September 10, 2010, we completed the acquisition of Scott Wilson Group plc. (“Scott Wilson”). The operating results of Scott Wilson from the acquisition date through December 31, 2010 are included in our consolidated financial statements under the Infrastructure & Environment business. See Note 7, “Acquisition,” for more information regarding this acquisition.
Investments in unconsolidated joint ventures are accounted for using the equity method and are included as investments in and advances to unconsolidated joint ventures on our Consolidated Balance Sheets. All significant intercompany transactions and accounts have been eliminated in consolidation.
Use of Estimates
The preparation of our consolidated financial statements in conformity with generally accepted accounting principles requires us to make estimates and assumptions that affect the reported amount of assets and liabilities and related disclosures at the balance sheet dates, and the reported amounts of revenues and expenses during the reporting period. Actual results could differ from those estimates. On an ongoing basis, we review our estimates based on information that is currently available. Changes in facts and circumstances may cause us to revise our estimates.
Consolidation of Variable Interest Entities
We participate in joint ventures, which include partnerships and partially-owned limited liability companies, to bid, negotiate and complete specific projects. We are required to consolidate these joint ventures if we hold the majority voting interest or if we meet the criteria under the variable interest model as described below.
A variable interest entity (“VIE”) is an entity with one or more of the following characteristics (a) the total equity investment at risk is not sufficient to permit the entity to finance its activities without additional financial support; (b) as a group, the holders of the equity investment at risk lack the ability to make certain decisions, the obligation to absorb expected losses or the right to receive expected residual returns, or (c) an equity investor has voting rights that are disproportionate to its economic interest and substantially all of the entity’s activities are on behalf of the investor.
93
URS CORPORATION AND SUBSIDIARIES
NOTES TO CONSOLIDATED FINANCIAL STATEMENTS (Continued)
Our VIEs may be funded through contributions, loans and/or advances from the joint venture partners or by advances and/or letters of credit provided by our clients. Our VIEs may be directly governed, managed, operated and administered by the joint venture partners. Others have no employees and, although these entities own and hold the contracts with the clients, the services required by the contracts are typically performed by the joint venture partners or by other subcontractors.
If we are determined to be the primary beneficiary of the VIE, we are required to consolidate it. We are considered to be the primary beneficiary if we have the power to direct the activities that most significantly impact the VIE’s economic performance and the obligation to absorb losses or the right to receive benefits of the VIE that could potentially be significant to the VIE. In determining whether we are the primary beneficiary, we take into consideration the following:
|
·
|
Identifying the significant activities and the parties that have the power to direct them;
|
|
·
|
Reviewing the governing board composition and participation ratio;
|
|
·
|
Determining the equity, profit and loss ratio;
|
|
·
|
Determining the management-sharing ratio;
|
|
·
|
Reviewing employment terms, including which joint venture partner provides the project manager; and
|
|
·
|
Reviewing the funding and operating agreements.
|
Examples of significant activities include the following:
|
·
|
Engineering services;
|
|
·
|
Procurement services;
|
|
·
|
Construction;
|
|
·
|
Construction management; and
|
|
·
|
Operations and maintenance services.
|
Based on the above, if we determine that the power to direct the significant activities is shared by two or more joint venture parties, then there is no primary beneficiary and no party consolidates the VIE. In making the shared-power determination, we analyze the key contractual terms, governance, related party and de facto agency as they are defined in the accounting standard, and other arrangements to determine if the shared power exists.
As required by the accounting standard, we perform a quarterly re-assessment to determine whether we are the primary beneficiary. This evaluation may result in consolidation of a previously unconsolidated joint venture or in deconsolidation of a previously consolidated joint venture. See Note 5, “Joint Ventures,” for further information on our VIEs.
Revenue Recognition
We recognize revenues from engineering, construction and construction-related contracts using the percentage-of-completion method as project progress occurs. Service-related contracts, including operations and maintenance services and a variety of technical assistance services, are accounted for using the proportionate performance method as project progress occurs.
94
URS CORPORATION AND SUBSIDIARIES
NOTES TO CONSOLIDATED FINANCIAL STATEMENTS (Continued)
Percentage of Completion. Under the percentage-of-completion method, revenue is recognized as contract performance progresses. We estimate the progress towards completion to determine the amount of revenue and profit to recognize. We generally utilize a cost-to-cost approach in applying the percentage-of-completion method, where revenue is earned in proportion to total costs incurred, divided by total costs expected to be incurred. Costs are generally determined from actual hours of labor effort expended at per-hour labor rates calculated using a labor dollar multiplier that includes direct labor costs and allocable overhead costs. Direct non-labor costs are charged as incurred plus any mark-up permitted under the contract.
Under the percentage-of-completion method, recognition of profit is dependent upon the accuracy of a variety of estimates, including engineering progress, materials quantities, and achievement of milestones, incentives, penalty provisions, labor productivity, cost estimates and others. Such estimates are based on various professional judgments we make with respect to those factors and are subject to change as the project proceeds and new information becomes available.
Proportional Performance. Our service contracts, primarily performed by our Federal Services business, are accounted for using the proportional performance method, under which revenue is recognized in proportion to the number of service activities performed, in proportion to the direct costs of performing the service activities, or evenly across the period of performance depending upon the nature of the services provided.
Revenues from all contracts may vary based on the actual number of labor hours worked and other actual contract costs incurred. If actual labor hours and other contract costs exceed the original estimate agreed to by our client, we generally obtain a change order, contract modification or successfully prevail in a claim in order to receive and recognize additional revenues relating to the additional costs (see “Change Orders and Claims” below).
If estimated total costs on any contract indicate a loss, we charge the entire estimated loss to operations in the period the loss becomes known. The cumulative effect of revisions to revenue, estimated costs to complete contracts, including penalties, incentive awards, change orders, claims, anticipated losses, and others are recorded in the accounting period in which the events indicating a loss or change in estimates are known and the loss can be reasonably estimated. Such revisions could occur at any time and the effects may be material.
We have a history of making reasonably dependable estimates of the extent of progress towards completion, contract revenue and contract completion costs on our long-term engineering and construction contracts. However, due to uncertainties inherent in the estimation process, it is possible that actual completion costs may vary from estimates.
Change Orders and Claims. Change orders and/or claims occur when changes are experienced once contract performance is underway, and may arise under any of the contract types described below.
Change orders are modifications of an original contract that effectively change the existing provisions of the contract without adding new scope or terms. Change orders may include changes in specifications or designs, manner of performance, facilities, equipment, materials, sites and period of completion of the work. Either we or our clients may initiate change orders. Client agreement as to the terms of change orders is, in many cases, reached prior to work commencing; however, sometimes circumstances require that work progress without obtaining client agreement. Costs related to change orders are recognized as incurred. Revenues attributable to change orders that are unapproved as to price or scope are recognized to the extent that costs have been incurred if the amounts can be reliably estimated and their realization is probable. Revenues in excess of the costs attributable to change orders that are unapproved as to price or scope are recognized only when realization is assured beyond a reasonable doubt. Change orders that are unapproved as to both price and scope are evaluated as claims.
95
URS CORPORATION AND SUBSIDIARIES
NOTES TO CONSOLIDATED FINANCIAL STATEMENTS (Continued)
Claims are amounts in excess of agreed contract prices that we seek to collect from our clients or others for customer-caused delays, errors in specifications and designs, contract terminations, change orders that are either in dispute or are unapproved as to either scope or price, or other causes of unanticipated additional contract costs. Claims are included in total estimated contract revenues when the contract or other evidence provides a legal basis for the claim, when the additional costs are caused by circumstances that were unforeseen at the contract date and are not the result of the deficiencies in the contract performance, when the costs associated with the claim are identifiable, and when the evidence supporting the claim is objective and verifiable. Revenue on claims is recognized only to the extent that contract costs related to the claims have been incurred and when it is probable that the claim will result in a bona fide addition to contract value which can be reliably estimated. No profit is recognized on claims until final settlement occurs. As a result, costs may be recognized in one period while revenues may be recognized when client agreement is obtained or claims resolution occurs, which can be in subsequent periods.
“At-risk” and “Agency” Contracts. The amount of revenues we recognize also depends on whether the contract or project represents an at-risk or an agency relationship between the client and us. Determination of the relationship is based on characteristics of the contract or the relationship with the client. For at-risk relationships where we act as the principal to the transaction, the revenue and the costs of materials, services, payroll, benefits, and other costs are recognized at gross amounts. For agency relationships, where we act as an agent for our client, only the fee revenue is recognized, meaning that direct project costs and the related reimbursement from the client are netted. Revenues from agency contracts and collaborative arrangements were not a material part of revenues for any period presented.
In classifying contracts or projects as either at-risk or agency, we consider the following primary characteristics to be indicative of at-risk relationships: (i) we acquire the related goods and services using our procurement resources, (ii) we assume the risk of loss under the contract and (iii) we are responsible for insurance coverage, employee-related liabilities and the performance of subcontractors.
We consider the following primary characteristics to be indicative of agency relationships: (i) our client owns the work facilities utilized under the contract, (ii) we act as a procurement agent for goods and services acquired with client funds, (iii) our client is invoiced for our fees, (iv) our client is exposed to the risk of loss and maintains insurance coverage, and (v) our client is responsible for employee-related benefit plan liabilities and any remaining liabilities at the end of the contract.
Contract Types
Our contract types include cost-plus, target-price, fixed-price, and time-and-materials contracts. Revenue recognition is determined based on the nature of the service provided, irrespective of the contract type, with engineering, construction and construction-related contracts accounted for under the percentage-of-completion method and service-related contracts accounted for under the proportional performance method.
Cost-Plus Contracts. We enter into four major types of cost-plus contracts. Revenue for the majority of our cost-plus contracts is recognized using the percentage-of-completion method:
Cost-Plus Fixed Fee. Under cost-plus fixed fee contracts, we charge our clients for our costs, including both direct and indirect costs, plus a fixed negotiated fee.
Cost-Plus Fixed Rate. Under our cost-plus fixed rate contracts, we charge clients for our direct costs plus negotiated rates based on our indirect costs.
96
URS CORPORATION AND SUBSIDIARIES
NOTES TO CONSOLIDATED FINANCIAL STATEMENTS (Continued)
Cost-Plus Award Fee. Some cost-plus contracts provide for award fees or penalties based on performance criteria in lieu of a fixed fee or fixed rate. Other contracts include a base fee component plus a performance-based award fee. In addition, we may share award fees with subcontractors and/or our employees. We accrue fee sharing as related award fee revenue is earned. We take into consideration the award fee or penalty on contracts when estimating revenues and profit rates, and we record revenues related to the award fees when there is sufficient information to assess anticipated contract performance. On contracts that represent higher than normal risk or technical difficulty, we defer all award fees until an award fee letter is received. Once an award fee letter is received, the estimated or accrued fees are adjusted to the actual award amount.
Cost-Plus Incentive Fee. Some of our cost-plus contracts provide for incentive fees based on performance against contractual milestones. The amount of the incentive fees varies, depending on whether we achieve above-, at- or below-target results. We recognize incentive fees revenues as milestones are achieved, assuming that we will achieve at-target results, unless our estimates indicate our cost at completion to be significantly above or below target.
Target-Price Contracts. Under our target-price contracts, project costs are reimbursable. Our fee is established against a target budget that is subject to changes in project circumstances and scope. Should the project costs exceed the target budget within the agreed-upon scope, we generally degrade a portion of our fee or profit to mitigate the excess cost; however, the customer reimburses us for the costs that we incur if costs continue to escalate beyond our expected fee. If the project costs are less than the target budget, we generally recover a portion of the project cost savings as additional fee or profit. We recognize revenues on target-price contracts using the percentage-of-completion method.
Fixed-Price Contracts. We enter into two major types of fixed-price contracts:
Firm Fixed-Price (“FFP”). Under FFP contracts, our clients pay us an agreed fixed-amount negotiated in advance for a specified scope of work. We generally recognize revenues on FFP contracts using the percentage-of-completion method. If the nature or circumstances of the contract prevent us from preparing a reliable estimate at completion, we will delay profit recognition until adequate information about the contract’s progress becomes available. Prior to completion, our recognized profit margins on any FFP contract depend on the accuracy of our estimates and will increase to the extent that our current estimates of aggregate actual costs are below amounts previously estimated. Conversely, if our current estimated costs exceed prior estimates, our profit margins will decrease and we may realize a loss on a project.
Fixed-Price Per Unit (“FPPU”). Under our FPPU contracts, clients pay us a set fee for each service or production transaction that we complete. We recognize revenues under FPPU contracts as we complete the related service or production transactions for our clients generally using the proportional performance method. Some of our FPPU contracts are subject to maximum contract values.
Time-and-Materials Contracts. Under our time-and-materials contracts, we negotiate hourly billing rates and charge our clients based on the actual time that we spend on a project. In addition, clients reimburse us for our actual out-of-pocket costs of materials and other direct incidental expenditures that we incur in connection with our performance under the contract. The majority of our time-and-material contracts are subject to maximum contract values and, accordingly, revenues under these contracts are generally recognized under the percentage-of-completion method. However, time and materials contracts that are service-related contracts are accounted for utilizing the proportional performance method. Revenues on contracts that are not subject to maximum contract values are recognized based on the actual number of hours we spend on the projects plus any actual out-of-pocket costs of materials and other direct incidental expenditures that we incur on the projects. Our time-and materials contracts also generally include annual billing rate adjustment provisions.
97
URS CORPORATION AND SUBSIDIARIES
NOTES TO CONSOLIDATED FINANCIAL STATEMENTS (Continued)
Segmenting and Combining Contracts
Occasionally a contract may include several elements or phases, each of which was negotiated separately with our client and agreed to be performed without regard to the performance of others. We follow the criteria set forth in the accounting guidance when combining and segmenting contracts. When combining contracts, revenues and profits are earned and reported uniformly over the performance of the combined contracts. When segmenting contracts, we assign revenues and costs to the different elements or phases to achieve different rates of profitability based on the relative value of each element or phase to the estimated contract revenues. Values assigned to the segments are based on our normal historical prices and terms of such services to other clients. Also, a group of contracts may be so closely related that they are, in effect, part of a single project with an overall profit margin.
Accounts Receivable and Costs and Accrued Earnings in Excess of Billings on Contracts
Accounts receivable in the accompanying Consolidated Balance Sheets are primarily comprised of amounts billed to clients for services already provided, but which have not yet been collected. Occasionally, under the terms of specific contracts, we are permitted to submit invoices in advance of providing our services to our clients and, to the extent they have not been collected, these amounts are also included in accounts receivable.
Costs and accrued earnings in excess of billings on contracts in the accompanying Consolidated Balance Sheets represent unbilled amounts earned and reimbursable under contracts. These amounts become billable according to the contract terms, which usually consider the passage of time, achievement of milestones or completion of the project. Generally, such unbilled amounts will be billed and collected over the next twelve months.
Accounts receivable and costs and accrued earnings in excess of billings on contracts include certain amounts recognized related to unapproved change orders (amounts representing the value of proposed contract modifications, but which are unapproved as to both price and scope) and claims, (amounts in excess of agreed contract prices that we seek to collect from our clients or others) that have not been collected and, in the case of balances included in accrued earnings in excess of billings on contracts, may not be billable until an agreement or, in the case of claims, a settlement is reached. Most of those balances are not material and are typically resolved in the ordinary course of business. At December 31, 2010, significant unapproved change orders and claims collectively represented approximately 2% of our accounts receivable and accrued earnings in excess of billings on contracts.
Our accounts receivable include retentions associated with long-term contracts, which are generally not billable until near or at the completion of the projects or milestones and/or delivery of services. As such, these amounts will generally be billed for contracts with terms in excess of one year from the service date. Our costs and accrued earnings in excess of billings on contracts include amounts related to milestone payment clauses, which provide for payments to be received beyond a year from the date service occurs. Based on our historical experience, we generally consider the collection risk related to these amounts to be low. When events or conditions indicate that the amounts outstanding may become uncollectible, an allowance is estimated and recorded. As of December 31, 2010 and January 1, 2010, we had receivables with contractual terms in excess of one year of $146.8 million and $107.4 million, respectively.
Billings in Excess of Costs and Accrued Earnings on Contracts
Billings in excess of costs and accrued earnings on contracts in the accompanying Consolidated Balance Sheets is comprised of cash collected from clients and billings to clients on contracts in advance of work performed, advance payments negotiated as a contract condition, estimated losses on uncompleted contracts, normal profit liabilities, project-related legal liabilities; and other project-related reserves. The majority of the unearned project-related costs will be earned over the next twelve months.
98
URS CORPORATION AND SUBSIDIARIES
NOTES TO CONSOLIDATED FINANCIAL STATEMENTS (Continued)
We record provisions for estimated losses on uncompleted contracts in the period in which such losses become known. The cumulative effects of revisions to contract revenues and estimated completion costs are recorded in the accounting period in which the amounts become evident and can be reasonably estimated. These revisions can include such items as the effects of change orders and claims, warranty claims, liquidated damages or other contractual penalties, adjustments for audit findings on U.S. or other government contracts and contract closeout settlements.
Receivable Allowances
We reduce our accounts receivable and costs and accrued earnings in excess of billings on contracts by estimating an allowance for amounts that may become uncollectible or unrealizable in the future. We determine our estimated allowance for uncollectible amounts based on management’s judgments regarding our operating performance related to the adequacy of the services performed or products delivered, the status of change orders and claims, our experience settling change orders and claims and the financial condition of our clients, which may be dependent on the type of client and current economic conditions to which the client may be subject.
Classification of Current Assets and Liabilities
We include in current assets and liabilities amounts realizable and payable under engineering and construction contracts that extend beyond one year. Accounts receivable, accounts receivable – retentions, costs and accrued earnings in excess of billings on contracts, subcontractors payable, subcontractor retentions, and billings in excess of costs and accrued earnings on contracts each contain amounts that, depending on contract performance, resolution of U.S. government contract audits, negotiations, change orders, claims or changes in facts and circumstances, may either be uncollected or may not require payment within one year.
Accounts receivable – retentions represent amounts billed to clients for services performed that, by the underlying contract terms, will not be paid until the projects meet contractual milestones, or are at or near completion. Correspondingly, subcontractors payable – retentions represent amounts billed to us by subcontractors for services performed that, by their underlying contract terms, do not require payment by us until the projects are at or near completion.
Accounts payable and subcontractors payable include our estimate of incurred but unbilled subcontractor costs.
Concentrations of Credit Risk
Our accounts receivable and costs and accrued earnings in excess of billings on contracts are potentially subject to concentrations of credit risk. Our credit risk on accounts receivable is limited due to the large number of contracts for clients that comprise our customer base and their dispersion across different business and geographic areas. We estimate and maintain an allowance for potential uncollectible accounts, and such estimates have historically been within management’s expectations. See Note 4, “Accounts Receivable and Costs and Accrued Earnings in Excess of Billings on Contracts” for more details. Our cash and cash equivalents and short-term investments are maintained in accounts held by major banks and financial institutions located primarily in North America, Europe and Asia Pacific.
Cash and Cash Equivalents
Cash and cash equivalents include all highly liquid investments with maturities of 90 days or less at the date of purchase and include interest-bearing bank deposits and money market funds. At December 31, 2010 and January 1, 2010, restricted cash were $28.0 million and $11.9 million, respectively. These amounts were included in “Other current assets” on our Consolidated Balance Sheets. For cash held by our consolidated joint ventures, see Note 5, “Joint Ventures.”
99
URS CORPORATION AND SUBSIDIARIES
NOTES TO CONSOLIDATED FINANCIAL STATEMENTS (Continued)
Investments
At December 31, 2010 and January 1, 2010, our short-term investments consisted of highly liquid investments, including interest-bearing time deposits, with maturities of more than 90 days, but less than a year, at the date of purchase. The carrying values of our short-term investments approximate their fair values.
Derivative Instruments
We are exposed to the risk of changes in interest rates on our long-term debt. Sometimes, we manage this risk through the use of derivative instruments. All derivative financial instruments are recorded on the balance sheet at fair value. At dates entered into, the derivatives hedge the variability in cash flows received or paid in connection with a recorded asset or liability.
Changes in the fair value of cash flow hedges are recorded in other comprehensive income until earnings are affected by the variability of cash flows of the hedged transactions. We would discontinue hedge accounting prospectively when the derivatives are no longer effective in offsetting changes in cash flows of the hedged items, the derivatives are sold or terminated or it is no longer probable that the forecasted transactions will occur. Cash flows resulting from derivatives that are accounted for as hedges may be classified in the same category as the cash flows from the items being hedged.
Derivative instruments are used only for risk management purposes and not for speculation or trading. The amount, maturity, and other specifics of the hedge are determined by the specific debt derivative instrument. If a derivative contract is entered into, we either determine that it is an economic hedge or we designate the derivative as a cash flow or fair value hedge. We formally document all relationships between hedging instruments and the hedged items, as well as our risk management objectives and strategies for undertaking various hedged transactions. For those derivatives designated as cash flow or fair value hedges, we formally assess, both at the derivatives’ inception and on an ongoing basis, whether the derivatives that are used in hedging transactions are highly effective in offsetting changes in the hedged items. The ineffective portion of hedging transactions is recognized in current income.
Fair Value Measurement
We determine the fair values of our financial instruments, including short-term investments, debt instruments and derivative instruments, and pension and post-retirement plan assets based on inputs or assumptions that market participants would use in pricing an asset or a liability. We categorize our instruments using a valuation hierarchy for disclosure of the inputs used to measure fair value. This hierarchy prioritizes the inputs into three broad levels as follows: Level 1 inputs are quoted prices (unadjusted) in active markets for identical assets or liabilities; Level 2 inputs are quoted prices for similar assets and liabilities in active markets or inputs that are observable for the asset or liability, either directly or indirectly through market corroboration, for substantially the full term of the financial instrument; Level 3 inputs are unobservable inputs based on our own assumptions used to measure assets and liabilities at fair value. The classification of a financial asset or liability within the hierarchy is determined based on the lowest level input that is significant to the fair value measurement.
The recorded values of cash and cash equivalents, accounts receivable, and accounts payable approximate fair values based on their short-term nature. Our long-term debt is predominately floating-rate. See Note 10, “Fair Value of Debt Instruments, Investments and Derivative Instruments,” for additional disclosure.
Our fair value measurement methods may produce a fair value calculation that may not be indicative of net realizable value or reflective of future fair values. Although we believe our valuation methods are appropriate and consistent with those used by other market participants, the use of different methodologies or assumptions to determine fair value could result in a different fair value measurement at the reporting date.
100
URS CORPORATION AND SUBSIDIARIES
NOTES TO CONSOLIDATED FINANCIAL STATEMENTS (Continued)
Property and Equipment
Property and equipment are stated at cost. In the year assets are retired or otherwise disposed of, the costs and related accumulated depreciation are removed from the accounts and any gain or loss on disposal is reflected in the Consolidated Statement of Operations. Depreciation is provided on the straight-line and the declining methods using estimated useful lives less residual value. Leasehold improvements are amortized over the length of the lease or estimated useful life, whichever is less. We capitalize our repairs and maintenance that extend the estimated useful lives of property and equipment; otherwise, repairs and maintenance are expensed. Whenever events or changes in circumstances indicate that the carrying amount of long-lived assets may not be recoverable, we compare the carrying value to the fair value, which is measured using the prices in active markets for similar assets, and recognize the difference as an impairment loss.
Internal-Use Computer Software
We expense or capitalize costs associated with the development of internal-use software as follows:
Preliminary project stage: Both internal and external costs incurred during this stage are expensed as incurred.
Application development stage: Both internal and external costs incurred to purchase and develop computer software are capitalized after the preliminary project stage is completed and management authorizes the computer software project. However, training costs and the process of data conversion from the old system to the new system, which includes purging or cleansing of existing data, reconciliation or balancing of old data to the converted data in the new system, are expensed as incurred.
Post-Implementation/Operation Stage: All training costs and maintenance costs incurred during this stage are expensed as incurred.
Costs of upgrades and enhancements are capitalized if the expenditures will result in adding functionality to the software. Capitalized software costs are depreciated using the straight-line method over the estimated useful life of the related software, which may be up to ten years.
Goodwill and Intangible Assets
We amortize our intangible assets using the straight-line method over their contractual or economic lives. We assess our intangible assets for impairment whenever events or changes in circumstances indicate that the carrying value of an intangible asset may not be recoverable. Examples of such events are i) significant adverse changes in its market value, useful life, physical condition, or in the business climate that could affect its value; ii) a current-period operating or cash flow losses or a projection or forecast that demonstrates continuing losses associated with the use of the intangible asset; or iii) a current expectation that, more likely than not, the intangible asset will be sold or otherwise disposed of before the end of its previously estimated useful life.
Goodwill represents the excess of the cost of an acquired entity over the net of the amounts assigned to assets acquired and liabilities assumed. We assess our goodwill for impairment at least annually as of the end of the first month following our September reporting period or whenever events or changes in circumstances indicate that the carrying value of the asset may not be recoverable.
We believe the methodology that we use to review impairment of goodwill, which includes a significant amount of judgment and estimates, provides us with a reasonable basis to determine whether impairment has occurred. However, many of the factors employed in determining whether our goodwill is impaired are outside of our control and it is reasonably likely that assumptions and estimates will change in future periods. These changes could result in future impairments.
101
URS CORPORATION AND SUBSIDIARIES
NOTES TO CONSOLIDATED FINANCIAL STATEMENTS (Continued)
Goodwill impairment reviews involve a two-step process. The first step is a comparison of each reporting unit’s fair value to its carrying value. We estimate fair value using market information and discounted cash flow analyses, referred to as the income approach. The income approach uses a reporting unit’s projection of estimated operating results and discounts those back to the present using a weighted-average cost of capital that reflects current market conditions. To arrive at our cash flow projections, we use estimates of economic and market information over a projection period of ten years, including growth rates in revenues, costs, estimates of future expected changes in operating margins and cash expenditures. Other significant estimates and assumptions include terminal value growth rates, future estimates of capital expenditures and changes in future working capital requirements.
We validate our estimate of fair value of each reporting unit under the income approach by comparing the resulting values to fair value estimates using a market approach. A market approach estimates fair value by applying cash flow multiples to the reporting unit's operating performance. The multiples are derived from comparable publicly traded companies with operating and investment characteristics similar to those of the reporting units. When performing our annual impairment analysis, we also reconcile the total of the fair values of our reporting units with our market capitalization to determine if the sum of the individual fair values is reasonable compared to the external market indicators. If our reconciliation indicates a significant difference between our external market capitalization and the fair values of our reporting units, we review and adjust, if appropriate, our weighted-average cost of capital and consider if the implied control premium is reasonable in light of current market conditions.
If the carrying value of the reporting unit is higher than its fair value, there is an indication that impairment may exist and the second step must be performed to measure the amount of impairment. The amount of impairment is determined by comparing the implied fair value of the reporting unit’s goodwill to the carrying value of the goodwill calculated in the same manner as if the reporting unit were being acquired in a business combination. If the implied fair value of goodwill is less than the recorded goodwill, we would record an impairment charge for the difference.
There are several instances that may cause us to further test our goodwill for impairment between the annual testing periods including: (i) continued deterioration of market and economic conditions that may adversely impact our ability to meet our projected results; (ii) declines in our stock price caused by continued volatility in the financial markets that may result in increases in our weighted-average cost of capital or other inputs to our goodwill assessment; and (iii) the occurrence of events that may reduce the fair value of a reporting unit below its carrying amount, such as the sale of a significant portion of one or more of our reporting units.
If our goodwill were impaired, we would be required to record a non-cash charge that could have a material adverse effect on our consolidated financial statements. However, any potential non-cash charge would not have any adverse effect on the covenant calculations required under our Senior Secured Credit Facility (“2007 Credit Facility”) or our overall compliance with the covenants of our 2007 Credit Facility.
See Note 8, “Goodwill and Intangible Assets,” for more disclosure about our test for goodwill impairment.
Self-insurance Reserves
Self-insurance reserves represent reserves established as a result of insurance programs under which we self-insure portions of our business risks. We carry substantial premium-paid, traditional risk transfer insurance for our various business risks; however, we self-insure and establish reserves for the retentions on workers’ compensation insurance, general liability, automobile liability, and professional errors and omissions liability.
102
URS CORPORATION AND SUBSIDIARIES
NOTES TO CONSOLIDATED FINANCIAL STATEMENTS (Continued)
Foreign Currency Translation
We determine the functional currency of our international operating entities based upon the currency of the primary environment in which they operate. The functional currency of our international holding companies is the U.S. dollar. Where the functional currency is not the U.S. dollar, translation of assets and liabilities to U.S. dollars is based on exchange rates at the balance sheet date. Translation of revenue and expenses to U.S. dollars is based on the average rate during the period. Translation gains or losses, net of income tax effects, are reported as a component of other comprehensive income (loss). Gains or losses from foreign currency transactions are included in results of operations, with the exception of intercompany foreign transactions that are of a long-term investment nature, which are recorded in “Accumulated other comprehensive loss” on our Consolidated Balance Sheets.
Income Taxes
We use the asset and liability approach for financial accounting and reporting for income taxes. We file income, franchise, gross receipts and similar tax returns in many jurisdictions. Our tax returns are subject to audit by the Internal Revenue Service, most states in the U.S., and by various government agencies representing many jurisdictions outside the U.S. We estimate and provide for additional income taxes that may be assessed by the various taxing authorities. Deferred income tax assets and liabilities are computed annually for differences between the financial statement and tax bases of assets and liabilities that will result in taxable or deductible amounts in the future based on enacted tax laws and rates applicable to the periods in which the differences are expected to affect taxable income. Income tax expense is the amount of tax payable for the period plus or minus the change in deferred tax assets and liabilities during the period.
Valuation allowances based on our judgments and estimates are established when necessary to reduce deferred tax assets to the amount expected to be realized and based on expected future operating results and available tax alternatives. Our estimates are based on facts and circumstances in existence as well as interpretations of existing tax regulations and laws applied to the facts and circumstances. Management believes that realization of deferred tax assets in excess of the valuation allowance is more likely than not.
Pension Plans and Post-retirement Benefits
We account for our defined benefit pension plans and post-retirement benefits using actuarial valuations that are based on assumptions, including discount rates, long-term rates of return on plan assets, and rates of change in participant compensation levels. We evaluate the funded status of each of our defined benefit pension plans and post-retirement benefit plans using these assumptions, consider applicable regulatory requirements, tax deductibility, reporting considerations and other relevant factors, and thereby determine the appropriate funding level for each period. The discount rate used to calculate the present value of the pension and post-retirement benefit obligations is assessed at least annually. The discount rate represents the rate inherent in the price at which the plans’ obligations are intended to be settled at the measurement date.
Noncontrolling interests
Noncontrolling interests represent the equity investments of the minority owners in our joint ventures and other subsidiary entities that we consolidate in our financial statements.
103
URS CORPORATION AND SUBSIDIARIES
NOTES TO CONSOLIDATED FINANCIAL STATEMENTS (Continued)
Business Combinations
We account for business combinations under the purchase accounting method. The cost of an acquired company is assigned to the tangible and intangible assets purchased and the liabilities assumed on the basis of their fair values at the date of acquisition. The determination of fair values of assets and liabilities acquired requires us to make estimates and use valuation techniques when market value is not readily available. Any excess of purchase price over the fair value of net tangible and intangible assets acquired is allocated to goodwill. The transaction costs associated with business combinations are expensed as they are incurred.
Stock-based Compensation
We estimate the fair value of options granted using the Black-Scholes option pricing model. The assumptions used in computing the fair value of share-based payments reflect our estimates, but involve uncertainties relating to market and other conditions, many of which are outside of our control. We estimate expected volatility based on historical daily price changes of our stock for a period that approximates the current expected term of the options. The expected option term is the number of years we estimate that options will be outstanding prior to exercise considering vesting schedules and our historical exercise patterns.
Reclassifications
We made reclassifications to the prior years’ financial statements to conform them to the current period’s presentation. These reclassifications have no effect on our consolidated balance sheet, consolidated net income, comprehensive income, stockholders’ equity or net cash flows.
A new accounting standard on transfers of financial assets became effective for us at the beginning of our 2010 fiscal year. This standard eliminates the concept of a qualifying special-purpose entity, limits the circumstances under which a financial asset is derecognized and requires additional disclosures concerning a transferor's continuing involvement with transferred financial assets. The adoption of this standard did not have a material impact on our consolidated financial statements.
A new accounting standard on consolidation of VIEs became effective for us at the beginning of our 2010 fiscal year. This standard amends the accounting and disclosure requirements for the consolidation of a VIE. It requires additional disclosures about the significant judgments and assumptions used in determining whether to consolidate a VIE, the restrictions on a consolidated VIE’s assets and on the settlement of a VIE’s liabilities, the risk associated with involvement in a VIE, and the financial impact on a company due to its involvement with a VIE. As the standard requires ongoing quarterly evaluation of the application of the new requirements, changes in circumstances could result in the identification of additional VIEs to be consolidated or existing VIEs to be deconsolidated in any reporting period. We adopted this standard prospectively and based on the carrying values of the entities at the date of adoption. The adoption of this standard did not have a material impact on our consolidated financial statements. For additional disclosure, see Note 5, “Joint Ventures.”
104
URS CORPORATION AND SUBSIDIARIES
NOTES TO CONSOLIDATED FINANCIAL STATEMENTS (Continued)
An accounting standard update related to recurring and nonrecurring fair value measurements was issued. This update requires new disclosures on significant transfers of assets and liabilities between Level 1 and Level 2 of the fair value hierarchy (including the reasons for these transfers) and the reasons for any transfers in or out of Level 3. It also requires a reconciliation of recurring Level 3 measurements including purchases, sales, issuances and settlements on a gross basis. The accounting update clarifies certain existing disclosure requirements and requires fair value measurement disclosures for each class of assets and liabilities as opposed to each major category of assets and liabilities. It also clarifies that entities are required to disclose information about both the valuation techniques and inputs used in estimating Level 2 and Level 3 fair value measurements. Except for the disclosures on the reconciliation of recurring Level 3 measurements, the other new disclosures and clarifications of existing disclosures were effective for us beginning with the first quarter of our 2010 fiscal year. The adoption of this standard did not have a material impact on our consolidated financial statements. See Note 10, “Fair Values of Debt Instruments, Investments and Derivative Instruments,” for our fair value measurement disclosure. The information about the activity in Level 3 fair value measurements on a gross basis will be effective for us beginning with the first quarter of our 2011 fiscal year. We currently do not expect that the adoption of this portion of the standard will have a material impact on our consolidated financial statements.
An accounting standard update related to disclosures about the credit quality of financing receivables and the allowance for credit losses was issued. This update is intended to provide additional disclosures on a disaggregated basis about the nature of credit risk inherent in the company’s portfolio of financing receivables, how the risk is analyzed and assessed in arriving at the allowance for credit losses, and the changes and reasons for those changes in the allowance for credit losses. We adopted the additional disclosures required by this accounting standard update at the end of our 2010 fiscal year. See Note 1, “Business, Basis of Presentation, and Accounting Policies” for the additional disclosures. The adoption of this standard did not have a material impact on our consolidated financial statements. The additional disclosures related to the activity during the reporting period will be effective for us beginning with the first quarter of our 2011 fiscal year. We do not expect that the adoption of this portion of the standard will have a material impact on our consolidated financial statements.
An accounting standard update related to the way companies test for impairment of goodwill was issued. Pursuant to this accounting update, goodwill of the reporting unit is not impaired if the carrying amount of a reporting unit is greater than zero and its fair value exceeds its carrying amount. Hence, the second step of the impairment test is not required. However, if the carrying amount of a reporting unit is zero or negative, the second step of the impairment test is required to be performed to measure the amount of impairment loss, if any, when it is more likely than not that goodwill impairment exists. In considering whether it is more likely than not that a goodwill impairment exists, a company must evaluate whether there are adverse qualitative factors. Consistent with before, this test must be performed annually or in the interim if an event occurs or circumstances exist that indicate that it is more likely than not that goodwill impairment exists. This standard is effective for us beginning in the first quarter of our 2011 fiscal year. We currently do not expect that the adoption of this standard will have a material impact on our consolidated financial statements.
105
URS CORPORATION AND SUBSIDIARIES
NOTES TO CONSOLIDATED FINANCIAL STATEMENTS (Continued)
In our computation of diluted earnings per share (“EPS”), we exclude the potential shares related to stock options that are issued and unexercised where the exercise price exceeds the average market price of our common stock during the period. We also exclude nonvested restricted stock awards and units that have an anti-dilutive effect on EPS or that currently have not met performance conditions.
The following table summarizes the earnings available to common stockholders for both basic and diluted EPS calculations, and the reconciliation between weighted-average shares outstanding used in calculating basic and diluted EPS for the years ended December 31, 2010, January 1, 2010, and January 2, 2009:
|
Year Ended
|
||||||||||||
|
(In thousands, except per share data)
|
December 31,
2010
|
January 1,
2010
|
January 2,
2009 (1)
|
|||||||||
|
Net income attributable to URS
|
$ | 287,889 | $ | 269,120 | $ | 219,791 | ||||||
|
Less: Earnings allocated to participating securities
|
— | — | (6,171 | ) | ||||||||
|
Earnings available to common stockholders – Basic and Diluted
|
$ | 287,889 | $ | 269,120 | $ | 213,620 | ||||||
|
Weighted-average common stock shares outstanding (2)
|
80,951 | 81,401 | 81,878 | |||||||||
|
Effect of dilutive stock options and restricted stock awards and units
|
340 | 441 | 498 | |||||||||
|
Weighted-average common stock outstanding – Diluted
|
81,291 | 81,842 | 82,376 | |||||||||
|
(1)
|
In applying the two-class method, earnings are allocated to both common stock shares and participating securities based on their respective weighted-average shares outstanding for the period. During our 2009 fiscal year, we amended these restricted stock awards and units to be non-participating securities until vested. Therefore, we do not have participating securities for the years ended December 31, 2010 and January 1, 2010.
|
|
(2)
|
Weighted-average common stock outstanding excludes treasury stock.
|
|
Year Ended
|
||||||||||||
|
(In thousands)
|
December 31,
2010
|
January 1,
2010
|
January 2,
2009
|
|||||||||
|
Anti-dilutive equity awards not included above
|
855 | 634 | 12 | |||||||||
106
URS CORPORATION AND SUBSIDIARIES
NOTES TO CONSOLIDATED FINANCIAL STATEMENTS (Continued)
The following table summarizes the components of our accounts receivable and costs and accrued earnings in excess of billings on contracts between the U.S. federal government agencies and other customers as of December 31, 2010 and January 1, 2010. As of December 31, 2010 and January 1, 2010, billed and unbilled receivables from two federal agencies totaled $941.0 million or 42% and $773.5 million or 40% of our consolidated billed and unbilled receivables, respectively.
|
As of
|
||||||||
|
(In millions)
|
December 31,
2010
|
January 1,
2010
|
||||||
|
Accounts receivable:
|
||||||||
|
U.S. federal government agencies
|
$ | 398.8 | $ | 330.5 | ||||
|
Others
|
704.0 | 593.8 | ||||||
|
Total accounts receivable
|
$ | 1,102.8 | $ | 924.3 | ||||
|
Costs and accrued earnings in excess of billings on contracts:
|
||||||||
|
U.S. federal government agencies
|
$ | 662.4 | $ | 557.7 | ||||
|
Others
|
494.7 | 466.5 | ||||||
|
Total costs and accrued earnings in excess of billings on contracts
|
$ | 1,157.1 | $ | 1,024.2 | ||||
The following are examples of activities currently being performed by our significant consolidated and unconsolidated joint ventures:
|
·
|
Engineering, procurement and construction of a concrete dam;
|
|
·
|
Liquid waste management services, including the decontamination of a former nuclear fuel reprocessing facility and nuclear hazardous waste processing;
|
|
·
|
Management of ongoing tank cleanup effort, including retrieving, treating, storing and disposing of nuclear waste that is stored at tank farms;
|
|
·
|
Management and operation services, including commercial operations, decontamination, decommissioning, and waste management of a low-level nuclear waste repository in the United Kingdom (“U.K.”); and
|
|
·
|
Procurement and construction of levee improvements.
|
In accordance with the current consolidation standard, we analyzed all of our joint ventures and classified them into two groups:
|
·
|
Joint ventures that must be consolidated because they are either not VIEs and we hold the majority voting interest, or because they are VIEs of which we are the primary beneficiary; and
|
|
·
|
Joint ventures that do not need to be consolidated because they are either not VIEs and we do not hold a majority voting interest, or because they are VIEs of which we are not the primary beneficiary.
|
During the first quarter of 2010, our review of our joint ventures resulted in the identification and consolidation of several immaterial joint ventures, which, under the previous standard, should have been consolidated.
107
URS CORPORATION AND SUBSIDIARIES
NOTES TO CONSOLIDATED FINANCIAL STATEMENTS (Continued)
Each quarter, we re-assess our joint ventures to determine whether there are any changes in the status of the VIEs or changes to the primary beneficiary designation of each VIE. Subsequent to our adoption of the standard at the beginning of fiscal year 2010, we concluded that no unconsolidated joint ventures should be consolidated and that no consolidated joint ventures should be de-consolidated.
In the table below, we have aggregated financial information relating to our VIEs because their nature and risk and reward characteristics are similar. None of our current joint ventures that meets the characteristics of a VIE is individually significant to our consolidated financial statements.
Consolidated Joint Ventures
The following table represents the total assets and liabilities of our consolidated joint ventures.
|
(In millions)
|
December 31,
2010
|
January 1,
2010
|
||||||
|
Cash and cash equivalents
|
$ | 85.6 | $ | 112.4 | ||||
|
Net accounts receivable
|
322.1 | 228.1 | ||||||
|
Other current assets
|
1.1 | 2.2 | ||||||
|
Non-current assets
|
36.2 | 0.2 | ||||||
|
Total assets
|
$ | 445.0 | $ | 342.9 | ||||
|
Accounts and subcontractors payable
|
$ | 214.8 | $ | 128.1 | ||||
|
Billings in excess of costs and accrued earnings
|
7.5 | 14.5 | ||||||
|
Accrued expenses and other
|
34.9 | 31.4 | ||||||
|
Non-current liabilities
|
3.2 | — | ||||||
|
Total liabilities
|
260.4 | 174.0 | ||||||
|
Total URS equity
|
100.8 | 124.2 | ||||||
|
Noncontrolling interests
|
83.8 | 44.7 | ||||||
|
Total owners’ equity
|
184.6 | 168.9 | ||||||
|
Total liabilities and owners’ equity
|
$ | 445.0 | $ | 342.9 | ||||
Total revenues of the consolidated ventures were $1.7 billion, $1.2 billion, and $1.3 billion for the years ended December 31, 2010, January 1, 2010, and January 2, 2009, respectively.
The assets of our consolidated joint ventures are restricted for use only by the particular joint venture and are not available for our general operations.
Unconsolidated Joint Ventures
We use the equity method of accounting for our unconsolidated joint ventures. Under the equity method, we recognize our proportionate share of the net earnings of the joint ventures as a single line item under “Equity in income of unconsolidated joint ventures” in our Consolidated Statement of Operations.
108
URS CORPORATION AND SUBSIDIARIES
NOTES TO CONSOLIDATED FINANCIAL STATEMENTS (Continued)
The table below presents financial information, derived from the most recent financial statements provided to us, in aggregate, for our unconsolidated joint ventures:
|
(In millions)
|
Unconsolidated VIEs
|
MIBRAG Mining Joint Venture (1)
|
||||||
|
December 31, 2010
|
||||||||
|
Current assets
|
$ | 423.6 | N/A | |||||
|
Noncurrent assets
|
$ | 7.0 | N/A | |||||
|
Current liabilities
|
$ | 340.5 | N/A | |||||
|
Noncurrent liabilities
|
$ | 0.1 | N/A | |||||
|
January 1, 2010
|
||||||||
|
Current assets
|
$ | 574.6 | N/A | |||||
|
Noncurrent assets
|
$ | 18.3 | N/A | |||||
|
Current liabilities
|
$ | 442.7 | N/A | |||||
|
Noncurrent liabilities
|
$ | 0.1 | N/A | |||||
|
For the year ended December 31, 2010 (2,3)
|
||||||||
|
Revenues
|
$ | 1,333.5 | N/A | |||||
|
Cost of revenues
|
$ | (1,149.0 | ) | N/A | ||||
|
Income from continuing operations before tax
|
$ | 184.5 | N/A | |||||
|
Net income
|
$ | 169.6 | N/A | |||||
|
For the year ended January 1, 2010 (2)
|
||||||||
|
Revenues
|
$ | 1,993.6 | $ | 219.6 | ||||
|
Cost of revenues
|
$ | (1,721.8 | ) | $ | (181.8 | ) | ||
|
Income from continuing operations before tax
|
$ | 271.8 | $ | 37.8 | ||||
|
Net income
|
$ | 259.0 | $ | 37.3 | ||||
|
For the year ended January 2, 2009 (2)
|
||||||||
|
Revenues
|
$ | 1,978.6 | $ | 528.2 | ||||
|
Cost of revenues
|
$ | (1,754.5 | ) | $ | (465.2 | ) | ||
|
Income from continuing operations before tax
|
$ | 224.1 | $ | 63.0 | ||||
|
Net income
|
$ | 224.1 | $ | 62.1 | ||||
|
(1)
|
During the second quarter of 2009, we sold our equity investment in the MIBRAG mbH (“MIBRAG”) mining venture.
|
|
(2)
|
Income from unconsolidated U.S. joint ventures is generally not taxable to the joint venture in most tax jurisdictions in the U.S. The tax expenses on our other unconsolidated joint ventures are primarily related to foreign taxes.
|
|
(3)
|
For the year ended December 31, 2010, we recorded a pre-tax non-cash asset impairment charge of $25.0 million or $0.18 per share on an after-tax basis on the SR-125 road project in California as a result of an adverse legal ruling. See Note 16, “Commitments and Contingencies,” for more information regarding this matter.
|
109
URS CORPORATION AND SUBSIDIARIES
NOTES TO CONSOLIDATED FINANCIAL STATEMENTS (Continued)
For the years ended December 31, 2010, January 1, 2010, and January 2, 2009, we received $92.5 million, $85.6 million, and $85.0 million, respectively, of distributions from unconsolidated joint ventures. We received no distributions from MIBRAG for the year ended January 1, 2010, and received $11.1 million of distributions from MIBRAG for the year ended January 2, 2009. As a result of the sale of MIBRAG during fiscal year 2009, we no longer receive distributions from MIBRAG.
Maximum Exposure to Loss
In addition to potential losses arising out of the carrying values of the assets and liabilities of our unconsolidated joint ventures, our maximum exposure to loss also includes performance assurances and guarantees we sometimes provide to clients on behalf of joint ventures that we do not directly control. We enter into these guarantees primarily to support the contractual obligations associated with the joint ventures’ projects. The potential payment amount of an outstanding performance guarantee is typically the remaining cost of work to be performed by or on behalf of third parties under engineering and construction contracts. However, the nature of these costs are such that we are not able to estimate amounts that may be required to be paid in excess of estimated costs to complete contracts and, accordingly, the exposure to loss as a result of these performance guarantees cannot be calculated.
Sale of Equity Investment in MIBRAG
On June 10, 2009, we completed the sale of our equity investment in MIBRAG. We received €206.1 million (equivalent to U.S. $287.8 million) in cash proceeds from the sale. In addition, we settled our foreign currency forward contract, which primarily hedged our net investment in MIBRAG. (See Note 9, “Indebtedness” for further discussion of our foreign currency loss related to the foreign currency forward contract). The following table describes the impact of these transactions for the year ended January 1, 2010:
|
(In millions)
|
Year Ended January 1, 2010
|
|||
|
Other income, net:
|
||||
|
Sales proceeds
|
$ | 287.8 | ||
|
Less: carrying value
|
(207.0 | ) | ||
|
sale-related costs
|
(5.2 | ) | ||
|
Gain on sale
|
75.6 | |||
|
Loss on settlement of foreign currency forward contract
|
(27.7 | ) | ||
|
Other income, net
|
$ | 47.9 | ||
The net after-tax impact of these two transactions resulted in an increase to net income of $30.6 million for the year ended January 1, 2010. It also increased diluted EPS by $0.37 for the year ended January 1, 2010.
110
URS CORPORATION AND SUBSIDIARIES
NOTES TO CONSOLIDATED FINANCIAL STATEMENTS (Continued)
Property and equipment consisted of the following:
|
(In millions)
|
December 31,
2010
|
January 1,
2010
|
||||||
|
Computer software
|
$ | 174.8 | $ | 156.4 | ||||
|
Computer hardware
|
148.8 | 134.7 | ||||||
|
Construction and mining equipment
|
119.5 | 116.0 | ||||||
|
Other equipment
|
98.0 | 85.2 | ||||||
|
Furniture and fixtures
|
67.0 | 57.0 | ||||||
|
Leasehold improvements
|
74.6 | 71.0 | ||||||
|
Land and buildings
|
9.4 | 0.6 | ||||||
|
Construction in progress
|
3.8 | 0.1 | ||||||
| 695.9 | 621.0 | |||||||
|
Accumulated depreciation and amortization
|
(429.8 | ) | (362.0 | ) | ||||
|
Property and equipment at cost, net (1)
|
$ | 266.1 | $ | 259.0 | ||||
|
(1)
|
The unamortized computer software costs were $68.4 million and $67.0 million, respectively, as of December 31, 2010 and January 1, 2010.
|
Property and equipment was depreciated by using the following estimated useful lives:
|
Estimated Useful Lives
|
|
|
Equipment and computer software and hardware
|
3 – 10 years
|
|
Construction and mining equipment
|
3 – 15 years
|
|
Furniture and fixtures
|
3 – 10 years
|
|
Leasehold improvements (1)
|
1 – 20 years
|
|
Buildings
|
10 – 55 years
|
|
|
(1)
|
Leasehold improvements are amortized over the length of the lease or estimated useful life, whichever is less.
|
Our depreciation and amortization expense related to property and equipment for the years ended December 31, 2010, January 1, 2010, and January 2, 2009 was $84.3 million, $86.9 million, and $90.0 million, respectively.
111
URS CORPORATION AND SUBSIDIARIES
NOTES TO CONSOLIDATED FINANCIAL STATEMENTS (Continued)
On September 10, 2010, we completed the acquisition of Scott Wilson, an infrastructure engineering and design firm based in the U.K. This acquisition has expanded our capabilities in the U.K. infrastructure market and in other key regions around the world.
We purchased all of the outstanding Scott Wilson shares for £2.90 per share. Scott Wilson shareholders had the option to receive their consideration in cash or five-year loan notes (“Loan Notes”). We also expect to purchase, for the same price, any additional Scott Wilson shares that may become issuable upon a participant’s election within six months after the acquisition date under the terms of Scott Wilson's employee equity plans. The total purchase consideration related to this acquisition consisted of the following:
|
(In millions)
|
British Pound
|
Equivalent to USD as of September 10, 2010
|
||||||
|
Cash consideration
|
£ | 201 | $ | 309 | ||||
|
Loan Notes
|
18 | 28 | ||||||
|
Estimated consideration for vested shares exercisable under Scott Wilson’s employee equity plans
|
4 | 6 | ||||||
|
Total purchase price consideration
|
£ | 223 | $ | 343 | ||||
Prior to the completion of this acquisition, we purchased 9,656,277 shares of Scott Wilson in July 2010 for a total of $42.5 million and recorded the amount in “Other assets” on our Consolidated Balance Sheets. At the time, these shares represented approximately 13.1% of the outstanding shares of Scott Wilson. Pursuant to the accounting guidance on business combinations, we re-measured these shares to their fair value at the acquisition date, September 10, 2010. No gain or loss was recognized as the cost of these shares was the same as the fair value at the acquisition date.
In connection with this acquisition, we recognized $11.9 million of expenses for the year ended December 31, 2010 in “Acquisition-related expenses” on our Consolidated Statements of Operations. These expenses included legal fees, bank fees, consultation fees, travel expenses, and other miscellaneous direct and incremental administrative expenses associated with this acquisition.
Our consolidated financial statements include the operating results of Scott Wilson, which are included under our Infrastructure & Environment business, from the date of acquisition through December 31, 2010. The operating results generated from this newly acquired business group during this period were not material to our consolidated results for the year ended December 31, 2010. Pro forma results of Scott Wilson have not been presented because the effect of this acquisition is not material to our consolidated financial results.
112
URS CORPORATION AND SUBSIDIARIES
NOTES TO CONSOLIDATED FINANCIAL STATEMENTS (Continued)
The following table presents a preliminary allocation of Scott Wilson’s identifiable assets acquired and liabilities assumed based on the estimates of their fair values as of the acquisition date. These estimates are subject to revision, which may result in adjustments to the values presented below. We expect to finalize these amounts within 12 months from the acquisition date. We do not expect any adjustments to be material.
|
Preliminary allocation of purchase price:
(In millions)
|
Amount
|
Estimated
Useful Life
|
|||
|
Identifiable assets acquired and liabilities assumed:
|
|||||
|
Cash and cash equivalents
|
$ | 15 | |||
|
Trade and other receivables
|
182 | ||||
|
Other current assets
|
13 | ||||
|
Property and equipment
|
36 | ||||
|
Other assets
|
12 | ||||
|
Identifiable intangible assets:
|
|||||
|
Customer relationships, contracts and backlog
|
110 |
4 – 15 years
|
|||
|
Trade name
|
25 |
25 years
|
|||
|
Favorable leases and other
|
1 |
1-11 years
|
|||
|
Total amount allocated to identifiable intangible assets
|
136 | ||||
|
Current liabilities
|
(168 | ) | |||
|
Net deferred tax liabilities
|
(12 | ) | |||
|
Pension benefit obligations
|
(82 | ) | |||
|
Long-term liabilities
|
(11 | ) | |||
|
Total identifiable net assets acquired
|
121 | ||||
|
Goodwill
|
222 | ||||
|
Total purchase price
|
$ | 343 | |||
Intangible assets. Of the total purchase price, $136 million has been allocated to customer relationships, a trade name, favorable leases and other. Customer relationships represent existing contracts and the underlying customer relationships and backlog. We will amortize the fair values of these assets based on the period over which the economic benefits of the intangible assets are expected to be realized. The Scott Wilson trade name will be amortized using the straight-line method over an estimated useful life of 25 years. Favorable leases represent the net favorable difference between market and existing lease rates. We will amortize the fair value of these assets based on the terms of the respective underlying leases. During the period from the acquisition date through December 31, 2010, we recorded $4.8 million of amortization of intangible assets related to this acquisition.
Goodwill. Goodwill represents the excess of the purchase price over the fair value of the underlying net tangible and intangible assets. The factors that contributed to the recognition of goodwill included acquiring a talented workforce, capabilities in the U.K. infrastructure market and other international markets, and cost savings opportunities. This acquisition generated $222 million of goodwill, which is included in our Infrastructure & Environment business. It is the main contributing factor to the net increase in our consolidated goodwill since the beginning of this fiscal year. None of the acquired goodwill is tax deductible.
113
URS CORPORATION AND SUBSIDIARIES
NOTES TO CONSOLIDATED FINANCIAL STATEMENTS (Continued)
Goodwill
The following table presents the changes in goodwill allocated to our reportable segments from January 2, 2009 to December 31, 2010:
|
(In millions)
|
Infrastructure
&
Environment
|
Federal
Services
|
Energy
&
Construction
|
Total
|
||||||||||||
|
Balances as of January 2, 2009
|
$ | 528.9 | $ | 854.8 | $ | 1,774.5 | $ | 3,158.2 | ||||||||
|
Acquisition
|
12.5 | — | — | 12.5 | ||||||||||||
|
Foreign currency translation
|
(0.7 | ) | — | — | (0.7 | ) | ||||||||||
|
Balances at January 1, 2010
|
540.7 | 854.8 | 1,774.5 | 3,170.0 | ||||||||||||
|
Acquisition
|
221.8 | — | — | 221.8 | ||||||||||||
|
Transfer between segments
|
(9.3 | ) | — | 9.3 | — | |||||||||||
|
Foreign currency translation
|
1.4 | — | — | 1.4 | ||||||||||||
|
Balances at December 31, 2010
|
$ | 754.6 | $ | 854.8 | $ | 1,783.8 | $ | 3,393.2 | ||||||||
The net change of $223.2 million for the year ended December 31, 2010 was primarily due to our acquisition of Scott Wilson. See Note 7, “Acquisition,” for more information regarding this acquisition. The net change of $11.8 million for the year ended January 1, 2010 was primarily due to an acquisition of a privately held engineering company.
Goodwill Impairment Review
In accordance with current accounting guidance, we have identified seven reporting units for the purpose of conducting our goodwill impairment review. In determining our reporting units, we considered (i) whether an operating segment or a component of an operating segment was a business, (ii) whether discrete financial information was available, and (iii) whether the financial information is regularly reviewed by management of the operating segment. As a result of that evaluation, we concluded that the following were our reporting units:
|
·
|
The Infrastructure & Environment Operating Segment
|
|
·
|
Within the Federal Services Operating Segment:
|
|
o
|
Global Security Group
|
|
o
|
Federal Maintenance, Logistics and Engineering Group
|
|
·
|
Within the Energy & Construction Operating Segment:
|
|
o
|
Global Management and Operations Services Group
|
|
o
|
Civil Construction and Mining Group
|
|
o
|
Industrial/Process Group
|
|
o
|
Power Group
|
As of our October 29, 2010 testing date, our annual review did not indicate an impairment of goodwill for any of our reporting units. No events or changes in circumstances have occurred that would indicate an impairment of goodwill since the annual testing date. There was also no goodwill impairment for any of our reporting units during the years ended January 1, 2010 and January 2, 2009.
114
URS CORPORATION AND SUBSIDIARIES
NOTES TO CONSOLIDATED FINANCIAL STATEMENTS (Continued)
To arrive at the cash flow projections used in the calculation of fair values for our goodwill impairment review, we use estimates of economic and market information for the next ten years. The key assumptions we used to estimate the fair values of our reporting units are:
|
·
|
Discount rates
|
|
·
|
Compounded annual revenue growth rates
|
|
·
|
Average operating margins, and
|
|
·
|
Terminal value capitalization rate (“Capitalization Rate”)
|
Of the key assumptions, the discount rates and the Capitalization Rate are market-driven. These rates are derived from the use of market data and employment of the Capital Asset Pricing Model. The company-dependent key assumptions are the compounded annual revenue growth rates and the average operating margins and are subject to much greater influence from our actions. The company-dependent key assumptions reflect the influence of other potential assumptions, since the assumptions we identified that affect the projected operating results would ultimately affect either the revenue growth or the profitability (operating margin) of the reporting unit. For example, any adjustment to contract volume and pricing would have a direct impact on revenue growth, and any adjustment to the reporting unit’s cost structure or operating leverage would have a direct impact on the profitability of the reporting unit. For the purpose of the income approach, we used discount rates that are commensurate with the risk and uncertainty inherent in the respective reporting units and in our internally-developed forecasts. Actual results may differ from those assumed in our forecasts and changes in assumptions or estimates could materially affect the determination of the fair value of a reporting unit, and therefore could affect the amount of potential impairment.
We validate our estimate of the fair value of each reporting unit under the income approach by comparing the resulting values to fair value estimates using a market approach. A market approach estimates fair value by applying cash flow multiples to the reporting unit’s operating performance. The multiples are derived from comparable publicly traded companies with similar operating and investment characteristics of the reporting units. When performing our annual impairment analysis, we also reconcile the total of the fair values of our reporting units with our market capitalization to determine if the sum of the individual fair values is reasonable compared to the external market indicators. If our reconciliation indicates a significant difference between our external market capitalization and the fair values of our reporting units, we review and adjust, if appropriate, our weighted-average cost of capital and consider if the implied control premium is reasonable in light of current market conditions.
Inherent in our development of the present value of future cash flow projections are assumptions and estimates derived from a review of our expected revenue growth rates, profit margins, business plans, cost of capital and tax rates. We also make certain assumptions about future market conditions, market prices, interest rates, and changes in business strategies. Changes in our assumptions or estimates could materially affect the determination of the fair value of a reporting unit, and therefore could eliminate the excess of fair value over carrying value of a reporting unit entirely and, in some cases, could result in impairment. Such changes in assumptions could be caused by a loss of one or more significant contracts, reductions in government and/or private industry spending, or a decline in the demand of our services due to changing economic conditions. Given the contractual nature of our business, if we are unable to win or renew contracts; unable to estimate and control our contract costs; fail to adequately perform to our clients’ expectations; fail to procure third-party subcontractors, heavy equipment and materials; or fail to adequately secure funding for our projects, our profits, revenues and growth over the long-term would decline and such a decline could significantly affect the fair value assessment of our reporting units and cause our goodwill to become impaired.
Goodwill was allocated to the reporting units based upon the respective fair values of the reporting units at the time of the various acquisitions that gave rise to the recognition of goodwill.
At our annual impairment testing date, we determined that our market capitalization was below our carrying value. Even though we determined that there was no goodwill asset impairment as of our testing date, declines in our stock price or in the values of other market participants in the construction and engineering industry could result in future impairment charges.
115
URS CORPORATION AND SUBSIDIARIES
NOTES TO CONSOLIDATED FINANCIAL STATEMENTS (Continued)
Our annual impairment test indicated that the fair values of the reporting units exceeded their carrying values, thereby resulting in no indication of impairment. All of our reporting units had fair values in excess of carrying values by more than 10% except for the following two reporting units.
|
(In millions)
|
Goodwill
Balance as of
December 31,
2010
|
Fair Value
|
Carrying Value
|
% above
Carrying Value
|
||||||||||||
|
Global Management and Operations Services Group
|
$ | 565.4 | $ | 857.6 | $ | 797.8 | 7.5 | % | ||||||||
|
Civil Construction & Mining Group
|
293.9 | 416.8 | 383.5 | 8.7 | % | |||||||||||
Intangible Assets
Intangible assets are comprised of customer relationships, contracts, backlog, trade name, favorable leases and other. As of December 31, 2010, January 1, 2010, and January 2, 2009, the cost and accumulated amortization of our intangible assets were as follows:
|
(In millions)
|
Customer
Relationships,
Contracts, and
Backlog
|
Trade Name
|
Favorable
Leases and
Other
|
Total
|
||||||||||||
|
Balances at December 28, 2007
|
$ | 536.2 | $ | 33.7 | $ | 3.1 | $ | 573.0 | ||||||||
|
Purchase accounting adjustments of Washington Group International, Inc. (“WGI”) acquisition
|
(26.3 | ) | 16.7 | — | (9.6 | ) | ||||||||||
|
Acquisitions
|
0.7 | — | — | 0.7 | ||||||||||||
|
Amortization expense
|
(42.7 | ) | (9.1 | ) | (0.8 | ) | (52.6 | ) | ||||||||
|
Balances at January 2, 2009
|
467.9 | 41.3 | 2.3 | 511.5 | ||||||||||||
|
Amortization expense
|
(43.5 | ) | (8.5 | ) | (0.8 | ) | (52.8 | ) | ||||||||
|
Impairment of an intangible asset (1)
|
— | (32.8 | ) | — | (32.8 | ) | ||||||||||
|
Balances at January 1, 2010
|
424.4 | — | 1.5 | 425.9 | ||||||||||||
|
Acquisition
|
110.5 | 25.0 | 0.4 | 135.9 | ||||||||||||
|
Amortization expense
|
(47.9 | ) | (0.3 | ) | (1.0 | ) | (49.2 | ) | ||||||||
|
Other additions and foreign currency translation
|
0.3 | 0.2 | 1.0 | 1.5 | ||||||||||||
|
Balances at December 31, 2010
|
$ | 487.3 | $ | 24.9 | $ | 1.9 | $ | 514.1 | ||||||||
|
Estimated useful lives
|
2 – 16 years
|
25 years
|
1 – 11 years
|
|||||||||||||
|
(1)
|
Prior to January 1, 2010, our Infrastructure & Environment, Federal Services and Energy & Construction businesses were referred to as the URS, EG&G and Washington Divisions, respectively. Effective January 1, 2010, we rebranded our EG&G and Washington Divisions under the URS name to present a single brand to our clients in the marketplace. As a result of this rebranding initiative, in the fourth quarter of the 2009 fiscal year, we recorded a non-cash charge of $32.8 million for the write-down of the “Washington” trade name intangible asset and the adoption of a single URS brand. This charge was included in “Impairment of an Intangible Asset” in our Consolidated Statements of Operations and was reported under the Federal Services and Energy & Construction reporting segments. On a net, after-tax basis, this transaction resulted in decreases to net income and diluted EPS of $19.6 million and $0.24, respectively, for the year ended January 1, 2010. There were no intangible assets related to the “EG&G” or other company trade names.
|
116
URS CORPORATION AND SUBSIDIARIES
NOTES TO CONSOLIDATED FINANCIAL STATEMENTS (Continued)
The following table presents the estimated future amortization expense of intangible assets:
|
Estimated Future Amortization Expense (In millions)
|
Customer Relationships, Contracts, and Backlog
|
Trade Name
|
Favorable Leases and Other
|
Total
|
||||||||||||
|
2011
|
$ | 56.8 | $ | 1.0 | $ | 0.9 | $ | 58.7 | ||||||||
|
2012
|
53.8 | 1.0 | 0.4 | 55.2 | ||||||||||||
|
2013
|
53.8 | 1.0 | 0.1 | 54.9 | ||||||||||||
|
2014
|
53.6 | 1.0 | 0.1 | 54.7 | ||||||||||||
|
2015
|
51.7 | 1.0 | 0.1 | 52.8 | ||||||||||||
|
Thereafter
|
217.6 | 19.9 | 0.3 | 237.8 | ||||||||||||
| $ | 487.3 | $ | 24.9 | $ | 1.9 | $ | 514.1 | |||||||||
Indebtedness consisted of the following:
|
(In millions)
|
December 31,
2010
|
January 1,
2010
|
||||||
|
Bank term loans, net of debt issuance costs
|
$ | 619.6 | $ | 763.9 | ||||
|
Obligations under capital leases
|
19.4 | 16.5 | ||||||
|
Notes payable, foreign credit lines and Loan Notes
|
62.8 | 24.6 | ||||||
|
Total indebtedness
|
701.8 | 805.0 | ||||||
|
Less:
|
||||||||
|
Current portion of long-term debt
|
60.5 | 115.3 | ||||||
|
Long-term debt
|
$ | 641.3 | $ | 689.7 | ||||
2007 Credit Facility
Our 2007 Credit Facility provides for two term loan facilities, originally consisting of a term loan A of $1.1 billion and a term loan B of $300.0 million, in the aggregate amount of $1.4 billion and a revolving credit facility in the amount of $700.0 million, which is also available for issuing letters of credit. The revolving credit facility is a five-year facility. Term loan A and the revolving credit facility will mature and expire on November 15, 2012 and term loan B will mature on May 15, 2013.
Under the terms of our 2007 Credit Facility, we are generally required to remit as debt payments any proceeds we receive from the sale of assets and the issuance of debt. On February 16, 2010, we entered into a consent to our 2007 Credit Facility, which allows us to use the funds from the sale of our equity investment in MIBRAG for general operating purposes. As a result of this consent, we were not required to remit a payment relating to this transaction in the first quarter of 2010 and our next scheduled payment is expected to be due in March 2012.
As of December 31, 2010 and January 1, 2010, the outstanding balance of term loan A was $490.0 million and $607.6 million at interest rates of 1.26% and 1.25%, respectively. As of December 31, 2010 and January 1, 2010, the outstanding balance of term loan B was $135.0 million and $167.4 million at interest rates of 2.51% and 2.50%, respectively. We did not have an outstanding debt balance on our revolving line of credit as of December 31, 2010 and January 1, 2010.
117
URS CORPORATION AND SUBSIDIARIES
NOTES TO CONSOLIDATED FINANCIAL STATEMENTS (Continued)
The original scheduled principal payments under the term loans began on December 28, 2007 and are due quarterly. Equal quarterly payments for term loan A will be required in aggregate annual amounts expressed as a percentage of the original principal amount of term loan A as follows:
|
Year
|
Percentage
|
|||||
|
2008
|
5 | % | ||||
|
2009
|
5 | % | ||||
|
2010
|
10 | % | ||||
|
2011
|
10 | % | ||||
|
2012
|
70 | % | ||||
|
Total
|
100 | % | ||||
Quarterly payments for term loan B will be 0.25%, or 1% on an annual basis, until the last four quarters prior to maturity, of the original aggregate principal amount of term loan B. Over the four quarters prior to maturity, the remaining principal balance of term loan B will be payable in equal quarterly amounts. We have the option to prepay the term loans at anytime without penalty.
Under our 2007 Credit Facility, we are subject to two financial covenants: 1) a maximum consolidated leverage ratio, which is calculated by dividing consolidated total debt by consolidated earnings before interest, taxes, depreciation and amortization (“EBITDA”), as defined below, and 2) a minimum interest coverage ratio, which is calculated by dividing consolidated cash interest expense into consolidated EBITDA. Both calculations are based on the financial data of our most recent four fiscal quarters.
All loans outstanding under our 2007 Credit Facility bear interest, at our option, at either the base rate or LIBOR, plus in each case an applicable margin. The applicable margin will adjust according to a performance pricing grid based on our ratio of consolidated total funded debt to EBITDA, referred to as the “Consolidated Leverage Ratio.”
For purposes of our 2007 Credit Facility, consolidated EBITDA is defined as consolidated net income attributable to URS plus interest, depreciation and amortization expense, amounts set aside for taxes, other non-cash items (including impairments of goodwill or intangible assets.)
As of December 31, 2010, our consolidated leverage ratio was 1.1, which did not exceed the maximum consolidated leverage ratio of 2.0, and our consolidated interest coverage ratio was 25.4, which exceeded the minimum consolidated interest coverage ratio of 5.5. During the first quarter of 2010, Moody’s Investor Services upgraded our credit rating to Ba1. On April 16, 2010, Standard and Poor’s upgraded our credit rating to BB+. As a result of these upgrades in our credit ratings in the first nine months of 2010, some of our non-financial covenants such as the ability to acquire other companies, are no longer applicable or became less restrictive. We were in compliance with the covenants of our 2007 Credit Facility as of December 31, 2010.
Substantially all of our operating domestic subsidiaries jointly and severally guarantee the 2007 Credit Facility. Our consolidated obligations are collateralized by a first priority security interest in the capital stock of our subsidiary guarantors. The first priority interest in existing personal property has been released by the parties to the 2007 Credit Facility as allowed as a result of the rating agency changes discussed above, and we are no longer required to include future acquired property as security.
Revolving Line of Credit
Our revolving line of credit is used to fund daily operating cash needs and to support our standby letters of credit. In the ordinary course of business, the use of our revolving line of credit is a function of collection and disbursement activities. Our daily cash needs generally follow a predictable pattern that parallels our payroll cycles, which dictate, as necessary, our short-term borrowing requirements.
118
URS CORPORATION AND SUBSIDIARIES
NOTES TO CONSOLIDATED FINANCIAL STATEMENTS (Continued)
We did not have an outstanding debt balance on our revolving line of credit as of December 31, 2010 and January 1, 2010. As of December 31, 2010, we issued $160.6 million of letters of credit, leaving $539.4 million available on our revolving credit facility. If we elected to borrow the remaining amounts available under our revolving line of credit as of December 31, 2010, we would remain in compliance with the covenants of our 2007 Credit Facility.
Our revolving line of credit information was summarized as follows:
|
Year Ended
|
||||||||||||
|
(In millions, except percentages)
|
December 31,
2010
|
January 1,
2010
|
January 2,
2009
|
|||||||||
|
Effective average interest rates paid on the revolving line of credit
|
3.0 | % | 3.2 | % | 5.6 | % | ||||||
|
Average daily revolving line of credit balances
|
$ | 0.3 | $ | — | $ | 0.2 | ||||||
|
Maximum amounts outstanding at any one point
|
$ | 12.1 | $ | 0.3 | $ | 7.7 | ||||||
Other Indebtedness
Notes payable, foreign credit lines and Loan Notes. As of December 31, 2010 and January 1, 2010, we had outstanding amounts of $62.8 million and $24.6 million, respectively, in notes payable, Loan Notes, and foreign lines of credit. The weighted average interest rates of the notes were approximately 2.3% and 5.6% as of December 31, 2010 and January 1, 2010, respectively. Notes payable primarily include notes used to finance the purchase of office equipment, computer equipment and furniture.
The Loan Notes of £17.9 million (equivalent to U.S. $27.9 million as of December 31, 2010) were issued to shareholders of Scott Wilson as an alternative to cash consideration. The Loan Notes are collateralized by cash held in trust and are redeemable at each note holder’s option in whole or in part on each of the interest payment dates falling six months after September 10, 2010, the issuance date. The Loan Notes will expire and be fully redeemed on September 10, 2015. The Loan Notes will pay interest semi-annually at the prevailing six-month pound sterling LIBOR rate less 0.25% set on each March and September 10th. See Note 7, “Acquisition,” for more information regarding this acquisition.
We maintain foreign lines of credit, which are collateralized by the assets of our foreign subsidiaries and in some cases, parent guarantees. As part of our acquisition of Scott Wilson, we assumed various credit lines, the largest being £40.0 million (equivalent to U.S. $62.0 million as of December 31, 2010) to allow for borrowing capacity in the U.K. and for worldwide bank guarantee usage.
As of December 31, 2010 and January 1, 2010, we had $88.1 million and $15.8 million in lines of credit available under these facilities, respectively. As of December 31, 2010, the total outstanding debt balance of our credit lines was $16.1 million.
Capital Leases. As of December 31, 2010 and January 1, 2010, we had approximately $19.4 million and $16.5 million in obligations under our capital leases, respectively, consisting primarily of leases for office equipment, computer equipment and furniture.
119
URS CORPORATION AND SUBSIDIARIES
NOTES TO CONSOLIDATED FINANCIAL STATEMENTS (Continued)
Maturities
As of December 31, 2010, the amounts of our long-term debt outstanding (excluding capital leases) that mature in the next five years and thereafter were as follows:
|
(In millions)
|
||||
|
Less than one year
|
$ | 53.0 | ||
|
Second year
|
553.1 | |||
|
Third year
|
74.4 | |||
|
Fourth year
|
1.4 | |||
|
Fifth year
|
0.5 | |||
| $ | 682.4 | |||
As of December 31, 2010, the amounts of capital leases that mature in the next five years and thereafter were as follows:
|
(In millions)
|
Capital Leases
|
|||
|
Less than one year
|
$ | 8.0 | ||
|
Second year
|
8.2 | |||
|
Third year
|
2.4 | |||
|
Fourth year
|
1.4 | |||
|
Fifth year
|
0.4 | |||
|
Total minimum lease payments
|
20.4 | |||
|
Less: amounts representing interest
|
1.0 | |||
|
Present value of net minimum lease payments
|
$ | 19.4 | ||
Our investment and derivative instruments were carried at fair values as of December 31, 2010 and January 1, 2010, as presented in the following tables:
|
(In millions)
|
Total
Carrying
Value as of
December 31,
2010
|
Fair Value Measurement as of December 31, 2010
|
|||||||||||||
|
Quoted Prices in
Active Markets
(Level 1)
|
Significant Other Observable Inputs
(Level 2)
|
Significant Unobservable
Inputs (Level 3)
|
|||||||||||||
|
Interest rate instrument
|
$ |
1.0
|
$ |
—
|
$ |
1.0
|
$ |
—
|
|||||||
|
Short-term investment
|
0.5
|
—
|
0.5
|
—
|
|||||||||||
|
(In millions)
|
Total
Carrying
Value as of
January 1,
2010
|
Fair Value Measurement as of January 1, 2010
|
|||||||||||||
|
Quoted Prices in
Active Markets
(Level 1)
|
Significant Other Observable Inputs
(Level 2)
|
Significant Unobservable
Inputs (Level 3)
|
|||||||||||||
|
Interest rate instruments
|
$ |
7.1
|
$ |
—
|
$ |
7.1
|
$ |
—
|
|||||||
|
Short-term investments
|
30.7
|
—
|
30.7
|
—
|
|||||||||||
120
URS CORPORATION AND SUBSIDIARIES
NOTES TO CONSOLIDATED FINANCIAL STATEMENTS (Continued)
Our derivative instruments are used as a risk management tool and not for trading or speculative purposes. The fair values of our derivative instruments are based on mark-to-model measurements that are interpolated from observable market data and for the duration of each derivative’s term. The fair value of our short-term investment, consisting of an interest-bearing time deposit, approximates its carrying value based on the current market rates for similar instruments.
2007 Credit Facility
As of December 31, 2010 and January 1, 2010, the estimated current market value of term loans A and B, net of debt issuance costs, was approximately $3.3 million and $25.3 million less than the amount reported on our Consolidated Balance Sheets, respectively. The fair values of our term loans A and B were derived by taking the mid-point of the trading prices from an observable market input in the secondary loan market and multiplying it by the outstanding balance of our term loans. The increases in the fair values of our loans from January 1, 2010 to December 31, 2010 were mainly due to the market forces and credit rating upgrades by two outside credit rating agencies.
Interest Rate Instruments
Our 2007 Credit Facility is a floating-rate facility. We had a floating-for-fixed interest rate swap with a notional amount of $200.0 million, which expired on December 31, 2010, to hedge against changes in floating interest rates. As of December 31, 2010 and January 1, 2010, the fair values of our interest rate instruments were $1.0 million and $7.1 million, respectively, which were recorded in “Other current liabilities” on our Consolidated Balance Sheets. The adjustment to fair value of the swap liability was recorded in “Accumulated other comprehensive loss.” We recorded no gain or loss on our Consolidated Statements of Operations as our interest rate swap was an effective hedge. For other interest rate instruments, we recorded immaterial amounts to our Consolidated Statements of Operations.
Foreign Currency Exchange Contracts
We operate our business globally and our foreign subsidiaries conduct businesses in various foreign currencies. Therefore, we are subject to foreign currency risk. From time to time, we purchase derivative financial instruments in the form of foreign currency exchange contracts to manage specific foreign currency exposures.
On March 4, 2009, we entered into a foreign currency forward contract with a notional amount of €196.0 million (equivalent to U.S. $246.1 million per the contract) with a maturity window from April 15, 2009 to July 31, 2009. The primary objective of the contract was to manage our exposure to foreign currency transaction risk related to the Euro proceeds we received from the sale of our equity investment in MIBRAG, which closed on June 10, 2009. We designated €128.0 million (equivalent to U.S. $160.7 million at the contractual rate) of the contract as a hedge of our net investment in MIBRAG. On June 12, 2009, we settled our foreign currency forward contract. For the year ended January 1, 2010, we recorded a loss on the settlement of this contract of $27.7 million in “Other income, net” in our Consolidated Statements of Operations. The following table presents the components of our foreign currency forward contract loss:
|
(In millions)
|
Year Ended
January 1,
2010
|
|||
|
Effective hedge portion of the contract
|
$ | 17.9 | ||
|
Unhedged portion of the contract
|
9.8 | |||
|
Loss on settlement of foreign currency forward contract
|
$ | 27.7 | ||
121
URS CORPORATION AND SUBSIDIARIES
NOTES TO CONSOLIDATED FINANCIAL STATEMENTS (Continued)
The following table summarizes the components of billings in excess of costs and accrued earnings on contracts:
|
As of
|
||||||||
|
(In millions)
|
December 31,
2010
|
January 1,
2010
|
||||||
|
Billings in excess of costs and accrued earnings on contracts
|
$ | 167.8 | $ | 195.6 | ||||
|
Advance payments negotiated as a contract condition
|
57.9 | 10.1 | ||||||
|
Estimated losses on uncompleted contracts
|
27.4 | 19.0 | ||||||
|
Project-related legal liabilities and other project-related reserves
|
22.7 | 10.6 | ||||||
|
Total
|
$ | 275.8 | $ | 235.3 | ||||
The components of income tax expense were as follows:
|
Year Ended
|
||||||||||||
|
(In millions)
|
December 31,
2010
|
January 1,
2010
|
January 2,
2009
|
|||||||||
|
Current:
|
||||||||||||
|
Federal
|
$ | 120.3 | $ | 33.5 | $ | 26.7 | ||||||
|
State and local
|
22.5 | 18.7 | 19.4 | |||||||||
|
Foreign
|
1.2 | 17.8 | 19.1 | |||||||||
|
Subtotal
|
144.0 | 70.0 | 65.2 | |||||||||
|
Deferred:
|
||||||||||||
|
Federal
|
8.5 | 101.6 | 102.1 | |||||||||
|
State and local
|
3.9 | 4.0 | 6.4 | |||||||||
|
Foreign
|
(1.5 | ) | 2.0 | (0.9 | ) | |||||||
|
Subtotal
|
10.9 | 107.6 | 107.6 | |||||||||
|
Total income tax expense
|
$ | 154.9 | $ | 177.6 | $ | 172.8 | ||||||
The income before income taxes, by geographic area, was as follows:
|
Year Ended
|
||||||||||||
|
(In millions)
|
December 31,
2010
|
January 1,
2010
|
January 2,
2009
|
|||||||||
|
Income before income taxes:
|
||||||||||||
|
United States
|
$ | 430.9 | $ | 339.4 | $ | 373.8 | ||||||
|
International
|
82.9 | 129.1 | 40.6 | |||||||||
|
Total income before income taxes and noncontrolling interests
|
$ | 513.8 | $ | 468.5 | $ | 414.4 | ||||||
As of December 31, 2010 and January 1, 2010, we had remaining tax deductible goodwill of $338.0 million and $421.6 million, respectively, resulting from acquisitions by WGI before our acquisition of WGI, as well as from our other prior acquisitions. The amortization of tax goodwill is deductible over various periods ranging up to 12 years. The tax deduction for goodwill for 2011 is expected to be approximately $85 million and is expected to decrease slightly over the next three years and be substantially lower after four years.
122
URS CORPORATION AND SUBSIDIARIES
NOTES TO CONSOLIDATED FINANCIAL STATEMENTS (Continued)
As of December 31, 2010, our federal net operating loss (“NOL”) carryover was approximately $22.2 million. These federal NOL carryovers expire in years 2020 through 2025. In addition to the federal NOL, there are state income tax NOL carryovers in various taxing jurisdictions of approximately $395.2 million. These state NOL carryovers expire in years 2011 through 2027. There are also foreign NOL carryovers in various jurisdictions of approximately $365.3 million. The majority of the foreign NOL carryovers have no expiration date. At December 31, 2010, the federal, state and foreign NOL carryovers resulted in a deferred tax asset of $111.9 million with a valuation allowance of $94.5 million established against this tax asset. None of the remaining deferred tax assets related to NOL carryovers is individually material. Full recovery of the state and foreign NOL carryovers will require that the appropriate legal entity generate taxable income in the future at least equal to the amount of the NOL carryovers within the applicable taxing jurisdiction.
The significant components of our deferred tax assets and liabilities were as follows:
Deferred tax assets (liabilities) resulting from:
|
(In millions)
|
December 31,
2010
|
January 1,
2010
|
January 2,
2009
|
|||||||||
|
Current:
|
||||||||||||
|
Receivable allowances
|
$ | 6.1 | $ | 9.7 | $ | 7.0 | ||||||
|
Net operating losses
|
3.9 | 2.0 | 46.5 | |||||||||
|
Timing of income from partnerships and limited liability companies
|
8.2 | (2.1 | ) | 17.6 | ||||||||
|
Estimated loss accruals
|
38.7 | 30.8 | 31.5 | |||||||||
|
State income taxes
|
3.2 | 2.6 | 5.2 | |||||||||
|
Payroll-related accruals
|
74.4 | 96.1 | 76.0 | |||||||||
|
Self-insurance reserves
|
4.9 | 7.8 | 5.5 | |||||||||
|
Unearned revenue
|
0.1 | (0.5 | ) | 11.9 | ||||||||
|
Deferred compensation and post-retirement benefit accruals
|
3.7 | 3.3 | 3.4 | |||||||||
|
Proposal costs on pending contract awards
|
1.8 | 1.4 | 1.5 | |||||||||
|
Other
|
(0.4 | ) | 5.2 | 2.2 | ||||||||
|
Gross current deferred tax assets
|
144.6 | 156.3 | 208.3 | |||||||||
|
Valuation allowance
|
(7.4 | ) | (4.3 | ) | (7.3 | ) | ||||||
|
Current deferred tax assets
|
137.2 | 152.0 | 201.0 | |||||||||
|
Revenue on retained accounts receivable
|
(5.4 | ) | (9.1 | ) | (12.8 | ) | ||||||
|
Costs and accrued earnings in excess of billings on contracts
|
(37.4 | ) | (22.7 | ) | (9.6 | ) | ||||||
|
Prepaid expenses
|
(11.1 | ) | (8.7 | ) | (4.0 | ) | ||||||
|
Market value adjustment on acquired assets
|
— | (13.3 | ) | (13.5 | ) | |||||||
|
Current deferred tax liabilities
|
(53.9 | ) | (53.8 | ) | (39.9 | ) | ||||||
|
Net current deferred tax assets
|
$ | 83.3 | $ | 98.2 | $ | 161.1 | ||||||
123
URS CORPORATION AND SUBSIDIARIES
NOTES TO CONSOLIDATED FINANCIAL STATEMENTS (Continued)
|
(In millions)
|
December 31,
2010
|
January 1,
2010
|
January 2,
2009
|
|||||||||
|
Non-Current:
|
||||||||||||
|
Deferred compensation and post-retirement benefit accruals
|
$ | 104.0 | $ | 81.8 | $ | 83.6 | ||||||
|
Self-insurance reserves
|
35.0 | 37.3 | 46.8 | |||||||||
|
Property, plant and equipment
|
3.3 | 0.8 | 2.9 | |||||||||
|
Foreign tax credits
|
7.1 | 25.0 | 18.5 | |||||||||
|
Income tax credits
|
3.2 | 3.4 | 22.4 | |||||||||
|
Rental accruals
|
9.2 | 5.6 | 6.8 | |||||||||
|
Net operating losses
|
108.0 | 102.7 | 104.7 | |||||||||
|
Other reserves
|
24.5 | 21.1 | 12.0 | |||||||||
|
Acquisition restructuring reserves
|
0.8 | 2.3 | 5.5 | |||||||||
|
Gross non-current deferred tax assets
|
295.1 | 280.0 | 303.2 | |||||||||
|
Valuation allowance
|
(96.7 | ) | (83.2 | ) | (93.1 | ) | ||||||
|
Net non-current deferred tax assets
|
198.4 | 196.8 | 210.1 | |||||||||
|
Goodwill and other intangibles
|
(343.6 | ) | (290.6 | ) | (288.3 | ) | ||||||
|
Foreign subsidiary outside basis difference
|
(0.3 | ) | (47.7 | ) | (25.5 | ) | ||||||
|
Domestic subsidiary outside basis difference
|
(145.5 | ) | (145.6 | ) | (133.9 | ) | ||||||
|
Market value adjustment on acquired assets
|
(4.4 | ) | (4.4 | ) | (4.4 | ) | ||||||
|
Property, plant and equipment
|
(31.5 | ) | (33.2 | ) | (28.2 | ) | ||||||
|
Non-current deferred tax liabilities
|
(525.3 | ) | (521.5 | ) | (480.3 | ) | ||||||
|
Net non-current deferred tax liabilities
|
$ | (326.9 | ) | $ | (324.7 | ) | $ | (270.2 | ) | |||
We have indefinitely reinvested $363.8 million of undistributed earnings of our foreign operations outside of our U.S. tax jurisdiction as of December 31, 2010. No deferred tax liability has been recognized for the remittance of such earnings to the U.S. since it is our intention to utilize these earnings in our foreign operations. The determination of the amount of deferred taxes on these earnings is not practicable since the computation would depend on a number of factors that cannot be known unless a decision to repatriate the earnings is made.
The difference between total tax expense and the amount computed by applying the statutory federal income tax rate to income before taxes was as follows:
|
Year Ended
|
||||||||||||||||||||||||
|
(In millions, except percentages)
|
December 31,
2010
|
Tax Rate
|
January 1,
2010
|
Tax Rate
|
January 2,
2009
|
Tax Rate
|
||||||||||||||||||
|
US statutory rate applied to income before taxes
|
$ | 179.8 | 35.0 | % | $ | 164.0 | 35.0 | % | $ | 145.0 | 35.0 | % | ||||||||||||
|
State taxes, net of federal benefit
|
21.5 | 4.2 | % | 23.7 | 5.0 | % | 21.0 | 5.1 | % | |||||||||||||||
|
Change in indefinite reinvestment assertion
|
(57.2 | ) | (11.1 | %) | (14.7 | ) | (3.1 | %) | — | — | ||||||||||||||
|
Adjustments to valuation allowances
|
14.6 | 2.8 | % | (5.2 | ) | (1.1 | %) | — | — | |||||||||||||||
|
Change foreign tax credit to deduction
|
12.6 | 2.5 | % | — | — | — | — | |||||||||||||||||
|
Foreign income taxes at rates other than 35%
|
(19.8 | ) | (3.9 | %) | — | — | (0.6 | ) | (0.1 | %) | ||||||||||||||
|
Other adjustments
|
3.4 | 0.6 | % | 9.8 | 2.1 | % | 7.4 | 1.7 | % | |||||||||||||||
|
Total income tax expense
|
$ | 154.9 | 30.1 | % | $ | 177.6 | 37.9 | % | $ | 172.8 | 41.7 | % | ||||||||||||
124
URS CORPORATION AND SUBSIDIARIES
NOTES TO CONSOLIDATED FINANCIAL STATEMENTS (Continued)
The effective income tax rates for the years ended December 31, 2010, January 1, 2010, and January 2, 2009 are as follows:
|
Year Ended
|
Effective Income Tax Rates
|
|||||
|
December 31, 2010
|
30.1 | % | ||||
|
January 1, 2010
|
37.9 | % | ||||
|
January 2, 2009
|
41.7 | % | ||||
The reduction in the effective income tax rate for the year ended January 1, 2010 was due primarily to our determination made during the year that the undistributed earnings of those foreign subsidiaries we owned prior to the WGI acquisition that were previously indefinitely reinvested would no longer be indefinitely reinvested offshore. This determination resulted in the accrual of deferred U.S. tax liabilities on the undistributed earnings of these foreign subsidiaries and also the recognition of future foreign tax credits associated with their undistributed earnings. Because the foreign tax credits significantly exceeded our accrual of deferred U.S. tax liabilities on these undistributed earnings, our effective tax rate for the year was reduced. This rate reduction was partially offset by the establishment during the year of valuation allowances against existing deferred tax assets, and also by the write-off of foreign income tax receivables associated with prior earnings of some of our foreign subsidiaries that we determined during the year could not be collected.
During the first quarter of 2010, we determined that our plans to expand our international presence would require that we indefinitely reinvest the earnings of all of our foreign subsidiaries offshore. On February 16, 2010, we entered into a consent with our lenders related to our 2007 Credit Facility that permitted us to utilize the funds received in June 2009 from the sale of our equity investment in MIBRAG for general operating purposes. This consent allowed these funds to be indefinitely reinvested offshore to facilitate the implementation of our international growth strategy. The reduction in the effective income tax rate for the year ended December 31, 2010 was primarily due to the determination to reinvest the earnings of all of our foreign subsidiaries offshore, which resulted in the reversal of the net U.S. deferred tax liability on the undistributed earnings of all foreign subsidiaries. This reduction in the effective income tax rate increased net income attributable to URS by $42.1 million.
As of December 31, 2010 and January 1, 2010, we had $21.5 million and $25.2 million of unrecognized tax benefits, respectively. Included in the balance of unrecognized tax benefits at the end of fiscal year 2010 were $17.2 million of tax benefits, which, if recognized, would affect our effective tax rate. A reconciliation of the beginning and ending amount of unrecognized tax benefits is as follows:
|
(In millions)
|
December 31,
2010
|
January 1,
2010
|
January 2,
2009
|
|||||||||
|
Unrecognized tax benefits beginning balance
|
$ | 25.2 | $ | 51.3 | $ | 39.7 | ||||||
|
Gross increase – tax positions in prior years
|
1.1 | 3.0 | 13.0 | |||||||||
|
Gross decrease – tax positions in prior years
|
(0.1 | ) | (0.2 | ) | (1.1 | ) | ||||||
|
Gross increase – current period tax positions
|
1.4 | 0.5 | 1.7 | |||||||||
|
Settlements
|
(1.6 | ) | (27.6 | ) | (1.0 | ) | ||||||
|
Lapse of statute of limitations
|
(5.3 | ) | (1.8 | ) | (1.0 | ) | ||||||
|
Unrecognized tax benefits acquired in current year
|
0.8 | — | — | |||||||||
|
Unrecognized tax benefits ending balance
|
$ | 21.5 | $ | 25.2 | $ | 51.3 | ||||||
125
URS CORPORATION AND SUBSIDIARIES
NOTES TO CONSOLIDATED FINANCIAL STATEMENTS (Continued)
We recognize accrued interest related to unrecognized tax benefits in interest expense and penalties as a component of tax expense. During the years ended December 31, 2010, January 1, 2010, and January 2, 2009, we recognized $1.5 million, $0.5 million, and $1.6 million, respectively, in interest and penalties. We have accrued approximately $8.1 million and $5.6 million in interest and penalties as of December 31, 2010 and January 1, 2010, respectively. The unrecognized tax benefits settled during the year ended January 1, 2010 included all of the unrecognized tax benefits acquired in the WGI acquisition. With a few exceptions, in jurisdictions where our tax liability is immaterial, we are no longer subject to U.S. federal, state, local or foreign examinations by tax authorities for years before 2004.
It is reasonably possible that we will recognize up to $2.1 million in previously unrecognized tax benefits within the next twelve months as a result of the settlement of state and federal tax audits. The timing and amounts of these audit settlements are uncertain, but we do not expect any of these settlements to have a significant impact on our financial position or results of operations.
Defined Contribution Plans
Full- and part-time employees, and employees covered by collective bargaining agreements are generally able to participate in one of our defined contribution plans. Cash contributions to these defined contribution plans are based on either a percentage of employee contributions or on a specified amount per hour depending on the provisions of each plan. Effective January 1, 2011, the Washington Group International, Inc. 401(k) Retirement Savings Plan and the Retirement Savings Plan for Field Operations were merged with and into the URS Corporation 401(k) Retirement Plan. Subsequently, the account balances of some participants were transferred into the URS Corporation 401(k) Retirement Plan for Specified Contract Employees.
We made contributions of $83.0 million, $86.6 million and $82.5 million to our defined contribution plans during the years ended December 31, 2010, January 1, 2010, and January 2, 2009, respectively.
Some of our foreign subsidiaries have contributory trustee retirement plans covering substantially all of their employees. We made contributions in the amounts of approximately $13.1 million, $12.5 million, and $11.8 million for the years ended December 31, 2010, January 1, 2010, and January 2, 2009, respectively.
Deferred Compensation Plans
We maintain various deferred compensation plans, including a restoration plan for some executives of the Energy & Construction business. The Washington Group International, Inc. Voluntary Deferred Compensation Plan allows for deferral of salary and incentive compensation. The Washington Group International, Inc. Restoration Plan provides matching contributions on compensation not eligible for matching contributions under the Washington Group International, Inc. 401(k) Plan. As of December 31, 2010 and January 1, 2010, the accrued benefit amounts for our deferred compensation plans were $22.3 million and $22.8 million, respectively, and are included in pension, post-retirement and other benefit obligations.
Multiemployer Pension Plans
We participate in various construction-industry multiemployer pension plans. Generally, the plans provide defined benefits to substantially all employees covered by collective bargaining agreements. Under the Employee Retirement Income Security Act, a contributor to a multiemployer plan is liable, upon termination or withdrawal from a plan, for its proportionate share of a plan’s unfunded vested liability. The contributions to these plans were $46.5 million, $44.5 million, and $45.8 million for the years ended December 31, 2010, January 1, 2010, and January 2, 2009, respectively.
126
URS CORPORATION AND SUBSIDIARIES
NOTES TO CONSOLIDATED FINANCIAL STATEMENTS (Continued)
Defined Benefit Plans
We sponsor a number of pension and unfunded supplemental executive retirement plans, including the following significant plans.
We provide a defined benefit plan, the EG&G Technical Services, Inc. Employees Retirement Plan, to cover some of the Federal Services business’ hourly and salaried employees as well as our employees of a joint venture in which this business group participates. This pension plan provides retirement benefit payments for the life of participating retired employees. It was closed to new participants on June 30, 2003, but active participants continue to accrue benefits. All participants are fully vested in their benefits.
As part of our acquisition of Scott Wilson, we assumed two foreign defined benefit retirement plans: Scott Wilson Pension Scheme (“SWPS”) and Scott Wilson Railways Shared Cost Section of the Railways Pension Scheme (“RPS”). The SWPS is now closed to new participants and was closed to future accruals on October 1, 2010. The RPS is closed to new participants other than those who have an indefeasible right to join under U.K. law.
As part of the WGI acquisition in 2007, we assumed various defined benefit pension plans and unfunded supplemental retirement plans, including the Washington Government Services Group Pension Plan, the Washington Government Services Group Executive Pension Plan, the Washington Safety Management Solutions Pension Plan, and others, which primarily cover groups of current and former employees of the Energy & Construction business. No new employees will be eligible to participate in these plans. Accrued pension benefits for the qualified pension plans are based on pay and service through December 31, 2005. These plans were closed to future accruals after December 31, 2005.
We also provide a foreign defined benefit plan (“Final Salary Pension Fund”) in the U.K. The Final Salary Pension Fund provides retirement benefit payments for the life of participating retired employees and their spouses. In 2006, we made a decision pursuant to a formal curtailment plan to eliminate the accrual of defined benefits for all future benefits under the Final Salary Pension Fund.
Consistent with foreign laws, we may also contribute funds into foreign government-managed accounts or insurance companies for our foreign employees.
Valuation
We measure our pension costs according to actuarial valuations and the projected unit credit method is used to determine pension costs for financial accounting purposes.
The discount rates for our defined benefit plans were derived using an actuarial “bond model.” The model assumes that we purchase bonds with a credit rating of AA or better by Moody’s at prices based on a current bond yield and bond quality. The model develops the yield on this portfolio of bonds as of the measurement date. The cash flows from the bonds selected for the portfolio generally match our expected benefit payments in future years.
For our domestic plans, the Citigroup Pension Discount Spot Rate Curve was used to determine the yield differential for cash flow streams from appropriate quality bonds as of the measurement date. For our foreign plans, the iBoxx Corporate Bond Index (AA 15+ Year) or the U.K. Mercer Pension Discount Yield Curve was used to determine the yield differential for cash flow streams from appropriate quality bonds as of the measurement date.
The weighted average of the bond yields is determined based upon the estimated retirement payments in order to derive the discount rate used in calculating the present value of the pension plan obligations.
127
URS CORPORATION AND SUBSIDIARIES
NOTES TO CONSOLIDATED FINANCIAL STATEMENTS (Continued)
Our estimates of benefit obligations and assumptions used to measure those obligations for the defined benefit plans as of December 31, 2010 and January 1, 2010, were as follows:
|
Domestic Plans
|
Foreign Plans
|
|||||||||||||||
|
(In millions, except percentages)
|
December 31,
2010
|
January 1,
2010
|
December 31,
2010
|
January 1,
2010
|
||||||||||||
|
Change in benefit obligation:
|
||||||||||||||||
|
Benefit obligation at beginning of year
|
$ | 313.3 | $ | 285.7 | $ | 19.7 | $ | 10.9 | ||||||||
|
Service cost
|
6.1 | 6.0 | 0.3 | — | ||||||||||||
|
Interest cost
|
18.5 | 18.5 | 7.7 | 0.7 | ||||||||||||
|
Employee contributions
|
— | — | 0.5 | — | ||||||||||||
|
Benefits paid and expenses
|
(15.4 | ) | (14.8 | ) | (3.4 | ) | — | |||||||||
|
Liabilities assumed from the Scott Wilson acquisition
|
— | — | 400.7 | — | ||||||||||||
|
Exchange rate changes
|
— | — | 0.7 | 1.4 | ||||||||||||
|
Actuarial (gain) loss
|
27.7 | 17.9 | (7.6 | ) | 6.7 | |||||||||||
|
Benefit obligation at end of year
|
$ | 350.2 | $ | 313.3 | $ | 418.6 | $ | 19.7 | ||||||||
|
Change in plan assets:
|
||||||||||||||||
|
Fair value of plan assets at beginning of year
|
$ | 179.9 | $ | 147.7 | $ | 10.6 | $ | 7.5 | ||||||||
|
Actual gain on plan assets
|
21.0 | 27.3 | 17.0 | 1.1 | ||||||||||||
|
Employer contributions
|
14.9 | 14.8 | 2.4 | 1.1 | ||||||||||||
|
Employer direct benefit payments
|
5.0 | 4.9 | — | — | ||||||||||||
|
Employee contributions
|
— | — | 0.5 | — | ||||||||||||
|
Exchange rate changes
|
— | — | 0.4 | 0.9 | ||||||||||||
|
Assets obtained from the Scott Wilson acquisition
|
— | — | 318.3 | — | ||||||||||||
|
Benefits paid and expenses
|
(15.4 | ) | (14.8 | ) | (3.4 | ) | — | |||||||||
|
Fair value of plan assets at end of year
|
$ | 205.4 | $ | 179.9 | $ | 345.8 | $ | 10.6 | ||||||||
|
Underfunded status reconciliation:
|
||||||||||||||||
|
Underfunded status
|
$ | 144.8 | $ | 133.4 | $ | 72.8 | $ | 9.1 | ||||||||
|
Net amount recognized
|
$ | 144.8 | $ | 133.4 | $ | 72.8 | $ | 9.1 | ||||||||
|
Amounts recognized in our Consolidated Balance Sheets consist of:
|
||||||||||||||||
|
Accrued benefit liability included in current liabilities
|
$ | 4.9 | $ | 4.8 | $ | — | $ | — | ||||||||
|
Accrued benefit liability included in other long-term liabilities
|
139.9 | 128.6 | 72.8 | 9.1 | ||||||||||||
|
Net amount recognized
|
$ | 144.8 | $ | 133.4 | $ | 72.8 | $ | 9.1 | ||||||||
|
Amounts recognized in accumulated other comprehensive income consist of:
|
||||||||||||||||
|
Prior service income
|
$ | 5.7 | $ | 8.9 | $ | — | $ | — | ||||||||
|
Net gain (loss)
|
(93.7 | ) | (75.0 | ) | 11.9 | (5.5 | ) | |||||||||
|
Net amount recognized
|
$ | (88.0 | ) | $ | (66.1 | ) | $ | 11.9 | $ | (5.5 | ) | |||||
|
Additional information:
|
||||||||||||||||
|
Accumulated benefit obligation
|
$ | 344.6 | $ | 309.5 | $ | 418.6 | $ | 19.7 | ||||||||
|
Weighted-average assumptions used to determine benefit obligations at year end:
|
||||||||||||||||
|
Discount rate
|
5.55 | % | 6.05 | % | 5.70 | % | 5.75 | % | ||||||||
|
Rate of compensation increase
|
4.50 | % | 4.50 | % | 3.45 | % | N/A | |||||||||
128
URS CORPORATION AND SUBSIDIARIES
NOTES TO CONSOLIDATED FINANCIAL STATEMENTS (Continued)
Net periodic pension costs and other comprehensive income included the following components for the years ended December 31, 2010, January 1, 2010, and January 2, 2009:
|
Domestic Plans
|
Foreign Plans
|
|||||||||||||||||||||||
|
(In millions, except percentages)
|
December 31,
2010
|
January 1,
2010
|
January 2,
2009
|
December 31,
2010 (1)
|
January 1,
2010
|
January 2,
2009
|
||||||||||||||||||
|
Net periodic pension costs:
|
||||||||||||||||||||||||
|
Service cost
|
$ | 6.1 | $ | 6.0 | $ | 6.3 | $ | 0.3 | $ | — | $ | — | ||||||||||||
|
Interest cost
|
18.5 | 18.5 | 18.0 | 7.7 | 0.7 | 1.0 | ||||||||||||||||||
|
Expected return on assets
|
(15.9 | ) | (15.0 | ) | (15.2 | ) | (7.2 | ) | (0.4 | ) | (0.4 | ) | ||||||||||||
|
Amortization of prior service cost
|
(3.2 | ) | (3.2 | ) | (2.0 | ) | — | — | — | |||||||||||||||
|
Recognized actuarial loss
|
3.7 | 1.1 | — | 0.1 | — | — | ||||||||||||||||||
|
Curtailment gain (2)
|
— | — | (0.9 | ) | — | — | — | |||||||||||||||||
|
Total net periodic pension costs
|
$ | 9.2 | $ | 7.4 | $ | 6.2 | $ | 0.9 | $ | 0.3 | $ | 0.6 | ||||||||||||
|
Other changes in plan assets and benefit obligations recognized in other comprehensive income:
|
||||||||||||||||||||||||
|
Prior service cost
|
$ | — | $ | — | $ | (3.8 | ) | $ | — | $ | — | $ | — | |||||||||||
|
Net loss (gain)
|
22.5 | 5.7 | 66.8 | (17.4 | ) | 6.0 | (4.6 | ) | ||||||||||||||||
|
Effect of exchange rate changes on amounts included in accumulated other comprehensive income
|
— | — | — | 0.1 | 0.1 | (1.2 | ) | |||||||||||||||||
|
Amortization or curtailment recognition of prior service credit
|
3.2 | 3.2 | 2.0 | — | — | — | ||||||||||||||||||
|
Amortization or settlement recognition of net loss
|
(3.7 | ) | (1.1 | ) | — | (0.1 | ) | — | (0.1 | ) | ||||||||||||||
|
Total recognized in other comprehensive loss (income)
|
$ | 22.0 | $ | 7.8 | $ | 65.0 | $ | (17.4 | ) | $ | 6.1 | $ | (5.9 | ) | ||||||||||
|
Total recognized in net periodic pension costs and other comprehensive loss (income)
|
$ | 31.2 | $ | 15.2 | $ | 71.2 | $ | (16.5 | ) | $ | 6.4 | $ | (5.3 | ) | ||||||||||
|
Weighted-average assumptions used to determine net periodic cost for years ended:
|
||||||||||||||||||||||||
|
Discount rate
|
6.05 | % | 6.62 | % | 6.75 | % | 5.45 | % | 6.40 | % | 5.60 | % | ||||||||||||
|
Rate of compensation increase
|
4.50 | % | 4.50 | % | 4.50 | % | 3.45 | % | N/A | N/A | ||||||||||||||
|
Expected long-term rate of return on plan assets
|
7.89 | % | 8.00 | % | 8.00 | % | 6.67 | % | 5.10 | % | 4.50 | % | ||||||||||||
|
Measurement dates
|
1/1/2010
|
1/2/2009
|
12/28/2007
|
1/1/2010
&
9/10/2010
|
1/2/2009
|
12/31/2007
|
||||||||||||||||||
|
(1)
|
Measurement date for two Scott Wilson plans was September 10, 2010, the acquisition date.
|
|
(2)
|
The curtailment gain was a result of the termination of a customer contract, which resulted in a reduction in our workforce.
|
129
URS CORPORATION AND SUBSIDIARIES
NOTES TO CONSOLIDATED FINANCIAL STATEMENTS (Continued)
Investment policies & strategies
Our investment policies and strategies are to seek a competitive rate of return relative to an appropriate level of risk depending on the funded status and obligations of each plan. The plans' investment managers employ both active and passive investment management strategies with the goal of matching or outperforming the broad markets in which they invest. Our risk management practices include diversification across asset classes and investment styles and periodic rebalancing toward asset allocation targets. The target asset allocation selected for each domestic plan reflects a risk/return profile that we believe is appropriate relative to each plan's liability structure and return goals. We conduct periodic asset-liability studies for domestic plan assets in order to model various potential asset allocations in comparison to each plan's forecasted liabilities and liquidity needs. For the foreign plans, asset allocation decisions are generally made by an independent board of trustees, or similar governing body.
For our domestic and foreign plans, investment objectives are aligned to generate returns that will enable the plans to meet their future obligations.
The assumptions we use in determining the expected long-term rate of return on plan assets are based on an actuarial analysis. This analysis includes a review of anticipated future long-term performance of individual asset classes and consideration of the appropriate asset allocation strategy, given the anticipated requirements of the plan, to determine the average rate of earnings expected on the funds invested to provide for the pension plan benefits. While the study gives appropriate consideration to recent fund performance and historical returns, the assumption is primarily a long-term, prospective rate.
Our weighted-average target asset allocation for the defined benefit plans is as follows:
|
Current Target Asset Allocation
|
||||||||
|
Domestic Plans
|
Foreign Plans
|
|||||||
|
Equity securities
|
50 | % | 43 | % | ||||
|
Debt securities
|
50 | % | 30 | % | ||||
|
Real estate
|
— | 15 | % | |||||
|
Hedge fund
|
— | 10 | % | |||||
|
Other
|
— | 2 | % | |||||
|
Total
|
100 | % | 100 | % | ||||
We expect to make cash contributions, including estimated employer direct benefit payments, during 2011 of approximately $30.4 million to the domestic and foreign defined benefit plans.
As of December 31, 2010, the estimated portions of the net loss and the prior service credit in accumulated other comprehensive income that will be recognized as components of net periodic benefit cost over the next fiscal year are $7.2 million and $3.2 million, respectively. In addition, the estimated future benefit payments to be paid out in the next ten years are as follows:
|
Estimated Future Benefit Payments
|
||||||||
|
For the Fiscal Year:
|
Domestic Plans
|
Foreign Plans
|
||||||
|
(In millions)
|
||||||||
|
2011
|
$ | 17.3 | $ | 11.7 | ||||
|
2012
|
34.7 | 12.7 | ||||||
|
2013
|
19.2 | 13.7 | ||||||
|
2014
|
20.2 | 14.8 | ||||||
|
2015
|
20.8 | 16.1 | ||||||
|
Next five fiscal years thereafter
|
114.9 | 103.0 | ||||||
| $ | 227.1 | $ | 172.0 | |||||
130
URS CORPORATION AND SUBSIDIARIES
NOTES TO CONSOLIDATED FINANCIAL STATEMENTS (Continued)
Post-retirement Benefit Plans
We sponsor a number of retiree health and life insurance benefit plans (post-retirement benefit plans) for our Energy & Construction and Federal Services businesses. Post-retirement benefit plans provide medical and life insurance benefits to employees who meet eligibility requirements. All of these benefits may be subject to deductibles, co-payment provisions, and other limitations. The post-retirement benefits provided under company-sponsored health care and life insurance plans of the Energy & Construction business were frozen. We have reserved the right to amend or terminate the post-retirement benefits currently provided under the plans and may increase retirees’ cash contributions at any time.
Valuation
Our measures of the accumulated benefit obligation and net periodic benefit costs reflect amounts associated with the Medicare subsidy. We measure our post-retirement benefit costs according to actuarial valuations and the projected unit credit method is used to determine post-retirement benefit costs for financial accounting purposes.
The discount rate was derived using a “bond model” and adjusted for the benefit duration for each plan. The Citigroup Pension Discount Spot Rate Curve was used to determine the yield differential for cash flow streams from appropriate quality bonds as of the measurement date. The yield differential was applied to the bond model rate to derive the discount rate.
131
URS CORPORATION AND SUBSIDIARIES
NOTES TO CONSOLIDATED FINANCIAL STATEMENTS (Continued)
Our estimates of aggregated benefit obligations and assumptions used to measure those obligations of the post-retirement benefit plans at December 31, 2010 and January 1, 2010 were as follows:
|
(In millions)
|
December 31,
2010
|
January 1,
2010
|
||||||
|
Change in accumulated post-retirement benefit obligation:
|
||||||||
|
Accumulated post-retirement benefit obligation at beginning of year
|
$ | 41.1 | $ | 40.5 | ||||
|
Service cost
|
0.1 | 0.1 | ||||||
|
Interest cost
|
2.2 | 2.5 | ||||||
|
Participant contributions
|
2.1 | 1.9 | ||||||
|
Benefits paid and expenses
|
(5.8 | ) | (5.3 | ) | ||||
|
Actuarial gain
|
0.4 | 1.4 | ||||||
|
Accumulated post-retirement benefit obligation at end of year
|
$ | 40.1 | $ | 41.1 | ||||
|
Change in plan assets:
|
||||||||
|
Fair value of plan assets at beginning of year
|
$ | 3.2 | $ | 2.7 | ||||
|
Actual gain on plan assets
|
0.4 | 0.5 | ||||||
|
Employer contributions
|
0.4 | 0.2 | ||||||
|
Employer direct benefit payments
|
3.3 | 3.2 | ||||||
|
Participant contributions
|
2.1 | 1.9 | ||||||
|
Benefits paid and expenses
|
(5.8 | ) | (5.3 | ) | ||||
|
Fair value of plan assets at end of year
|
$ | 3.6 | $ | 3.2 | ||||
|
Funded status reconciliation:
|
||||||||
|
Unfunded status
|
$ | 36.5 | $ | 37.9 | ||||
|
Net amount recognized
|
$ | 36.5 | $ | 37.9 | ||||
|
Amounts recognized in our Consolidated Balance Sheets consist of:
|
||||||||
|
Noncurrent assets
|
$ | (1.2 | ) | $ | (0.9 | ) | ||
|
Accrued post-retirement benefit liability included in current liabilities
|
3.3 | 3.4 | ||||||
|
Accrued post-retirement benefit liability included in other long-term liabilities
|
34.4 | 35.4 | ||||||
|
Net amount recognized
|
$ | 36.5 | $ | 37.9 | ||||
|
Amounts recognized in accumulated other comprehensive income consist of:
|
||||||||
|
Net gain
|
$ | 1.0 | $ | 1.4 | ||||
|
Net amount recognized
|
$ | 1.0 | $ | 1.4 | ||||
|
Weighted-average assumptions used to determine benefit obligations at year end:
|
||||||||
|
Discount rate
|
5.23 | % | 5.72 | % | ||||
132
URS CORPORATION AND SUBSIDIARIES
NOTES TO CONSOLIDATED FINANCIAL STATEMENTS (Continued)
Net periodic post-retirement benefit costs and other comprehensive income included the following components for the years ended December 31, 2010, January 1, 2010, and January 2, 2009:
|
Year Ended
|
||||||||||||
|
(In millions, except percentages)
|
December 31,
2010
|
January 1,
2010
|
January 2,
2009
|
|||||||||
|
Net periodic post-retirement benefit costs:
|
||||||||||||
|
Service cost
|
$ | 0.1 | $ | 0.1 | $ | 0.1 | ||||||
|
Interest cost
|
2.2 | 2.5 | 2.5 | |||||||||
|
Expected return on assets
|
(0.2 | ) | (0.2 | ) | (0.3 | ) | ||||||
|
Recognized actuarial gain
|
(0.2 | ) | (0.2 | ) | (0.2 | ) | ||||||
|
Total net periodic post-retirement benefit costs
|
$ | 1.9 | $ | 2.2 | $ | 2.1 | ||||||
|
Other changes in plan assets and benefit obligations recognized in other comprehensive income:
|
||||||||||||
|
Net loss
|
$ | 0.2 | $ | 1.0 | $ | 0.9 | ||||||
|
Amortization or settlement recognition of net gain
|
0.2 | 0.2 | 0.2 | |||||||||
|
Total recognized in other comprehensive loss
|
$ | 0.4 | $ | 1.2 | $ | 1.1 | ||||||
|
Total recognized in net periodic post-retirement benefit costs and other comprehensive loss
|
$ | 2.3 | $ | 3.4 | $ | 3.2 | ||||||
|
Weighted-average assumptions used to determine net periodic cost for years ended:
|
||||||||||||
|
Discount rate
|
5.72 | % | 6.59 | % | 6.48 | % | ||||||
|
Expected long-term rate of return on plan assets
|
8.00 | % | 8.00 | % | 8.50 | % | ||||||
|
Measurement dates
|
1/1/2010
|
1/2/2009
|
12/28/2007
|
|||||||||
|
December 31,
2010
|
January 1,
2010
|
|||||||
|
Assumed health care cost trend rates at year-end:
|
||||||||
|
Health care cost trend rate assumed for next year
|
8.54 | % | 10.00 | % | ||||
|
Rate to which the cost trend rate is assumed to decline (the ultimate trend rate)
|
4.95 | % | 5.00 | % | ||||
|
Year that the rate reaches the ultimate trend rate
|
2016/2024 | 2016/2021 | ||||||
Assumed health care costs trend rates have a significant effect on the health care plan. A one percentage point change in assumed health care costs trend rates would have the following effects on net periodic cost for the year ended December 31, 2010 and the accumulated post-retirement benefit obligation as of December 31, 2010:
|
1% Point
|
||||||||
|
(In millions)
|
Increase
|
Decrease
|
||||||
|
Effect on total of service and interest cost components
|
$ | 0.1 | $ | (0.1 | ) | |||
|
Effect on post-retirement benefit obligation
|
1.8 | (1.6 | ) | |||||
133
URS CORPORATION AND SUBSIDIARIES
NOTES TO CONSOLIDATED FINANCIAL STATEMENTS (Continued)
Investment policies & strategies
Among all the post retirement benefit plans we sponsor, the post-retirement medical plan of the Federal Services business is a funded plan and the plan assets are invested in a master trust. The other post-retirement benefit plans are unfunded. The investment policies and strategies of our funded post-retirement benefit plan are the same as previously described in the “Defined Benefit Plans” section.
Our weighted-average target asset allocation for the funded post-retirement benefit plans is as follows:
|
Current Target
Asset Allocation
|
||||
|
Equity securities
|
50 | % | ||
|
Debt securities
|
50 | % | ||
|
Total
|
100 | % | ||
We currently expect to make cash contributions, including estimated employer direct benefit payments, of approximately $3.5 million to the post-retirement benefit plans for 2011.
As of December 31, 2010, the estimated portions of the net gain and the prior service cost (credit) in accumulated other comprehensive income that will be recognized as components of net periodic benefit cost over the next fiscal year are $0.1 million and zero, respectively. Our Medicare Part D subsidy receipts were $0.5 million in both fiscal years 2010 and 2009. In addition, the estimated future benefit payments to be paid out and estimated Medicare subsidy receipts in the next ten years are as follows:
|
For the Fiscal Year:
|
Estimated Future Benefit Payments
|
Estimated Medicare Subsidy Receipts
|
||||||
|
(In millions)
|
||||||||
|
2011
|
$ | 3.5 | $ | 0.5 | ||||
|
2012
|
3.5 | 0.5 | ||||||
|
2013
|
3.6 | 0.4 | ||||||
|
2014
|
3.6 | 0.4 | ||||||
|
2015
|
3.6 | 0.4 | ||||||
|
Next five fiscal years thereafter
|
16.5 | 1.4 | ||||||
| $ | 34.3 | $ | 3.6 | |||||
134
URS CORPORATION AND SUBSIDIARIES
NOTES TO CONSOLIDATED FINANCIAL STATEMENTS (Continued)
Fair Values of Defined Benefit Plans and Post-retirement Benefit Plan Assets
As of December 31, 2010 and January 1, 2010, the fair values of our defined benefit plan assets by the major asset categories are as follows:
|
(In millions)
|
Total Carrying
Value as of
December 31,
2010
|
Fair Value Measurement as of December 31, 2010
|
|||||||||||||
|
Quoted Prices in
Active Markets
(Level 1)
|
Significant Other Observable Inputs
(Level 2)
|
Significant Unobservable
Inputs
(Level 3)
|
|||||||||||||
|
Cash and cash equivalents
|
$ |
6.7
|
$ |
0.4
|
$ |
6.3
|
$ |
—
|
|||||||
|
U.S. equity funds
|
70.5
|
—
|
70.5
|
—
|
|||||||||||
| International equity funds | 182.6 | — | 182.6 | — | |||||||||||
| Fixed income securities | 201.0 | — | 201.0 | — | |||||||||||
| International property fund | 90.4 | — | 90.4 | — | |||||||||||
| Total | $ | 551.2 | $ | 0.4 | $ | 550.8 | $ | — | |||||||
|
(In millions)
|
Total Carrying
Value as of
January 1,
2010
|
Fair Value Measurement as of January 1, 2010
|
|||||||||||||
|
Quoted Prices in
Active Markets
(Level 1)
|
Significant Other Observable Inputs
(Level 2)
|
Significant Unobservable
Inputs
(Level 3)
|
|||||||||||||
|
Cash and cash equivalents
|
$ |
1.7
|
$ |
0.6
|
$ |
1.1
|
$ |
—
|
|||||||
|
U.S. equity funds
|
71.8
|
—
|
71.8
|
—
|
|||||||||||
| International equity funds | 30.9 | — | 30.9 | — | |||||||||||
| Fixed income securities | 83.7 | — | 83.7 | — | |||||||||||
| International property fund | 2.4 | — | 2.4 | — | |||||||||||
| Total | $ | 190.5 | $ | 0.6 | $ | 189.9 | $ | — | |||||||
As of December 31, 2010 and January 1, 2010, the fair values of our post-retirement benefit plan assets by the major asset categories are as follows:
|
(In millions)
|
Total Carrying
Value as of
December 31,
2010
|
Fair Value Measurement as of December 31, 2010
|
|||||||||||||
|
Quoted Prices in
Active Markets
(Level 1)
|
Significant Other Observable Inputs
(Level 2)
|
Significant Unobservable
Inputs
(Level 3)
|
|||||||||||||
|
U.S. equity funds
|
$ |
1.2
|
$ |
—
|
$ |
1.2
|
$ |
—
|
|||||||
| International equity funds | 0.7 | — | 0.7 | — | |||||||||||
| International property fund | 1.7 | — | 1.7 | — | |||||||||||
| Total | $ | 3.6 | $ | — | $ | 3.6 | $ | — | |||||||
|
(In millions)
|
Total Carrying
Value as of
January 1,
2010
|
Fair Value Measurement as of January 1, 2010
|
|||||||||||||
|
Quoted Prices in
Active Markets
(Level 1)
|
Significant Other Observable Inputs
(Level 2)
|
Significant Unobservable
Inputs
(Level 3)
|
|||||||||||||
|
U.S. equity funds
|
$ |
1.1
|
$ |
—
|
$ |
1.1
|
$ |
—
|
|||||||
| International equity funds | 0.6 | — | 0.6 | — | |||||||||||
| International property fund | 1.5 | — | 1.5 | — | |||||||||||
| Total | $ | 3.2 | $ | — | $ | 3.2 | $ | — | |||||||
Level 1: The fair values of the plans’ interest in cash.
Level 2: The fair values of the plans’ interest in common collective trust funds are based on quoted prices for identical or similar assets in active markets, quoted prices for identical or similar assets in inactive markets, inputs other than quoted prices that are observable for the asset, and/or inputs that are derived principally from or corroborated by observable market data by correlation or other means. If the asset has a specified (contractual) term, the level 2 input must be observable for substantially the full term of the asset.
135
URS CORPORATION AND SUBSIDIARIES
NOTES TO CONSOLIDATED FINANCIAL STATEMENTS (Continued)
Equity Incentive Plans
As of December 31, 2010, approximately 2.1 million shares were issued as restricted stock awards and 0.2 million shares were issuable upon the vesting of restricted stock units under our 2008 Equity Incentive Plan (the “2008 Plan”). In addition, approximately 2.7 million shares remained reserved for future grant under the 2008 Plan. The 2008 Plan replaced our 1999 Equity Incentive Plan (“1999 Plan”). Although the 1999 Plan became inactive, as of December 31, 2010, we still had approximately 0.6 million shares of nonvested restricted stock awards and restricted stock units and approximately 0.6 million shares of outstanding unexercised stock options that had been granted under the 1999 Plan.
Stock Repurchase Program
On September 10, 2010, the Board of Directors approved an increase and extension of the stock repurchase program that conformed to the terms of our 2007 Credit Facility, as amended. Under the modified stock repurchase program, we are authorized to repurchase, in each of the fiscal years during the period from January 2, 2010 through January 2, 2015, up to three million shares of our common stock, plus the number of shares of common stock equal to the excess, if any, of three million shares over the actual number of shares repurchased during the prior fiscal year. In addition, we are subject to covenants under our 2007 Credit Facility that may limit our ability to repurchase stock if we do not maintain various designated financial criteria.
On February 25, 2011, our Board of Directors authorized an increase in the number of our common shares that we may repurchase in fiscal year 2011 from 3.0 million shares to 8.0 million shares effected through open market purchases or privately negotiated transactions as permitted by securities laws and other legal and contractual requirements, and subject to market conditions and other factors. The Board of Directors may modify, suspend, extend or terminated the program at any time. This increase in the stock repurchase authorization was reflected in the third amendment to the 2007 Credit Facility. Any repurchase of shares will reduce our available cash balances.
During the year ended December 31, 2010, we repurchased 3.0 million shares of our common stock, which are held as treasury stock, at an average price of $42.75 per common share for approximately $128.2 million. During the year ended January 1, 2010, we repurchased 1.0 million shares of our common stock at an average price of $41.23 per common share for approximately $41.2 million.
Stock-Based Compensation
We recognize stock-based compensation expense, net of estimated forfeitures, over the vesting periods in “General and administrative expenses” and “Cost of revenues” in our Consolidated Statements of Operations.
The following table presents our stock-based compensation expense recognized for the years ended December 31, 2010, January 1, 2010, and January 2, 2009:
|
Years Ended
|
||||||||||||
|
(In millions)
|
December 31,
2010
|
January 1,
2010
|
January 2,
2009
|
|||||||||
|
Stock-based compensation expense:
|
||||||||||||
|
Restricted stock awards and units
|
$ | 43.6 | $ | 40.2 | $ | 30.3 | ||||||
|
Employee stock purchase plan
|
0.4 | 1.0 | — | |||||||||
|
Stock-based compensation expense
|
$ | 44.0 | $ | 41.2 | $ | 30.3 | ||||||
|
Total income tax benefits recognized in our net income related to stock-based compensation expense
|
$ | 16.9 | $ | 15.8 | $ | 11.7 | ||||||
136
URS CORPORATION AND SUBSIDIARIES
NOTES TO CONSOLIDATED FINANCIAL STATEMENTS (Continued)
Employee Stock Purchase Plan
Our Employee Stock Purchase Plan (“ESPP”) allows qualifying employees to purchase shares of our common stock through payroll deductions of up to 10% of their compensation, subject to Internal Revenue Code limitations, at a price of 95% of the fair market value as of the end of each of the six-month offering periods. The offering periods commence on January 1 and July 1 of each year.
For the years ended December 31, 2010, January 1, 2010, and January 2, 2009, employees purchased approximately 228,000, 219,000, and 353,000 shares under our ESPP, respectively. Cash proceeds generated from employee stock option exercises and purchases by employees under our ESPP for the years ended December 31, 2010, January 1, 2010, and January 2, 2009 were $11.3 million, $15.7 million, and $27.2 million, respectively.
Restricted Stock Awards and Units
Restricted stock awards and units generally vest over a four-year period. Vesting of some awards is subject to both service requirements and performance conditions. Restricted stock awards and units with a performance condition vest upon the fulfillment of service requirements and achievement of an annual net income target, established in the first quarter of the fiscal year preceding the vesting date. Our awards are measured based on the stock price on the date that all of the key terms and conditions related to the award are known and are expensed over their respective vesting periods. Restricted stock awards and restricted stock units are expensed on a straight-line basis over their respective vesting periods subject to the probability of meeting performance and service requirements.
As of December 31, 2010, we had estimated unrecognized stock-based compensation expense of $82.1 million related to nonvested restricted stock awards and units. This expense is expected to be recognized over a weighted-average period of 2.4 years. The following table summarizes the total fair values of vested shares, according to their contractual terms, and the grant date fair values of restricted stock awards and units granted during the years ended December 31, 2010 and January 1, 2010:
|
(In millions)
|
December 31,
2010
|
January 1,
2010
|
||||||
|
Fair values of shares vested
|
$ | 42.1 | $ | 32.7 | ||||
|
Grant date fair values of restricted stock awards and units granted
|
$ | 42.6 | $ | 50.9 | ||||
A summary of the status and changes of our nonvested restricted stock awards and units, according to their contractual terms, as of and during the year ended December 31, 2010 is presented below:
|
Shares
|
Weighted-Average Grant Date Fair Value
|
|||||||
|
Nonvested at January 1, 2010
|
2,644,571 | $ | 42.16 | |||||
|
Granted
|
975,917 | $ | 43.63 | |||||
|
Vested
|
(1,011,354 | ) | $ | 41.65 | ||||
|
Forfeited
|
(111,269 | ) | $ | 42.56 | ||||
|
Nonvested at December 31, 2010
|
2,497,865 | $ | 42.92 | |||||
137
URS CORPORATION AND SUBSIDIARIES
NOTES TO CONSOLIDATED FINANCIAL STATEMENTS (Continued)
Stock Options
We have not granted any stock options since September 2005. Stock options expire in ten years from the date of grant. A summary of the status and changes of the stock options, according to the contractual terms, from December 28, 2007 through December 31, 2010 are presented below:
|
Options
|
Weighted-Average Exercise Price
|
Weighted-Average Remaining Contractual Term
(In years)
|
Aggregate Intrinsic Value
(In millions)
|
|||||||||||||
|
Outstanding at December 28, 2007
|
1,605,957 | $ | 22.60 | 4.74 | $ | 51.7 | ||||||||||
|
Exercised
|
(561,585 | ) | $ | 22.26 | ||||||||||||
|
Forfeited/expired/cancelled
|
(9,768 | ) | $ | 23.93 | ||||||||||||
|
Outstanding at January 2, 2009
|
1,034,604 | $ | 22.77 | 4.31 | $ | 19.3 | ||||||||||
|
Exercised
|
(259,248 | ) | $ | 22.16 | ||||||||||||
|
Forfeited/expired/cancelled
|
(9,290 | ) | $ | 21.84 | ||||||||||||
|
Outstanding at January 1, 2010
|
766,066 | $ | 22.99 | 3.46 | $ | 16.5 | ||||||||||
|
Exercised
|
(115,636 | ) | $ | 21.03 | ||||||||||||
|
Forfeited/expired/cancelled
|
(5,834 | ) | $ | 18.13 | ||||||||||||
|
Outstanding and exercisable at December 31, 2010
|
644,596 | $ | 23.38 | 2.62 | $ | 11.7 | ||||||||||
The aggregate intrinsic value in the preceding table represents the total pre-tax intrinsic value, based on our closing price of $41.61 as of the last trading day of our 2010 fiscal year, which would have been received by the option holders had all option holders exercised their options as of that date.
For the fiscal years ended December 31, 2010, January 1, 2010, and January 2, 2009, the aggregate intrinsic value of stock options exercised, determined as of the date of option exercise, was $3.0 million, $6.1 million, and $12.1 million, respectively. Since all of our stock option awards were fully vested in fiscal year 2008, we did not have any stock-based compensation expense related to stock option awards nor any unrecognized related expense. The total fair value of shares vested during the year ended January 2, 2009 was $0.1 million.
138
URS CORPORATION AND SUBSIDIARIES
NOTES TO CONSOLIDATED FINANCIAL STATEMENTS (Continued)
We operate our business through the following three segments:
|
·
|
Infrastructure & Environment business (formerly referred to as the URS Division) provides program management, planning, design, engineering, construction and construction management, operations and maintenance, and decommissioning and closure services to the U.S. federal government, state and local government agencies, and private sector clients in the U.S. and internationally. The results for Scott Wilson, which we acquired on September 10, 2010, are reported under the Infrastructure & Environment business.
|
|
·
|
Federal Services business (formerly referred to as the EG&G Division) provides services to various U.S. federal government agencies, primarily the Departments of Defense and Homeland Security. These services include program management, planning, design and engineering, systems engineering and technical assistance, construction and construction management, operations and maintenance, and decommissioning and closure.
|
|
·
|
Energy & Construction business (formerly referred to as the Washington Division) provides program management, planning, design, engineering, construction and construction management, operations and maintenance, and decommissioning and closure services to the U.S. federal government, state and local government agencies, and private sector clients in the U.S. and internationally.
|
These three segments operate under separate management groups and produce discrete financial information. Their operating results also are reviewed separately by management. The accounting policies of the reportable segments are the same as those described in the summary of significant accounting policies. The information disclosed in our consolidated financial statements is based on the three segments that comprise our current organizational structure.
Prior to January 1, 2010, our Infrastructure & Environment, Federal Services and Energy & Construction businesses were referred to as the URS, EG&G and Washington Divisions, respectively. However, effective January 1, 2010, we rebranded our EG&G and Washington Divisions under the URS name to present a single brand to our clients in the marketplace. In conjunction with this rebranding initiative, we renamed these businesses as outlined above, for both internal communications and segment reporting purposes. The renaming of these businesses did not affect our internal organization or reporting segments.
139
URS CORPORATION AND SUBSIDIARIES
NOTES TO CONSOLIDATED FINANCIAL STATEMENTS (Continued)
The following tables present summarized financial information for our reportable segments. “Inter-segment, eliminations and other” in the following tables include elimination of inter-segment sales and investments in subsidiaries. The segment balance sheet information presented below is included only for informational purposes. We do not allocate resources based upon the balance sheet amounts of individual segments. Our long-lived assets primarily consist of property and equipment.
|
Year Ended
|
||||||||||||
|
(In millions)
|
December 31,
2010
|
January 1,
2010
|
January 2,
2009
|
|||||||||
|
Revenues
|
||||||||||||
|
Infrastructure & Environment
|
$ | 3,248.5 | $ | 3,170.4 | $ | 3,395.6 | ||||||
|
Federal Services
|
2,582.8 | 2,561.3 | 2,415.7 | |||||||||
|
Energy & Construction
|
3,420.6 | 3,583.9 | 4,328.9 | |||||||||
|
Inter-segment, eliminations and other
|
(74.8 | ) | (66.5 | ) | (53.9 | ) | ||||||
|
Total revenues
|
$ | 9,177.1 | $ | 9,249.1 | $ | 10,086.3 | ||||||
|
Equity in income of unconsolidated joint ventures
|
||||||||||||
|
Infrastructure & Environment
|
$ | 2.9 | $ | 6.2 | $ | 11.8 | ||||||
|
Federal Services
|
5.9 | 5.7 | 7.3 | |||||||||
|
Energy & Construction
|
61.5 | 89.0 | 87.2 | |||||||||
|
Total equity in income of unconsolidated joint ventures
|
$ | 70.3 | $ | 100.9 | $ | 106.3 | ||||||
|
Contribution (1)
|
||||||||||||
|
Infrastructure & Environment
|
$ | 247.2 | $ | 267.0 | $ | 253.2 | ||||||
|
Federal Services
|
189.3 | 168.4 | 152.0 | |||||||||
|
Energy & Construction
|
180.2 | 193.4 | 216.4 | |||||||||
|
General and administrative expenses
|
(110.9 | ) | (107.1 | ) | (100.3 | ) | ||||||
|
Total Contribution
|
$ | 505.8 | $ | 521.7 | $ | 521.3 | ||||||
|
Operating income
|
||||||||||||
|
Infrastructure & Environment
|
$ | 222.9 | $ | 255.7 | $ | 242.7 | ||||||
|
Federal Services
|
165.6 | 143.2 | 130.1 | |||||||||
|
Energy & Construction
|
226.9 | 145.9 | 211.0 | |||||||||
|
General and administrative expenses (2)
|
(71.0 | ) | (75.8 | ) | (78.7 | ) | ||||||
|
Total operating income
|
$ | 544.4 | $ | 469.0 | $ | 505.1 | ||||||
|
Capital expenditures
|
||||||||||||
|
Infrastructure & Environment
|
$ | 30.0 | $ | 15.2 | $ | 32.2 | ||||||
|
Federal Services
|
5.6 | 12.3 | 9.4 | |||||||||
|
Energy & Construction
|
15.9 | 18.8 | 58.3 | |||||||||
|
Corporate and other
|
6.6 | 5.3 | 5.6 | |||||||||
|
Total capital expenditures
|
$ | 58.1 | $ | 51.6 | $ | 105.5 | ||||||
|
Depreciation and amortization
|
||||||||||||
|
Infrastructure & Environment
|
$ | 42.2 | $ | 34.5 | $ | 35.2 | ||||||
|
Federal Services
|
21.4 | 22.8 | 21.4 | |||||||||
|
Energy & Construction
|
62.3 | 75.3 | 80.3 | |||||||||
|
Corporate and other
|
7.5 | 7.2 | 5.7 | |||||||||
|
Total depreciation and amortization
|
$ | 133.4 | $ | 139.8 | $ | 142.6 | ||||||
|
(1)
|
We are providing segment contribution because management uses this information to assess performance and make decisions about resource allocation. We define segment contribution as total segment operating income minus noncontrolling interests attributable to that segment, but before allocation of various segment expenses, including stock compensation expenses, impairment of intangible assets, amortization of intangible assets, and other miscellaneous unallocated expenses. Segment operating income represents net income before reductions for income taxes, noncontrolling interests and interest expense.
|
|
(2)
|
General and administrative expenses represent expenses related to corporate functions.
|
140
URS CORPORATION AND SUBSIDIARIES
NOTES TO CONSOLIDATED FINANCIAL STATEMENTS (Continued)
A reconciliation of segment contribution to segment operating income for the years ended December 31, 2010, January 1, 2010, and January 2, 2009 is as follows:
|
Year Ended December 31, 2010
|
||||||||||||||||||||
|
(In millions)
|
Infrastructure
&
Environment
|
Federal
Services
|
Energy
&
Construction
|
Corporate
|
Consolidated
|
|||||||||||||||
|
Contribution
|
$ | 247.2 | $ | 189.3 | $ | 180.2 | $ | (110.9 | ) | $ | 505.8 | |||||||||
|
Noncontrolling interests
|
(0.9 | ) | — | 99.3 | — | 98.4 | ||||||||||||||
|
Amortization of intangible assets
|
(5.0 | ) | (15.9 | ) | (28.3 | ) | — | (49.2 | ) | |||||||||||
|
Stock-based compensation expense
|
(14.4 | ) | (5.6 | ) | (13.5 | ) | 33.5 | — | ||||||||||||
|
Other miscellaneous and unallocated expenses
|
(4.0 | ) | (2.2 | ) | (10.8 | ) | 6.4 | (10.6 | ) | |||||||||||
|
Operating income (loss)
|
$ | 222.9 | $ | 165.6 | $ | 226.9 | $ | (71.0 | ) | $ | 544.4 | |||||||||
|
Year Ended January 1, 2010
|
||||||||||||||||||||
|
(In millions)
|
Infrastructure
&
Environment
|
Federal
Services
|
Energy
&
Construction
|
Corporate
|
Consolidated
|
|||||||||||||||
|
Contribution
|
$ | 267.0 | $ | 168.4 | $ | 193.4 | $ | (107.1 | ) | $ | 521.7 | |||||||||
|
Noncontrolling interests
|
3.3 | — | 33.2 | — | 36.5 | |||||||||||||||
|
Impairment of an intangible asset
|
— | (3.8 | ) | (29.0 | ) | — | (32.8 | ) | ||||||||||||
|
Amortization of intangible assets
|
(0.4 | ) | (16.9 | ) | (35.6 | ) | — | (52.9 | ) | |||||||||||
|
Stock-based compensation expense
|
(13.9 | ) | (4.4 | ) | (11.5 | ) | 29.8 | — | ||||||||||||
|
Other miscellaneous and unallocated expenses
|
(0.3 | ) | (0.1 | ) | (4.6 | ) | 1.5 | (3.5 | ) | |||||||||||
|
Operating income (loss)
|
$ | 255.7 | $ | 143.2 | $ | 145.9 | $ | (75.8 | ) | $ | 469.0 | |||||||||
|
Year Ended January 2, 2009
|
||||||||||||||||||||
|
(In millions)
|
Infrastructure
&
Environment
|
Federal
Services
|
Energy
&
Construction
|
Corporate
|
Consolidated
|
|||||||||||||||
|
Contribution
|
$ | 253.2 | $ | 152.0 | $ | 216.4 | $ | (100.3 | ) | $ | 521.3 | |||||||||
|
Noncontrolling interests
|
1.3 | — | 35.1 | — | 36.4 | |||||||||||||||
|
Amortization of intangible assets
|
(0.1 | ) | (16.8 | ) | (35.7 | ) | — | (52.6 | ) | |||||||||||
|
Stock-based compensation expense
|
(11.3 | ) | (4.3 | ) | (4.7 | ) | 20.3 | — | ||||||||||||
|
Other miscellaneous and unallocated expenses
|
(0.4 | ) | (0.8 | ) | (0.1 | ) | 1.3 | — | ||||||||||||
|
Operating income (loss)
|
$ | 242.7 | $ | 130.1 | $ | 211.0 | $ | (78.7 | ) | $ | 505.1 | |||||||||
Total investments in and advances to unconsolidated joint ventures are as follows:
|
(In millions)
|
December 31,
2010
|
January 1,
2010
|
||||||
|
Infrastructure & Environment
|
$ | 3.8 | $ | 7.4 | ||||
|
Federal Services
|
4.8 | 4.8 | ||||||
|
Energy & Construction
|
56.9 | 81.7 | ||||||
|
Total investments in and advances to unconsolidated joint ventures
|
$ | 65.5 | $ | 93.9 | ||||
141
URS CORPORATION AND SUBSIDIARIES
NOTES TO CONSOLIDATED FINANCIAL STATEMENTS (Continued)
Total property and equipment, net of accumulated depreciation by reporting segment, are as follows:
|
(In millions)
|
December 31,
2010
|
January 1,
2010
|
||||||
|
Infrastructure & Environment
|
$ | 136.1 | $ | 114.3 | ||||
|
Federal Services
|
30.4 | 31.1 | ||||||
|
Energy & Construction
|
83.3 | 103.0 | ||||||
|
Corporate
|
16.3 | 10.6 | ||||||
|
Total property and equipment, net of accumulated depreciation
|
$ | 266.1 | $ | 259.0 | ||||
Total assets by reporting segment are as follows:
|
(In millions)
|
December 31,
2010
|
January 1,
2010
|
||||||
|
Infrastructure & Environment
|
$ | 2,272.3 | $ | 1,654.3 | ||||
|
Federal Services
|
1,488.7 | 1,505.3 | ||||||
|
Energy & Construction
|
3,424.6 | 3,616.7 | ||||||
|
Corporate
|
5,589.7 | 5,377.7 | ||||||
|
Eliminations
|
(5,423.9 | ) | (5,249.6 | ) | ||||
|
Total assets
|
$ | 7,351.4 | $ | 6,904.4 | ||||
Geographic Areas
We provide services in many parts of the world. Some of our services are provided to companies in other countries, but are served by our offices located in the U.S. Generally, revenues related to such services are classified within the geographic area where the services are performed, rather than where the client is located. Our revenues and net property and equipment at cost by geographic area are shown below:
|
Year Ended
|
||||||||||||
|
(In millions)
|
December 31,
2010
|
January 1,
2010
|
January 2,
2009
|
|||||||||
|
Revenues
|
||||||||||||
|
United States
|
$ | 8,385.4 | $ | 8,451.2 | $ | 9,178.5 | ||||||
|
International (1)
|
809.2 | 811.3 | 927.8 | |||||||||
|
Eliminations
|
(17.5 | ) | (13.4 | ) | (20.0 | ) | ||||||
|
Total revenues
|
$ | 9,177.1 | $ | 9,249.1 | $ | 10,086.3 | ||||||
|
(1)
|
No individual foreign country contributed more than 10% of our consolidated revenues for the years ended December 31, 2010, January 1, 2010, or January 2, 2009.
|
|
(In millions)
|
December 31,
2010
|
January 1,
2010
|
||||||
|
Property and equipment at cost, net (1)
|
||||||||
|
United States
|
$ | 195.7 | $ | 220.1 | ||||
|
International:
|
||||||||
|
United Kingdom (2)
|
31.7 | 5.3 | ||||||
|
Other foreign countries
|
38.7 | 33.6 | ||||||
|
Total international
|
70.4 | 38.9 | ||||||
|
Total property and equipment at cost, net
|
$ | 266.1 | $ | 259.0 | ||||
|
(1)
|
Property and equipment at cost, net is categorized by the location of incorporation of the legal entities.
|
|
(2)
|
The acquisition of Scott Wilson has expanded our presence and capabilities in the U.K.
|
142
URS CORPORATION AND SUBSIDIARIES
NOTES TO CONSOLIDATED FINANCIAL STATEMENTS (Continued)
Major Customers and Other
Our largest clients are from our federal market sector. Within this sector, we have multiple contracts with our two major customers: the U.S. Army and DOE. For the purpose of analyzing revenues from major customers, we do not consider the combination of all federal departments and agencies as one customer. The different federal agencies manage separate budgets. As such, reductions in spending by one federal agency do not affect the revenues we could earn from another federal agency. In addition, the procurement processes for federal agencies are not centralized, and procurement decisions are made separately by each federal agency. The loss of the federal government, the U.S. Army, or DOE as clients, would have a material adverse effect on our business; however, we are not dependent on any single contract on an ongoing basis. We believe that the loss of any single contract would not have a material adverse effect on our business.
Our revenues from the U.S. Army and DOE by reporting segment for the years ended December 31, 2010, January 1, 2010, and January 2, 2009 are presented below:
|
Year Ended
|
||||||||||||
|
(In millions, except percentages)
|
December 31,
2010
|
January 1,
2010
|
January 2,
2009
|
|||||||||
|
Infrastructure & Environment
|
$ | 167.0 | $ | 145.0 | $ | 110.1 | ||||||
|
Federal Services
|
1,408.7 | 1,403.1 | 1,407.1 | |||||||||
|
Energy & Construction
|
346.6 | 117.3 | 121.8 | |||||||||
|
Total U.S. Army
|
$ | 1,922.3 | $ | 1,665.4 | $ | 1,639.0 | ||||||
|
Revenues from the U.S. Army as a percentage of our consolidated revenues
|
21 | % | 18 | % | 16 | % | ||||||
|
DOE
|
||||||||||||
|
Infrastructure & Environment
|
$ | 7.2 | $ | 9.5 | $ | 12.4 | ||||||
|
Federal Services
|
13.7 | 37.4 | 64.9 | |||||||||
|
Energy & Construction
|
1,182.6 | 785.3 | 472.1 | |||||||||
|
Total DOE
|
$ | 1,203.5 | $ | 832.2 | $ | 549.4 | ||||||
|
Revenues from DOE as a percentage of our consolidated revenues
|
13 | % | 9 | % | 5 | % | ||||||
|
Revenues from the federal market sector as a percentage of our consolidated revenues
|
49 | % | 45 | % | 35 | % | ||||||
(1) The U.S. Army includes U.S. Army Corps of Engineers.
From time to time, we procure from and provide services to companies for which some of our independent directors also serve as board members. Revenues and purchases from such transactions amounted to $14.2 million and $8.0 million, respectively, for the year ended December 31, 2010. Revenues and purchases from such transactions amounted to $10.1 million and $3.5 million, respectively, for the year ended January 1, 2010.
143
URS CORPORATION AND SUBSIDIARIES
NOTES TO CONSOLIDATED FINANCIAL STATEMENTS (Continued)
In the ordinary course of business, we are subject to contractual guarantees and governmental audits or investigations. We are also involved in various legal proceedings that are pending against us and our affiliates alleging, among other things, breach of contract or tort in connection with the performance of professional services, the various outcomes of which cannot be predicted with certainty. We are including information regarding the following significant legal proceedings in particular:
|
·
|
USAID Egyptian Projects: In March 2003, WGI was notified by the Department of Justice that the federal government was considering civil litigation against WGI for potential violations of the U.S. Agency for International Development (“USAID”) source, origin, and nationality regulations in connection with five of WGI’s USAID-financed host-country projects located in Egypt beginning in the early 1990s. In November 2004, the federal government filed an action in the U.S. District Court for the District of Idaho against WGI and Contrack International, Inc., and MISR Sons Development S.A.E., an Egyptian construction company, asserting violations under the Federal False Claims Act, the Federal Foreign Assistance Act of 1961, and common law theories of payment by mistake and unjust enrichment. The federal government seeks damages and civil penalties for violations of the statutes as well as a refund of all amounts paid under the specified contracts of approximately $373.0 million. WGI denies any liability in the action and contests the federal government’s damage allegations and its entitlement to any recovery. All USAID projects under the contracts have been completed and are fully operational.
|
In March 2005, WGI filed motions in the Bankruptcy Court in Nevada and in the Idaho District Court to dismiss the federal government’s claim for failure to give appropriate notice or otherwise preserve those claims. In August 2005, the Bankruptcy Court ruled that all federal government claims were barred in a written order. The federal government appealed the Bankruptcy Court's order to the U.S. District Court for the District of Nevada. In March 2006, the Idaho District Court stayed that action during the pendency of the federal government's appeal of the Bankruptcy Court's ruling. In December 2006, the District Court in Nevada reversed the Bankruptcy Court’s order and remanded the matter back to the Bankruptcy Court for further proceedings. In December 2007, the federal government filed a motion in Bankruptcy Court seeking an order that the Bankruptcy Court abstain from exercising jurisdiction over this matter, which WGI opposed. On February 15, 2008, the Bankruptcy Court denied the federal government’s motion preventing the Bankruptcy Court from exercising jurisdiction over WGI’s motion that the federal government’s claims in Idaho District Court were barred for failure to give appropriate notice or otherwise preserve those claims. In November 2008, the Bankruptcy Court ruled that the federal government’s common law claims of unjust enrichment and payment by mistake are barred, and may not be further pursued. WGI’s pending motion in the Bankruptcy Court covers all of the remaining federal government claims alleged in the Idaho action.
WGI’s joint venture for one of the USAID projects brought arbitration proceedings before an arbitration tribunal in Egypt in which the joint venture asserted an affirmative claim for additional compensation for the construction of water and wastewater treatment facilities in Egypt. The project owner, National Organization for Potable Water and Sanitary Drainage (“NOPWASD”), an Egyptian government agency, asserted in a counterclaim that by reason of alleged violations of the USAID source, origin and nationality regulations, and alleged violations of Egyptian law, WGI’s joint venture should forfeit its claim, pay damages of approximately $6.0 million and the owner’s costs of defending against the joint venture’s claims in arbitration. WGI denied liability on NOPWASD’s counterclaim. On April 17, 2006, the arbitration tribunal issued its award providing that the joint venture prevailed on its affirmative claims in the net amount of $8.2 million, and that NOPWASD's counterclaims were rejected. WGI’s portion of any final award received by the joint venture would be approximately 45%.
WGI intends to continue to defend these matters vigorously and to consider its affirmative claims; however, we cannot provide assurance that we will be successful in these efforts. The potential range of loss and the resolution of these matters cannot be determined at this time.
144
URS CORPORATION AND SUBSIDIARIES
NOTES TO CONSOLIDATED FINANCIAL STATEMENTS (Continued)
|
·
|
New Orleans Levee Failure Class Action Litigation: From July 1999 through May 2005, Washington Group International, Inc., an Ohio company (“WGI Ohio”), a wholly owned subsidiary acquired by us on November 15, 2007, performed demolition, site preparation, and environmental remediation services for the U.S. Army Corps of Engineers on the east bank of the Inner Harbor Navigation Canal (the “Industrial Canal”) in New Orleans, Louisiana. On August 29, 2005, Hurricane Katrina devastated New Orleans. The storm surge created by the hurricane overtopped the Industrial Canal levee and floodwall, flooding the Lower Ninth Ward and other parts of the city.
|
Since September 2005, 59 personal injury, property damage and class action lawsuits have been filed in Louisiana State and federal court naming WGI Ohio as a defendant. Other defendants include the U.S. Army Corps of Engineers, the Board for the Orleans Parish Levee District, and its insurer, St. Paul Fire and Marine Insurance Company. Over 1,450 hurricane-related cases, including the WGI Ohio cases, have been consolidated in the U.S. District Court for the Eastern District of Louisiana. The plaintiffs claim that defendants were negligent in their design, construction and/or maintenance of the New Orleans levees. The plaintiffs are all residents and property owners who claim to have incurred damages arising out of the breach and failure of the hurricane protection levees and floodwalls in the wake of Hurricane Katrina. The allegation against us is that the work we performed adjacent to the Industrial Canal damaged the levee and floodwall and caused and/or contributed to breaches and flooding. The plaintiffs allege damages of $200 billion and demand attorneys’ fees and costs. WGI Ohio did not design, construct, repair or maintain any of the levees or the floodwalls that failed during or after Hurricane Katrina. WGI Ohio performed the work adjacent to the Industrial Canal as a contractor for the federal government and has pursued dismissal from the lawsuits on a motion for summary judgment on the basis that government contractors are immune from liability.
On December 15, 2008, the District Court granted WGI Ohio’s motion for summary judgment to dismiss the lawsuit on the basis that we performed the work adjacent to the Industrial Canal as a contractor for the federal government and are therefore immune from liability, which was appealed by a number of the plaintiffs on April 27, 2009 to the United States Fifth Circuit Court of Appeals (“Court of Appeals”). On September 14, 2010, the Court of Appeals reversed the District Court’s summary judgment decision and WGI Ohio’s dismissal, and remanded the case back to the District Court for further litigation.
WGI Ohio intends to continue to defend these matters vigorously; however, we cannot provide assurance that we will be successful in these efforts. The potential range of loss and the resolution of these matters cannot be determined at this time.
|
·
|
SR-125: WGI has a 50% interest in a joint venture that is performing a $401 million fixed-price highway and toll road project in California that is operational and has been open to traffic since November 2007. Prior to the acquisition of WGI, WGI recorded significant losses on the project resulting largely from developer directives to perform extra work, developer-caused delays, and unilateral deductive changes related to contested developer claims, including claims for liquidated damages. The joint venture is actively pursuing reimbursement of its losses based on claims of breach of contract, developer-directed changes, negligent acts by the developer, force-majeure events and insurance occurrences. The highway claims were initiated in the Superior Court of San Diego County (“Superior Court”) in July 2006 and the toll road claims were initiated in arbitration, under JAMS arbitration rules, in March 2006.
|
The developer has responded with amended counterclaims, filed in October 2009, in both the toll road arbitration and highway litigation alleging breach of contract, indemnity for claims brought against the developer by its fixed operating equipment contractor, and fraud. The amended counterclaims in the two matters are duplicative to a degree, but in total aggregate more than $800 million in claimed damages.
145
URS CORPORATION AND SUBSIDIARIES
NOTES TO CONSOLIDATED FINANCIAL STATEMENTS (Continued)
In May 2009, an arbitration panel hearing was held to determine whether the joint venture had previously waived multiple contractual claims under its agreement with the developer. On August 5, 2009, the panel determined that the joint venture only waived approximately $14.0 million out of the $96.5 million of claims that the developer contended were previously waived under the toll road contract. In addition, the joint venture, as the prevailing party, is entitled to an award of reasonable attorney’s fees and costs attributable to the waiver hearing, which the developer is contesting. Hearings on the attorneys’ fees and costs issues were held in October 2009 and February 2010, and on February 15, 2010, the arbitration panel issued a $3.2 million award fee to the joint venture.
In December 2007, the joint venture initiated a government code claim in Superior Court against the California Department of Transportation (“Caltrans”) asserting that Caltrans failed to ensure that the project owner had a statutorily required payment bond. The Superior Court granted judgment on the pleadings in favor of Caltrans in March 2009. In addition, the developer and Caltrans have prevailed on motions for summary judgment on other government code claim issues (including lack of proper licensing, lack of authority to include the toll road project in a franchise agreement between the developer and the state, and the enforceability of certain contractual limitations that would not be enforceable under the government code in California). The joint venture also recorded notices of a mechanic’s lien on the toll road properties and, on September 24, 2009, filed an action to foreclose the mechanic’s lien. The joint venture also initiated an inverse condemnation action against Caltrans relating to the fee ownership of properties acquired by Caltrans impairing the joint venture’s mechanic’s lien rights on the toll road on July 11, 2008.
In June 2008, the developer filed a complaint, as amended, against the joint venture in the Supreme Court of New York County, New York, alleging that the joint venture breached a lender agreement associated with the highway project that impaired the enforceability of the highway project contract. On October 1, 2008, a hearing was held on the joint venture’s motion to stay or dismiss this action and the Supreme Court of New York County has yet to issue its determination. On August 31, 2009, Banco Bilbao Vizcaya Argentaria, S.A. (“BBVA”), the lender’s prime agent, filed a complaint on behalf of the lenders alleging breach of a lending agreement entered into during the highway and toll road contracts. The joint venture filed a motion to dismiss the BBVA complaint on October 15, 2009.
On March 22, 2010, the developer filed a Chapter 11 bankruptcy petition in the Bankruptcy Court for the Southern District of California that effectively stayed or suspended the joint venture’s highway litigation in Superior Court and the toll road arbitration. The two New York actions have also been stayed. On March 26, 2010, the joint venture filed a petition seeking to remove the previously filed foreclosure action regarding the mechanic’s lien on the toll road properties to the Bankruptcy Court. On March 31, 2010, the developer filed its own adversary proceeding seeking a declaration from the Bankruptcy Court that any mechanic’s liens filed on the toll road were invalid. (These matters and a separate foreclosure proceeding filed by another SR-125 contractor were consolidated by the Bankruptcy Court on June 10, 2010). The developer, joined by its lenders, filed a motion for summary judgment on April 26, 2010, contending that the mechanic’s liens filed by the joint venture and another contractor were invalid. A formal hearing on the motion was held on July 1, 2010. On July 28, 2010, the Bankruptcy Court denied the developer’s and lenders’ motion for summary judgment and ruled that the joint venture can assert a mechanic’s lien against the developer’s distinct private property interests in the toll road. On September 14, 2010, the joint venture filed a motion for summary judgment on the priority of the mechanic’s lien, which the Bankruptcy Court denied. On October 25, 2010, trial proceedings commenced in the Bankruptcy Court on the validity and priority of the joint venture’s mechanic’s lien. On October 28, 2010, the Bankruptcy Court ruled against the joint venture’s position, finding that the mechanic’s lien did not have priority over the lender’s position. While there was no adjudication on the merits of the joint venture’s actual claim, on November 1, 2010, we re-assessed the value of our equity investment in the joint venture and recorded a pre-tax, non-cash asset impairment charge of $25.0 million relating to our equity investment in the joint venture. On January 25, 2011, the joint venture filed a notice of appeal to the Bankruptcy Court’s ruling on the mechanic’s lien priority.
146
URS CORPORATION AND SUBSIDIARIES
NOTES TO CONSOLIDATED FINANCIAL STATEMENTS (Continued)
On July 10, 2010, MCM Construction, a joint venture subcontractor filed a complaint in California Superior Court, San Diego County seeking damages of $7.0 million for alleged breach of contract, fraud, and misrepresentation by the joint venture. On February 9, 2011, the joint venture settled this matter for approximately $0.2 million.
The joint venture intends to defend these matters vigorously and will seek to collect all claimed amounts; however, we cannot provide assurance that the joint venture will be successful in these efforts. The potential range of loss and the resolution of these matters cannot be determined at this time.
|
·
|
Common Sulfur Project: One of our wholly owned subsidiaries, WGI – Middle East, Inc., whose parent company, WGI, was acquired by us on November 15, 2007, together with a consortium partner, have contracted under a fixed-price arrangement to engineer, procure and construct a sulfur processing facility located in Qatar. Once completed, the sulfur processing facility will gather and process sulfur produced by new liquid natural gas processing facilities, which are also under construction. The project has experienced cost increases and schedule delays. The contract gives the customer the right to assess liquidated damages of approximately $25 million against the consortium if various project milestones are not met. If liquidated damages are assessed, a significant portion may be attributable to WGI – Middle East, Inc. On November 25, 2009, the consortium filed a Notice of Arbitration in the U.K. for breach of contract and client-directed changes.
|
On August 23, 2010, along with our consortium partner, we settled pending change orders and claims with the project owner for three payments from the project owner totaling $100 million. We and our consortium partner have agreed that 60% of the settlement amount will be allocated to our consortium partner and 40% to us.
Under the terms of the settlement, we received a complete release for all delays and liquidated damages incurred up to the settlement date. As of December 31, 2010, we had received the first two of three settlement payments in the amount of $28 million and have a $12 million receivable relating to this settlement. We expect the final settlement payment of $12 million upon the completion of the project.
During the fourth quarter of 2010, we recognized a loss of $4.8 million on the project resulting in a loss of $5.8 million for the year ended December 31, 2010. As of December 31, 2010, the cumulative project losses were approximately $87.8 million.
The resolution of outstanding claims is subject to inherent uncertainty, and it is reasonably possible that resolution of any of the above outstanding claims or legal proceedings could have a material adverse effect on us.
Insurance
Generally, our insurance program covers workers’ compensation and employer’s liability, general liability, automobile liability, professional errors and omissions liability, property, marine property and liability, and contractor’s pollution liability (in addition to other policies for specific projects). Our insurance program includes deductibles or self-insured retentions for each covered claim. In addition, our insurance policies contain exclusions and sublimits that insurance providers may use to deny or restrict coverage. Excess liability, contractor’s pollution liability and professional liability insurance policies provide for coverages on a “claims-made” basis, covering only claims actually made and reported during the policy period currently in effect. Thus, if we do not continue to maintain these policies, we will have no coverage for claims made after the termination date even for claims based on events that occurred during the term of coverage. While we intend to maintain these policies, we may be unable to maintain existing coverage levels.
147
URS CORPORATION AND SUBSIDIARIES
NOTES TO CONSOLIDATED FINANCIAL STATEMENTS (Continued)
Guarantee Obligations and Commitments
As of December 31, 2010, we had the following guarantee obligations and commitments:
We have agreed to indemnify one of our joint venture partners up to $25.0 million for any potential losses, damages, and liabilities associated with lawsuits in relation to general and administrative services we provide to the joint venture. Currently, we have not been advised of any indemnified claims under this guarantee.
We have guaranteed a letter of credit issued on behalf of one of our unconsolidated joint ventures. The total amount of the letter of credit was $7.2 million as of December 31, 2010.
We have guaranteed several of our foreign credit facilities and bank guarantee lines. The aggregate amount of these guarantees was $16.1 million as of December 31, 2010.
We also maintain a variety of commercial commitments that are generally made to support provisions of our contracts. In addition, in the ordinary course of business, we provide letters of credit to clients and others against advance payments and to support other business arrangements. We are required to reimburse the issuers of letters of credit for any payments they make under the letters of credit.
In the ordinary course of business, we may provide performance assurances and guarantees related to our services. For example, these guarantees may include surety bonds, arrangements among our client, a surety, and us to ensure we perform our contractual obligations pursuant to our client agreement. If our services under a guaranteed project are later determined to have resulted in a material defect or other material deficiency, then we may be responsible for monetary damages or other legal remedies. When sufficient information about claims on guaranteed projects is available and monetary damages or other costs or losses are determined to be probable, we recognize such guarantee losses.
Lease Obligations
Total rental expense included in operations for operating leases for the years ended December 31, 2010, January 1, 2010, and January 2, 2009 totaled $192.5 million, $199.4 million, and $164.3 million, respectively. Some of the operating leases are subject to renewal options and escalation based upon property taxes and operating expenses. These operating lease agreements expire at varying dates through 2023. Obligations under operating leases include office and other equipment rentals.
Obligations under non-cancelable operating lease agreements were as follows:
|
(In millions)
|
Operating Leases
|
|||
|
2011
|
$ | 145.4 | ||
|
2012
|
117.7 | |||
|
2013
|
95.7 | |||
|
2014
|
72.1 | |||
|
2015
|
53.3 | |||
|
Thereafter
|
116.1 | |||
|
Total minimum lease payments
|
$ | 600.3 | ||
148
URS CORPORATION AND SUBSIDIARIES
NOTES TO CONSOLIDATED FINANCIAL STATEMENTS (Continued)
Restructuring Costs
As of December 31, 2010 and January 1, 2010, our restructuring reserves were $11.6 million and $4.6 million, respectively. During our 2010 fiscal year, we recorded $10.6 million in our Consolidated Statement of Operations, which consisted primarily of costs for severance and associated benefits. The majority of the restructuring costs were accrued in the fourth quarter of fiscal year 2010 and resulted from the integration of Scott Wilson into our existing Infrastructure & Environment’s U.K. and European business. The integration is expected to be completed in fiscal year 2011. We expect to incur additional restructuring costs related to the closure of excess facilities during fiscal year 2011.
Prior to the fourth quarter of fiscal year 2010, the restructuring reserve was primarily related to our restructuring plan in connection with the WGI acquisition. As of December 31, 2010, we had an immaterial reserve balance remaining for this restructuring plan. During fiscal year 2010, we recorded immaterial adjustments and payments related to the WGI restructuring plan.
149
URS CORPORATION AND SUBSIDIARIES
NOTES TO CONSOLIDATED FINANCIAL STATEMENTS (Continued)
The accumulated balances and reporting period activities related to each component of other comprehensive income (loss) are summarized as follows:
|
(In millions)
|
Pension and Post-retirement Related Adjustments (1)
|
Foreign Currency Translation Adjustments
|
Foreign Currency Translation Adjustment Due to the Sale of Our Investment in an Unconsolidated Joint Venture
|
Unrealized Gain (Loss) on Interest Rate Swaps
|
Accumulated Other Comprehensive Income (Loss)
|
|||||||||||||||
|
Balances at December 28, 2007
|
$ | 3.7 | $ | 15.7 | $ | (0.4 | ) | $ | (2.4 | ) | $ | 16.6 | ||||||||
|
Before-tax amount
|
(60.6 | ) | (23.4 | ) | (5.6 | ) | (11.7 | ) | (101.3 | ) | ||||||||||
|
Tax benefit (expense)
|
23.2 | 0.9 | — | 4.7 | 28.8 | |||||||||||||||
|
2008 adjustments, net of tax
|
(37.4 | ) | (22.5 | ) | (5.6 | ) | (7.0 | ) | (72.5 | ) | ||||||||||
|
Balances at January 2, 2009
|
$ | (33.7 | ) | $ | (6.8 | ) | $ | (6.0 | ) | $ | (9.4 | ) | $ | (55.9 | ) | |||||
|
Before-tax amount
|
(15.0 | ) | 12.8 | 0.9 | 8.6 | 7.3 | ||||||||||||||
|
Unrealized loss on foreign currency forward contract, net of tax
|
— | (10.7 | ) | — | — | (10.7 | ) | |||||||||||||
|
Reclassification of unrealized loss on foreign currency forward contract, net of tax
|
— | 10.7 | — | — | 10.7 | |||||||||||||||
|
The sale of our equity investment in an unconsolidated joint venture
|
— | — | 5.1 | — | 5.1 | |||||||||||||||
|
Tax benefit (expense)
|
3.3 | (5.6 | ) | — | (3.4 | ) | (5.7 | ) | ||||||||||||
|
2009 adjustments, net of tax
|
(11.7 | ) | 7.2 | 6.0 | 5.2 | 6.7 | ||||||||||||||
|
Balances at January 1, 2010
|
$ | (45.4 | ) | $ | 0.4 | $ | — | $ | (4.2 | ) | $ | (49.2 | ) | |||||||
|
Before-tax amount
|
(5.1 | ) | 8.8 | — | 7.0 | 10.7 | ||||||||||||||
|
Tax benefit (expense)
|
4.4 | — | — | (2.8 | ) | 1.6 | ||||||||||||||
|
2010 adjustments, net of tax
|
(0.7 | ) | 8.8 | — | 4.2 | 12.3 | ||||||||||||||
|
Balances at December 31, 2010
|
$ | (46.1 | ) | $ | 9.2 | $ | — | $ | — | $ | (36.9 | ) | ||||||||
|
(1)
|
For fiscal year 2010, pension and post-retirement-related adjustments, before-tax, in other comprehensive income included $5.3 million of net loss arising during the year, $0.4 million of amortization of prior service credit and net loss, and $0.1 million of before-tax effect of changes in foreign currency exchange rate. For fiscal year 2009, pension and post-retirement-related adjustments, before-tax, in other comprehensive income included $12.7 million of net loss arising during the year, $2.2 million of amortization of prior service credit and net gain, and $0.1 million of before-tax effect of changes in foreign currency exchange rates. For fiscal year 2008, pension and post-retirement-related adjustments, before-tax, in other comprehensive income included $3.8 million of prior service credit for a plan amendment, $63.0 million of net loss arising during the year, $2.2 million of amortization of prior service credit and net gain, and $0.8 million of before-tax effect of foreign currency exchange rate.
|
150
URS CORPORATION AND SUBSIDIARIES
NOTES TO CONSOLIDATED FINANCIAL STATEMENTS (Continued)
Receivable allowances are comprised of allowances for amounts that may become uncollectable or unrealizable in the future. We determine these amounts based on historical experience and other currently available information. A valuation allowance for deferred income taxes is established when it is more likely than not that net deferred tax assets will not be realized.
The following table summarizes the activities in the receivable allowances and the deferred income tax valuation allowance from the beginning of the periods to the end of the periods.
|
(In millions)
|
Balance at the Beginning of the Periods
|
Additions (Charged to Bad Debt Expenses)
|
Additions (Charged to Other Accounts (1))
|
Deductions
|
Other
|
Balance at the End of the Periods
|
||||||||||||||||||
|
Year ended December 31, 2010
|
||||||||||||||||||||||||
|
Receivable allowances
|
$ | 47.7 | $ | 6.7 | $ | 8.9 | $ | (20.5 | ) | $ | — | $ | 42.8 | |||||||||||
|
Deferred income tax valuation allowance (2)
|
$ | 87.6 | $ | — | $ | 13.4 | $ | — | $ | 3.2 | $ | 104.2 | ||||||||||||
|
Year ended January 1, 2010
|
||||||||||||||||||||||||
|
Receivable allowances
|
$ | 39.4 | $ | 5.8 | $ | 23.2 | $ | (20.7 | ) | $ | — | $ | 47.7 | |||||||||||
|
Deferred income tax valuation allowance (3)
|
$ | 100.4 | $ | — | $ | — | $ | (12.8 | ) | $ | — | $ | 87.6 | |||||||||||
|
Year ended January 2, 2009
|
||||||||||||||||||||||||
|
Receivable allowances
|
$ | 51.2 | $ | 5.0 | $ | 25.8 | $ | (42.6 | ) | $ | — | $ | 39.4 | |||||||||||
|
Deferred income tax valuation allowance
|
$ | 101.8 | $ | — | $ | — | $ | (1.4 | ) | $ | — | $ | 100.4 | |||||||||||
|
(1)
|
These additions were primarily charged to revenues or income tax expense.
|
|
(2)
|
Other adjustments to the deferred income tax valuation allowance during the year ended December 31, 2010 were attributable to acquired deferred taxes on foreign net operating losses through the Scott Wilson acquisition.
|
|
(3)
|
During the year ended January 1, 2010, deductions to the deferred income tax valuation allowance were primarily attributed to foreign and state NOL expirations and the use of federal and state NOLs.
|
151
URS CORPORATION AND SUBSIDIARIES
NOTES TO CONSOLIDATED FINANCIAL STATEMENTS (Continued)
The following table sets forth selected quarterly financial data for the years ended December 31, 2010 and January 1, 2010. The selected quarterly financial data presented below should be read in conjunction with the rest of the information in this report.
Operating income is defined as income before income taxes and interest expense.
|
2010 Quarters Ended
|
||||||||||||||||
|
(In thousands, except per share data)
|
April 2
|
July 2
|
October 1
|
December 31
|
||||||||||||
|
Revenues
|
$ | 2,207,476 | $ | 2,249,387 | $ | 2,340,084 | $ | 2,380,104 | ||||||||
|
Cost of revenues
|
(2,086,747 | ) | (2,121,737 | ) | (2,136,495 | ) | (2,264,513 | ) | ||||||||
|
Acquisition-related expenses (1)
|
— | (4,113 | ) | (7,516 | ) | (271 | ) | |||||||||
|
Restructuring costs (2)
|
— | — | — | (10,577 | ) | |||||||||||
|
Operating income (3)
|
125,222 | 134,526 | 162,182 | 122,427 | ||||||||||||
|
Income tax expense (4)
|
(2,182 | ) | (50,247 | ) | (64,923 | ) | (37,532 | ) | ||||||||
|
Net income including noncontrolling interests
|
113,668 | 79,225 | 87,803 | 78,229 | ||||||||||||
|
Noncontrolling interests in income of consolidated subsidiaries, net of tax
|
(18,048 | ) | (17,298 | ) | (17,414 | ) | (18,276 | ) | ||||||||
|
Net income attributable to URS
|
95,620 | 61,927 | 70,389 | 59,953 | ||||||||||||
|
Earnings per share:
|
||||||||||||||||
|
Basic
|
$ | 1.17 | $ | .76 | $ | .87 | $ | .75 | ||||||||
|
Diluted
|
$ | 1.17 | $ | .76 | $ | .87 | $ | .75 | ||||||||
|
Weighted-average number of shares:
|
||||||||||||||||
|
Basic
|
81,384 | 81,211 | 81,054 | 80,155 | ||||||||||||
|
Diluted
|
81,912 | 81,536 | 81,292 | 80,425 | ||||||||||||
|
2009 Quarters Ended
|
||||||||||||||||
|
(In thousands, except per share data)
|
April 3
|
July 3
|
October 2
|
January 1, 2010
|
||||||||||||
|
Revenues
|
$ | 2,520,638 | $ | 2,297,608 | $ | 2,318,525 | $ | 2,112,317 | ||||||||
|
Cost of revenues
|
(2,379,423 | ) | (2,169,268 | ) | (2,217,054 | ) | (2,006,671 | ) | ||||||||
|
Impairment of an intangible asset (5)
|
— | — | — | (32,825 | ) | |||||||||||
|
Operating income
|
163,143 | 126,065 | 104,231 | 75,515 | ||||||||||||
|
Other income (expense), net (6)
|
(7,584 | ) | 55,498 | — | — | |||||||||||
|
Income tax expense
|
(57,635 | ) | (69,490 | ) | (24,640 | ) | (25,791 | ) | ||||||||
|
Net income including noncontrolling interests
|
83,201 | 100,147 | 68,597 | 38,974 | ||||||||||||
|
Noncontrolling interests in income of consolidated subsidiaries, net of tax
|
(7,729 | ) | (5,011 | ) | (3,840 | ) | (5,219 | ) | ||||||||
|
Net income attributable to URS
|
75,472 | 95,136 | 64,757 | 33,755 | ||||||||||||
|
Earnings per share (5,6):
|
||||||||||||||||
|
Basic
|
$ | .93 | $ | 1.17 | $ | .80 | $ | .41 | ||||||||
|
Diluted
|
$ | .92 | $ | 1.16 | $ | .79 | $ | .41 | ||||||||
|
Weighted-average number of shares:
|
||||||||||||||||
|
Basic
|
81,492 | 81,347 | 81,418 | 81,349 | ||||||||||||
|
Diluted
|
82,018 | 82,025 | 81,780 | 81,682 | ||||||||||||
|
(1)
|
For the year ended December 31, 2010, we recorded acquisition-related expenses in connection with our acquisition of Scott Wilson. See further discussion in Note 7, “Acquisition.”
|
152
URS CORPORATION AND SUBSIDIARIES
NOTES TO CONSOLIDATED FINANCIAL STATEMENTS (Continued)
|
(2)
|
For the year ended December 31, 2010, we recorded restructuring costs for the integration of Scott Wilson into our existing U.K. and European business. See further discussion in Note 16, “Commitments and Contingencies.”
|
|
(3)
|
During the third quarter of fiscal year 2010, we recorded a pre-tax non-cash asset impairment charge of $25.0 million or $0.18 per share on an after-tax basis on the SR-125 road project in California as a result of an adverse legal ruling. See further discussion regarding this case in Note 16, “Commitments and Contingencies.”
|
|
(4)
|
Our effective income tax rate for the three months ended April 2, 2010 was 1.9%. The reduction in the rate was primarily due to our determination that the earnings of all of our foreign subsidiaries would be indefinitely reinvested offshore, which resulted in the reversal of the net U.S. deferred tax liability on the undistributed earnings of all foreign subsidiaries. See further discussion in Note 12, “Income Taxes.”
|
|
(5)
|
For the year ended January 1, 2010, we recorded a $32.8 million charge for the impairment of our intangible asset related to the “Washington” trade name. On a net, after-tax basis, this transaction resulted in decreases to net income and diluted EPS of $19.6 million and $0.24, respectively, for the year ended January 1, 2010. See further discussion in Note 8, “Goodwill and Intangible Assets.”
|
|
(6)
|
During fiscal year 2009, we recorded $47.9 million of other income, net, consisting of a $75.6 million gain associated with the sale of our equity investment in MIBRAG, net of $5.2 million of sale-related costs. This gain was partially offset by a $27.7 million loss on the settlement of a foreign currency forward contract during the fiscal year 2009, which primarily hedged our net investment in MIBRAG. On a net, after-tax basis, these two transactions resulted in increases to net income and diluted EPS of $30.6 million and $0.37, respectively, for the year ended January 1, 2010. For further discussion, see Note 5, “Joint Ventures” and Note 9, “Indebtedness.”
|
None.
Attached as exhibits to this Form 10-K/A are certifications of our CEO and CFO, which are required in accordance with Rule 13a-14 of the Securities Exchange Act of 1934, as amended (the "Exchange Act"). This “Controls and Procedures” section includes information concerning the controls and controls evaluation referred to in the certifications. Item 8, “Consolidated Financial Statements and Supplementary Data,” of this report sets forth the report of PricewaterhouseCoopers LLP, our independent registered public accounting firm, regarding its audit of our internal control over financial reporting. This section should be read in conjunction with the certifications and the PricewaterhouseCoopers LLP report for a more complete understanding of the topics presented.
Evaluation of Disclosure Controls and Procedures
Based on our management’s evaluation, with the participation of our CEO and CFO, of our “disclosure controls and procedures” (as defined in Rules 13a-15(e) and 15d-15(e) under the Exchange Act), our CEO and CFO have concluded that our disclosure controls and procedures were effective at a reasonable assurance level as of the end of the period covered by this report, to provide reasonable assurance that the information required to be disclosed by us in the reports that we filed or submitted to the SEC under the Exchange Act were (1) recorded, processed, summarized and reported within the time periods specified in the SEC’s rules and forms and (2) accumulated and communicated to our management, including our principal executive and principal financial officers, to allow timely decisions regarding required disclosures.
Changes in Internal Control over Financial Reporting
We acquired Scott Wilson on September 10, 2010 and are currently in the process of integrating it into our existing internal controls and procedures; however, management’s evaluation of the effectiveness of our internal controls over financial reporting does not yet include Scott Wilson. Except as described above, there were no changes in our internal control over financial reporting during the year ended December 31, 2010 that have materially affected, or are reasonably likely to materially affect, our internal control over financial reporting.
Management’s Annual Report on Internal Control over Financial Reporting
Our management is responsible for establishing and maintaining adequate internal control over financial reporting. Our internal control over financial reporting is designed to provide reasonable assurance regarding the reliability of our financial reporting and the preparation of financial statements for external purposes in accordance with generally accepted accounting principles. Internal control over financial reporting includes those policies and procedures that (i) pertain to the maintenance of records that in reasonable detail accurately and fairly reflect the transactions and dispositions of the assets of the company; (ii) provide reasonable assurance that transactions are recorded as necessary to permit preparation of financial statements in accordance with generally accepted accounting principles, and that receipts and expenditures of the company are being made only in accordance with authorizations of management and directors of the company; and (iii) provide reasonable assurance regarding prevention or timely detection of unauthorized acquisition, use or disposition of the company’s assets that could have a material effect on the financial statements.
Management, with the participation of our CEO and CFO, assessed our internal control over financial reporting as of December 31, 2010, the end of our fiscal year. Management based its assessment on criteria established in Internal Control–Integrated Framework issued by the Committee of Sponsoring Organizations of the Treadway Commission. Management’s assessment included evaluation and testing of the design and operating effectiveness of key financial reporting controls, process documentation, accounting policies, and our overall control environment.
Management’s conclusion regarding the effectiveness of internal control over financial reporting as of December 31, 2010 does not include any internal control over financial reporting at Scott Wilson. Management has elected to exclude Scott Wilson from its assessment of internal control over financial reporting because management was unable to assess Scott Wilson’s internal control over financial reporting in the period between the Scott Wilson acquisition on September 10, 2010 and management’s assessment of internal control over financial reporting as of December 31, 2010. Scott Wilson is a wholly-owned subsidiary of URS, whose total assets and total revenues represented 7.9% and 1.6%, respectively, of the related consolidated financial statement amounts as of and for the year ended December 31, 2010.
Based on management’s assessment, management has concluded that our internal control over financial reporting was effective as of December 31, 2010. Management communicated the results of management’s assessment to the Audit Committee of our Board of Directors.
Our independent registered public accounting firm, PricewaterhouseCoopers LLP, audited the effectiveness of the company’s internal control over financial reporting at December 31, 2010 as stated in their report appearing under Item 8.
Inherent Limitations on Effectiveness of Controls
The company’s management, including the CEO and CFO, has designed our disclosure controls and procedures and our internal control over financial reporting to provide reasonable assurances that the controls’ objectives will be met. However, management does not expect that disclosure controls and procedures or our internal control over financial reporting will prevent or detect all error and all fraud. A control system, no matter how well designed and operated, can provide only reasonable, not absolute, assurance that the control system’s objectives will be met. The design of a control system must reflect the fact that there are resource constraints, and the benefits of controls must be considered relative to their costs. Further, because of the inherent limitations in all control systems, no evaluation of controls can provide absolute assurance that misstatements due to error or fraud will not occur or that all control issues and instances of fraud, if any, within the company have been detected. These inherent limitations include the realities that judgments in decision-making can be faulty and that breakdowns can occur because of simple error or mistake. Controls can also be circumvented by the individual acts of some persons, by collusion of two or more people, or by management override of the controls. The design of any system of controls is based in part on certain assumptions about the likelihood of future events, and there can be no assurance that any system’s design will succeed in achieving its stated goals under all potential future conditions. Projections of any evaluation of a system’s control effectiveness into future periods are subject to risks. Over time, controls may become inadequate because of changes in conditions or deterioration in the degree of compliance with policies or procedures.
None.
PART III
Incorporated by reference from the information under the captions “Proposal - Election of Directors,” “Section 16(a) Beneficial Ownership Reporting Compliance” and “Information About The Board of Directors” in our definitive proxy statement for the 2011 Annual Meeting of Stockholders and from Item 1–“Executive Officers of the Registrant” in Part I above.
Incorporated by reference from the information under the captions “Executive Compensation,” “Compensation Committee Interlocks And Insider Participations,” “Report Of The Compensation Committee on Executive Compensation For Fiscal Year 2010,” (which report shall be deemed to be “furnished” and not “filed” with the SEC) and “Information About The Board of Directors” in our definitive proxy statement for the 2011 Annual Meeting of Stockholders.
Incorporated by reference from the information under the captions “Security Ownership Of Certain Beneficial Owners And Management” and “Equity Compensation Plan Information” in our definitive proxy statement for the 2011 Annual Meeting of Stockholders.
Information regarding our stock-based compensation awards outstanding and available for future grants as of December 31, 2010 is presented in Note 14, “Stockholders’ Equity” to our “Consolidated Financial Statements and Supplementary Data” included under Item 8 of this report.
Incorporated by reference from the information contained under the caption “Certain Relationships And Related Transactions” and “Information About The Board of Directors” in our definitive proxy statement for the 2011 Annual Meeting of Stockholders.
Incorporated by reference from the information under the captions “Proposal - Ratification Of Selection Of Our Independent Registered Public Accounting Firm,” in our definitive proxy statement for the 2011 Annual Meeting of Stockholders.
PART IV
|
(a)
|
Documents Filed as Part of this Report.
|
|
(1)
|
Financial Statements and Supplementary Data
|
|
·
|
Report of Independent Registered Public Accounting Firm
|
|
·
|
Consolidated Balance Sheets as of December 31, 2010 and January 1, 2010
|
|
·
|
Consolidated Statements of Operations for the year ended December 31, 2010, the year ended January 1, 2010, and the year ended January 2, 2009
|
|
·
|
Consolidated Statements of Comprehensive Income for the year ended December 31, 2010, the year ended January 1, 2010, and the year ended January 2, 2009
|
|
·
|
Consolidated Statements of Changes in Stockholders’ Equity for the year ended December 31, 2010, the year ended January 1, 2010, and the year ended January 2, 2009
|
|
·
|
Consolidated Statements of Cash Flows for the year ended December 31, 2010, the year ended January 1, 2010, and the year ended January 2, 2009
|
|
·
|
Notes to Consolidated Financial Statements.
|
|
(2)
|
Schedules are omitted because they are not applicable, not required or because the required information is included in the Consolidated Financial Statements or Notes thereto.
|
|
(3)
|
Exhibits
|
|
Exhibit Number
|
Exhibit Description
|
Incorporated by Reference
|
Filed Herewith
|
|||||||
|
Form
|
Exhibit
|
Filing Date
|
||||||||
| 2.1 | Implementation Agreement between Universe Bidco Limited, URS Corporation and Scott Wilson Group plc., dated as of June 28, 2010. | 8-K | 2.2 | 7/2/2010 | ||||||
|
3.1
|
Restated Certificate of Incorporation of URS Corporation, as filed with the Secretary of State of the State of Delaware on September 9, 2008.
|
8-K
|
3.01
|
9/11/2008
|
||||||
|
3.5
|
Bylaws of URS Corporation, as amended and restated on February 26, 2010.
|
8-K
|
3.5
|
2/26/2010
|
||||||
|
4.1
|
Credit Agreement, exhibits and schedules dated as of November 15, 2007, and entered into by and among URS, a syndicate of lenders party thereto, Morgan Stanley Senior Funding, Inc., as a joint-lead arranger and syndication agent for lenders, and Wells Fargo Bank, N.A., as a joint-lead arranger and as administrative agent for the lenders.
|
10-Q
|
4.1
|
5/12/2010
|
||||||
|
4.2
|
First Amendment to the Credit Agreement, dated as of June 19, 2008, entered into by and among URS, a syndicate of lenders party thereto, Morgan Stanley Senior Funding, Inc., as a joint-lead arranger and syndication agent for lenders, and Wells Fargo Bank, N.A., as a joint-lead arranger and as administrative agent for the lenders.
|
8-K
|
4.1
|
6/24/2008
|
||||||
|
4.3
|
Second Amendment to the Credit Agreement dated as of August 25, 2010, entered into by and among URS Corporation, a syndicate of lenders party thereto, Wells Fargo Bank, N.A. administrative agent for the lenders, and credit support parties party thereto.
|
8-K
|
4.1
|
8/25/2010
|
||||||
|
4.4
|
Third Amendment to the Credit Agreement dated as of February 25, 2011, entered into by and among URS Corporation, a syndicate of lenders party thereto, Wells Fargo Bank, N.A. administrative agent for the lenders, and credit support parties thereto.
|
10-K | 4.4 | 2/28/2011 |
|
|||||
|
4.5
|
Consent Regarding Creation of New International Holding Company dated as of September 29, 2009, entered into by and among URS Corporation, a syndicate of lenders party thereto, Wells Fargo Bank, N.A., as agent for lenders, and URS Corporation’s Guarantors.
|
10-Q
|
4.1
|
11/12/2009
|
||||||
|
4.6
|
Consent Regarding Application of MIBRAG Proceeds dated as of February 16, 2010, entered into by and among URS Corporation, a syndicate of lenders party thereto, Wells Fargo Bank, N.A., as agent for lenders, and URS Corporation’s Guarantors.
|
10-K
|
4.4
|
3/2/2010
|
||||||
|
4.7
|
Revised Form of Universe Bidco Limited Loan Note Instrument constituting up to £30,000,000 Floating Range Loan Notes 2015.
|
10-Q
|
4.2
|
11/9/2010
|
||||||
|
4.8
|
Specimen Common Stock Certificate, filed as an exhibit to our registration statement on Form S-1 or amendments thereto.
|
S-1
|
4.1
|
6/5/1991
|
||||||
|
Exhibit Number
|
Exhibit Description
|
Incorporated by Reference
|
Filed Herewith
|
|||||||
|
Form
|
Exhibit
|
Filing Date
|
||||||||
|
10.1*
|
Employee Stock Purchase Plan of URS Corporation approved as of May 22, 2008.
|
DEF 14A
|
Appendix C
|
4/22/2008
|
||||||
|
10.2*
|
URS Corporation Amended and Restated 1999 Equity Incentive Plan, dated as of September 30, 2006.
|
8-K
|
10.2
|
9/13/2006
|
||||||
|
10.3*
|
URS Corporation 2008 Equity Incentive Plan, approved as of May 22, 2008.
|
8-K
|
10.1
|
5/23/2008
|
||||||
|
10.4*
|
URS Corporation 2008 Equity Incentive Plan, as amended on May 26, 2010.
|
10-Q
|
10.1
|
8/10/2010
|
||||||
|
10.5*
|
Non-Executive Directors Stock Grant Plan of URS Corporation, adopted December 17, 1996.
|
10-K
|
10.5
|
1/14/1997
|
||||||
|
10.6*
|
Selected Executive Deferred Compensation Plan of URS Corporation.
|
S-1
|
10.3
|
6/5/1991
|
||||||
|
10.7*
|
URS Corporation Restated Incentive Compensation Plan.
|
8-K
|
10.1
|
3/31/2009
|
||||||
|
10.8*
|
URS Corporation Restated Incentive Compensation Plan 2010 Plan Year Summary.
|
8-K
|
10.1
|
3/26/2010
|
||||||
|
10.9*
|
First Amendment to the Restated Incentive Compensation Plan 2009 Plan Year Summary.
|
10-Q
|
10.2
|
11/12/2009
|
||||||
|
10.10*
|
Non-Executive Directors Stock Grant Plan, as amended.
|
10-Q
|
10.1
|
3/17/1998
|
||||||
|
10.11*
|
EG&G Technical Services, Inc. Amended and Restated Employees Retirement Plan.
|
10-Q
|
10.3
|
5/12/2010
|
||||||
|
10.12*
|
First Amendment to the EG&G Technical Services, Inc. Employees Retirement Plan.
|
10-Q
|
10.4
|
11/12/2009
|
||||||
|
10.13*
|
Second Amendment to the EG&G Technical Services, Inc. Employees Retirement Plan.
|
10-Q
|
10.5
|
11/12/2009
|
||||||
|
10.14*
|
Third Amendment to the EG&G Technical Services, Inc. Employees Retirement Plan.
|
10-Q
|
10.6
|
11/12/2009
|
||||||
|
10.15*
|
Fourth Amendment to the EG&G Technical Services, Inc. Employees Retirement Plan.
|
10-Q
|
10.4
|
5/12/2010
|
||||||
|
10.16*
|
Fifth Amendment to the EG&G Technical Services, Inc. Employees Retirement Plan.
|
10-Q
|
10.5
|
5/12/2010
|
||||||
|
10.17*
|
Sixth Amendment to the EG&G Technical Services, Inc. Employees Retirement Plan.
|
10-Q
|
10.6
|
5/12/2010
|
||||||
|
10.18*
|
Amended and Restated Employment Agreement, between URS Corporation and Martin M. Koffel, dated as of September 5, 2003.
|
10-K
|
10.10
|
1/22/2004
|
||||||
|
10.19*
|
First Amendment to the Amended and Restated Employment Agreement between URS Corporation and Martin M. Koffel, dated as of December 7, 2006.
|
8-K
|
10.1
|
12/8/2006
|
||||||
|
10.20*
|
Second Amendment to the Amended and Restated Employment Agreement between URS Corporation and Martin M. Koffel, dated as of December 10, 2008.
|
8-K
|
10.1
|
12/10/2008
|
||||||
|
10.21*
|
Amended and Restated Supplemental Executive Retirement Agreement between URS Corporation and Martin M. Koffel, dated as of December 7, 2006.
|
8-K
|
10.3
|
12/8/2006
|
||||||
|
Exhibit Number
|
Exhibit Description
|
Incorporated by Reference
|
Filed Herewith
|
|||||||
|
Form
|
Exhibit
|
Filing Date
|
||||||||
|
10.22*
|
First Amendment to the Amended and Restated Supplemental Executive Retirement Agreement between URS Corporation and Martin M. Koffel, dated as of December 10, 2008.
|
8-K
|
10.2
|
12/10/2008
|
||||||
|
10.23*
|
Employment Agreement between URS Corporation and Joseph Masters, dated as of September 8, 2000.
|
10-K
|
10.14
|
1/18/2001
|
||||||
|
10.24*
|
First Amendment to Employment Agreement between URS Corporation and Joseph Masters, dated as of August 11, 2003.
|
10-K
|
10.15
|
1/22/2004
|
||||||
|
10.25*
|
Second Amendment to Employment Agreement between URS Corporation and Joseph Masters, dated as of August 20, 2004.
|
10-K
|
10.17
|
1/13/2005
|
||||||
|
10.26*
|
Fourth Amendment to Employment Agreement between URS Corporation and Joseph Masters, dated as of November 15, 2005.
|
8-K
|
10.1
|
11/18/2005
|
||||||
|
10.27*
|
Fifth Amendment to Employment Agreement between URS Corporation and Joseph Masters, dated as of August 1, 2008.
|
10-Q
|
10.6
|
8/6/2008
|
||||||
|
10.28*
|
Employment Agreement between URS Corporation and Reed N. Brimhall, dated as of May 19, 2003.
|
10-Q
|
10.1
|
9/15/2003
|
||||||
|
10.29*
|
First Amendment to Employment Agreement between URS Corporation and Reed N. Brimhall, dated as of August 1, 2008.
|
10-Q
|
10.9
|
8/6/2008
|
||||||
|
10.30*
|
Revised Compensatory Arrangement For Reed N. Brimhall.
|
10-Q
|
10.3
|
11/12/2009
|
||||||
|
10.31*
|
Employment Agreement between URS Corporation and Gary V. Jandegian, dated as of January 29, 2004.
|
10-Q
|
10.1
|
3/15/2004
|
||||||
|
10.32*
|
First Amendment to Employment Agreement between URS Corporation and Gary V. Jandegian, dated as of August 1, 2008.
|
10-Q
|
10.7
|
8/6/2008
|
||||||
|
10.33*
|
Employment Agreement between URS Corporation and Thomas W. Bishop, dated as of January 30, 2004.
|
10-Q
|
10.2
|
3/15/2004
|
||||||
|
10.34*
|
First Amendment to Employment Agreement between URS Corporation and Thomas W. Bishop, dated as of August 1, 2008.
|
10-Q
|
10.10
|
8/6/2008
|
||||||
|
10.35*
|
Compensation Arrangement for Thomas W. Bishop.
|
10-Q
|
10.4
|
11/9/2010
|
||||||
|
10.36*
|
Employment Agreement between EG&G Technical Services, Inc. and Randall A. Wotring, dated as of November 19, 2004.
|
8-K
|
10.1
|
11/24/2004
|
||||||
|
10.37*
|
First Amendment to Employment Agreement between EG&G Technical Services, Inc. and Randall A. Wotring, dated as of August 1, 2008.
|
10-Q
|
10.8
|
8/6/2008
|
||||||
|
10.38*
|
Employment Agreement between URS Corporation and H. Thomas Hicks, dated as of May 31, 2005.
|
8-K
|
10.2
|
5/31/2005
|
||||||
|
10.39*
|
First Amendment to Employment Agreement between URS Corporation and H. Thomas Hicks, dated as of August 1, 2008.
|
10-Q
|
10.5
|
8/6/2008
|
||||||
|
Exhibit Number
|
Exhibit Description
|
Incorporated by Reference
|
Filed Herewith
|
|||||||
|
Form
|
Exhibit
|
Filing Date
|
||||||||
|
10.40*
|
Amended and Restated Employment Agreement between URS Corporation and Susan B. Kilgannon, dated as of September 18, 2009.
|
10-Q
|
10.1
|
11/12/2009
|
||||||
|
10.41*
|
Employment Agreement between URS Corporation and Thomas H. Zarges, dated as of August 7, 2008.
|
10-Q
|
10.1
|
11/6/2008
|
||||||
|
10.42*
|
Service Agreement between SWK Holdings Ltd. and Hugh Blackwood dated as of May 5, 1995.
|
10-Q
|
10.2
|
11/9/2010
|
||||||
|
10.43*
|
Compensatory Arrangement for Hugh Blackwood.
|
10-Q
|
10.3
|
11/9/2010
|
||||||
|
10.44*
|
Form of 1999 Equity Incentive Plan Restricted Stock Unit Award Agreement, executed between URS Corporation and Martin M. Koffel for 50,000 shares of deferred restricted stock units, dated as of July 12, 2004.
|
10-Q
|
10.3
|
9/9/2004
|
||||||
|
10.45*
|
First Amendment to the July 12, 2004 Restricted Stock Unit Award Agreement between URS Corporation and Martin M. Koffel, dated as of December 10, 2008.
|
8-K
|
10.3
|
12/10/2008
|
||||||
|
10.46*
|
2008 Equity Incentive Plan Restricted Stock Award between URS and Martin M. Koffel, dated December 10, 2008.
|
8-K
|
10.4
|
12/10/2008
|
||||||
|
10.47*
|
Form of 1999 Equity Incentive Plan Nonstatutory Stock Option Agreement and Grant Notice, executed as a separate agreement between URS Corporation and Gary V. Jandegian, dated as of July 12, 2004.
|
10-Q
|
10.2
|
5/10/2005
|
||||||
|
10.48*
|
Form of 1999 Equity Incentive Plan Restricted Stock Award as of May 25, 2006.
|
8-K
|
10.2
|
5/31/2006
|
||||||
|
10.49*
|
Form of 2008 Equity Incentive Plan Restricted Stock Award Grant Notice and Agreement.
|
8-K
|
10.5
|
12/10/2008
|
||||||
|
10.50*
|
Form of 2008 Equity Incentive Plan Restricted Stock Unit Award Grant Notice and Agreement.
|
8-K
|
10.6
|
12/10/2008
|
||||||
|
10.51*
|
Form of 2008 Equity Incentive Plan Restricted Stock Award Grant Notice and Agreement.
|
10-Q
|
10.7
|
11/12/2009
|
||||||
|
10.52*
|
Form of 2008 Equity Incentive Plan Restricted Stock Unit Award Grant Notice and Agreement.
|
10-Q
|
10.8
|
11/12/2009
|
||||||
|
10.53*
|
Form of Officer Indemnification Agreement between URS Corporation and each of Thomas W. Bishop, Hugh Blackwood, Reed N. Brimhall, Susan B. Kilgannon, Gary V. Jandegian, Joseph Masters, Randall A. Wotring, H. Thomas Hicks and Thomas H. Zarges.
|
10-Q
|
10.3
|
6/14/2004
|
||||||
|
10.54*
|
Form of Director Indemnification Agreement between URS Corporation and each of Armen Der Marderosian, Mickey P. Foret, Senator William H. Frist, Lydia H. Kennard, Donald R. Knauss, Martin M. Koffel, General Joseph W. Ralston, USAF (Ret.), John D. Roach, Sabrina L. Simmons, Douglas W. Stotlar, William P. Sullivan, and William D. Walsh.
|
10-Q
|
10.4
|
6/14/2004
|
||||||
|
10.55*
|
Non-Executive Director Compensation Program.
|
10-Q
|
10.2
|
8/10/2010
|
||||||
|
Exhibit Number
|
Exhibit Description
|
Incorporated by Reference
|
Filed Herewith
|
|||||||
|
Form
|
Exhibit
|
Filing Date
|
||||||||
|
10.56*
|
Description of URS Corporation tax gross-up policy and modification of tax gross-up arrangements with Messrs. Koffel and Zarges.
|
8-K
|
N/A
|
4/29/2009
|
||||||
|
10.57*†
|
Executive Life Insurance Agreement between Washington Group International and Thomas H. Zarges, dated as of January 1, 2005.
|
10-K
|
10.32
|
3/2/2006
|
||||||
|
10.58*
|
URS Energy & Construction Holdings, Inc. Restoration Plan.
|
10-K | 10.58 | 2/28/2011 |
|
|||||
|
10.59*
|
Washington Group International, Inc. Voluntary Deferred Compensation Plan.
|
10-K | 10.59 | 2/28/2011 |
|
|||||
|
10.60*
|
Amendment to the Washington Group International, Inc. Voluntary Deferred Compensation Plan, dated as of December 24, 2010.
|
10-K | 10.60 | 2/28/2011 |
|
|||||
|
10.61*†
|
Washington Group International, Inc. Key Executive Disability Insurance Plan.
|
10-K
|
10.12
|
Fiscal Year 12/31/92
|
||||||
|
21.1
|
Subsidiaries of URS Corporation.
|
10-K | 21.1 | 2/28/2011 |
|
|||||
|
X
|
||||||||||
|
24.1
|
Power of Attorney of URS Corporation's directors and officers.
|
10-K | 24.1 | 2/28/2011 |
|
|||||
|
X
|
||||||||||
|
X
|
||||||||||
|
X
|
||||||||||
|
101.INS#
|
XBRL Instance Document.
|
10-K | 101.INS | 2/28/2011 |
|
|||||
|
101.SCH#
|
XBRL Taxonomy Extension Schema Document.
|
10-K | 101.SCH | 2/28/2011 |
|
|||||
|
101.CAL#
|
XBRL Taxonomy Extension Calculation Linkbase Document.
|
10-K | 101.CAL | 2/28/2011 |
|
|||||
|
101.LAB#
|
XBRL Taxonomy Extension Label Linkbase Document.
|
10-K | 101.LAB | 2/28/2011 |
|
|||||
|
101.PRE#
|
XBRL Taxonomy Extension Presentation Linkbase Document.
|
10-K | 101.PRE | 2/28/2011 |
|
|||||
|
101.DEF#
|
XBRL Taxonomy Extension Definition Linkbase Document.
|
10-K | 101.DEF | 2/28/2011 |
|
|||||
| * |
Represents a management contract or compensatory plan or arrangement.
|
|||||||
| † |
Indicates a material agreement previously filed by Washington Group International (Delaware), a public company acquired by URS Corporation on November 15, 2007.
|
|||||||
| # |
Pursuant to Rule 406T of Regulation S-T, these interactive data files (i) are not deemed filed or part of a registration statement or prospectus for purposes of Sections 11 or 12 of the Securities Act of 1933, are not deemed filed for purposes of Section 18 of the Securities Exchange Act of 1934, irrespective of any general incorporation language included in any such filings, and otherwise are not subject to liability under these sections; and (ii) are deemed to have complied with Rule 405 of Regulation S-T (“Rule 405”) and are not subject to liability under the anti-fraud provisions of the Section 17(a)(1) of the Securities Act of 1933, Section 10(b) of the Securities Exchange Act of 1934 or under any other liability provision if we have made a good faith attempt to comply with Rule 405 and, after we become aware that the interactive data files fail to comply with Rule 405, we promptly amend the interactive data files.
|
|||||||
SIGNATURES
Pursuant to the requirements of Section 13 or 15(d) of the Securities Exchange Act of 1934, URS Corporation, the Registrant, has duly caused this amendment to report to be signed on its behalf by the undersigned, thereunto duly authorized.
|
URS Corporation
(Registrant)
|
|||
|
Dated: May 20, 2011
|
By:
|
/s/ Reed N. Brimhall | |
| Reed N. Brimhall | |||
| Vice President, Controller and Chief Accounting Officer | |||
Pursuant to the requirements of the Securities Exchange Act of 1934, this amendment to report has been signed below by the following persons on behalf of the Registrant in the capacities and on the date indicated.
|
Signature
|
Title
|
Date
|
||
|
/s/ Martin M. Koffel*
|
Chairman of the Board of Directors and Chief Executive Officer
|
May 20, 2011
|
||
|
Martin M. Koffel
|
||||
|
/s/ H. Thomas Hicks
|
Chief Financial Officer
|
May 20, 2011
|
||
|
H. Thomas Hicks
|
||||
|
/s/ Reed N. Brimhall
|
Vice President, Controller and Chief Accounting Officer
|
May 20, 2011
|
||
|
Reed N. Brimhall
|
|
/s/ Armen Der Marderosian*
|
Director
|
May 20, 2011
|
||
|
Armen Der Marderosian
|
||||
|
/s/ Mickey P. Foret*
|
Director
|
May 20, 2011
|
||
|
Mickey P. Foret
|
||||
|
/s/ William H. Frist*
|
Director
|
May 20, 2011
|
||
|
William H. Frist
|
|
/s/ Lydia H. Kennard*
|
Director
|
May 20, 2011
|
||
|
Lydia H. Kennard
|
||||
|
/s/ Donald R. Knauss*
|
Director
|
May 20, 2011
|
||
|
Donald R. Knauss
|
||||
|
/s/ Joseph W. Ralston*
|
Director
|
May 20, 2011
|
||
|
Joseph W. Ralston
|
|
/s/ John D. Roach*
|
Director
|
May 20, 2011
|
||
|
John D. Roach
|
|
Signature
|
Title
|
Date
|
||
|
/s/ Sabrina L. Simmons*
|
Director
|
May 20, 2011
|
||
|
Sabrina L. Simmons
|
||||
|
/s/ Douglas W. Stotlar*
|
Director
|
May 20, 2011
|
||
|
Douglas W. Stotlar
|
|
/s/ William P. Sullivan*
|
Director
|
May 20, 2011
|
||
|
William P. Sullivan
|
|
/s/ William D. Walsh*
|
Director
|
May 20, 2011
|
||
|
William D. Walsh
|
||||
|
*By /s/ H. Thomas Hicks
|
|
|
||
|
H. Thomas Hicks, Attorney-in-fact
|
||||
|
*By /s/ Reed N. Brimhall
|
|
|
||
|
Reed N. Brimhall, Attorney-in-fact
|
163