Attached files
| file | filename |
|---|---|
| 8-K - CHINA FUND INC | v223515_8k.htm |
|
THE CHINA FUND, INC. (CHN)
MONTHLY INSIGHT
|
|
AT APRIL 30, 2011
|
IN BRIEF
|
|
|
Net asset value per share
|
US$35.23
|
|
Market price
|
US$32.10
|
|
Premium/(discount)
|
(8.88%)
|
|
Fund size
|
US$802.7m
|
|
Source: State Street Bank and Trust Company.
|
|
|
At April 30, 2011
|
US$ return
|
|||
|
China Fund
NAV
|
MSCI Golden
Dragon*
|
|||
|
%
|
%
|
|||
|
One month
|
3.4
|
|
3.3
|
|
|
Year to date
|
(0.2
|
) |
3.3
|
|
|
One year
|
15.9
|
18.9
|
||
|
Three years % pa
|
8.9
|
1.8
|
|
|
|
Past performance is not a guide to future returns.
Source: State Street Bank and Trust Company. NAV performance.
*Source for index data: MSCI.
|
||||
SHANGHAI TEAM

The Martin Currie Shanghai team
|
MANAGER’S COMMENTARY
|
||||||||
|
Inflation remains the bull in the China shop. The official CPI number rose to 5.4% in March, though the reality feels faster. Some food prices have fallen in the past couple of weeks, but non-food inflation is accelerating. The side-effects of price controls, be they a shortage of diesel or (likely this summer in some provinces) electricity, are starting to be felt. The response has been one 25-basis-point rise in interest rates and another 50-basis-point rise in reserve-ratio requirements (meaning that 20.5% of the big banks’ deposit base is now locked away with the central bank). The government remains reluctant to use the currency to stem inflation; despite local paper headlines shouting ‘renminbi hits new highs’, this is entirely a function of US dollar weakness. So far this year, the yuan is actually down by 9.4% against the euro and 5.8% against that other strong currency, the British pound! One hint as to the reason can be found in the news that China recorded a first-quarter trade deficit of US$1.02 billion. This was immediately dismissed as a blip by economists, but seems to the managers to be the natural result of rising costs, a tough environment for exports and booming domestic consumption. Perhaps the biggest risk in China investment is what happens when the ‘one-way bet’ on the renminbi suddenly becomes less certain. The hot pursuit of renminbi-denominated ‘dim sum’ bonds reflects this mentality; why buy a bond yielding 1.5% unless you expect the currency to appreciate at least 5%? There is nothing worse than cold dim sum...
The Hong Kong and A-share markets in April resembled the progress of the Grand Old Duke of York. The A-share IPO market, having raised US$15.8 billion in the first quarter ran into the rocks. Of 24 new stocks making their debut in April, two-thirds of them went directly underwater on the first trading day. The fate of China’s largest auto dealer, whose issue price was 40 times the forward price/earnings ratio, was particularly spectacular, falling by 23% on day one. Hong Kong also saw a raft of insider placements (never a good sign). Taiwan was the pick of the Chinese markets, as the decision to combine presidential and legislative elections on 14 January next year improved the electoral chances of Ma Ying-jeou and the KMT. Inflation in Taiwan is far more subdued than on the mainland; the 3% rise recently announced for government employees is the first since 2005. It is little wonder that we now hear more stories of Taiwanese companies deciding to expand capacity at home, rather than on the mainland.
In a busy month there was news of income tax reform, which will reduce the percentage of salaried employees who pay it from 28% to 12% but tax the rich more heavily, increasing the top rate to 45%. Official figures suggested that rural incomes increased faster in the first quarter than urban incomes (+20.6% year on year compared with +12.3%) – a function of increasing food prices, I suppose – at the same time as the latest census revealed that the proportion of the urban population had already risen to 49.7%, up from only 36.2% in 2000.
|
INVESTMENT STRATEGY
The Fund is 97.9% invested with holdings in 60 companies. Our weighting in Taiwan is 23.1%, in A-shares 17.2% and in direct investments just 4.8%.
During the month we took profits on two long-term holdings in the consumer sector, Hsu Fu Chi International and Wumart Stores, as well as the Taiwanese conglomerate Lien Hwa Industrial. We used the cash to add to our overweight position in healthcare, buying Jiangsu Yuyue Medical Equipment and China Shineway Pharmaceuatical, as well as buying internet leader Tencent Holdings, which now looks cheap relative to recent internet listings, and Yuanta Financial Holdings, on its acquisition of Polaris Securities.
In the direct portfolio we have now exited the Ugent convertible bond investment. With the disposal of this investment, we have recovered over half of that initial investment. The China Fund, Inc will of course receive the full value of the original investment, as agreed in December 2010 and detailed within the Fund’s 2010 Annual Report.
Chris Ruffle, Martin Currie Inc*
*Martin Currie Ltd and Heartland Capital Management Ltd (‘HCML’) have established MC China Ltd (‘MCCL’), as a joint venture company, to provide investment advisory services to the range of China investment products managed by Martin Currie and its affiliates.
HCML has seconded both Chris Ruffle and Shifeng Ke to Martin Currie, Inc., and its affiliates, on a full-time basis.
MONTHLY INSIGHT
|
FUND DETAILS
|
|
Market cap
|
US$731.3m
|
|
Shares outstanding
|
22,781,762
|
|
Exchange listed
|
NYSE
|
|
Listing date
|
July 10, 1992
|
|
Listing and direct investment manager
|
Martin Currie Inc
|
|
Source: State Street Bank and Trust Company.
|
ASSET ALLOCATION

Source: State Street Bank and Trust Company
|
INDUSTRY ALLOCATION
|
||||||||
|
The China Fund, Inc %
|
MSCI Golden Dragon %
|
|||||||
|
Healthcare
|
22.7 | 0.3 | ||||||
|
Consumer discretionary
|
20.5 | 6.3 | ||||||
|
Consumer staples
|
17.9 | 2.9 | ||||||
|
Financials
|
14.3 | 35.8 | ||||||
|
Information technology
|
7.7 | 20.5 | ||||||
|
Industrials
|
5.4 | 7.4 | ||||||
|
Utilities
|
3.1 | 3.4 | ||||||
|
Materials
|
2.9 | 7.9 | ||||||
|
Telecommunications
|
2.6 | 6.5 | ||||||
|
Energy
|
0.8 | 9.0 | ||||||
|
Other assets & liabilities
|
2.1 | — | ||||||
|
Source: State Street Bank and Trust Company. Source for index data: MSCI
|
||||||||
|
PERFORMANCE
|
(US$ RETURNS) | |||||||
|
NAV %
|
Market price %
|
|||||||
|
One month
|
3.4 | 2.0 | ||||||
|
Year to date
|
(0.2 | ) | (1.2 | ) | ||||
|
Three years % pa
|
8.9 | 10.6 | ||||||
|
Past performance is not a guide to future returns.
|
||||||||
|
Three year returns are annualized.
|
||||||||
|
Source: State Street Bank and Trust Company
|
||||||||
|
15 LARGEST HOLDINGS (51.8%)
|
|||||
|
Fund %
|
|||||
|
China Medical System Holdings
|
Healthcare
|
9.6 | |||
|
Huiyin Household Appliances
|
Consumer discretionary
|
4.7 | |||
|
Far Eastern Department Stores
|
Consumer discretionary
|
4.3 | |||
|
Ping An Insurance
|
Financials
|
3.8 | |||
|
Hand Enterprise Solutions
|
Information technology
|
3.5 | |||
|
Hsu Fu Chi International
|
Consumer staples
|
3.3 | |||
|
Shandong Weigao Group
|
Healthcare
|
3.1 | |||
|
FamilyMart
|
Consumer discretionary
|
2.8 | |||
|
Wumart Stores
|
Consumer staples
|
2.8 | |||
|
Ruentex Development
|
Financials
|
2.6 | |||
|
Sinopharm Group
|
Healthcare
|
2.6 | |||
|
China Fishery Group
|
Consumer staples
|
2.5 | |||
|
Enn Energy
|
Utilities
|
2.2 | |||
|
Boshiwa International Holding
|
Consumer discretionary
|
2.0 | |||
|
Chinatrust Financial Holding
|
Financials
|
2.0 | |||
|
DIRECT INVESTMENTS (4.8%)
|
|||||
|
Fund %
|
|||||
|
Zong Su Foods
|
Consumer staples
|
1.9 | |||
|
China Bright
|
Healthcare
|
1.9 | |||
|
Qingdao Bright Moon
|
Industrials
|
1.0 | |||
|
China Silicon
|
Information technology
|
0.0 | |||
|
Hand Enterprise Solutions (preferred)
|
Information technology
|
0.0 | |||
Source: State Street Bank and Trust Company.
|
FUND PERFORMANCE (BASED ON NET ASSET VALUE)
|
(US$ returns)
|
|||||||||||||||||||||||||||
|
One month
|
Three months
|
Calendar year
|
One year
|
Three years
|
Five years
|
Since launch
|
||||||||||||||||||||||
|
%
|
%
|
to date %
|
%
|
% pa
|
% pa
|
% pa
|
||||||||||||||||||||||
|
The China Fund, Inc.
|
3.4 | 3.6 | (0.2 | ) | 15.9 | 8.9 | 20.9 | 12.7 | ||||||||||||||||||||
|
MSCI Golden Dragon
|
3.3 | 2.1 | 3.3 | 18.9 | 1.8 | 10.4 | 11.0 | |||||||||||||||||||||
|
Hang Seng Chinese Enterprise
|
(0.7 | ) | 5.5 | 4.2 | 8.4 | (2.3 | ) | 14.0 | 19.5 | |||||||||||||||||||
|
Shanghai Stock Exchange 180
|
0.6 | 6.4 | 5.5 | 6.7 | (6.4 | ) | 25.2 | n/a | ||||||||||||||||||||
Past performance is not a guide to future returns. Source: State Street Bank and Trust Company. Launch date July 10, 1992. Three, five year and since launch returns are all annualized. Source for index data: MSCI for the MSCI Golden Dragon and Copyright 2011 Bloomberg LP for the Hang Seng China Enterprise and the Shanghai Stock Exchange 180. For a full description of each index please see the index descriptions section.
PERFORMANCE IN PERSPECTIVE
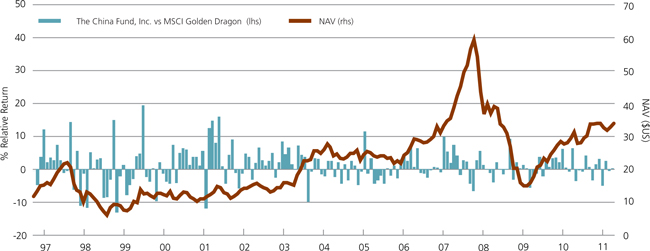
Past performance is not a guide to future returns.
Source: Martin Currie Inc as at April 30, 2011.
MONTHLY INSIGHT
THE CHINA FUND INC. PREMIUM/DISCOUNT

Past performance is not a guide to future returns.
Source: Martin Currie Inc as at April 30, 2011.
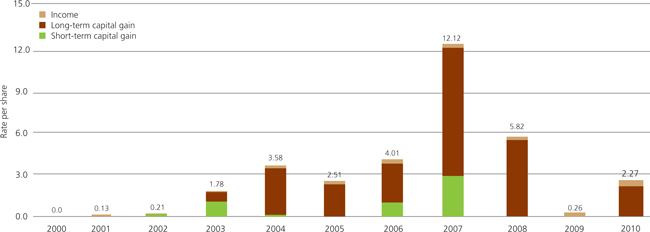
10 YEAR DIVIDEND HISTORY CHART
|
2000
|
2001
|
2002
|
2003
|
2004
|
2005
|
2006
|
2007
|
2008
|
2009
|
2010
|
||||||||||||||||||||||||||||||||||
|
Total
|
0.00 | 0.13 | 0.21 | 1.78 | 3.58 | 2.51 | 4.01 | 12.12 | 5.82 | 0.26 | 2.27 | |||||||||||||||||||||||||||||||||
|
Income
|
0.00 | 0.13 | 0.06 | 0.07 | 0.20 | 0.22 | 0.30 | 0.28 | 0.48 | 0.26 | 0.37 | |||||||||||||||||||||||||||||||||
|
Long-term capital
|
0.00 | 0.00 | 0.00 | 0.67 | 3.27 | 2.29 | 2.73 | 9.00 | 5.34 | 0.00 | 1.90 | |||||||||||||||||||||||||||||||||
|
Short-term capital
|
0.00 | 0.00 | 0.15 | 1.04 | 0.11 | 0.00 | 0.98 | 2.84 | 0.00 | 0.00 | 0.00 | |||||||||||||||||||||||||||||||||
Past performance is not a guide to future returns.
Source: State Street Bank and Trust Company.
|
Sector
|
Company (BBG ticker)
|
Price
|
Holding
|
Value US$
|
% of portfolio
|
||||
|
TAIWAN
|
23.1
|
||||||||
|
Far Eastern Department Stores
|
2903
|
TT
|
NT$50.6
|
19,543,604
|
$34,530,662
|
4.3
|
|||
|
FamilyMart
|
5903
|
TT
|
NT$143.0
|
4,501,652
|
$22,478,001
|
2.8
|
|||
|
Ruentex Development Co
|
9945
|
TT
|
NT$47.7
|
12,694,000
|
$21,143,000
|
2.6
|
|||
|
Chinatrust Financial
|
2891
|
TT
|
NT$26.3
|
17,527,288
|
$16,065,482
|
2.0
|
|||
|
Uni-President Enterprises Corp.
|
1216
|
TT
|
NT$41.2
|
10,023,901
|
$14,420,613
|
1.8
|
|||
|
Yuanta Financial Holdings
|
2885
|
TT
|
NT$19.9
|
17,683,593
|
$12,287,777
|
1.5
|
|||
|
China Metal Products
|
1532
|
TT
|
NT$30.1
|
11,500,347
|
$12,087,241
|
1.5
|
|||
|
WPG Holdings Co
|
3702
|
TT
|
NT$52.9
|
5,335,103
|
$9,854,809
|
1.2
|
|||
|
KGI Securities
|
6008
|
TT
|
NT$15.0
|
16,984,780
|
$8,896,126
|
1.1
|
|||
|
Synnex Technology
|
2347
|
TT
|
NT$73.1
|
3,088,006
|
$7,882,160
|
1.0
|
|||
|
Fubon Financial Holdings
|
2881
|
TT
|
NT$42.0
|
5,195,134
|
$7,618,961
|
1.0
|
|||
|
Test-Rite International
|
2908
|
TT
|
NT$22.9
|
8,457,000
|
$6,762,411
|
0.9
|
|||
|
Taiwan Life 4percent Conv Bond*
|
n/a
|
NT$95.3
|
200,000,000
|
$6,656,773
|
0.8
|
||||
|
Lien Hwa Industrial
|
1229
|
TT
|
NT$22.0
|
6,673,148
|
$5,114,639
|
0.6
|
|||
|
HONG KONG H
|
22.8
|
||||||||
|
China Medical System Holdings
|
867
|
HK
|
HK$8.3
|
72,353,760
|
$76,848,711
|
9.6
|
|||
|
Shandong Weigao Group Medical Polymer
|
8199
|
HK
|
HK$21.3
|
9,176,000
|
$24,926,276
|
3.1
|
|||
|
Wumart Stores
|
8277
|
HK
|
HK$17.8
|
9,810,750
|
$22,103,538
|
2.7
|
|||
|
Sinopharm Group
|
297
|
HK
|
HK$26.9
|
6,056,800
|
$20,897,751
|
2.6
|
|||
|
Boshiwa International Holding
|
1698
|
HK
|
HK$5.0
|
24,932,000
|
$16,177,417
|
2.0
|
|||
|
ZTE Corp.
|
763
|
HK
|
HK$28.0
|
2,250,826
|
$8,084,770
|
1.0
|
|||
|
Asian Citrus Holdings
|
73
|
HK
|
HK$8.8
|
6,677,000
|
$7,607,574
|
1.0
|
|||
|
Fook Woo
|
923
|
HK
|
HK$2.4
|
19,836,000
|
$6,154,499
|
0.8
|
|||
|
HONG KONG
|
19.3
|
||||||||
|
Huiyin Household Appliances
|
1280
|
HK
|
HK$1.8
|
160,413,750
|
$37,380,207
|
4.7
|
|||
|
Enn Energy
|
2688
|
HK
|
HK$26.6
|
5,084,000
|
$17,279,493
|
2.2
|
|||
|
Ports Design
|
589
|
HK
|
HK$21.4
|
4,549,500
|
$12,592,839
|
1.6
|
|||
|
China Mobile
|
941
|
HK
|
HK$71.4
|
1,365,500
|
$12,569,537
|
1.6
|
|||
|
Natural Beauty Bio-Technology
|
157
|
HK
|
HK$1.9
|
47,710,000
|
$11,793,214
|
1.5
|
|||
|
Shangri-La Asia
|
69
|
HK
|
HK$21.7
|
3,316,683
|
$9,244,499
|
1.1
|
|||
|
Chaoda Modern Agriculture (Holdings)
|
682
|
HK
|
HK$4.8
|
13,999,357
|
$8,741,206
|
1.1
|
|||
|
Tencent Holdings
|
700
|
HK
|
HK$221.0
|
291,000
|
$8,317,015
|
1.0
|
|||
|
Intime Department Store Group
|
1833
|
HK
|
HK$12.1
|
5,278,629
|
$8,195,774
|
1.0
|
|||
|
China Water Affairs
|
855
|
HK
|
HK$2.9
|
19,976,000
|
$7,560,968
|
0.9
|
|||
|
China Shineway Pharmaceutical Group
|
2877
|
HK
|
HK$18.8
|
3,041,000
|
$7,368,135
|
0.9
|
|||
|
SYSCAN Technology Holdings
|
8083
|
HK
|
HK$0.4
|
146,000,000
|
$6,766,700
|
0.8
|
|||
|
Golden Meditech Co
|
801
|
HK
|
HK$1.4
|
35,040,000
|
$6,180,252
|
0.8
|
|||
|
Yorkey Optical International Cayman
|
2788
|
HK
|
HK$1.3
|
4,862,926
|
$788,842
|
0.1
|
|||
|
FUJI Food & Catering Services
|
1175
|
HK
|
HK$0.0
|
5,462,000
|
$0
|
0.0
|
|||
|
EQUITY LINKED SECURITIES (‘A’ SHARES)
|
17.2
|
||||||||
|
Ping An Insurance
|
n/a
|
US$8.0
|
3,775,759
|
$30,381,743
|
3.8
|
||||
|
Hand Enterprise Solutions
|
300170
|
CH
|
Rmb16.2
|
11,238,137
|
$28,116,984
|
3.5
|
|||
|
Shanghai Qiangsheng
|
n/a
|
US$1.2
|
10,482,652
|
$11,934,489
|
1.5
|
||||
|
Wuliangye Yibin
|
n/a
|
US$5.1
|
2,334,507
|
$11,813,770
|
1.5
|
||||
|
Tangshan Jidong Cement
|
n/a
|
US$4.0
|
2,837,087
|
$11,411,561
|
1.4
|
||||
|
Zhejiang China Commodities City Group
|
n/a
|
US$4.0
|
2,771,970
|
$11,209,846
|
1.4
|
||||
|
Shanghai Yuyuan Tourist
|
n/a
|
US$2.0
|
429,303,600
|
$8,855,915
|
1.0
|
||||
|
Suning Appliance
|
n/a
|
US$2.0
|
4,311,019
|
$8,604,794
|
1.1
|
||||
|
Jiangsu Yuyue Medical Equipment
|
n/a
|
US$6.2
|
1,210,000
|
$7,521,722
|
0.9
|
||||
|
China Railway Construction Group
|
n/a
|
US$1.0
|
6,582,600
|
$6,841,709
|
0.9
|
||||
|
Qinghai Salt Lake Potash
|
n/a
|
US$8.3
|
178,729
|
$1,487,435
|
0.2
|
||||
*This is an unlisted convertible bond. Shares in Taiwan Life are listed on the Taiwan Stock Exchange.
MONTHLY INSIGHT
|
Sector
|
Company (BBG ticker)
|
Price
|
Holding
|
Value US$
|
% of portfolio
|
||||
|
SINGAPORE
|
6.2
|
||||||||
|
Hsu Fu Chi International
|
HFCI
|
SP
|
SG$3.8
|
8,485,084
|
$26,359,810
|
3.3
|
|||
|
China Fishery Group
|
CFG
|
SP
|
SG$1.8
|
13,594,872
|
$20,450,102
|
2.6
|
|||
|
CDW Holding
|
CDW
|
SP
|
SG$0.1
|
48,208,000
|
$2,660,268
|
0.3
|
|||
|
DIRECT
|
4.8
|
||||||||
|
Zong Su Foods
|
n/a
|
US$5,603.0
|
2,677
|
$15,000,034
|
1.9
|
||||
|
China Bright
|
n/a
|
HK$7.9
|
14,665,617
|
$14,991,407
|
1.9
|
||||
|
Qingdao Bright Moon
|
n/a
|
US$0.3
|
31,827,172
|
$8,561,509
|
1.0
|
||||
|
Hand Enterprise Solutions (preferred)
|
n/a
|
US$0.0
|
500,000
|
$0
|
0.0
|
||||
|
China Silicon Corp.
|
n/a
|
US$0.0
|
2,329,281
|
$0
|
0.0
|
||||
|
USA
|
4.5
|
||||||||
|
WuXi PharmaTech Cayman
|
WX
|
US
|
US$17.6
|
883,490
|
$15,549,424
|
1.9
|
|||
|
Mindray Medical International
|
MR
|
US
|
US$26.7
|
291,700
|
$7,797,141
|
1.0
|
|||
|
Far East Energy
|
FEEC
|
US
|
US$0.4
|
16,392,823
|
$6,557,129
|
0.8
|
|||
|
Hollysys Automation Technologies
|
HOLI
|
US
|
US$12.0
|
530,200
|
$6,367,702
|
0.8
|
|||
|
OTHER ASSETS & LIABILITIES
|
$16,828,836
|
2.1
|
|||||||
INDEX DESCRIPTIONS
MSCI Golden Dragon Index
The MSCI Golden Dragon is a free float-adjusted market capitalization index that is designed to measure equity market performance in the China region. As of May 2005 the MSCI Golden Dragon Index consisted of the following country indices: China, Hong Kong and Taiwan.
Hang Seng China Enterprise Index
The Hang Seng China Enterprise Index is a capitalization-weighted index comprised of state-owned Chinese companies (H-shares) listed on the Hong Kong Stock Exchange and included in Hans Seng Mainland China index.
Shanghai Stock Exchange 180 Index
The Shanghai Stock Exchange 180 ‘A’ Share Index is a capitalization-weighted index. The index tracks the daily price performance of the 180 most representative ‘A’ share stocks listed on the Shanghai Stock Exchange.
OBJECTIVE
The investment objective of the Fund is to achieve long term capital appreciation. The Fund seeks to achieve its objective through investment in the equity securities of companies and other entities with significant assets, investments, production activities, trading or other business interests in China or which derive a significant part of their revenue from China.
The Fund has an operating policy that the Fund will invest at least 80% of its assets in China companies. For this purpose, ‘China companies’ are (i) companies for which the principal securities trading market is in China; (ii) companies for which the principal securities trading market is outside of China or in companies organized outside of China, that in both cases derive at least 50% of their revenues from goods or services sold or produced, or have a least 50% of their assets in China; or (iii) companies organized in China. Under the policy, China will mean the People’s Republic of China, including Hong Kong, and Taiwan. The Fund will provide its stockholders with at least 60 days’ prior notice of any change to this policy.
CONTACTS
The China Fund, Inc.
c/o State Street Bank and Trust Company
2 Avenue de Lafayette
PO Box 5049
PO Box 5049
Boston, MA 02206-5049
Tel: (1) 888 CHN-CALL (246 2255)
www.chinafundinc.com
 |
IMPORTANT INFORMATION
This document is issued and approved by Martin Currie Inc (MC Inc), as investment adviser of The China Fund Inc (the Fund). MC Inc is authorised and regulated by the Financial Services Authority (FSA) and incorporated under limited liability in New York, USA. Registered in Scotland (No BR2575), registered address Saltire Court, 20 Castle Terrace, Edinburgh, EH1 2ES. Information herein is believed to be reliable but has not been verified by MC Inc. MC Inc makes no representation or warranty and does not accept any responsibility in relation to such information or for opinion or conclusion which the reader may draw from the newsletter.
Martin Currie Ltd and Heartland Capital Management Ltd (‘HCML’) have established MC China Ltd (‘MCCL’), as a joint venture company, to provide investment advisory services to the range of China investment products managed by Martin Currie and its affiliates. HCML has seconded both Chris Ruffle and Shifeng Ke to Martin Currie, Inc., and its affiliates, on a full-time basis.Heartland Capital Investment Consulting Ltd (‘HCIC’) is a wholly owned subsidiary of MC China Ltd. Research is undertaken by HCIC for MC China Ltd and provided to Martin Currie Investment Management Ltd, an affiliate of the investment manager, Martin Currie Inc, for Martin Currie China ‘A’ Share Fund Limited. HCIC may change its opinions and views without prior notice. It does not constitute investment advice nor is it an invitation to invest in this company.
The Fund is classified as a ‘non-diversified’ investment company under the US Investment Company Act of 1940 as amended. It meets the criteria of a closed ended US mutual fund and its shares are listed on the New York Stock Exchange. MC Inc has been appointed investment adviser to the Fund.
Investors are advised that they will not generally benefit from the rules and regulations of the United Kingdom Financial Services and Markets Act 2000 and the FSA for the protection of investors, nor benefit from the United Kingdom Financial Services Compensation Scheme, nor have access to the Financial Services Ombudsman in the event of a dispute. Investors will also have no rights of cancellation under the FSA’s Conduct of Business Sourcebook of the United Kingdom.
This newsletter does not constitute an offer of shares. MC Inc, its ultimate and intermediate holding companies, subsidiaries, affiliates, clients, directors or staff may, at any time, have a position in the market referred to herein, and may buy or sell securities, currencies, or any other financial instruments in such markets. The information or opinion expressed in this newsletter should not be construed to be a recommendation to buy or sell the securities, commodities, currencies or financial instruments referred to herein.
The information provided in this report should not be considered a recommendation to purchase or sell any particular security. There is no assurance that any securities discussed herein will remain in an account’s portfolio at the time you receive this report or that securities sold have not been repurchased.
It should not be assumed that any of the securities transactions or holdings discussed here were or will prove to be profitable, or that the investment recommendations or decisions we make in the future will be profitable or will equal the investment performance of the securities discussed herein.
Investing in the Fund involves certain considerations in addition to the risks normally associated with making investments in securities. The value of the shares issued by the Fund, and the income from them, may go down as well as up and there can be no assurance that upon sale, or otherwise, investors will receive back the amount originally invested. There can be no assurance that you will receive comparable performance returns, or that investments will reflect the performance of the stock examples contained in this document. Movements in foreign exchange rates may have a separate effect, unfavorable as well as favorable, on the gain or loss otherwise experienced on an investment. Past performance is not a guide to future returns. Accordingly, the Fund is only suitable for investment by investors who are able and willing to withstand the total loss of their investment. In particular, prospective investors should consider the following risks:
|
à
|
The companies quoted on Greater Chinese stock exchanges are exposed to the risks of political, social and religious instability, expropriation of assets or nationalisation, rapid rates of inflation, high interest rates, currency depreciation and fluctuations and changes in taxation, which may affect income and the value of investments.
|
|
à
|
At present, the securities market and the regulatory framework for the securities industry in China is at an early stage of development. The China Securities Regulatory Commission (CSRC) is responsible for supervising the national securities markets and producing relevant regulations. The Investment Regulations, under which the Fund invests in the People’s Republic of China (PRC) and which regulate repatriation and currency conversion, are new. The Investment Regulations give CSRC and State Administration of Foreign Exchange (SAFE) wide discretions and there is no precedent or certainty as to how these discretions might be exercised, either now or in the future. The Fund may, from time to time, obtain access to the securities markets in China via Access Products. Such products carry additional risk and may be less liquid than the underlying securities which they represent.
|
|
à
|
During the past 15 years, the PRC government has been reforming the economic and political systems of the PRC, and these reforms are expected to continue, as evidenced by the recently announced changes. The Fund’s operations and financial results could be adversely affected by adjustments in the PRC’s state plans, political, economic and social conditions, changes in the policies of the PRC government such as changes in laws and regulations (or the interpretation thereof), measures which may be introduced to control inflation, changes in the rate or method of taxation, imposition of additional restrictions on currency conversion and the imposition of additional import restrictions.
|
|
à
|
PRC’s disclosure and regulatory standards are in many respects less stringent than standards in certain Organisation for Economic Co-operation and Development (OECD) countries, and there may be less publicly available or less reliable information about PRC companies than is regularly published by or about companies from OECD countries.
|
|
à
|
The Shanghai Stock Exchange and Shenzhen Stock Exchange have lower trading volumes than most OECD exchanges and the market capitalisations of listed companies are small compared to those on more developed exchanges in developed markets. The listed equity securities of many companies in the PRC are accordingly materially less liquid, subject to greater dealing spreads and experience materially greater volatility than those of OECD countries. These factors could negatively affect the Fund’s NAV.
|
|
à
|
The Fund invests primarily in securities denominated in other currencies but its NAV will be quoted in US dollars. Accordingly, a change in the value of such securities against US dollars will result in a corresponding change in the US dollar NAV.
|
|
à
|
The marketability of quoted shares may be limited due to foreign investment restrictions, wide dealing spreads, exchange controls, foreign ownership restrictions, the restricted opening of stock exchanges and a narrow range of investors. Trading volume may be lower than on more developed stockmarkets, and equities are less liquid. Volatility of prices can also be greater than in more developed stockmarkets. The infrastructure for clearing, settlement and registration on the primary and secondary markets may be underdeveloped. Under certain circumstances, there may be delays in settling transactions in some of the markets.
|
Martin Currie Inc, registered in Scotland (no BR2575)
Registered office: Saltire Court, 20 Castle Terrace, Edinburgh EH1 2ES
Tel: 44 (0) 131 229 5252 Fax: 44 (0) 131 228 5959 www.martincurrie.com/china
North American office: 1350 Avenue of the Americas, Suite 3010, New York, NY
10019, USA Tel: (1) 212 258 1900 Fax: (1) 212 258 1919
Authorised and registered by the Financial Services Authority and incorporated with
limited liability in New York, USA.
Please note: calls to the above numbers may be recorded.