Attached files
| file | filename |
|---|---|
| 8-K - TRUSTCO BANK CORP N Y 8-K 5-19-2011 - TRUSTCO BANK CORP N Y | form8k.htm |
Exhibit 99(a)
Welcome to the
2011 Annual Meeting

Shareholder Assembly Agenda
•State of the Industry / Economy
•Financial Performance
•Performance vs. Peers & Stock Performance
•Dividend Record and Capital
•Future Plans
•Things to be Proud Of
•Questions and Answers

•Economic Conditions - Unemployment Level
- Housing Market
•Increasing Regulation
•Government Intervention - Unwinding
•Large Deficits / Low Interest Rates / Rising
Inflation / Rising Taxes
Inflation / Rising Taxes
•Asset Quality
State of the Industry
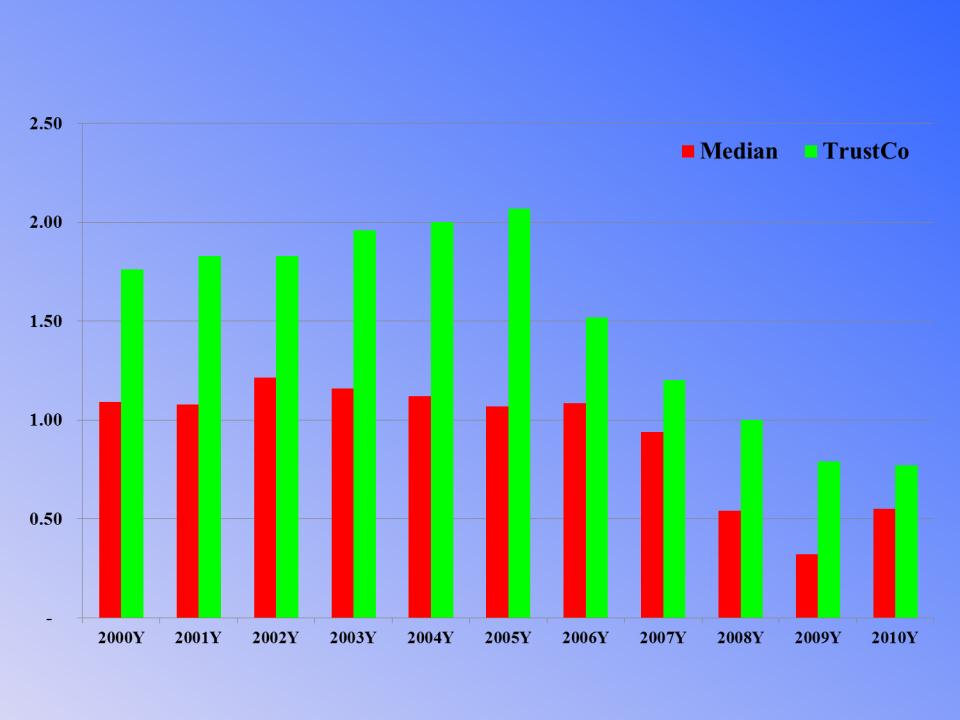
Return on Average Assets (%)
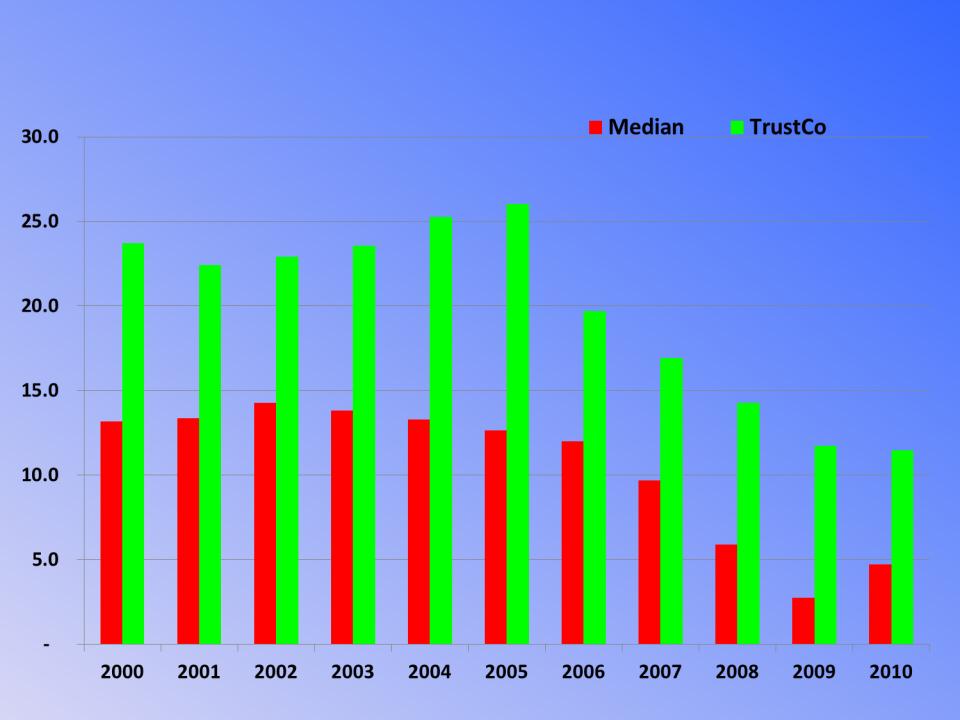
Return on Average Equity (%)
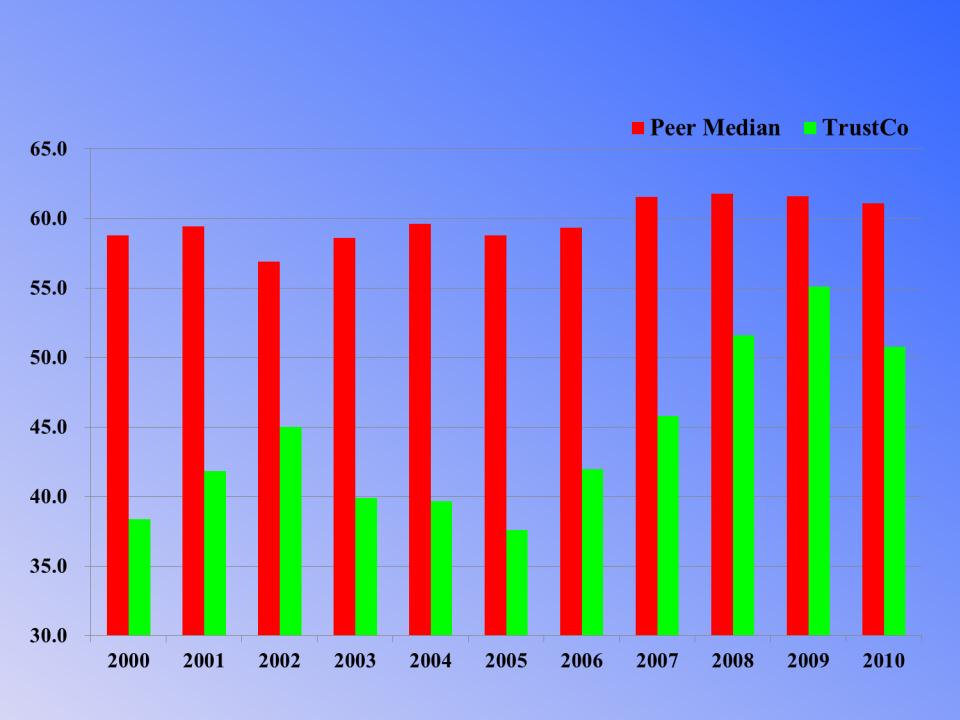
Efficiency Ratio (%)
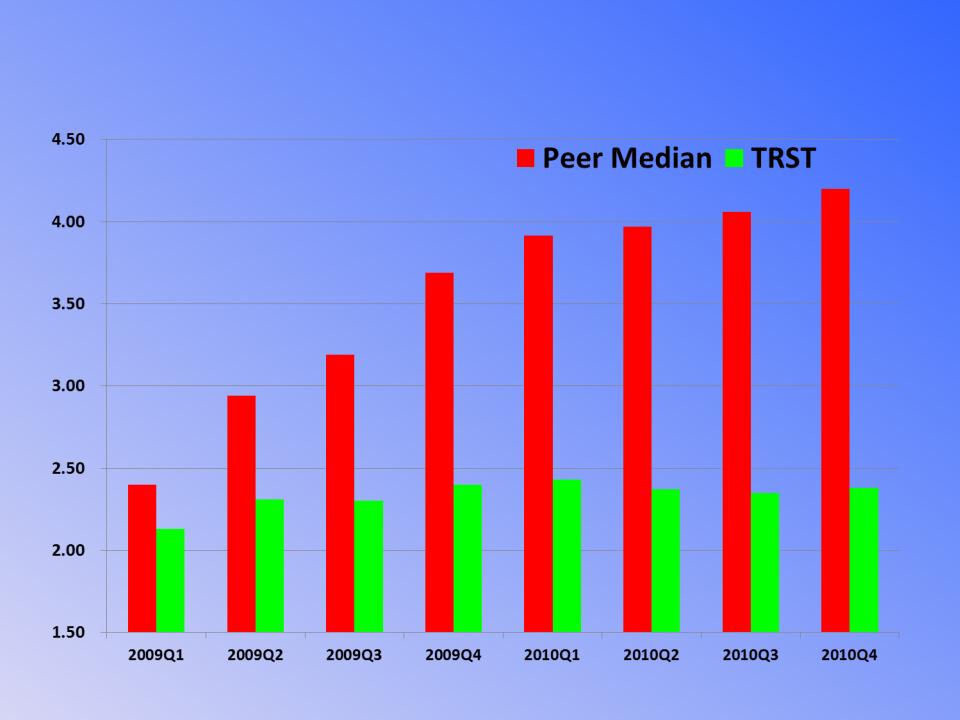
Non-performing Assets Ratio (%)
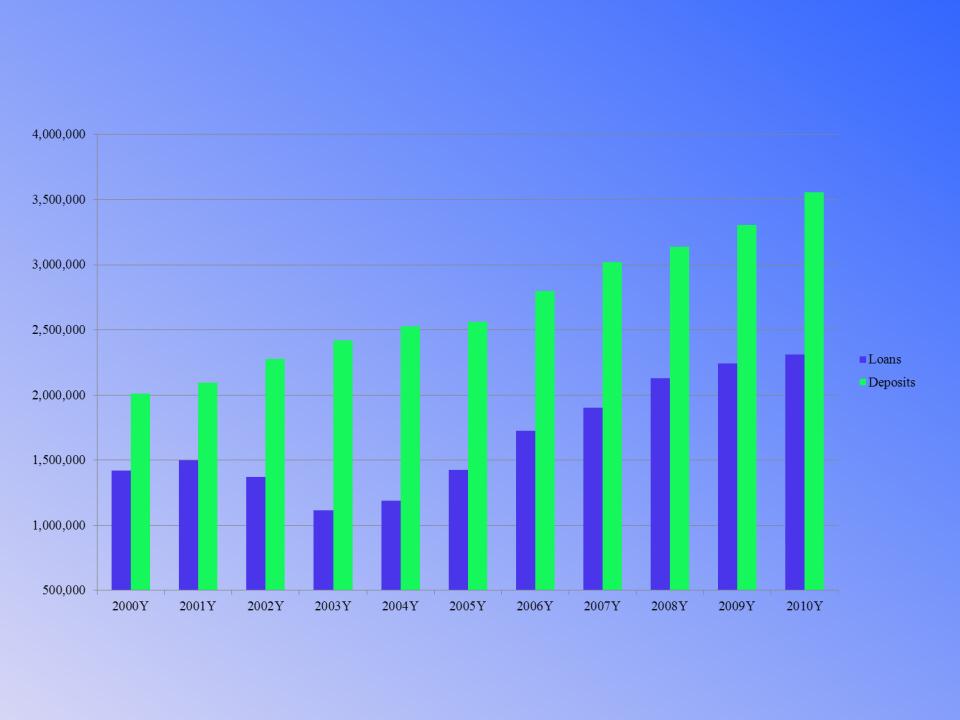
Loan and Deposit Growth ($000)
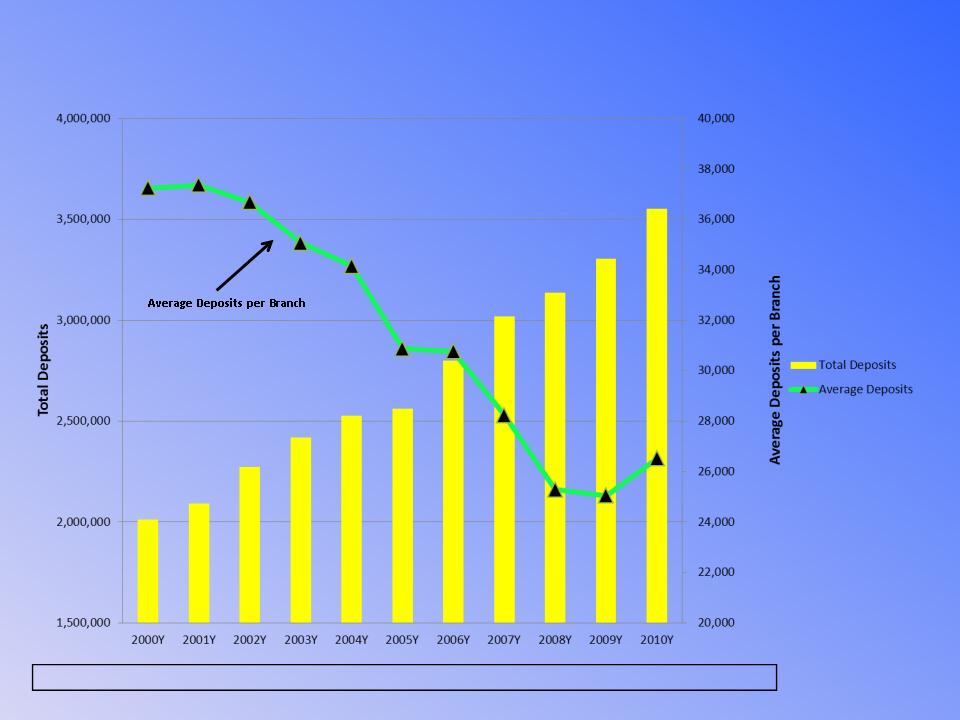
# of Branches 54 56 62 69 74 83 91 107 124 132 134
Branches and Deposits ($000)

TrustCo vs. Peers in 2010
|
|
TrustCo
|
Peers*
|
|
Return on Average Equity
|
11.48%
|
4.72%
|
|
Return on Average Assets
|
0.77%
|
0.55%
|
|
Efficiency Ratio
|
50.77%
|
61.41%
|
*All banking institutions covered by SNL Financial with assets of $2 to $10 billion as of December 31, 2010
Ratios reflect the full year 2010
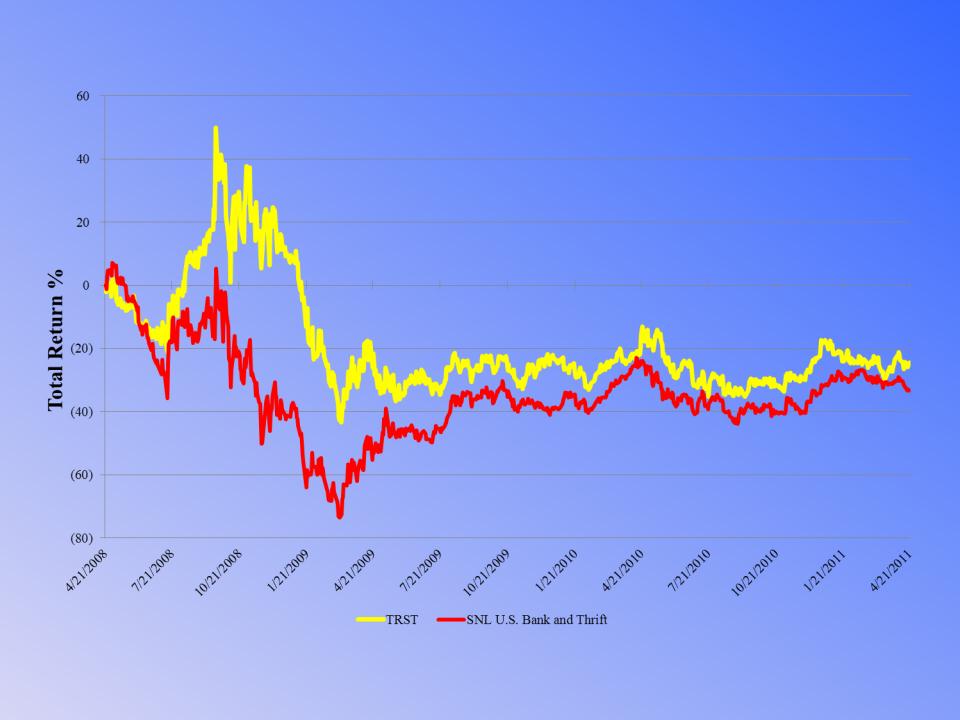
3-Year Stock Performance
*Through April 21, 2011

Cash Dividends Paid: 2000 to 2010
|
|
TrustCo
|
Peers*
|
|
Dividend Payout Ratio
|
88.9%
|
39.6%
|
|
Cash Dividends Paid
|
$425.5 Million
|
$86.4 Million
|
*All banking institutions covered by SNL Financial with assets of $2 to $10 billion as of December 31, 2010

Capital Planning
• Regulatory Landscape
• Dodd-Frank, Basel III, Bank Regulators driving higher capital
requirements
requirements
• Goal - 8% capital level
• Asset Growth
• Branch expansion program
• Capital to support growth
• Shelf Registration
• Filed with SEC today
• Raise capital as needed
• Variety of capital instruments - including common equity
• Facilitates Increasing Capital
• Flexibility

Community Relations / Contributions
• We provide both significant employee involvement and financial
contributions to many worthy organizations in our market area
contributions to many worthy organizations in our market area
• In 2010 we provided 278 organizations with cash contributions
• Total contributions in 2010 were over $430,000
• We examine what types of need are most pressing and focus much of
our giving in those areas
our giving in those areas
• Health care and education were among the areas we focused on
during 2010
during 2010

• “Banking’s Top Performers” - ABA Banking Journal
• 12th out of 129 banks with over $3 billion of assets for 2010
• Top 30 of “Top 150 Performers” - Bank Director Magazine,
2008-2010
2008-2010
• Top 20 of “Top 100 Thrifts” - SNL Thrift Investor, 2005-
2010 .
2010 .
• Top 10 of “Top 200 Mid Tier Banks” - US Banker
Magazine, 2007-2009
Magazine, 2007-2009
Things to be Proud Of

2011 Annual Meeting
Questions and Answers

2011 Annual Meeting
Thank You for Attending