Attached files
| file | filename |
|---|---|
| EX-31.2 - CERTIFICATION - SunGame Corp | sungame_10qa-3102.htm |
| EX-32.1 - CERTIFICATION - SunGame Corp | sungame_10qa-ex3201.htm |
| EX-31.1 - CERTIFICATION - SunGame Corp | sungame_10qa-ex3101.htm |
UNITED STATES
SECURITIES AND EXCHANGE COMMISSION
WASHINGTON, D.C. 20549
FORM 10-Q
Amendment 1
(Mark One)
[X] QUARTERLY REPORT PURSUANT TO SECTION 13 OR 15(d) OF THE SECURITIES EXCHANGE ACT OF 1934, as amended
For The Quarterly Period Ended March 31, 2011
[_] TRANSITION REPORT PURSUANT TO SECTION 13 OR 15(d) OF THE SECURITIES EXCHANGE ACT OF 1934, as amended
For The Transition Period from __________ To _________
Commission file number: 333-158946
SUNGAME CORPORATION
(Exact name of registrant as specified in its charter)
|
Delaware
|
20-8017623
|
|
|
(State or other jurisdiction
|
(IRS Employer Identification No.)
|
|
|
of incorporation or organization)
|
|
501 Silverside Road, Suite 105,
Wilmington, DE
|
|
19809
|
|
(Address of principal executive offices)
|
(zip code)
|
(310) 666-0051
(Registrant’s telephone number, including area code)
Indicate by check mark whether the registrant (1) has filed all reports required to be filed by Section 13 or 15(d) of the Securities Exchange Act of 1934 during the preceding 12 months (or for such shorter period that the registrant was required to file such reports), and (2) has been subject to such filing requirements for the past 90 days. Yes þ No o
Indicate by check mark whether the registrant has submitted electronically and posted on its corporate Web site, if any, every Interactive Data File required to be submitted and posted pursuant to Rule 405 of Regulation S-T (§232.405 of this chapter) during the preceding 12 months (or for such shorter period that the registrant was required to submit and post such files). Yes o No o
Indicate by check mark whether the registrant is a large accelerated filer, an accelerated filer, a non-accelerated filer, or a smaller reporting company. See the definitions of “large accelerated filer,” “accelerated filer” and “smaller reporting company” in Rule 12b-2 of the Exchange Act.
|
Large accelerated filer o
|
Accelerated filer o
|
||
|
Non-accelerated filer o
|
Smaller reporting company þ
|
||
|
(Do not check if a smaller reporting company)
|
Indicate by check mark whether the issuer is a shell company (as defined in rule 12b-2 of the Exchange Act) Yes o No þ
Indicate by check mark if the registrant is a shell company (as defined in Rule 12b-2 of the Exchange Act): Yes o No þ
The number of shares of common stock are:
As of 31 March 2011 - 250,014
As of 9 May 2011- 177,550,014 issued, 250,014 outstanding
(issuances from the merger have not been processed through transfer)
SUNGAME CORPORATION
For The Quarterly Period Ended March 31, 2011
TABLE OF CONTENTS
|
PART I - FINANCIAL INFORMATION
|
3
|
|
|
Item 1.
|
Financial Statements - Sungame Corporation
|
3
|
|
Financial Statements - Freevi Corporation
|
11 | |
| Consolidated Financial Statements | 26 | |
|
Item 2.
|
Management's Discussion and Analysis of Financial Condition and Results of Operations
|
34
|
|
Item 3.
|
Quantitative and Qualitative Disclosures about Market Risk
|
44
|
|
Item 4.
|
Controls and Procedures
|
44
|
|
PART II - OTHER INFORMATION
|
45
|
|
|
Item 1.
|
Legal Proceedings
|
45
|
|
Item 1A.
|
Risk Factors
|
45
|
|
Item 2.
|
Unregistered Sales of Equity Securities.
|
45
|
|
Item 3.
|
Defaults Upon Senior Securities
|
45
|
|
Item 4.
|
Removed and Reserved.
|
45
|
|
Item 5.
|
Other Information.
|
45
|
|
Item 6.
|
Exhibits.
|
45
|
|
SIGNATURES
|
46
|
|
Note: Amendment 1 includes the addition of Freevi Corp. financials, the pro forma combined financial statements and the adjustment to certain warrants outstanding.
2
Part I. Financial Information.
Item 1. Financial Statements.
SUNGAME CORPORATION
(A DEVELOPMENT STAGE COMPANY)
Balance Sheets
|
March 31,
|
December 31,
|
|||||||
|
2011
|
2010
|
|||||||
|
Unaudited
|
||||||||
|
ASSETS:
|
||||||||
|
Current Assets:
|
||||||||
|
Cash
|
$ | 26 | $ | 60 | ||||
|
Accounts Receivable
|
21,650 | 17,600 | ||||||
|
Total Current Assets
|
21,676 | 17,660 | ||||||
|
Fixed Assets
|
||||||||
|
Office Equipment
|
2,140 | 2,140 | ||||||
|
Accumulated Depreciation
|
(779 | ) | (672 | ) | ||||
|
Total Fixed Assets
|
1,361 | 1,468 | ||||||
|
Other Assets
|
||||||||
|
Investment - Freevi Corp
|
||||||||
|
TOTAL ASSETS
|
$ | 23,037 | $ | 19,128 | ||||
|
LIABILITIES AND STOCKHOLDERS' (DEFICIENCY):
|
||||||||
|
Current Liabilities:
|
||||||||
|
Accounts Payable
|
$ | 112,035 | $ | 112,035 | ||||
|
Credit Cards Payable
|
9,229 | 8,751 | ||||||
|
Loans Payable - Stockholder
|
161,872 | 161,272 | ||||||
|
Total Current Liabilities
|
283,136 | 282,058 | ||||||
|
Stockholders' Equity (Deficiency):
|
||||||||
|
Common stock, par value, $0.001 300,000,000 authorized with: 250,000 issued and outstanding
|
250 | 250 | ||||||
|
Paid in Capital
|
2,153,035 | 2,153,035 | ||||||
|
Preferred Stock, par value $0.001 5,000,000 authorized with none outstanding
|
- | - | ||||||
|
Accumulated deficit
|
(2,413,384 | ) | (2,416,215 | ) | ||||
|
Total Stockholders' (Deficiency)
|
(260,099 | ) | (262,930 | ) | ||||
|
TOTAL LIABILITIES AND STOCKHOLDERS' DEFICIENCY
|
$ | 23,037 | $ | 19,128 | ||||
The accompanying notes are an integral part of these financial statements
3
SUNGAME CORPORATION
(A DEVELOPMENT STAGE COMPANY)
Statements of Operations
|
November 13,
|
||||||||||||
|
Three months ended
|
2006, (Inception)
|
|||||||||||
|
March 31,
|
to March 31,
|
|||||||||||
|
2011
|
2010
|
2011
|
||||||||||
|
Unaudited
|
Unaudited
|
Unaudited
|
||||||||||
|
Revenue:
|
$ | 31,150 | $ | 6,265 | $ | 106,262 | ||||||
|
Total Revenue
|
31,150 | 6,265 | 106,262 | |||||||||
|
Costs and Expenses:
|
||||||||||||
|
Software development
|
27,140 | 17,108 | 1,440,575 | |||||||||
|
Stock based compensation
|
- | - | 587,300 | |||||||||
|
Depreciation
|
107 | 69 | 779 | |||||||||
|
Consulting costs
|
- | - | 302,500 | |||||||||
|
Bad debts
|
- | - | 4,214 | |||||||||
|
Startup costs
|
765 | 19,018 | 178,156 | |||||||||
|
Total Expenses
|
28,012 | 36,195 | 2,513,524 | |||||||||
|
Net Income (Loss) From Operations
|
3,138 | (29,930 | ) | (2,407,262 | ) | |||||||
|
Other Income and (Expenses)
|
||||||||||||
|
Interest expense
|
(307 | ) | (5,108 | ) | (6,122 | ) | ||||||
| (307 | ) | (5,108 | ) | (6,122 | ) | |||||||
|
Net Income (Loss)
|
$ | 2,831 | $ | (35,038 | ) | $ | (2,413,384 | ) | ||||
|
Per Share Information
|
||||||||||||
|
Income (Loss) per common share
|
$ | 0.01 | $ | (0.14 | ) | |||||||
|
Weighted average number of shares outstanding
|
250,000 | 250,000 | ||||||||||
The accompanying notes are an integral part of these financial statements
4
SUNGAME CORPORATION
(A DEVELOPMENT STAGE COMPANY)
Statements of Cash Flows
|
November 13,
|
||||||||||||
|
Three months ended
|
2006, (Inception)
|
|||||||||||
|
March 31,
|
to March 31,
|
|||||||||||
|
2011
|
2010
|
2011
|
||||||||||
|
Unaudited
|
Unaudited
|
Unaudited
|
||||||||||
|
Cash Flows from Operating Activities
|
||||||||||||
|
Net Income (Loss)
|
$ | 2,831 | $ | (35,038 | ) | $ | (2,413,384 | ) | ||||
|
Adjustments to reconcile net loss to
|
||||||||||||
|
net cash used by operating activities:
|
||||||||||||
|
Depreciation
|
107 | 69 | 779 | |||||||||
|
(Increase) in accounts receivable
|
(4,050 | ) | (4,714 | ) | (21,650 | ) | ||||||
|
Increase in accrued expenses
|
- | - | 190,000 | |||||||||
|
Increase in credit card payable
|
478 | 3,520 | 9,230 | |||||||||
|
Increase/(decrease) in accounts payable
|
- | (4,000 | ) | 878,037 | ||||||||
|
Compensatory stock issuances
|
- | - | 837,300 | |||||||||
|
Net Cash Used by Operating Activities
|
(634 | ) | (40,163 | ) | (519,688 | ) | ||||||
|
Cash Flows from Investing Activities
|
||||||||||||
|
(Increase) in Fixed Assets
|
- | - | (767 | ) | ||||||||
|
Net Cash Used for Investing Activities
|
- | - | (767 | ) | ||||||||
|
Cash Flows from Financing Activities
|
||||||||||||
|
Issuance of Common Stock and Warrants
|
- | - | 251,500 | |||||||||
|
Paid in capital
|
- | - | 107,109 | |||||||||
|
Increase in Loans Payable
|
600 | 44,602 | 161,872 | |||||||||
|
Net Cash Provided by Financing Activities
|
600 | 44,602 | 520,481 | |||||||||
|
Net Increase in Cash & Cash Equivalents
|
(34 | ) | 4,439 | 26 | ||||||||
|
Beginning Cash & Cash Equivalents
|
60 | 2,011 | - | |||||||||
|
Ending Cash & Cash Equivalents
|
$ | 26 | $ | 6,450 | $ | 26 | ||||||
|
SUPPLEMENTAL DISCLOSURE OF CASH FLOW INFORMATION
|
||||||||||||
|
Cash paid for interest expense
|
$ | 307 | $ | - | 6,122 | |||||||
|
Cash paid for income taxes
|
$ | - | $ | - | $ | - | ||||||
|
NON-CASH TRANSACTIONS
|
||||||||||||
|
Stock issued for services
|
$ | - | $ | - | 837,300 | |||||||
|
Paid in capital - debt relief
|
- | - | 182,376 | |||||||||
|
Stock issued for debt relief
|
- | - | 863,369 | |||||||||
The accompanying notes are an integral part of these financial statements
5
Sungame Corporation
Statements of Stockholder's Equity (Deficit)
|
Common
|
Preferred
|
|||||||||||||||||||||||||||
|
Common
|
Dollars at
|
Paid in
|
Preferred
|
Dollars
|
Retained
|
Stockholders'
|
||||||||||||||||||||||
|
Shares (1)
|
$0.001 Par
|
Capital
|
Shares
|
$0.001 Par
|
Earnings
|
Deficiency
|
||||||||||||||||||||||
|
Balances 11/14/06
|
- | $ | - | $ | - | - | $ | - | $ | - | $ | - | ||||||||||||||||
|
Shares to parent for services
|
38 | 1 | 1,499 | 1,500 | ||||||||||||||||||||||||
|
Net loss for year
|
(1,500 | ) | (1,500 | ) | ||||||||||||||||||||||||
|
Balances at December 31, 2006
|
38 | 1 | 1,499 | - | - | (1,500 | ) | - | ||||||||||||||||||||
|
Net loss for year
|
(890,443 | ) | (890,443 | ) | ||||||||||||||||||||||||
|
Balances at December 31, 2007
|
38 | 1 | 1,499 | - | - | (891,943 | ) | (890,443 | ) | |||||||||||||||||||
|
Shares issued to parent for debt relief
|
103,088 | 103 | 774,897 | 775,000 | ||||||||||||||||||||||||
|
Shares issued for services
|
96,874 | 97 | 587,203 | 587,300 | ||||||||||||||||||||||||
|
Shares issued for cash
|
12,500 | 12 | 119,988 | 120,000 | ||||||||||||||||||||||||
|
Warrants issued for cash
|
5,000 | 5,000 | ||||||||||||||||||||||||||
|
Additional paid-in capital from parent
|
107,109 | 107,109 | ||||||||||||||||||||||||||
|
Net loss for year
|
(980,353 | ) | (980,353 | ) | ||||||||||||||||||||||||
|
Balances at December 31, 2008
|
212,500 | 213 | 1,595,696 | - | (1,872,296 | ) | (276,387 | ) | ||||||||||||||||||||
|
Shares issued for cash
|
12,500 | 12 | 124,988 | 125,000 | ||||||||||||||||||||||||
|
Shares issued for services
|
25,000 | 25 | 249,975 | 250,000 | ||||||||||||||||||||||||
|
Net loss for year
|
(430,182 | ) | (430,182 | ) | ||||||||||||||||||||||||
|
Balances at December 31, 2009
|
250,000 | 250 | 1,970,659 | - | - | (2,302,478 | ) | (331,569 | ) | |||||||||||||||||||
|
Forgiveness of debt
|
182,376 | 182,376 | ||||||||||||||||||||||||||
|
Net loss for year
|
(113,737 | ) | (113,737 | ) | ||||||||||||||||||||||||
|
Balances at December 31, 2010
|
250,000 | 250 | 2,153,035 | - | - | (2,416,215 | ) | (262,930 | ) | |||||||||||||||||||
|
Net income for period
|
2,831 | 2,831 | ||||||||||||||||||||||||||
|
Balances at March 31, 2011 -
Unaudited
|
250,000 | $ | 250 | $ | 2,153,035 | $ | - | $ | - | $ | (2,413,384 | ) | $ | (260,099 | ) | |||||||||||||
|
(1) As retroactively restated for a 40 for 1 reverse stock split on January 10, 2011
|
||||||||||||||||||||||||||||
The accompanying notes are an integral part of these financial statements
6
SUNGAME CORPORATION
NOTES TO FINANCIAL STATEMENTS
|
1.
|
Business and Summary of Significant Accounting Policies
|
Business
The accompanying financial statements include the accounts of SunGame Corporation (“the Company”), a Delaware corporation. The Company is an early development stage company that intends to become a leader in providing virtual worlds and online games. The Company believes that it can exploit the market that is at the confluence of social games and social virtual world, and that this market is very significant. The Company will provide various types of Games in an online Virtual World where the users, regardless of location can play games, chat, buy virtual goods and where our customers are corporations and game aggregators.
The main activity will be to provide a social games and social virtual worlds that attracts players who interact in a seamless environment. The main goal will be to introduce competitive and unique products in an already established market place. The Company will be a premier marketer of money related activities that will have distinct comparative advantages compared to both direct and indirect competitors.
The Company was incorporated in Delaware on November 14, 2006. The Company’s fiscal year end is December 31st.
Summary of Significant Accounting Policies
Development Stage Company
The Company is a development stage company as defined by Accounting Standards Codified No.915. The Company is devoting substantially all of its present efforts to establish a new business. All losses accumulated since inception have been considered as part of the Company’s development stage activities.
Risks and Uncertainties
The Company operates in an emerging industry that is subject to market acceptance and technological change. The Company’s operations are subject to significant risks and uncertainties, including financial, operational, technological and other risks associated with operating an emerging business, including the potential risk of business failure.
Use of Estimates
The preparation of financial statements in conformity with accounting principles generally accepted in the United States of America requires management to make certain estimates and assumptions that affect the reported amounts and timing of revenue and expenses, the reported amounts and classification of assets and liabilities, and disclosure of contingent assets and liabilities. These estimates and assumptions are based on management’s future expectations for the Company’s operations. The Company’s actual results could vary materially from management’s estimates and assumptions.
Property and Equipment
Property and equipment, when acquired, will be stated at cost. Depreciation will be computed using the straight-line method to allocate the cost of depreciable assets over the estimated useful lives of the assets.
Software Costs
The costs for internal use software, whether developed or obtained, are assessed to determine whether they should be capitalized or expensed in accordance with American Institute of Certified Public Accountants’ Statement (“SOP”) 98-1, “Accounting for the Costs of Computer Software Developed or Obtained for Internal Use”. Capitalized software costs are reflected as property and equipment on the balance sheet and are to be depreciated when the Company begins recording revenue the deemed date that the software is placed in service. As of the date of these financial statements the development of the software necessary to achieve the business purposes of the Company is in an undeterminable state causing the Company to deem the asset to be impaired. This conclusion requires that the costs incurred to date be treated as expenses as opposed to the capitalizing of the software.
7
Start-up Costs
Start-up costs that would commonly be capitalized as Other Assets to be amortized over a period of five years have also been deemed to be impaired for the same reasons stated in the paragraph on “Software Costs”. Based on these circumstances, management has elected to expense these start-up costs as well.
“Long-lived assets” are reviewed for impairment of value whenever events or changes in circumstances indicate that the carrying value of the assets might not be recoverable or at least at the end of each reporting period. Conditions that would necessitate an impairment assessment include a significant decline in the observable market value of an asset, a significant change in the extent or manner in which an asset is used, or a significant adverse change that would indicate that the carrying value of an asset is not recoverable. For Long-lived assets to be held and used, management measures fair value based on quoted market prices or based on discounted estimates of future cash flows.
Concentration of Credit Risk
The Company’s financial instruments that are exposed to concentrations and credit risk primarily consist of amounts due to related parties. The Company presently uses one vendor for all of its software development.
Income Taxes
Income taxes are accounted for using the asset and liability method. Deferred tax assets and liabilities are recognized for the future tax consequences attributable to differences between the financial statement carrying amounts of existing assets and liabilities and their respective tax bases and operating loss and tax credit carry-forwards. Deferred tax assets and liabilities are measured using enacted tax rates expected to be applied to taxable income in the years in which those temporary differences are expected to be recovered or settled. The effect on deferred tax assets and liabilities of a change in tax rates is recognized in income in the period that includes the enactment date. A valuation allowance is provided for significant deferred tax assets when it is more likely than not that such asset will not be recovered.
At March 31, 2011 and 2010 the Company had net operating loss carry forwards of approximately $1,521,000 and $1,445,000 which begin to expire in 2026. The deferred tax asset of approximately $593,200 and $563,600 in 2011 and 2010 created by the net operating losses have been offset by a 100% valuation allowance. The change in the valuation allowance in 2011 and 2010 was $29,600 and $44,300.
2. Going Concern Uncertainty and Managements’ Plans
In the Company’s audited financial statements for the fiscal year ended December 31, 2010, the Report of the Independent Registered Public Accounting Firm includes an explanatory paragraph that describes substantial doubt about the Company’s ability to continue as a going concern. The Company’s interim financial statements for the year ended December 31, 2010 have been prepared on a going concern basis, which contemplates the realization of assets and the settlement of liabilities and commitments in the normal course of business. The Company reported a net loss of $113,737 for the year ended December 31, 2010, and an accumulated deficit of $2,416,215 as of December 31, 2010. As of March 31, 2011 the accumulated deficit is $2,413,384. At December 31, 2010, the Company’s total current liabilities exceed total current assets by $103,126. At March 31, 2011 this amount was $99,589.
The future success of the Company is likely dependent on its ability to attain additional capital, or to find an acquisition to add value to its present shareholders and ultimately, upon its ability to attain future profitable operations. There can be no assurance that the Company will be successful in obtaining such financing, or that it will attain positive cash flow from operations. Management believes that actions presently being taken to revise the Company’s operating and financial requirements provide the opportunity for the Company to continue as a going concern.
3. Property and Equipment
The Company has incurred software costs in the development of its virtual world in the amount of $1,413,435 as of December 31, 2010. By March 31 this total had increased to $1,440,575. Per the discussion under “Software Costs” this amount has been expensed at this time.
4. Contracts Payable
During the year ended December 31, 2008, the Company entered into a Corporate Finance Advisory Services Agreement with Friedland Global Capital Markets, LLC (Friedland) the Agreement provides that the Company would pay a total of $190,000 for services as set forth in the Agreement. In July 2008, Friedland agreed to suspend payment of the fees until the completion of financing. These funds are non-interest paying and due on demand. During the year ended December 31, 2009 the Company made payments in the amount of $25,000 against this obligation. In the second quarter of 2010 the Company completed negotiations for the mutual release of all obligations under this contract with no further liability. The cancellation of the contract was treated as an additional contribution to Paid-in-Capital.
5. Advance Payable, Related Party
At December 31, 2009, the Company’s had working capital advances due to the Company’s majority shareholder, Adversor, Inc. (“Adversor”) of $117,470. These funds are non interest bearing and are due on demand. Also included in the Company’s $51,582 in accounts payable at end 2009 were $26,600 owed to Adversor. In 2009 the Company recorded consulting fees to Adversor of $26,600. At December 31, 2010 the Company had working capital advances due to Adversor of $161,272, also non-interest bearing and due on demand. At March 31, 2011 Adversor advances had increased to $162,372. Included in the Company’s $112,035 in the Company’s accounts payable at end 2010 were $106,013 owed to Adversor. In 2010 the Company recorded consulting fees to Adversor of $45,000.
8
6. Stockholders’ Deficiency
Common Stock
In October 2008, the Company entered into a Security Purchase Agreement (Security Purchase Agreement) with a third party, the Company received cash of $125,000 in exchange for 500,000 shares of restricted common stock and a warrant exercisable for 500,000 shares of the Company’s restricted common stock. The warrant has an exercise price of $0.80 per share and a term of three years. The shares were sold at a price of $0.25 per share with $0.24 per share allocated to the common stock and $0.01 per share allocated to the warrant. However, Sungame reversed its stock in Q1 2011, effective 11 January 2011, (See 8K dated 11 January 2011) and the resultant warrants are now priced at $32.00 per warrant with 12,500 warrants remaining outstanding, adjusted for the reverse split of 40:1. The exercise dates remain the same.
In October 2008, the Company entered into a Services Agreements with two parties. The Services Agreements provides for the Company to receive services totaling up to $625,000 in connection with the development of its website and gaming software to be paid for by the issuance of up to 2,500,000 shares of the Company’s common stock. During the year ended December 31, 2008, the Company issued 1,600,000 of these shares in exchange for services performed at that time totaling $400,000. The shares were issued at a price of $0.25 per share.
In October 2008, the Company issued 4,123,500 shares of its restricted common stock to its majority shareholder, Adversor, in exchange for their efforts in the settlement of $775,000 of outstanding accounts payable owed to an unrelated third party vendor. The shares were issued at a price of $0.188 per share.
In September 2008, the Company issued 1,373,000 shares of its restricted common stock to a director, Mr. Goss, of the Company as payment for services totaling $1,373,000. The shares were issued at a price of $0.10 per share.
In June 2008, the Company issued 902,000 shares of its restricted common stock to Friedland, in exchange for services totaling $50,000 provided under the Finance Advisory Services Agreement. The shares were issued at a price of $0.055 per share.
In March of 2009, pursuant to the Securities Purchase Agreement the Company received further cash of $125,000 in exchange for 500,000 shares of restricted common stock and a warrant exercisable for 500,000 shares of the Company’s restricted common stock. The warrant has an exercise price of $0.80 per share and a term of three years. The shares were sold at a price of $0.25 per share with $0.24 per share allocated to the common stock an $0.01 per share allocated to the warrant. The Company also issued 100,000 shares of its restricted common stock in exchange for consulting services valued at $25,000. However, Sungame reversed its stock in Q1 2011, effective 11 January 2011, (See 8K dated 11 January 2011) and the resultant warrants are now priced at $32.00 per warrant with 12,500 warrants remaining outstanding, adjusted for the reverse split of 40:1. The exercise dates remain the same.
In October of 2009, the Company issued 900,000 shares of its restricted common stock in exchange for consulting services valued at $225,000.
For clarification purposes, Adversor has been characterized as a holding company by nature. As fair and accurate depiction, Adversor owned a majority share of Sungame, and thus could be interpreted as a parent subsidiary relationship, particularly under accounting rules. However, Adversor was never intended to exert control over Sungame, and was intended to relinquish the stock, which it did, and therefore Sungame takes the founded position it was never a subsidiary, regardless of the classification for accounting purposes; although we do understand the source of confusion. We trust this adequately explains our position.
Warrants
At January 11, 2011, the following warrants to purchase common stock were outstanding:
|
Number of common
shares covered by warrants
|
Exercise Price
|
Expiration Date
|
|
12,500
|
$32.00
|
October 2011
|
|
12,500
|
$32.00
|
March 2012
|
|
25,000
|
Other Capital Transactions
During the year ended December 31, 2010 the Company negotiated a settlement on a contract in the amount of $165,000 and was forgiven accounts payable in the amount of $17,376. The Company has treated such amounts as capital contributions and as such has increased Additional Paid in Capital by $182,376.
9
8. 8K Information filed
On November 3, 2010, the Company filed form 8K with the Securities and Exchange Commission (SEC) reporting the Company’s signing of a binding letter of intent with Freevi, Inc., a Nevada corporation and having their headquarters in Canada, to merge the two entities. Freevi, Inc. is a private corporation that is entering into the social networking business space, with acumen in multimedia.
This merger is proposed to be a “stock only” transaction. The Company will cause a reverse split in its outstanding shares of 1 new share for each 40 shares now outstanding. After this reverse split the shares will be exchanged on a 1 for 1 basis as this is considered to be the approximate fair value for each entity.
On January 10, 2011, The Company filed a form 8K with the SEC reporting the reverse split of the outstanding shares. In addition, the Company increased the authorized shares from 100,000,000 to 300,000,000.
Subsequent events
On April 15, 2011 The Company filed form 8K with the SEC reporting that the acquisition with Freevi has been completed. The Company issued 177,000,000 post reverse split shares to facilitate the transaction.
10
RONALD R. CHADWICK, P.C.
Certified Public Accountant
2851 South Parker Road, Suite 720
Aurora, Colorado 80014
Telephone (303)306-1967
Fax (303)306-1944
REPORT OF INDEPENDENT REGISTERED PUBLIC ACCOUNTING FIRM
Board of Directors
Freevi Corporation
Las Vegas, Nevada
I have audited the accompanying balance sheet of Freevi Corporation (a development stage company) as of December 31, 2010, and the related statements of operations, stockholders' deficiency and cash flows for the period from October 21, 2010 (inception) through December 31, 2010. These financial statements are the responsibility of the Company's management. My responsibility is to express an opinion on these financial statements based on my audit.
I conducted my audit in accordance with the standards of the Public Company Accounting Oversight Board (United States). Those standards require that I plan and perform the audit to obtain reasonable assurance about whether the financial statements are free of material misstatement. An audit includes examining, on a test basis, evidence supporting the amounts and disclosures in the financial statements. An audit also includes assessing the accounting principles used and significant estimates made by management, as well as evaluating the overall financial statement presentation. I believe that my audit provides a reasonable basis for my opinion.
In my opinion, the financial statements referred to above present fairly, in all material respects, the financial position of Freevi Corporation as of December 31, 2010, and the results of its operations and its cash flows for the period from October 21, 2010 (inception) through December 31, 2010 in conformity with accounting principles generally accepted in the United States of America.
The accompanying financial statements have been prepared assuming that the Company will continue as a going concern. As discussed in Note 2 to the financial statements the Company has suffered a loss from operations and has a working capital deficit that raise substantial doubt about its ability to continue as a going concern. Management's plans in regard to these matters are also described in Note 2. The financial statements do not include any adjustments that might result from the outcome of this uncertainty.
|
Aurora, Colorado
|
Ronald R. Chadwick, P.C.
|
|
April 8, 2011
|
RONALD R. CHADWICK, P.C.
|
11
Freevi Corporation
(a development stage company)
Balance Sheet
|
March 31, 2011
|
December 31, 2010
|
|||||||
|
ASSETS:
|
||||||||
|
Current Assets:
|
||||||||
|
Cash and cash equivalents
|
$ | 3,584 | $ | 10,650 | ||||
|
Other receivable
|
8,844 | 0 | ||||||
|
Prepaid Expenses
|
2,725 | 225 | ||||||
|
TOTAL ASSETS
|
$ | 15,153 | $ | 10,875 | ||||
|
LIABILITIES AND STOCKHOLDERS' DEFICIENCY:
|
||||||||
|
Current Liabilities:
|
||||||||
|
Accounts Payable
|
$ | 45,121 | $ | 26,520 | ||||
|
Accrued Liabilities
|
1,872 | 2,083 | ||||||
|
Due to Chandran Holding Media Inc
|
234,424 | 95,925 | ||||||
|
Total Current Liabilities
|
281,417 | 124,528 | ||||||
|
Stockholders' Deficiency:
|
||||||||
|
Common Stock, par value, $.001 350,000,000 authorized with: 177,000,000 issued and outstanding
|
177,000 | 177,000 | ||||||
|
Deficit Accumulated During the Development Stage
|
(443,264 | ) | (290,653 | ) | ||||
|
Total Stockholders' Deficiency
|
(266,264 | ) | (113,653 | ) | ||||
|
TOTAL LIABILITIES AND STOCKHOLDERS' DEFICIENCY
|
$ | 15,153 | $ | 10,875 | ||||
12
Freevi Corporation
(a development stage company)
Statement of Operations
|
For the three
|
For the period from
|
|||||||
|
months
ended
|
October 21, 2010 (inception)
|
|||||||
|
March 31, 2011
|
to March 31, 2011
|
|||||||
|
Revenue:
|
$ | 2,269 | $ | 2,269 | ||||
|
Costs and Expenses:
|
||||||||
|
Software development
|
33,443 | 233,770 | ||||||
|
Compensation
|
95,395 | 115,310 | ||||||
|
Consulting and professional fees
|
8,571 | 89,202 | ||||||
|
Other general and administrative expenses
|
17,471 | 17,987 | ||||||
|
Total Costs and Expenses
|
154,880 | 456,269 | ||||||
|
Net Loss
|
$ | (152,611 | ) | $ | (443,264 | ) | ||
|
Per Share Information
|
||||||||
|
Loss per common share
|
$ | (0.01 | ) | $ | (0.01 | ) | ||
|
Weighted average number of shares outstanding
|
177,000,000 | 177,000,000 | ||||||
13
Freevi Corporation
(a development stage company)
Statement of Cash Flows
|
For the period from
|
||||||||
|
For the
three months
|
October 21, 2010 (inception)
|
|||||||
|
ended March 31, 2011
|
to March 31, 2011
|
|||||||
|
Net loss
|
$ | (152,611 | ) | $ | (443,264 | ) | ||
|
Adjustments to reconcile net loss to net cash used by operating activities
|
||||||||
|
Common stock issued for licensing agreement
|
- 0 - | 165,000 | ||||||
|
Common stock issued for services
|
- 0 - | 12,000 | ||||||
|
Increase in prepaid expenses
|
(2,500 | ) | (3,225 | ) | ||||
|
Increase of other receivables
|
(8,844 | ) | (9,344 | ) | ||||
|
Increase/decrease in accounts payable
|
18,601 | 44,871 | ||||||
|
Increase/decrease in accrued liabilities
|
(211 | ) | 1,872 | |||||
|
Net cash used by operating activities
|
(85,275 | ) | (244,591 | ) | ||||
|
Net cash used for investing activities
|
- 0 - | - 0 - | ||||||
|
Cash flows from financing activities
|
||||||||
|
Borrowings from Chandran Holding Media Inc
|
138,499 | 249,808 | ||||||
|
Net cash provided by financing activities
|
138,499 | 249,808 | ||||||
|
Net increase/decrease in cash and cash equivalents
|
(7,066 | ) | 6,986 | |||||
|
Beginning cash and cash equivalents
|
10,650 | - 0 - | ||||||
|
Ending cash and cash equivalents
|
$ | 3,504 | $ | 6,986 | ||||
| $ | 3,584.00 | |||||||
|
Noncash investing & financing activities
|
||||||||
|
None
|
||||||||
|
Cash paid for interest & income taxes:
|
||||||||
|
None
|
||||||||
14
Freevi Corporation
(a development stage company)
Statement of Stockholders' Deficiency
|
|
||||||||||||||||
|
Common
|
Common
Stock Dollars
|
Deficit
Accumulated
During the
|
Stockholders'
|
|||||||||||||
|
Shares
|
at $.001 Par
|
Development Stage
|
Deficiency
|
|||||||||||||
|
Balances at October 21, 2010 (Inception)
|
-0- | $ | -0- | $ | -0- | $ | -0- | |||||||||
|
Shares to founders for services
|
12,000,000 | 12,000.00 | 12,000.00 | |||||||||||||
|
Shares issued for Licensing arrangement
|
165,000,000 | 165,000.00 | 165,000.00 | |||||||||||||
|
Net loss for the period from October 21 2010 (inception) to December 31 2010
|
(290,653 | ) | (290,653 | ) | ||||||||||||
|
Balances at December 31, 2010
|
177,000,000 | $ | 177,000 | $ | (290,653 | ) | $ | (113,653 | ) | |||||||
|
Net loss for the three months ended March 31 2011
|
(152,611 | ) | (152,611 | ) | ||||||||||||
|
Balances at March 31,2011
|
177,000,000 | $ | 177,000 | $ | (443,264 | ) | $ | (266,264 | ) | |||||||
15
Freevi Corporation
(a development stage company)
Notes to the Financial Statements
|
1.
|
Business and Summary of Significant Accounting Policies
|
Business
The accompanying financial statements include the accounts of Freevi Corporation (“the Company”) a Nevada corporation. The Company is an early development stage company that is a rich media platform revolving around its core product the “Freevi Flightdeck” tm, a graphical user interface that allows users to consume video and audio content, network with other Freevi users, engage in e-commerce transactions, and access games and other applications. Freevi’s proprietary technologies have been licensed from Chandran Holding Media Inc.
The Company was incorporated in Nevada on October 21, 2010. The Company’s fiscal year end is December 31.
Summary of Significant Accounting Policies
Development Stage Company
The Company is a development stage company as defined by ASC 915. The Company is devoting substantially all of its present efforts to establish new business. All losses accumulated since inception have been considered as part of the Company’s development stage activities.
Risk and Uncertainties
Our business is rapidly evolving and intensely competitive, and is subject to changing technology, shifting user needs and frequent introductions of new products and services. We have many competitors in different industries, including traditional search engines, vertical search engines, e-commerce sites, social networking sites, traditional media companies, and providers of online products and services. Our current and potential competitors range from large and established companies to emerging start ups. Established companies have longer operating histories and more established relationships with customers and end users, and they can use their experience and resources against us in a variety of competitive ways, including by making acquisitions, investing aggressively in research and development, and competing aggressively for advertisers and websites. Emerging start ups may be able to innovate and provide products and services faster than we can. If our competitors are more successful than we are in developing competing products or in attracting and retaining users, advertisers, and content providers, our revenues and growth rates could decline.
We will generate our revenues almost entirely from advertising, and the reduction in spending by or loss of advertisers could seriously harm our business. Our advertisers will be able to terminate their contracts with us at any time. Advertisers will not continue to do business with us if their investment in advertising with us does not generate sales leads, and ultimately customers, or if we do not deliver their
advertisements in an appropriate and effective manner. In addition, expenditures by advertisers tend to be cyclical, reflecting overall economic conditions and budgeting and buying patterns. If we are unable to remain competitive and provide value to our advertisers, they may stop placing ads with us, which would negatively harm our revenues and business.
Use of Estimates
The preparation of financial statements in conformity with accounting principles generally accepted in the United States of America required management to make certain estimates and assumptions that affect the reported amounts and timing of revenue and expenses, the reported amounts and classification of assets and liabilities, and disclosure of contingent assets and liabilities. These estimates and assumptions are based on management’s future expectations for the Company’s operations. The Company’s actual results could vary materially from management’s estimates and assumptions.
16
Property and Equipment
Property and equipment, when acquired, will be stated at cost. Depreciation will be computed using the straight line method to allocate the cost of depreciable assets over the estimated useful lives of the assets.
Software Costs
The costs for internal use software, whether developed or obtained, are assessed to determine whether they should be capitalized of expensed in accordance with American Institute of Certified Public Accountants’ Statement (“SOP”) 98-1 “Accounting for the Costs of Computer Software Developed or Obtained for Internal Use”. Capitalized software costs are reflected as property and equipment on the balance sheet and are to be depreciated when the Company begins recording revenue the deemed date that the software is placed in service. As of the date of these financial statements the development of the software necessary to achieve the business purposes of the Company is in an undeterminable state causing the Company to deem the asset to be impaired. This conclusion required that the costs incurred to date be treated as expenses as opposed to the capitalizing of the software.
Start-up Costs
Start-up costs that would commonly be capitalized as Other Assets to be amortized over a period of five years have also been deemed to be impaired for the same reasons stated in the paragraph on “Software Costs”. Based on these circumstances, management has elected to expense these start-up costs as well.
“Long-lived assets” are reviewed for impairment of value whenever events or changes in circumstances indicate that the carrying value of the assets might not be recoverable at the end of each reporting period. Conditions that would necessitate an impairment assessment include a significant decline in the observable market value of an asset, a significant change in the extent or manner in which an asset is used, or a significant adverse change that would indicate that the carrying value of an asset is not recoverable. For Long-lived assets to be held and used, management measures fair value based on quoted market prices or based on discounted estimates of future cash flows.
Concentration of Credit Risk
The Company’s financial instruments that are exposed to concentrations of credit risk primarily consist of an amount due to Chandran Holding Media Inc, a related party (see Note 4)
Income Taxes
Income taxes are accounted for using the asset and liability method. Deferred tax assets and liabilities are recognized for the future tax consequences attributable to differences between the financial statements carry amounts of existing assets and liabilities and their respective tax bases and operating loss and tax credit carry-forwards. Deferred tax assets and liabilities are measure using enacted tax rates expected to be applied to taxable income in the years in which those temporary differences are expected to be recovered or settled. The effect on deferred tax assets and liabilities of a change in tax rates is recognized in income in the period that includes the enactment date. A valuation allowance is provided for significant tax assets when it is more likely than not that such asset will not be recovered.
|
March 31, 2011
|
||||
|
Deferred tax assets at December 31, 2010
|
$ | 155,764 | ||
|
Valuation allowance
|
(155,764 | ) | ||
|
Net deferred tax assets
|
-0- | |||
17
|
2.
|
Going Concern Uncertainty and Management’s Plans
|
In the Company’s audited financial statements for the period from October 21, 2010 (inception) to December 31, 2010, the Report of the Independent Registered Public Accounting Firm includes an explanatory paragraph that describes substantial doubt about the Company’s ability to continue as a going concern. The Company’s financial statements for the three months ended March 31, 2011 have been prepared on a going concern basis, which contemplates the realization of assets and the settlement of liabilities and commitments in the normal course of business. The Company reported a net loss of $152,611 for the three months ended March 31, 2011, and an accumulated deficit of $443,264 as at March 31, 2011. At March 31, 2011, the Company’s total current liabilities exceed total current assets by $266,264.
The future success of the Company is likely dependent on its ability to attain additional capital, or to find an acquisition to add value to its present shareholders and ultimately, upon its ability to attain future profitable operations. There can be no assurance that the Company will be successful in obtaining such financing, or that it will attain positive cash flow from operations. Management believes that actions presently being take to revise the Company’s operating and financial requirements provide the opportunity for the Company to continue as a going concern.
|
3.
|
Property and Equipment
|
The Company has incurred software costs in the development of its products in the amount of $33,443 for the three months ended March 31, 2011 per the discussion under “Software Costs” in Note 1 this amount has been expensed at this time.
|
4.
|
Advance Payable, Related Party
|
During the period from October 21, 2010 (inception) to March 31, 2011, the Company’s majority shareholder, Chandran Holding Media Inc (Chandran) advanced funds to the Company for operations. The Company and Chandran also share certain members of executive management and certain employees. At March 31, 2011, Chandran is owed $234,424. These funds are non-interest bearing and due on demand.
|
5.
|
Stockholders’ Deficiency
|
On October 21, 2010, the Company issued 12,000,000 of common stock to its founders for services rendered. On November 2, 2010, the Company entered into a license agreement with its related party, Chandran Holding Media Inc. for proprietary technologies. The Company issued 165,000,000 shares of common stock to Chandran for this licensing arrangement. Both of these equity transactions were valued at $.001 par value.
|
6.
|
Planned Merger
|
On November 3, 2010 the Company was named in a Form 8-K filed with the Securities and Exchange Commission (SEC) reporting the Company’s signing of a binding letter of intent with Sungame Corporation, a Delaware corporation and an early stage development corporation to merge the two entities. Sungame Corporation hopes to become a leader in providing seamless skill gaming in a virtual world. The merger is proposed to be a “stock only” transaction with the shares being exchanged on a 1 for 1 basis as this is considered to be the approximate fair value of each entity (Sungame Corporation will cause a reverse split in its outstanding shares of 1 new share for each 40 shares now outstanding prior to the merger being completed.)
18
Freevi Corporation
(a development stage company)
Balance Sheet
|
December 31, 2010
|
||||
|
ASSETS:
|
||||
|
|
||||
|
Current Assets:
|
||||
|
Cash and cash equivalents
|
$ | 10,650 | ||
|
Prepaid Expenses
|
225 | |||
|
TOTAL ASSETS
|
$ | 10,875 | ||
|
LIABILITIES AND STOCKHOLDERS' DEFICIENCY:
|
||||
|
Current Liabilities:
|
||||
|
Accounts Payable
|
$ | 26,520 | ||
|
Accrued Liabilities
|
2,083 | |||
|
Due to Chandran Holding Media Inc
|
95,925 | |||
|
Total Current Liabilities
|
124,528 | |||
|
Stockholders' Deficiency:
|
||||
|
Common Stock, par value, $.001350,000,000 authorized with: 177,000,000 issued and outstanding
|
177,000 | |||
|
Deficit Accumulated During the Development Stage
|
(290,653 | ) | ||
|
Total Stockholders' Deficiency
|
(113,653 | ) | ||
|
TOTAL LIABILITIES AND STOCKHOLDERS' DEFICIENCY
|
$ | 10,875 | ||
19
Freevi Corporation
(a development stage company)
Statement of Operations
|
Revenue:
|
- 0 - | |||
|
Costs and Expenses:
|
||||
|
Software development
|
199,000 | |||
|
Compensation
|
13,841 | |||
|
Consulting and professional fees
|
77,381 | |||
|
Other general and administrative expenses
|
431 | |||
|
Total Costs and Expenses
|
290,653 | |||
|
Net Loss
|
$ | (290,653 | ) | |
|
Per Share Information
|
||||
|
Loss per common share
|
$ | (0.01 | ) | |
|
Weighted average number of shares outstanding
|
151,436,620 | |||
20
Freevi Corporation
(a development stage company)
Statement of Cash Flows
|
Net loss
|
$ | (290,653 | ) | |
|
Adjustments to reconcile net loss to net cash used by operating activities
|
||||
|
Common stock issued for licensing agreement
|
165,000 | |||
|
Common stock issued for services
|
12,000 | |||
|
Increase in prepaid expenses
|
(225 | ) | ||
|
Increase in accounts payable
|
26,520 | |||
|
Increase in accrued liabilities
|
2,083 | |||
|
Net cash used by operating activities
|
(85,275 | ) | ||
|
Net cash used for investing activities
|
- 0 - | |||
|
Cash flows from financing activities
|
||||
|
Borrowings from Chandran Holding Media Inc
|
95,925 | |||
|
Net cash provided by financing activities
|
95,925 | |||
|
Net increase in cash and cash equivalents
|
10,650 | |||
|
Beginning cash and cash equivalents
|
- 0 - | |||
|
Ending cash and cash equivalents
|
$ | 10,650 | ||
|
Noncash investing & financing activities
|
||||
|
None
|
||||
|
Cash paid for interest & income taxes:
|
||||
|
None
|
21
Freevi Corporation
(a development stage company)
Statement of Stockholders' Deficiency
|
|
||||||||||||||||
|
Common
|
Common
Stock Dollars
|
Deficit
Accumulated
During the
|
Stockholders'
|
|||||||||||||
|
Shares
|
at $.001 Par
|
Development Stage
|
Deficiency
|
|||||||||||||
|
Balances at October 21, 2010 (Inception)
|
-0- | $ | -0- | $ | -0- | $ | -0- | |||||||||
|
Shares to founders for services
|
12,000,000 | $ | 12,000 | $ | 12,000 | |||||||||||
|
Shares issued for Licensing arrangement
|
165,000,000 | $ | 165,000 | $ | 165,000 | |||||||||||
|
Net loss for the period from October 21 2010 (inception) to December 31 2010
|
$ | (290,653 | ) | $ | (290,653 | ) | ||||||||||
|
Balances at December 31, 2010
|
177,000,000 | $ | 177,000 | $ | (290,653 | ) | $ | (113,653 | ) | |||||||
22
Freevi Corporation
(a development stage company)
Notes to Financial Statements
|
1.
|
Business and Summary of Significant Accounting Policies
|
Business
The accompanying financial statements include the accounts of Freevi Corporation (“the Company”) a Nevada corporation. The Company is an early development stage company that is a rich media platform revolving around its core product the “Freevi Flightdeck” tm, a graphical user interface that allows users to consume video and audio content, network with other Freevi users, engage in e-commerce transactions, and access games and other applications. Freevi’s proprietary technologies have been licensed from Chandran Holding Media Inc.
The Company was incorporated in Nevada on October 21, 2010. The Company’s fiscal year end is December 31.
Summary of Significant Accounting Policies
Development Stage Company
The Company is a development stage company as defined by ASC 915. The Company is devoting substantially all of its present efforts to establish new business. All losses accumulated since inception have been considered as part of the Company’s development stage activities.
Risk and Uncertainties
Our business is rapidly evolving and intensely competitive, and is subject to changing technology, shifting user needs and frequent introductions of new products and services. We have many competitors in different industries, including traditional search engines, vertical search engines, e-commerce sites, social networking sites, traditional media companies, and providers of online products and services. Our current and potential competitors range from large and established companies to emerging start ups. Established companies have longer operating histories and more established relationships with customers and end users, and they can use their experience and resources against us in a variety of competitive ways, including by making acquisitions, investing aggressively in research and development, and competing aggressively for advertisers and websites. Emerging start ups may be able to innovate and provide products and services faster than we can. If our competitors are more successful than we are in developing completing products or in attracting and retaining users, advertisers, and content providers, our revenues and growth rates could decline.
We will generate our revenues almost entirely from advertising, and the reduction in spending by or loss of advertisers could seriously harm our business. Our advertisers will be able to terminate their contracts with us at any time. Advertisers will not continue to do business with us if their investment in advertising with us does not generate sales leads, and ultimately customers, or if we do not deliver their advertisements in an appropriate and effective manner. In addition, expenditures by advertisers tend to be cyclical, reflecting overall economic conditions and budgeting and buying patterns. If we are unable to remain competitive and provide value to our advertisers, they may stop placing ads with us, which would negatively harm our revenues and business.
Use of Estimates
The preparation of financial statements in conformity with accounting principles generally accepted in the United States of America required management to make certain estimates and assumptions that affect the reported amounts and timing of revenue and expenses, the reported amounts and classification of assets and liabilities, and disclosure of contingent assets and liabilities. These estimates and assumptions are based on management’s future expectations for the Company’s operations. The Company’s actual results could vary materially from management’s estimates and assumptions.
23
Property and Equipment
Property and equipment, when acquired, will be stated at cost. Depreciation will be computed using the straight line method to allocate the cost of depreciable assets over the estimated useful lives of the assets.
Software Costs
The costs for internal use software, whether developed or obtained, are assessed to determine whether they should be capitalized of expensed in accordance with American Institute of Certified Public Accountants’ Statement (“SOP”) 98-1 “Accounting for the Costs of Computer Software Developed or Obtained for Internal Use”. Capitalized software costs are reflected as property and equipment on the balance sheet and are to be depreciated when the Company begins recording revenue the deemed date that the software is placed in service. As of the date of these financial statements the development of the software necessary to achieve the business purposes of the Company is in an undeterminable state causing the Company to deem the asset to be impaired. This conclusion required that the costs incurred to date be treated as expenses as opposed to the capitalizing of the software.
Start-up Costs
Start-up costs that would commonly be capitalized as Other Assets to be amortized over a period of five years have also been deemed to be impaired for the same reasons stated in the paragraph on “Software Costs”. Based on these circumstances, management has elected to expense these start-up costs as well.
“Long-lived assets” are reviewed for impairment of value whenever events or changes in circumstances indicate that the carrying value of the assets might not be recoverable at the end of each reporting period. Conditions that would necessitate an impairment assessment include a significant decline in the observable market value of an asset, a significant change in the extent or manner in which an asset is used, or a significant adverse change that would indicate that the carrying value of an asset is not recoverable. For Long-lived assets to be held and used, management measures fair value based on quoted market prices or based on discounted estimates of future cash flows.
Concentration of Credit Risk
The Company’s financial instruments that are exposed to concentrations of credit risk primarily consist of an amount due to Chandran Holding Media Inc, a related party (see Note 4)
Income Taxes
Income taxes are accounted for using the asset and liability method. Deferred tax assets and liabilities are recognized for the future tax consequences attributable to differences between the financial statements carry amounts of existing assets and liabilities and their respective tax bases and operating loss and tax credit carry-forwards. Deferred tax assets and liabilities are measure using enacted tax rates expected to be applied to taxable income in the years in which those temporary differences are expected to be recovered or settled. The effect on deferred tax assets and liabilities of a change in tax rates is recognized in income in the period that includes the enactment date. A valuation allowance is provided for significant tax assets when it is more likely than not that such asset will not be recovered.
|
Deferred tax assets at December 31, 2010
|
$ | 101,729 | ||
|
Valuation allowance
|
(101,729 | ) | ||
|
Net deferred tax assets
|
-0- |
24
|
2.
|
Going Concern Uncertainty and Management’s Plans
|
In the Company’s audited financial statements for the period from October 21, 2010 (inception) to December 31, 2010, the Report of the Independent Registered Public Accounting Firm includes an explanatory paragraph that describes substantial doubt about the Company’s ability to continue as a going concern. The Company’s financial statements for this period since inception have been prepared on a going concern basis, which contemplates the realization of assets and the settlement of liabilities and commitments in the normal course of business. The Company reported a net loss of $290,653 for the period of October 21, 2010 (inception) to December 31, 2010, and an accumulated deficit of $290,653 as of December 31, 2010. At December 31, 2010, the Company’s total current liabilities exceed total current assets by $113,653.
The future success of the Company is likely dependent on its ability to attain additional capital, or to find an acquisition to add value to its present shareholders and ultimately, upon its ability to attain future profitable operations. There can be no assurance that the Company will be successful in obtaining such financing, or that it will attain positive cash flow from operations. Management believes that actions presently being take to revise the Company’s operating and financial requirements provide the opportunity for the Company to continue as a going concern.
|
3.
|
Property and Equipment
|
The Company has incurred software costs in the development of its products in the amount of $199,000 as of December 31, 2010. Per the discussion under “Software Costs” in Note 1 this amount has been expensed at this time.
|
4.
|
Advance Payable, Related Party
|
During the period from October 21, 2010 (inception) to December 31, 2010, the Company’s majority shareholder, Chandran Holding Media Inc (Chandran) advanced funds to the Company for operations. The Company and Chandran also share certain members of executive management and certain employees. At December 31, 2010, Chandran is owed $95,925. These funds are non-interest bearing and due on demand.
|
5.
|
Stockholders’ Deficiency
|
On October 21, 2010, the Company issued 12,000,000 of common stock to its founders for services rendered. On November 2, 2010, the Company entered into a license agreement with its related party, Chandran Holding Media Inc. for proprietary technologies. The Company issued 165,000,000 shares of common stock to Chandran for this licensing arrangement. Both of these equity transactions were valued at $.001 par value.
|
6.
|
Planned Merger
|
On November 3, 2010 the Company was named in a Form 8-K filed with the Securities and Exchange Commission (SEC) reporting the Company’s signing of a binding letter of intent with Sungame Corporation, a Delaware corporation and an early stage development corporation to merge the two entities. Sungame Corporation hopes to become a leader in providing seamless skill gaming in a virtual world. The merger is proposed to be a “stock only” transaction with the shares being exchanged on a 1 for 1 basis as this is considered to be the approximate fair value of each entity (Sungame Corporation will cause a reverse split in its outstanding shares of 1 new share for each 40 shares now outstanding prior to the merger being completed.)
25
Sungame Corporation
(A Development Stage Company)
Pro Forma Consolidated Financial Statements
December 31, 2010
26
SUNGAME CORPORATION AND FREEVI CORPORATION
Pro Forma Consolidated Balance Sheet
December 31, 2010
|
Sungame
|
Freevi
|
Adjustments
|
||||||||||||||
|
Corporation
|
Corporation
|
(See Notes)
|
Consolidated
|
|||||||||||||
|
Assets:
|
||||||||||||||||
|
Cash
|
$ | 60 | $ | 10,650 | $ | 10,710 | ||||||||||
|
Accounts receivable and other
|
17,600 | 17,600 | ||||||||||||||
|
Prepaid expenses
|
225 | 225 | ||||||||||||||
|
Total current assets
|
17,660 | 10,875 | 28,535 | |||||||||||||
|
Fixed Assets
|
||||||||||||||||
|
Office equipment
|
2,140 | 2,140 | ||||||||||||||
|
Accumulated depreciation
|
(672 | ) | (672 | ) | ||||||||||||
| 1,468 | 1,468 | |||||||||||||||
|
Total assets
|
$ | 19,128 | $ | 10,875 | $ | 30,003 | ||||||||||
|
Liabilities and Stockholders’ Deficiency
|
||||||||||||||||
|
Current liabilities:
|
||||||||||||||||
|
Accounts payable
|
$ | 112,035 | $ | 26,520 | $ | 138,555 | ||||||||||
|
Accrued liabilities
|
2,083 | 2.083 | ||||||||||||||
|
Due to Chandran Holding Media, Inc.
|
95,925 | 95,925 | ||||||||||||||
|
Credit cards payable
|
8,751 | 8,751 | ||||||||||||||
|
Loans payable - Stockholder
|
161,272 | 161,272 | ||||||||||||||
| 282,058 | 124,528 | 406,586 | ||||||||||||||
|
Common stock, par value, .001, 350,000,000 shares authorized with 177,250,000 issued and outstanding
|
250 | 177,000 | (1) | 177,250 | ||||||||||||
|
Paid-in-capital
|
2,153,035 | (290,653 | ) | 1,862,382 | ||||||||||||
|
Accumulated deficit
|
(2,416,215 | ) | (2,416,215 | ) | ||||||||||||
|
Total Stockholders’ Deficiency
|
(262,930 | ) | (113,653 | ) | (376,583 | ) | ||||||||||
|
Total Liabilities and Stockholders’
|
||||||||||||||||
|
Deficiency
|
$ | 19,128 | $ | 124,528 | $ | (113,653 | ) | $ | 30,003 | |||||||
27
SUNGAME CORPORATION AND FREEVI CORPORATION
Pro Forma Consolidated Statement of Operations
|
Sungame
Corporation
|
Freevi
Corporation
|
Consolidated
|
||||||||||
|
For the year ended
December 31, 2010
|
For the period from
October 21, 2010
(Inception) to
December 31, 2010
|
|||||||||||
|
Revenue:
|
$ | 50,112 | -0- | $ | 50,112 | |||||||
|
Total Revenue
|
50,112 | -0- | 50,112 | |||||||||
|
Costs and Expenses:
|
||||||||||||
|
Software development
|
57,151 | 199,000 | 256,151 | |||||||||
|
Compensation
|
-0- | 13,841 | 13,841 | |||||||||
|
Depreciation
|
420 | -0- | 420 | |||||||||
|
Consulting and professional fees
|
45,000 | 77,381 | 122,381 | |||||||||
|
Other general and administrative expenses
|
4,214 | 431 | 4,645 | |||||||||
|
Startup costs
|
51,249 | -0- | 51,249 | |||||||||
|
Total Expenses
|
158,034 | 290,653 | 448,687 | |||||||||
|
Net Loss from Operations
|
(107,922 | ) | (290,653 | ) | (398,575 | ) | ||||||
|
Other Income and (Expense)
|
(5,815 | ) | -0- | (5815 | ) | |||||||
|
Net Loss
|
$ | (113,787 | ) | $ | (290,653 | ) | $ | (404,390 | ) | |||
|
Per Share Information:
|
||||||||||||
|
Net Loss per share
|
$ | (0.01 | ) | $ | (0.01 | ) | $ | (0.01 | ) | |||
|
Weighted average number of shares outstanding
|
250,000 | 151,436,620 | 151,686,620 | |||||||||
28
Sungame Corporation
(A Development Stage Company)
Note to Pro Forma Consolidated Financial Statements
December 31, 2010
Basis of Presentation
The following pro forma consolidated balance sheet as of December 31, 2010 and the pro forma consolidated statements of operation for the year ended December 31, 2010 between Sungame Corporation and Freevi Corporation are presented to show what effects the merger of Freevi Corporation into Sungame Corporation might have had on historical financial information had the transaction taken place on January 1, 2010. The pro forma consolidated financial statements are derived from the historical financials of Sungame Corporation and Freevi Corporation and assume that for balance sheet purposes the transaction took place on December 31, 2010, and for statement of operations purposes on January 1, 2010 with resulting effects through December 31, 2010. The pro forma consolidated financial statements should be read in conjunction with the historical financial information. The pro forma consolidated financial statements are not necessarily indicative of the result that would have been attained had the transaction actually taken place earlier.
Pro Forma Adjustments
Pro forma adjustments from the pro forma consolidated financial statements are referenced below:
|
(1)
|
Adjustment to account for the exchange of 177,000,000 shares of Sungame Corporation @ .001 per share for 177,000,000 shares of Freevi Corporation. Freevi Corporation had a stockholders’ deficiency of $113,653 at December 31, 2010. The management of Freevi Corporation believes their technology should be valued at $2 million. However, since they are a development state enterprise and still in a research and development mode, this amount has not been capitalized as an asset under purchase price accounting. Instead the net liabilities of Freevi Corporation have been recorded in purchase price accounting for this business combination as an offset against paid-in-capital.
|
29
Sungame Corporation
(A Development Stage Company)
Pro Forma Consolidated Financial Statements
March 31, 2011
30
SUNGAME CORPORATION AND FREEVI CORPORATION
Pro Forma Consolidated Balance Sheet
March 31, 2011
|
Sungame
|
Freevi
|
Adjustments
|
||||||||||||||
|
Corporation
|
Corporation
|
(See Notes)
|
Consolidated
|
|||||||||||||
|
Assets:
|
||||||||||||||||
|
Cash
|
$ | 26 | $ | 3,584 | $ | 3,610 | ||||||||||
|
Accounts receivable and other
|
21,650 | 8,844 | 30,484 | |||||||||||||
|
Prepaid expenses
|
2,725 | 2,725 | ||||||||||||||
|
Total current assets
|
21,676 | 15,153 | 36,829 | |||||||||||||
|
Fixed Assets
|
||||||||||||||||
|
Office equipment
|
2,140 | 2,140 | ||||||||||||||
|
Accumulated depreciation
|
(779 | ) | (779 | ) | ||||||||||||
| 1,361 | 1,361 | |||||||||||||||
|
Total assets
|
$ | 23,037 | $ | 15,153 | $ | 38,190 | ||||||||||
|
Liabilities and Stockholders’ Deficiency
|
||||||||||||||||
|
Current liabilities:
|
||||||||||||||||
|
Accounts payable
|
$ | 112,035 | $ | 45,121 | $ | 157,156 | ||||||||||
|
Accrued liabilities
|
1,872 | 1,872 | ||||||||||||||
|
Due to Chandran Holding Media, Inc.
|
234,424 | 234,424 | ||||||||||||||
|
Credit cards payable
|
9,229 | 9,229 | ||||||||||||||
|
Loans payable - Stockholder
|
161,872 | 161,872 | ||||||||||||||
| 283,136 | 281,417 | 564,553 | ||||||||||||||
|
Common stock, par value, .001, 350,000,000 shares authorized with 177,250,000 issued and outstanding
|
250 | 177,000 | (1) | 177,250 | ||||||||||||
|
Paid-in-capital
|
2,153,035 | (443,264 | ) | 1,709,771 | ||||||||||||
|
Accumulated deficit
|
(2,413,384 | ) | (2,413,384 | ) | ||||||||||||
|
Total Stockholders’ Deficiency
|
(260,099 | ) | (266,264 | ) | (526,363 | ) | ||||||||||
|
Total Liabilities and Stockholders’ Deficiency
|
$ | 23,037 | $ | 283,186 | $ | (268,033 | ) | $ | 38,190 | |||||||
31
SUNGAME CORPORATION AND FREEVI CORPORATION
Pro Forma Consolidated Statement of Operations
For the Three Months Ended March 31, 2011
|
Sungame
Corporation
|
Freevi
Corporation
|
Consolidated | ||||||||||
|
Revenue:
|
$ | 31,150 | $ | 2,269 | $ | 33,419 | ||||||
|
Total Revenue
|
31,150 | 2,269 | 33,419 | |||||||||
|
Costs and Expenses:
|
||||||||||||
|
Software development
|
27,140 | 33,443 | 60,583 | |||||||||
|
Compensation
|
-0- | 95,395 | 95,395 | |||||||||
|
Depreciation
|
107 | -0- | 107 | |||||||||
|
Consulting and professional fees
|
8,571 | 8,571 | ||||||||||
|
Other general and administrative expenses
|
17,471 | 17,471 | ||||||||||
|
Startup costs
|
765 | -0- | 765 | |||||||||
|
Total Expenses
|
28,012 | 154,880 | 182,892 | |||||||||
|
Net Loss from Operations
|
3,138 | (152,611 | ) | (149,473 | ) | |||||||
|
Other income and (Expense)
|
(307 | ) | -0- | (307 | ) | |||||||
|
Net Income (Loss)
|
$ | 2,831 | $ | (152,611 | ) | $ | (149,780 | ) | ||||
|
Per Share Information:
|
||||||||||||
|
Net income (loss) per share
|
$ | 0.01 | $ | (0.01 | ) | $ | (0.01 | ) | ||||
|
Weighted average number of shares outstanding
|
250,000 | 177,000,000 | 177,250,000 | |||||||||
32
Sungame Corporation
(A Development Stage Company)
Note to Pro Forma Consolidated Financial Statements
March 31, 2011
Basis of Presentation
The following pro forma consolidated balance sheet as of March 31, 2011 and the pro forma consolidated statements of operation for the three months ended March 31 2011 between Sungame Corporation and Freevi Corporation are presented to show what effects the merger of Freevi Corporation into Sungame Corporation might have had on historical financial information had the transaction taken place on January 1, 2011. The pro forma consolidated financial statements are derived from the historical financials of Sungame Corporation and Freevi Corporation and assume that for balance sheet purposes the transaction took place on March 31, 2011, and for statement of operations purposes on January 1, 2011 with resulting effects through March 31, 2011. The pro forma consolidated financial statements should be read in conjunction with the historical financial information. The pro forma consolidated financial statements are not necessarily indicative of the result that would have been attained had the transaction actually taken place earlier.
Pro Forma Adjustments
Pro forma adjustments from the pro forma consolidated financial statements are referenced below:
|
(1)
|
Adjustment to account for the exchange of 177,000,000 shares of Sungame Corporation @ .001 per share for 177,000,000 shares of Freevi Corporation. Freevi Corporation had a stockholders’ deficiency of $266,264 at the time of the merger. The management of Freevi Corporation believes their technology should be valued at $2 million. However, since they are a development state enterprise and still in a research and development mode, this amount has not been capitalized as an asset under purchase price accounting. Instead the net liabilities of Freevi Corporation have been recorded in purchase price accounting for this business combination as an offset against paid-in-capital.
|
33
Item 2. Management's Discussion and Analysis of Financial Condition and Results of Operation.
Statement Regarding Forward-Looking Information.
This report contains forward-looking statements within the meaning of Section 27A of the Securities Act of 1933, as amended, Section 21E of the Securities Exchange Act of 1934 and the Private Securities Litigation Reform Act of 1995. All statements other than statements of historical facts included in this Quarterly Report on Form 10-Q, including without limitation, statements in this Management’s Discussion and Analysis of Financial Condition and Results of Operations regarding our financial position, estimated working capital, business strategy, the plans and objectives of our management for future operations and those statements preceded by, followed by or that otherwise include the words “believe”, “expects”, “anticipates”, “intends”, “estimates”, “projects”, “target”, “goal”, “plans”, “objective”, “should”, or similar expressions or variations on such expressions are forward-looking statements. We can give no assurances that the assumptions upon which the forward-looking statements are based will prove to be correct. Because forward-looking statements are subject to risks and uncertainties, actual results may differ materially from those expressed or implied by the forward-looking statements. There are a number of risks, uncertainties and other important factors that could cause our actual results to differ materially from the forward-looking statements, including, but not limited to, the availability and pricing of additional capital to finance operations.
Except as otherwise required by the federal securities laws, we disclaim any obligations or undertaking to publicly release any updates or revisions to any forward-looking statement contained in this Quarterly Report on Form 10-Q to reflect any change in our expectations with regard thereto or any change in events, conditions or circumstances on which any such statement is based.
The following discussion should be read in conjunction with our unaudited consolidated financial statements and the accompanying notes included elsewhere in this Quarterly Report on Form 10-Q.
Statement Regarding Forward-Looking Information. This report contains forward-looking statements within the meaning of Section 27A of the Securities Act of 1933, as amended, Section 21E of the Securities Exchange Act of 1934 and the Private Securities Litigation Reform Act of 1995. All statements other than statements of historical facts included in this Quarterly Report on Form 10-Q, including without limitation, statements in this Management’s Discussion and Analysis of Financial Condition and Results of Operations regarding our financial position, estimated working capital, business strategy, the plans and objectives of our management for future operations and those statements preceded by, followed by or that otherwise include the words “believe”, “expects”, “anticipates”, “intends”, “estimates”, “projects”, “target”, “goal”, “plans”, “objective”, “should”, or similar expressions or variations on such expressions are forward-looking statements. We can give no assurances that the assumptions upon which the forward-looking statements are based will prove to be correct. Because forward-looking statements are subject to risks and uncertainties, actual results may differ materially from those expressed or implied by the forward-looking statements. There are a number of risks, uncertainties and other important factors that could cause our actual results to differ materially from the forward-looking statements, including, but not limited to, the availability and pricing of additional capital to finance operations.
Statement Regarding Forward-Looking Information. This report contains forward-looking statements within the meaning of Section 27A of the Securities Act of 1933, as amended, Section 21E of the Securities Exchange Act of 1934 and the Private Securities Litigation Reform Act of 1995. All statements other than statements of historical facts included in this Quarterly Report on Form 10-Q, including without limitation, statements in this Management’s Discussion and Analysis of Financial Condition and Results of Operations regarding our financial position, estimated working capital, business strategy, the plans and objectives of our management for future operations and those statements preceded by, followed by or that otherwise include the words “believe”, “expects”, “anticipates”, “intends”, “estimates”, “projects”, “target”, “goal”, “plans”, “objective”, “should”, or similar expressions or variations on such expressions are forward-looking statements. We can give no assurances that the assumptions upon which the forward-looking statements are based will prove to be correct. Because forward-looking statements are subject to risks and uncertainties, actual results may differ materially from those expressed or implied by the forward-looking statements. There are a number of risks, uncertainties and other important factors that could cause our actual results to differ materially from the forward-looking statements, including, but not limited to, the availability and pricing of additional capital to finance operations.
Except as otherwise required by the federal securities laws, we disclaim any obligations or undertaking to publicly release any updates or revisions to any forward-looking statement contained in this Quarterly Report on Form 10-Q to reflect any change in our expectations with regard thereto or any change in events, conditions or circumstances on which any such statement is based. The following discussion should be read in conjunction with our unaudited consolidated financial statements and the accompanying notes included elsewhere in this Quarterly Report on Form 10-Q.
Background and History
SunGame Corporation (“We,” “Us,” “Our”) was organized under the laws of the State of Delaware on November 14, 2006 as SunGame International, Inc. On November 17, 2006, we changed our name to SunGame Corporation. We are a Delaware corporation organized for the purpose of engaging in any lawful business with a current plan to engage in the internet virtual world space.
We are an early development stage company in the process of establishing a three dimensional, Virtual World communities. Leveraging the increasing popularity of online communities with this proprietary “virtual world”, we intend to capitalize on the ever increasing popularity of games. With an initial focus on casual and tournament based games, we will also offer visitors a broad spectrum of social activities including group chats, music download, media sharing, content creation, advertisements and other features designed to build the community and generate repeat traffic to the Virtual world.
34
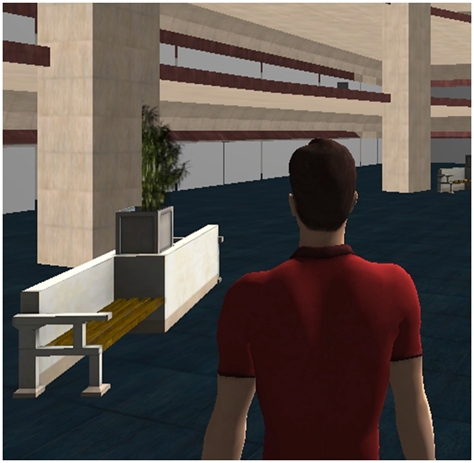
In addition, we have the mission to become a leading supplier in social games and related services to the business-to-business segment, including customized social games, virtual worlds, virtual eWallets, cross platform solutions and social network branding. In that regard we have been focusing the development during the period on a Facebook based cross platform game for subagames.com by Wicked Interactive.
35
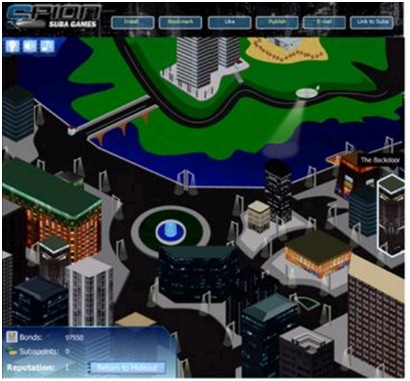
As each generation of computers become more powerful and affordable, and access to broadband internet increasingly available within the home, the game industry has become one of the most successful industries online. The most popular online game, World of Warcraft, a “Massively Multiplayer Online Role- Playing Game” or “MMORPG” enables over 1 million players from around the world to play simultaneously. Released in November 2004, it is estimated that World of Warcraft generated revenues in excess of $100 million in each of several different markets in its first year alone and recently announced it had signed its 10 millionth registered user. The potential for success in this sector has resulted in a perpetual delivery of new games to the market, much to the delight of the consumers, who seem to have a strong appetite for product.
The other component of the Virtual-World experience is the social networking aspect. The original web-based communities were formed to serve people with shared interests and activities, enabling them to communicate through message boards and email services. Relevant content is created and posted by the members. Within relatively short order, social networking revolutionized the way we communicate and share information on an everyday basis. Networks such as Facebook now boast over 500 million members, and the YouTube phenomenon is influencing the nature of presidential elections.
The next generation of the social network is set in a virtual world, members can create avatars to represent themselves and buy “real estate” which is then developed and customized to reflect their own personality and lifestyle. A number of successful Virtual Worlds are growing fast including Mindark’s Entropia and Club Penguin (bought by Disney for $350M, plus possible $350M earn out).
36
However, while people around the world participate in these communities every day, few social networks have been able to establish a successful business model. We intend to capitalize on the social networking, games and virtual world trends, providing users with a wide variety of games through various partners. At the Virtual World online community, the members can socialize, play games, share content, compete in tournament and buy virtual goods.
We will work to balance the more popular “standard” games such as bowling and golf, with original content created by independent game developers. Like many of the traditional gaming sites, ours has instituted an “outsourcing” strategy, allowing members of the community to develop the content -- for gamers, by gamers.
The developer friendly culture is expected to result in continual generation of original and challenging games to keep residents within the world.
Freevi Development
In addition to our game development efforts, we have been very active developing two specific solutions for Freevi Corporation during the period.
ViDirectory.com
During the three months ended March 31, 2011, we have developed ViDirectory, which is a complex Company Directory Service web environment.
It has a wide number of features, which are being launched in various releases.
The system was already developed by Freevi’s development resources (see Note 8 to the Financial Statements) and had reached Alpha launch, but after analysis from the SunGame Technical Team, the recommendation was to rewrite the service.
37

This, to ensure that the service would be able to manage a high number of users and to allow us to add various services which are defined below.
DealFreevi.Com
The Sungame technical team has further worked on the system support for the ViDirectory Dealer Campaign called DealFreevi.com.
38

This service consist of a dealer acquisition web site with application form and detailed information to the ViDirectory Dealer Program.
As soon as a prospective Dealer fills out the above form, the information is stored in a database and is in real time available in a browser based Administrative subsystem.
39
RESULTS OF OPERATIONS
THREE MONTHS ENDED MARCH 31, 2011 (Q1 2010)
COMPARED TO THREE MONTHS ENDED MARCH 31, 2011 (Q1 2010)
Revenues
For the three months ended March 31, 2011 we generated revenue of $31,150 compared to $6,265 for the three months ended March 31, 2010. The increase of $24,885 was due to nonrecurring development work performed for a customer.
Operating Expenses
Operating expenses for the three months ended March 31, 2011 were $28,012 compared to $36,195 for the three months ended March 31, 2010. This net decrease of $8,183 was the result of the decrease of 18,253 of expenses attributable to start-up costs, on the one hand, and the increase of 10,032 in software development costs associated with the increase in revenue on the other hand
Interest Expense
We incurred interest expense of $307 for the three months ended March 31, 2011 as compared to $5,108 of interest expense for the three months ended March 31, 2010. This decrease in interest expense is attributable to no interest-bearing contracts payable outstanding during the three months ended March 31, 2011 versus $165,000 outstanding during the three months ended March 31, 2010.
Loss From Operations
Income from operations for the three months ended March 31, 2011 was $3,138 compared to a net loss from operations of ($29,930) for the three months ended March 31, 2010. The $33,068 decrease in net loss is directly attributable to the increase in revenue and decrease in operating expenses described above. As of March 31, 2011, we have an accumulated deficit of $2,413,384.
40
Net Loss Applicable To Common Stock
Net income applicable to Common Stock was $0.01 for the three months ended March 31, 2011 compared to a net loss per share of $0.01 for the three months ended March 31, 2010.
LIQUIDITY AND CAPITAL RESOURCES
At March 31, 2011, we had cash on hand of $26 and total assets of $23,037; consisting of cash of $26, accounts receivable of $21,650 and net fixed assets of $1,361. At March 31, 2011, we had total current liabilities of $283,136; consisting of $112,035 of accounts payable, $9,229 of other payables, and a $161,872 loan payable to a stockholder. At March 31, 2011, we had a working capital deficit of $261,460.
During the three months ended March 31, 2011, cash used in operating activities was $634 compared to $40,163 during the three months ended March 31, 2010. During the three months ended March 31, 2011, net income of $2,831 were adjusted for a non-cash item consisting of $107 in depreciation. During the three months ended March 31, 2010, net losses of $35,038 were adjusted for non-cash items consisting of $69 in depreciation.
During the three months ended March 31, 2011 and March 31, 2010, we did not use or receive funds from investing activities. During the three months ended March 31, 2011, we increased our loan payable by $600 in financing activities. During the three months ended March 31, 2010, we increased our loan payable by $44,602 in financing activities.
In October 2008, we entered into a Security Purchase Agreement with a third party pursuant to which we received, in March 2009, cash of $125,000 in exchange for 500,000 shares of restricted common stock and a warrant exercisable for 500,000 shares of our restricted common stock. The warrant had an exercise price of $0.80 per share and a term of three years. The shares were sold at a price of $0.25 per share with $0.24 per share allocated to the common stock and $0.01 per share allocated to the warrant. However, Sungame reversed its stock in Q1 2011, effective 11 January 2011, (See 8K dated 11 January 2011) and the resultant warrants are now priced at $32.00 per warrant with 12,500 warrants remaining outstanding, adjusted for the reverse split of 40:1. The exercise date remains the same.
During the three months ended March 31, 2010, our majority shareholder, Adversor, Inc. advanced additional funds of $44,602 to support operations. During the year ended December 31, 2008, Adversor advanced additional funds of $98,740 to support operations. In 2008 Adversor contributed $107,109 to the Company's capital. During the year ended December 31, 2009, Adversor advanced an additional $7,470 to support operations. The balance owed to Adversor at March 31, 2010 is $162,072. The amounts owed are non-interest bearing and due on demand.
41
In October 2008, we entered into a Services Agreements with two parties. The Services Agreements provides for us to receive services totaling up to $625,000 in connection with the development of our system and gaming software to be paid for by the issuance of up to 2,500,000 shares of our common stock. During the year ended December 31, 2008, we issued 1,600,000 of these shares in exchange for services performed at that time totaling $400,000. The shares were issued at a price of $0.25 per share.
In October 2008, we issued 4,123,500 shares of our restricted common stock to our majority shareholder, Adversor, in exchange for their efforts in the settlement of $775,000 of outstanding accounts payable owed to an unrelated third party vendor. The shares were issued at a price of $0.188 per share.
In June 2008, we issued 902,000 shares of our restricted common stock to Friedland, in exchange for services totaling $50,000 provided under the Finance Advisory Services Agreement. The shares were issued at a price of $0.055 per share.
We anticipate funding operations through private investments and loans made by our current shareholders and management, however, we have no commitments for such funding as of the date of this report. In addition, we anticipate generating revenue in the near future, however, we have no current commitments or contracts that could result in such revenue. Management will have complete discretionary control over the actual utilization of said funds and there can be no assurance as to the manner or time in which said funds will be utilized.
We foresee that we will need a minimum of $1,500,000 to fund our operations for the next 12 months as follows:
|
System Development and Integration
|
$
|
500,000
|
||
|
Professional Fees
|
125,000
|
|||
|
Sales, Marketing, Strategic Partnerships
|
225,000
|
|||
|
General & Administrative
|
500,000
|
|||
|
Working Capital
|
150,000
|
|||
|
Total
|
$
|
1,500,000
|
42
We will need substantial additional capital to support our proposed future operations. We have minimal revenues. We have no committed source for any funds as of the date hereof. No representation is made that any funds will be available when needed. In the event funds cannot be raised when needed, we may not be able to carry out our business plan, may never achieve sales or royalty income, and could fail in business as a result of these uncertainties.
As a result of becoming a publicly reporting company with the SEC we will incur costs in connection with complying with the reporting requirements of the SEC. Such costs will include annual audits and those legal costs in connection with making filings with the SEC. We have accounted for such costs above in “Professional Fees” and “General & Administrative”.
Because of the limited financial resources that we have, it is unlikely that we will be able to diversify our operations. Our probable inability to diversify our activities into more than one area will subject us to economic fluctuations within the virtual world industry and therefore increase the risks associated with our operations due to lack of diversification.
We anticipate generating the vast majority of our revenues from our advertisers. Advertisers can generally terminate their contracts, at any time. Advertisers could decide to not do business with us if their investment in advertising with us does not generate sales leads, and ultimately customers, or if we do not deliver their advertisements in an appropriate and effective manner. If we are unable to remain competitive and provide value to advertisers, they may stop placing ads with us, which would negatively harm future revenues and business. In addition, expenditures by advertisers tend to be cyclical, reflecting overall economic conditions and budgeting and buying patterns. Any decreases in or delays in advertising spending due to general economic conditions could delay or reduce our revenues or negatively impact our ability to grow our revenues.
In the event we are unable to achieve additional capital raising through future private or public offerings, we will limit operations to fit within our capital availability. In such event, we will probably seek loans for operating capital. We have not achieved any commitments for loans from any source. In any event our business can be operated with a skeleton staff and have limited advertising/marketing budget, which could cause us to remain unprofitable and eventually fail.
Going Concern
The independent registered public accounting firm's report on our financial statements as of December 31, 2010 and 2009 includes a “going concern” explanatory paragraph that describes substantial doubt about our ability to continue as a going concern.
We are dependent on raising additional equity and/or, debt to fund any negotiated settlements with our outstanding creditors and meet our ongoing operating expenses. There is no assurance that we will be able to raise the necessary equity and/or debt that we will need to be able to negotiate acceptable settlements with our outstanding creditors or fund our ongoing operating expenses. We cannot make any assurances that we will be able to raise funds through such activities.
Capital Resources
We have only common stock as our capital resource.
We have no material commitments for capital expenditures within the next year, however if operations are commenced, substantial capital will be needed to pay for participation, investigation, exploration, acquisition and working capital.
Need For Additional Financing
We do not have capital sufficient to meet our cash needs. We have not generated revenue and have minimal resources to conduct planned operations. We estimate that our monthly expenses to commence planned operations within the next 12 months are approximately $125,000 (approximately $1,500,000 per year). Thus, using currently available capital resources (the primary source of which is non-binding commitments and expectations from management and current shareholders), we expect to be able to conduct planned operations for a minimum period of 1-3 months. We are currently relying solely on current shareholders and management to provide the necessary funds to continue operations. We do not have any commitments for such funding from shareholders or management.
At the present time, we have not made any arrangements to raise additional cash. Management and current shareholders are expected, but have not committed, to provide the necessary working capital so as to permit us to conduct planned operations until such time as we have begun to generate revenue and/or have become sufficiently funded. However, if we do not begin to generate revenue or cannot raise additional needed funds, we will either have to suspend development operations until we do raise the funds, or cease operations entirely.
In addition, the United States and the global business community is experiencing severe instability in the commercial and investment banking systems which is likely to continue to have far-reaching effects on the economic activity in the country for an indeterminable period. The long-term impact on the United States economy and our operating activities and ability to raise capital cannot be predicted at this time, but may be substantial.
Critical Accounting Policies
We have identified the policies below as critical to its business operations and the understanding of our results from operations. The impact and any associated risks related to these policies on our business operations is discussed throughout Management's Discussion and Analysis of Financial Conditions and Results of Operations where such policies affect our reported and expected financial results. Note that our preparation of this document requires us to make estimates and assumptions that affect the reported amounts of assets and liabilities, disclosure of contingent assets and liabilities at the date of our financial statements, and the reported amounts of expenses during the reporting periods. There can be no assurance that actual results will not differ from those estimates. During the three months ended March 31, 2011, there were no significant changes in our critical accounting policies and estimates. You should refer to Management’s Discussion and Analysis of Financial Condition and Results of Operations contained in our Annual Report on Form 10-K for the year ended December 31, 2010 for a more complete discussion of our critical accounting policies and estimates.
43
Risks And Uncertainties
We operate in an emerging industry that is subject to market acceptance and technological change. Our operations are subject to significant risks and uncertainties, including financial, operational, technological and other risks associated with operating an emerging business, including the potential risk of business failure.
Software Costs
The costs for internal use software, whether developed or obtained, are assessed to determine whether they should be capitalized or expensed in accordance with American Institute of Certified Public Accountants' Statement (“SOP”) 98-1, “Accounting for the Costs of Computer Software Developed or Obtained for Internal Use”. Capitalized software costs are reflected as property and equipment on the balance sheet and are to be depreciated when we begin recording revenue the deemed date that the software is placed in service. As of the date of these financial statements the development of the software necessary to achieve the business purposes of our Company is in an undeterminable state causing us to deem the asset to be impaired. This conclusion requires that the costs incurred to date be treated as expenses as opposed to the capitalizing of the software.
Start-Up Costs
Start-up costs that would commonly be capitalized as Other Assets to be amortized over a period of five years have also been deemed to be impaired for the same reasons stated in the paragraph on “Software Costs”. Based on these circumstances, management has elected to expense these start-up costs as well.
“Long-lived assets” are reviewed for impairment of value whenever events or changes in circumstances indicate that the carrying value of the assets might not be recoverable or at least at the end of each reporting period. Conditions that would necessitate an impairment assessment include a significant decline in the observable market value of an asset, a significant change in the extent or manner in which an asset is used, or a significant adverse change that would indicate that the carrying value of an asset is not recoverable. For Long-lived assets to be held and used, management measures fair value based on quoted market prices or based on discounted estimates of future cash flows.
Off-Balance Sheet Arrangements
As of March 31, 20101 we did not have any relationships with unconsolidated entities or financial partners, such as entities often referred to as structured finance or special purpose entities, that had been established for the purpose of facilitating off-balance sheet arrangements or other contractually narrow or limited purposes. As such, we are not materially exposed to any financing, liquidity, market or credit risk that could arise if we were engaged in such relationships.
Item 3. Quantitative and Qualitative Disclosures about Market Risk
We are a smaller reporting company as defined by Rule 12b-2 of the Securities Exchange Act of 1934 and are not required to provide information under this item.
Item 4. Controls and Procedures
Evaluation of Disclosure Controls and Procedures
Our management, with the participation of our Chief Executive Officer and Chief Financial Officer, has evaluated the effectiveness of the design and operation of our disclosure controls and procedures (as defined in Rule 13a-15(e) under the Securities Exchange Act of 1934, as amended (the “Exchange Act”) as of March 31, 2011. Based on this evaluation, our Chief Executive Officer and Chief Financial Officer concluded that these disclosure controls and procedures were effective as of such date, at a reasonable level of assurance, in ensuring that the information required to be disclosed by our company in the reports we file or submit under the Exchange Act is: (i) accumulated and communicated to our management (including the Chief Executive Officer and Chief Financial Officer) in a timely manner, and (ii) recorded, processed, summarized and reported within the time periods specified in the SEC’s rules and forms.
Internal Control Over Financial Reporting
Our management is responsible for establishing and maintaining adequate internal control over financial reporting, as such term is defined in Exchange Act Rules 13a-15(f). Under the supervision and with the participation of our management, including our Chief Executive Officer and Chief Financial Officer, we conducted an evaluation of the effectiveness of our internal control over financial reporting based on the criteria in Internal Control – Integrated Framework issued by the Committee of Sponsoring Organizations of the Treadway Commission . Based on our evaluation, management has concluded that our internal control over financial reporting was effective as of March 31, 2011. Because of its inherent limitations, internal control over financial reporting may not prevent or detect misstatements. Also, projections of any evaluation of effectiveness to future periods are subject to the risks that controls may become inadequate because of changes in conditions, or that the degree of compliance with the policies or procedures may deteriorate. This report does not include an attestation report of our registered public accounting firm regarding internal control over financial reporting pursuant to temporary rules of the Securities and Exchange Commission.
Changes in Internal Control Over Financial Reporting
There was no change in our internal control over financial reporting (as defined in Rule 13a-15(f) under the Securities Exchange Act of 1934, as amended) during our last fiscal quarter that has materially affected, or is reasonably likely to materially affect, our internal control over financial reporting.
44
PART II - OTHER INFORMATION
Item 1. Legal Proceedings
We are not a party to any legal proceedings nor is any of Sungame property the subject of any pending legal proceedings.
Item 1A. Risk Factors
We are a smaller reporting company as defined by Rule 12b-2 of the Securities Exchange Act of 1934 and are not required to provide information under this item.
Item 2. Unregistered Sales of Equity Securities
None.
However, it should be noted the Sungame Corp. and Freevi Corp. have successfully engaged in a business combination, with Sungame being the surviving entity, and there was a share exchange where Freevi shares were exchanged for Sungame shares, pursuant to the terms and conditions of the combination. [See 8K dated 15 April 2011]
See Item 5 for further disclosures of unregistered transactions in equity securities after the disclosure period.
Item 3. Defaults Upon Senior Securities
None
Item 4. Removed and Reserved.
Item 5. Other Information
The Board of Directors had held a meeting on 2 May 2011 and appointed Raj Ponniah as Secretary of Sungame Corp. with the understanding that his appointment coincide with the publication of this 10Q to save on costs. Mr. Ponniah currently is a Director of Sungame and recused himself from the vote, but accepted the appointment.
On 2 May 2011, The board of Directors authorized 25,000 for Mundial Financial Group, L.L.C. for investment banking services, and authorized the issuance of 300,000 shares to Marshal Shichtman and Associates, P.C. as a gratuity for services rendered.
Item 6. Exhibits
|
EXHIBIT
|
|
|
NUMBER
|
DESCRIPTION
|
|
31.1
|
Certification of Principal Executive Officer and Principal Financial Officer pursuant to Sarbanes-Oxley Section 302 (Sungame Corporation)
|
| 31.2 |
Certification of Principal Executive Officer and Principal Financial Officer pursuant to Sarbanes-Oxley Section 302 (Freevi Corporation)
|
|
32.1
|
Certification of Chief Executive Officer and Chief Financial Officer pursuant to Sarbanes-Oxley Section 906
|
45
SIGNATURES
Pursuant to the requirements of the Securities Exchange Act of 1934, the registrant has duly caused this report to be signed on its behalf by the undersigned thereunto duly authorized.
By: /s/ Guy M. Robert
Name: Guy M. Robert
Title: Principal Executive Officer,
President and Chief Executive Officer,
Chief Financial Officer and Principal
Accounting Officer, Director
Date: May 19, 2011
46