Attached files
| file | filename |
|---|---|
| 8-K - 8-K - STATE BANK FINANCIAL CORP | a11-12377_38k.htm |
|
|
Investor Day May 19, 2011 Exhibit 99.1 |
|
|
Welcome to State Bank |
|
|
Cautionary Note Regarding Forward-Looking Statements Certain statements contained in this presentation are “forward-looking statements” within the meaning of the federal securities laws, including, statements relating to future expectations, acquisition activity (including failed bank, conventional and portfolio acquisitions), the size and number of those acquisitions, asset growth, and our strategic plan. Although we believe that the assumptions underlying the forward-looking statements are reasonable, any of the assumptions could prove to be inaccurate. Therefore, we can give no assurance that the results contemplated in the forward-looking statements will be realized. The inclusion of this forward-looking information should not be construed as a representation by our company or any person that future events, plans, or expectations contemplated by our company will be achieved. We undertake no obligation to publicly update or revise any forward-looking statements, whether as a result of new information, future events, or otherwise. The following list, which is not intended to be an all-encompassing list of risks and uncertainties affecting us, summarizes several factors that could cause our actual results to differ materially from those anticipated or expected in these forward-looking statements: general economic conditions (both generally and in our markets) may be less favorable than expected, which could result in, among other things, a continued deterioration in credit quality, a further reduction in demand for credit and a further decline in real estate values; the general decline in the real estate and lending markets, particularly in our market areas, may continue to negatively affect our financial results; our ability to raise additional capital may be impaired if current levels of market disruption and volatility continue or worsen; we may be unable to collect reimbursements on losses that we incur on our assets covered under loss share agreements with the FDIC as we anticipate; costs or difficulties related to the integration of the banks we acquired from the FDIC as receiver may be greater than expected; restrictions or conditions imposed by our regulators on our operations may make it more difficult for us to achieve our goals; legislative or regulatory changes, including changes in accounting standards and compliance requirements, may adversely affect us; competitive pressures among depository and other financial institutions may increase significantly; changes in the interest rate environment may reduce margins or the volumes or values of the loans we make or have acquired; other financial institutions have greater financial resources and may be able to develop or acquire products that enable them to compete more successfully than we can; our ability to attract and retain key personnel can be affected by the increased competition for experienced employees in the banking industry; adverse changes may occur in the bond and equity markets; war or terrorist activities may cause further deterioration in the economy or cause instability in credit markets; economic, governmental or other factors may prevent the projected population, residential and commercial growth in the markets in which we operate; and we will or may continue to face the risk factors discussed from time to time in the periodic reports we file with the SEC. |
|
|
Building a Dominant Super-Community Bank $2.7 billion total assets $358 million of tangible equity #3 market cap in Georgia Dynamic footprint 64% of total deposits Georgia Market share: #1 in Middle Georgia #11 in Metro Atlanta #9 in the State of Georgia |
|
|
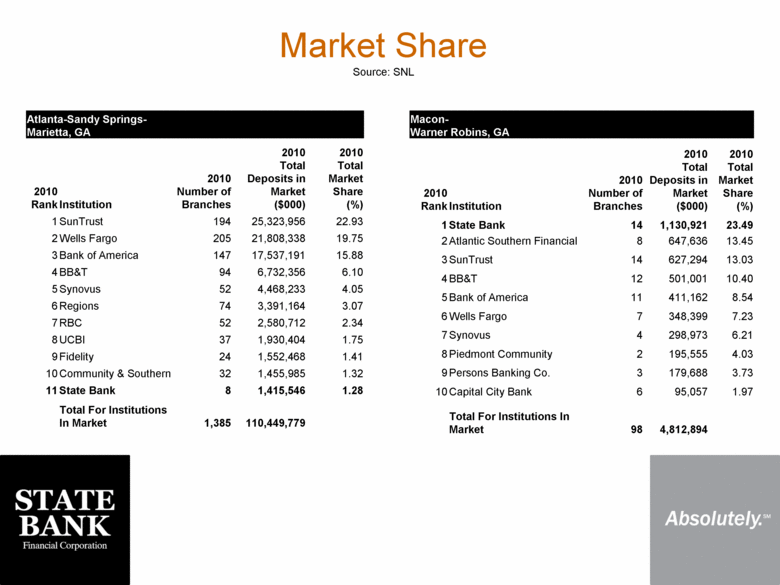
Atlanta-Sandy Springs-Marietta, GA 2010 Rank Institution 2010 Number of Branches 2010 Total Deposits in Market ($000) 2010 Total Market Share (%) 1 SunTrust 194 25,323,956 22.93 2 Wells Fargo 205 21,808,338 19.75 3 Bank of America 147 17,537,191 15.88 4 BB&T 94 6,732,356 6.10 5 Synovus 52 4,468,233 4.05 6 Regions 74 3,391,164 3.07 7 RBC 52 2,580,712 2.34 8 UCBI 37 1,930,404 1.75 9 Fidelity 24 1,552,468 1.41 10 Community & Southern 32 1,455,985 1.32 11 State Bank 8 1,415,546 1.28 Total For Institutions In Market 1,385 110,449,779 Macon- Warner Robins, GA 2010 Rank Institution 2010 Number of Branches 2010 Total Deposits in Market ($000) 2010 Total Market Share (%) 1 State Bank 14 1,130,921 23.49 2 Atlantic Southern Financial 8 647,636 13.45 3 SunTrust 14 627,294 13.03 4 BB&T 12 501,001 10.40 5 Bank of America 11 411,162 8.54 6 Wells Fargo 7 348,399 7.23 7 Synovus 4 298,973 6.21 8 Piedmont Community 2 195,555 4.03 9 Persons Banking Co. 3 179,688 3.73 10 Capital City Bank 6 95,057 1.97 Total For Institutions In Market 98 4,812,894 Market Share Source: SNL |
|
|
Two Dimensional Business Model Building the Premier Super Community Bank in Metro Atlanta and Middle Georgia Running a highly effective problem asset resolution business under FDIC loss share |
|
|
Strategic Sequence of Transactions 2009: Framing in the franchise Six Security National Banks Buckhead Community Bank First Security National Bank 2010: High-value fill-in NorthWest Bank and Trust United Americas Bank 2011: More high-value fill-in |
|
|
Aggressive Restructuring We have aggressively used the tools afforded us by the FDIC receivership to build a more efficient platform than the simple aggregation of the failed banks who preceded us. Total branches acquired = 38 Total branches currently operating = 22 Total deposits acquired = $3.2 billion Total deposits as of 3/31/11 = $2.269 billion |
|
|
Problem Asset Resolution Scalable, free standing profit center High marks from the FDIC DRR Financial enabler of building franchise value Exceeding initial performance expectations |
|
|
Generating New Loans Lagging initial expectations We expected much more outright liquidations of failed banks by the FDIC as opposed to Loss Share transactions No net expansion of credit in our markets Substantial retooling of acquired lenders Long term optimism We have real estate lending capacity Substantial capacity elimination in community bank sector M&A opportunities |
|
|
The Plan Going Forward For the next several years, our focus will be: Building the Metro Atlanta and Middle Georgia franchise Business Banking Demand Deposits Electronic Payments Additional in-market loss share acquisitions Financial Strategic Conventional M&A Banks Non-bank |
|
|
Pleased Thus Far Acquisitions have performed financially Executed on integration Framed in a valuable franchise Highly desirable markets Rational footprint Solid strategic focus |
|
|
Kim Childers, Vice Chairman, President and Chief Credit Officer John Poelker, Chief Financial Officer Mike Fitzgerald, Executive Vice President, Deposit Initiatives Q & A A Closer Look at State Bank |
|
|
Asset Generation Strategy Organic growth in our markets Hire best bankers in market, preferably with portable portfolios Organic in market growth – largely cannibalization of regional banks and distressed community banks Finance of assets purchased at reset prices, typically from ORE portfolios or distressed sales Fixed rate swap program. Longer term, “sticky” credit |
|
|
Asset Generation Strategy Specialized niches Non-agency variable rate MBS Correspondent banking strategy Approved as SBA Preferred Lender Select TAN and municipal finance |
|
|
Asset Generation Strategy Portfolio acquisition strategies Performing assets that come with failed bank acquisitions Line of business purchase M&A transactions other than loss share |
|
|
Asset Generation Strategy What we won’t do: Compromise credit – terms, structure, discipline Create excessive interest rate risk Inappropriate concentrations Engage in what we either don’t have or develop expertise in |
|
|
NPA Resolution Modeled vs. Actual Performance |
|
|
Covered NPAs Modeled vs Actual |
|
|
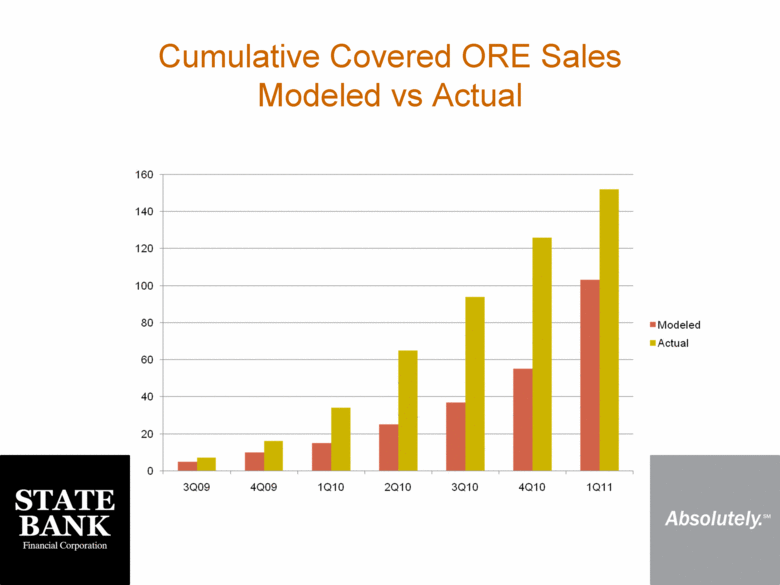
Cumulative Covered ORE Sales Modeled vs Actual |
|
|
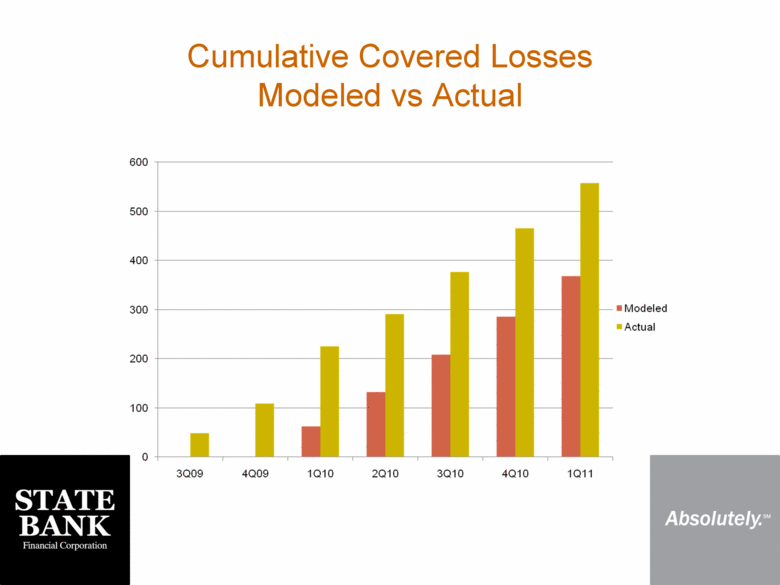
Cumulative Covered Losses Modeled vs Actual |
|
|
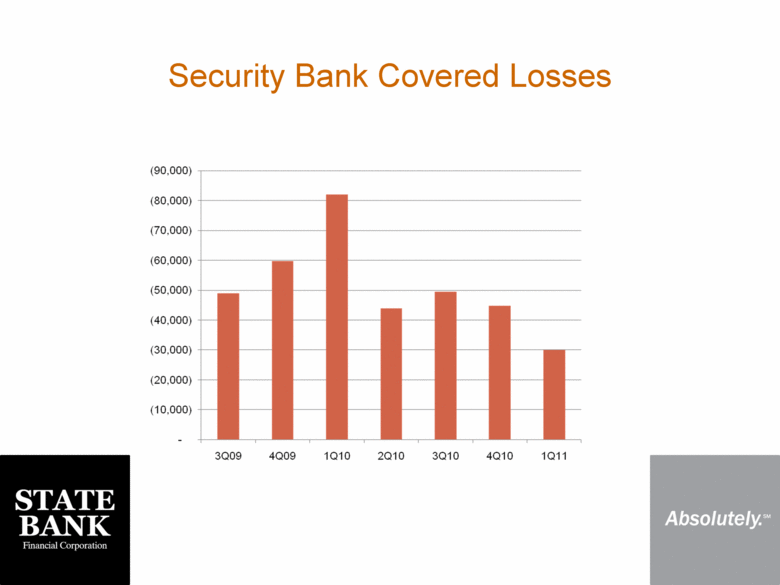
Security Bank Covered Losses |
|
|
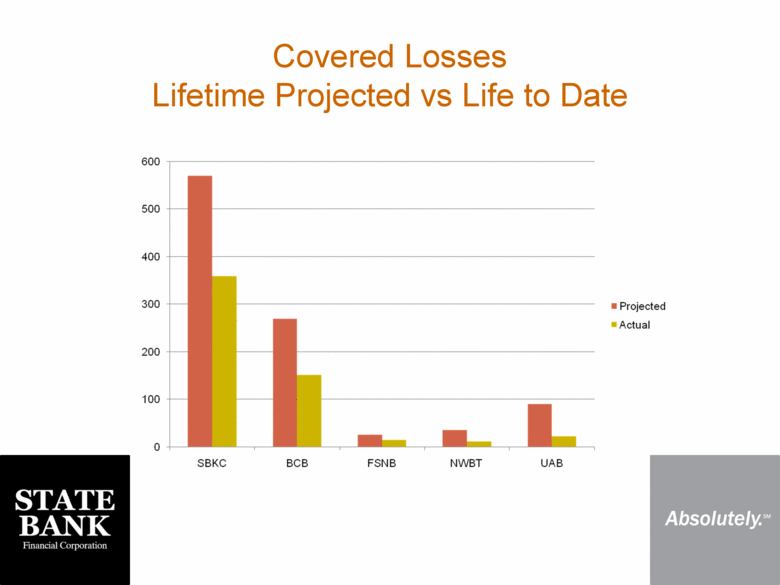
Covered Losses Lifetime Projected vs Life to Date |
|
|
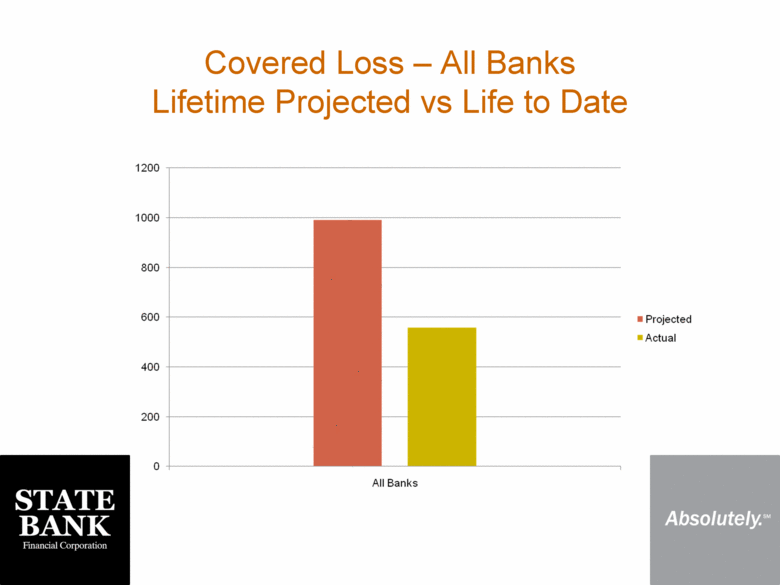
Covered Loss – All Banks Lifetime Projected vs Life to Date |
|
|
Accounting For Acquired Loans All loans acquired to date have been accounted for as impaired acquired loans subject to accounting principles under FASB ASC Topic 310 Impaired loans acquired are carried on the books at “fair value” based on the net present value of projected cash flows We have installed a sophisticated cash flow modeling system allowing us to make these complex calculations Foreclosed and other real estate acquired is carried at expected net realizable value |
|
|
Accounting for Acquired Loans An FDIC receivable is established based on the loss coverage agreements and the expected magnitude and timing of losses on loans and OREO Loan and FDIC receivable present value discounts are accreted into income over the expected term of the assets Fair value calculations are updated periodically Decreased cash flow projections result in a provision for loan losses Increased cash flow projections result in adjustments to accretion income over remaining life of loans |
|
|
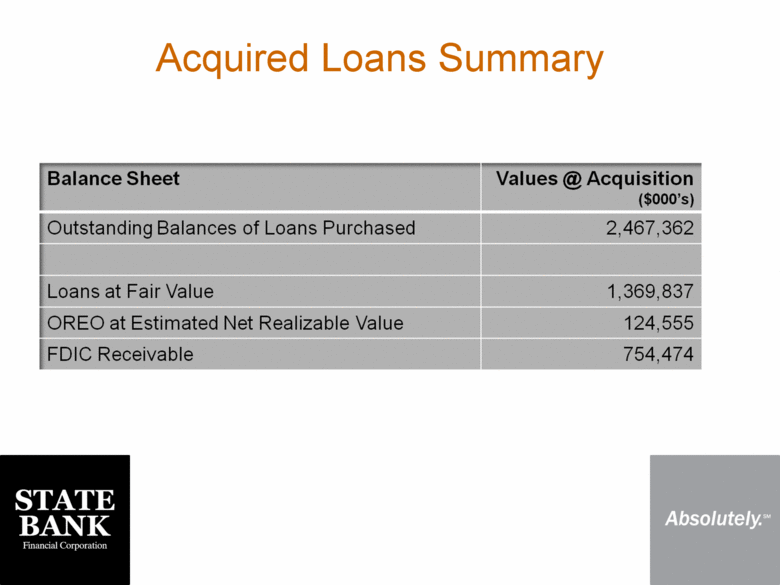
Acquired Loans Summary Balance Sheet Values @ Acquisition ($000’s) Outstanding Balances of Loans Purchased 2,467,362 Loans at Fair Value 1,369,837 OREO at Estimated Net Realizable Value 124,555 FDIC Receivable 754,474 |
|
|
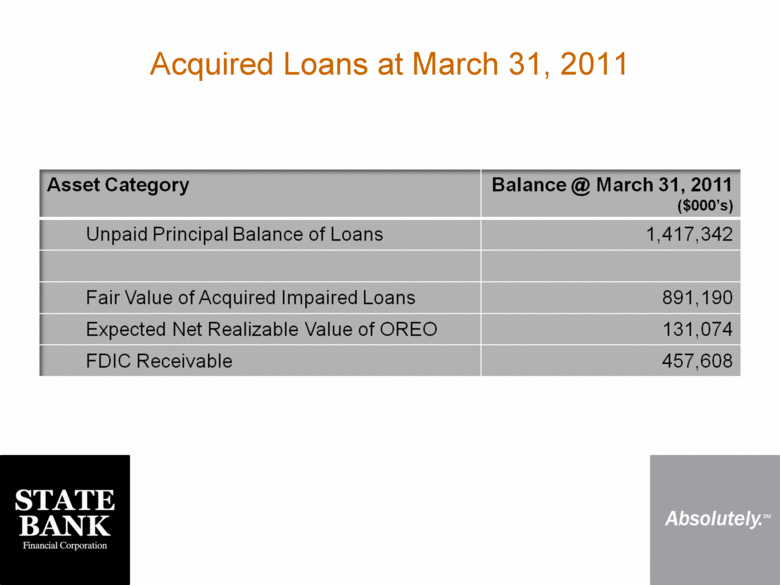
Acquired Loans at March 31, 2011 Asset Category Balance @ March 31, 2011 ($000’s) Unpaid Principal Balance of Loans 1,417,342 Fair Value of Acquired Impaired Loans 891,190 Expected Net Realizable Value of OREO 131,074 FDIC Receivable 457,608 |
|
|
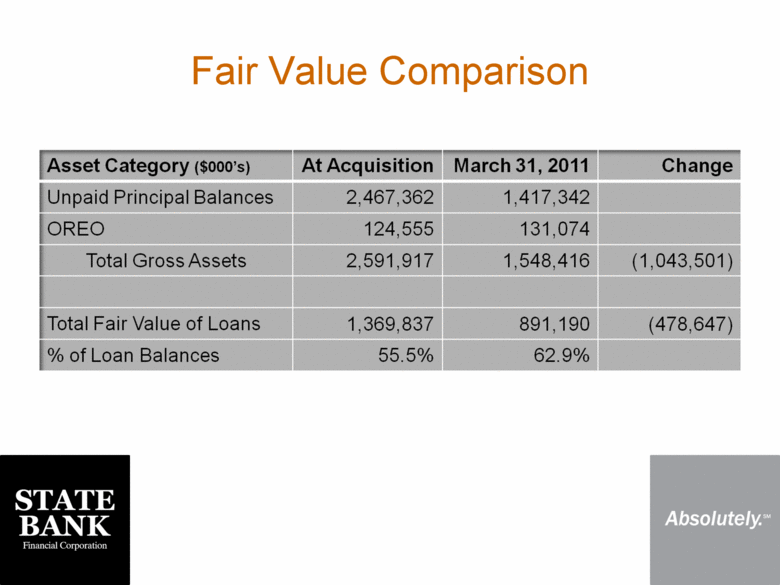
Fair Value Comparison Asset Category ($000’s) At Acquisition March 31, 2011 Change Unpaid Principal Balances 2,467,362 1,417,342 OREO 124,555 131,074 Total Gross Assets 2,591,917 1,548,416 (1,043,501) Total Fair Value of Loans 1,369,837 891,190 (478,647) % of Loan Balances 55.5% 62.9% |
|
|
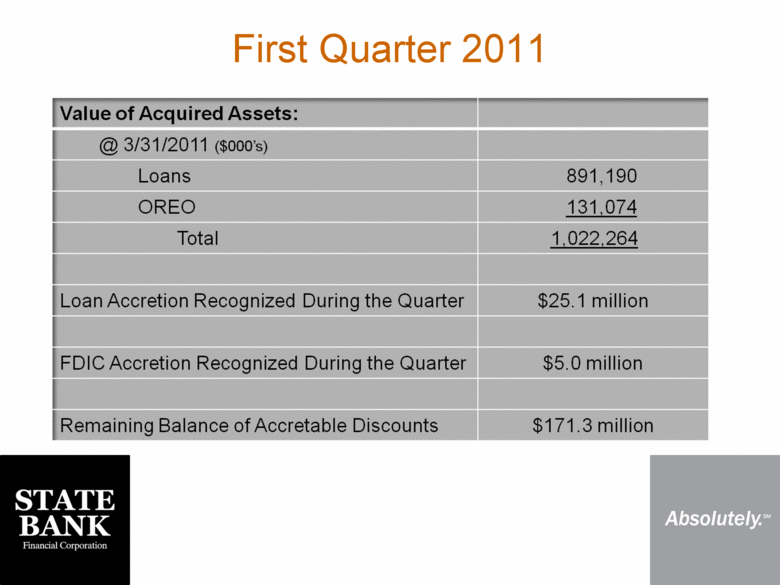
First Quarter 2011 Value of Acquired Assets: @ 3/31/2011 ($000’s) Loans 891,190 OREO 131,074 Total 1,022,264 Loan Accretion Recognized During the Quarter $25.1 million FDIC Accretion Recognized During the Quarter $5.0 million Remaining Balance of Accretable Discounts $171.3 million |
|
|
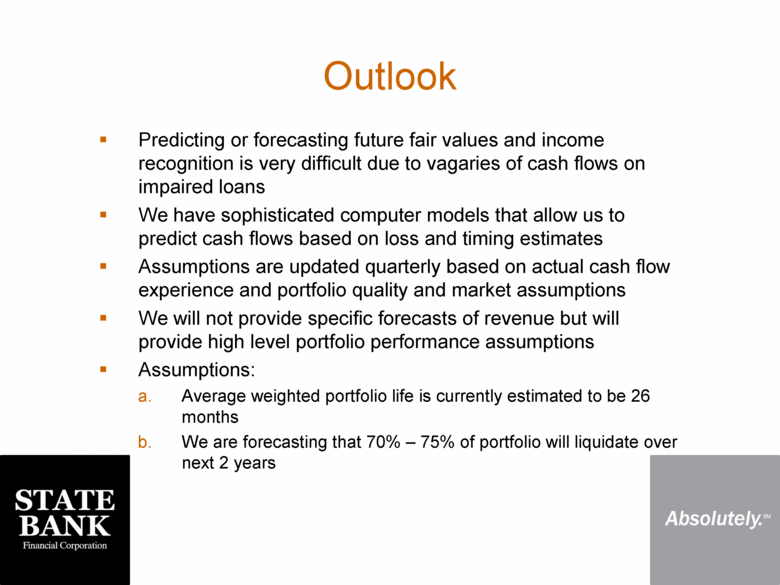
Outlook Predicting or forecasting future fair values and income recognition is very difficult due to vagaries of cash flows on impaired loans We have sophisticated computer models that allow us to predict cash flows based on loss and timing estimates Assumptions are updated quarterly based on actual cash flow experience and portfolio quality and market assumptions We will not provide specific forecasts of revenue but will provide high level portfolio performance assumptions Assumptions: Average weighted portfolio life is currently estimated to be 26 months We are forecasting that 70% – 75% of portfolio will liquidate over next 2 years |
|
|
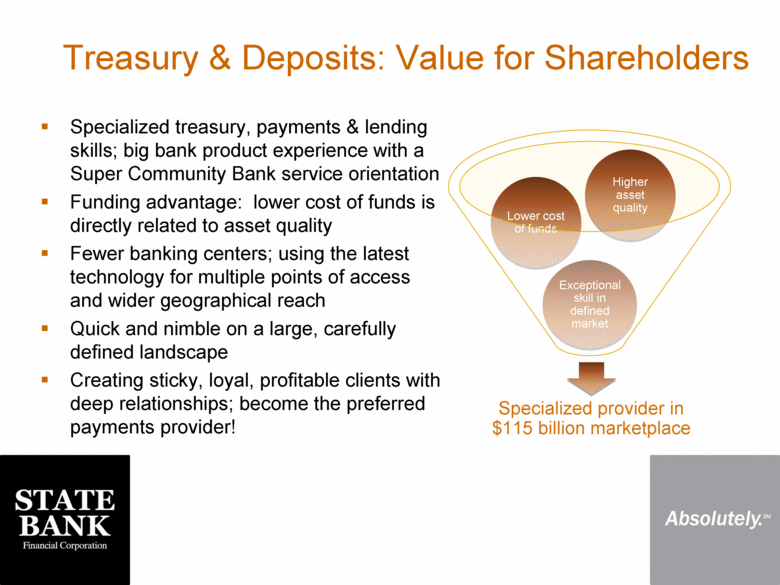
Specialized treasury, payments & lending skills; big bank product experience with a Super Community Bank service orientation Funding advantage: lower cost of funds is directly related to asset quality Fewer banking centers; using the latest technology for multiple points of access and wider geographical reach Quick and nimble on a large, carefully defined landscape Creating sticky, loyal, profitable clients with deep relationships; become the preferred payments provider! Specialized provider in $115 billion marketplace Exceptional skill in defined market Lower cost of funds Higher asset quality Treasury & Deposits: Value for Shareholders |
|
|
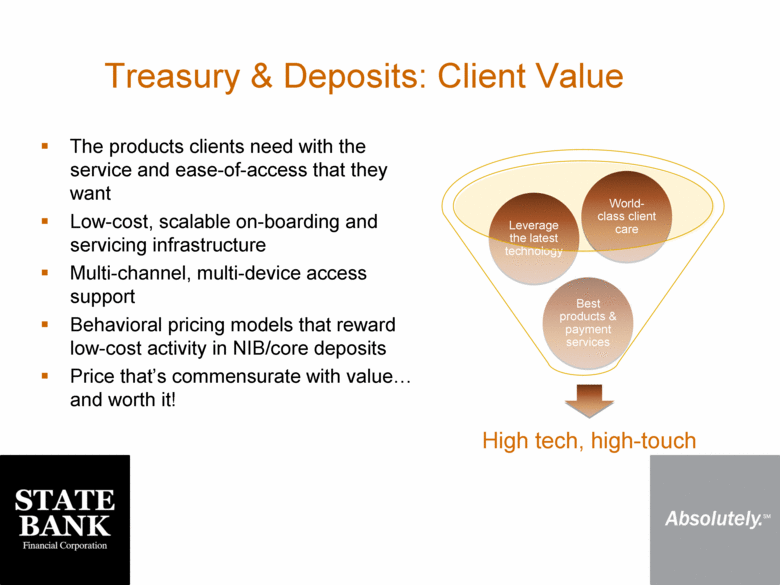
The products clients need with the service and ease-of-access that they want Low-cost, scalable on-boarding and servicing infrastructure Multi-channel, multi-device access support Behavioral pricing models that reward low-cost activity in NIB/core deposits Price that’s commensurate with value... and worth it! Treasury & Deposits: Client Value High tech, high-touch Best products & payment services Leverage the latest technology World-class client care |
|
|
Wrap Up Questions & Answers |


