Attached files
| file | filename |
|---|---|
| 8-K - CURRENT REPORT ON FORM 8-K - US ECOLOGY, INC. | usecology_8k-051911.htm |
Exhibit 99.1

May 2011
1

During the course of this presentation the Company will be making forward-looking statements (as
such term is defined in the Private Securities Litigation Reform Act of 1995) that are based on our
current expectations, beliefs and assumptions about the industry and markets in which US
Ecology, Inc. and its subsidiaries operate. Because such statements include risks and
uncertainties, actual results may differ materially from what is expressed herein and no assurance
can be given that the Company will meet its 2011 earnings estimates, successfully execute its
growth strategy, or declare or pay future dividends. For information on other factors that could
cause actual results to differ materially from expectations, please refer to US Ecology, Inc.’s
December 31, 2010 Annual Report on Form 10-K and other reports filed with the Securities and
Exchange Commission. Many of the factors that will determine the Company’s future results are
beyond the ability of management to control or predict. Participants should not place undue
reliance on forward-looking statements, reflect management’s views only as of the date hereof.
The Company undertakes no obligation to revise or update any forward-looking statements, or to
make any other forward-looking statements, whether as a result of new information, future events
or otherwise.
Important assumptions and other important factors that could cause actual results to differ
materially from those set forth in the forward-looking information include a loss of a major
customer, successful integration of Stablex Canada Inc., exposure to unknown liabilities resulting
from the Stablex Canada Inc. acquisition, compliance with and changes to applicable laws, rules,
or regulations, access to cost effective transportation services, access to insurance, surety bonds
and other financial assurances, loss of key personnel, lawsuits, labor disputes, adverse economic
conditions, government funding or competitive pressures, incidents or adverse weather conditions
that could limit or suspend specific operations, implementation of new technologies, market
conditions, average selling prices for recycled materials, our ability to replace business from
recently completed large projects, our ability to perform under required contracts, our ability to
permit and contract for timely construction of new or expanded disposal cells, our willingness or
ability to pay dividends and our ability to effectively close and integrate future acquisitions.
2

} Industry Overview
} US Ecology
◦ Who we are
◦ What do we do
} Review of our Sites
} Our Performance
} General Market Trends
} Growth Strategy and Business Outlook
3
Agenda
} Estimated $5 billion per year market
} Landfill revenue represents
14% or $700 million of market
14% or $700 million of market
} Historically ~3.5M tons/year disposed
} Key Drivers
◦ Regulatory
◦ Commercial
◦ Government

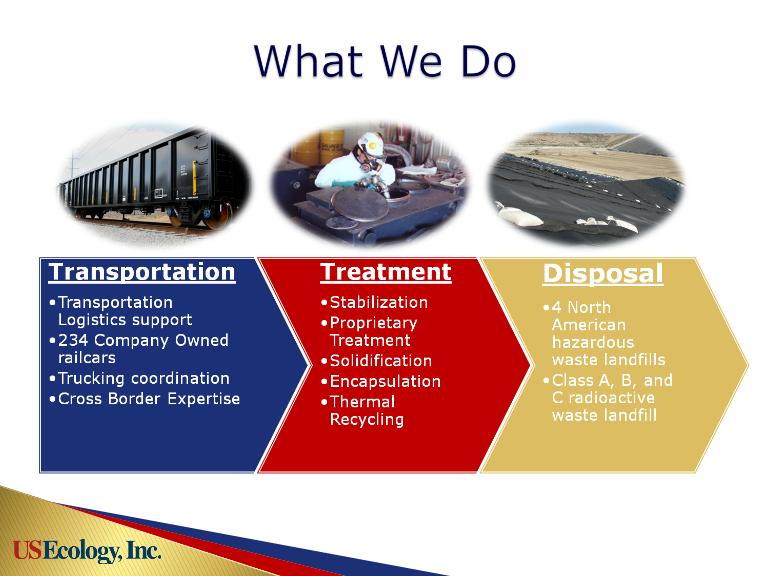
} Provide safe, secure &
cost-effective hazardous
and radioactive materials
solutions
cost-effective hazardous
and radioactive materials
solutions
} Own & operate hazardous
and radioactive waste
landfills
and radioactive waste
landfills
} Large, loyal customers
} Serving industry and
government for over 50
years
government for over 50
years
5
6
7
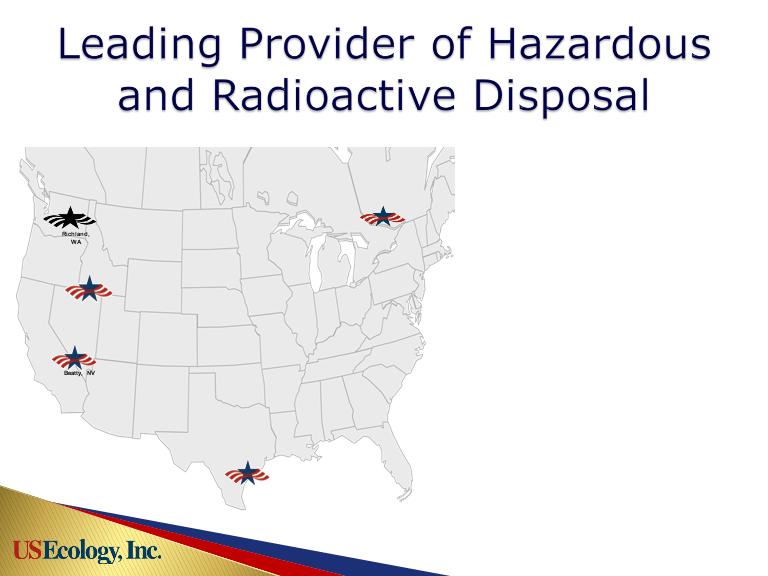
Grand View, ID
Robstown, TX
Blainville, QC
} 29% Share of North
American Hazardous
Waste Market
American Hazardous
Waste Market
◦ Operate 4 of 20 sites
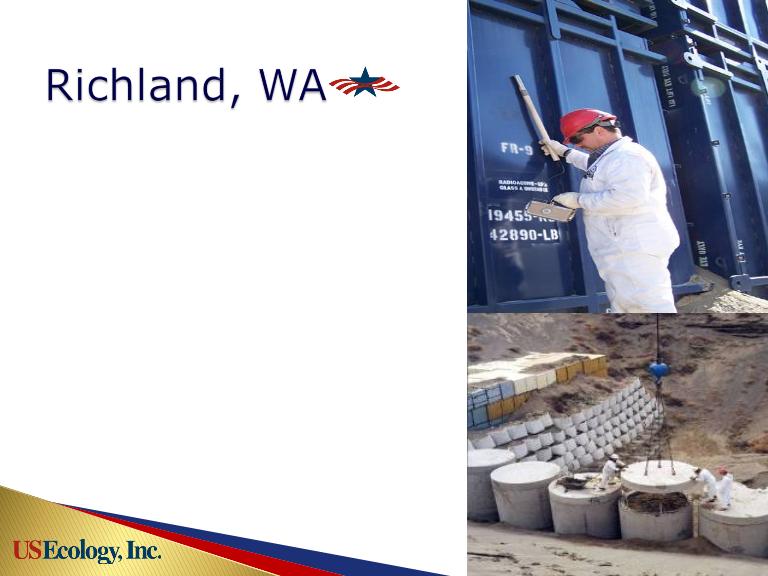
} Monopoly
Radioactive Waste
Disposal Site for 11
Northwest States
Radioactive Waste
Disposal Site for 11
Northwest States
◦ Operate 1 of only 3
active commercial
radioactive sites in
country
active commercial
radioactive sites in
country
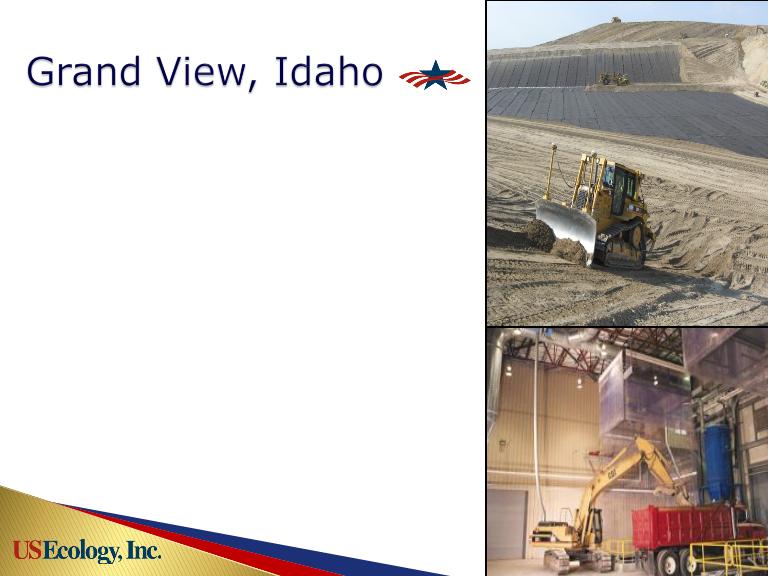
} “Hybrid” site accepts low-activity
radioactive and hazardous waste
radioactive and hazardous waste
} Specializes in high volume
treatment or direct disposal
projects
treatment or direct disposal
projects
} Rail and truck served
} Decades of permitted capacity
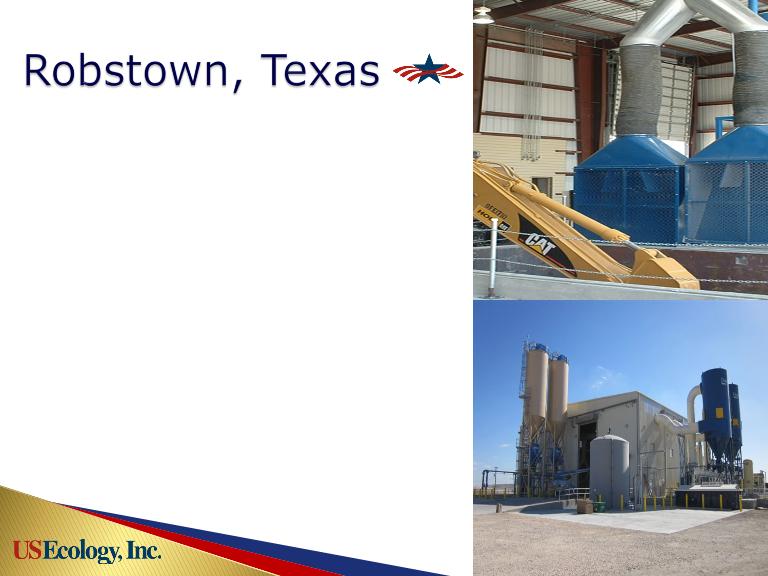
} Well situated in large Gulf
Coast oil and gas market
Coast oil and gas market
} Specializes in difficult to treat
waste streams
waste streams
} Added significant waste
handling infrastructure in 2010
handling infrastructure in 2010
} Rail and truck served
} 10+ years of permitted
capacity
capacity

} Recycles refinery tank
bottoms, cracking catalyst &
other oil bearing wastes
bottoms, cracking catalyst &
other oil bearing wastes
◦ Industrial reuse of catalyst
◦ Used oil resold into market
} Key advantage: Internalize
costs of recycling residuals:
ash & liquids
costs of recycling residuals:
ash & liquids
} Constructing new catalyst
handling system
handling system
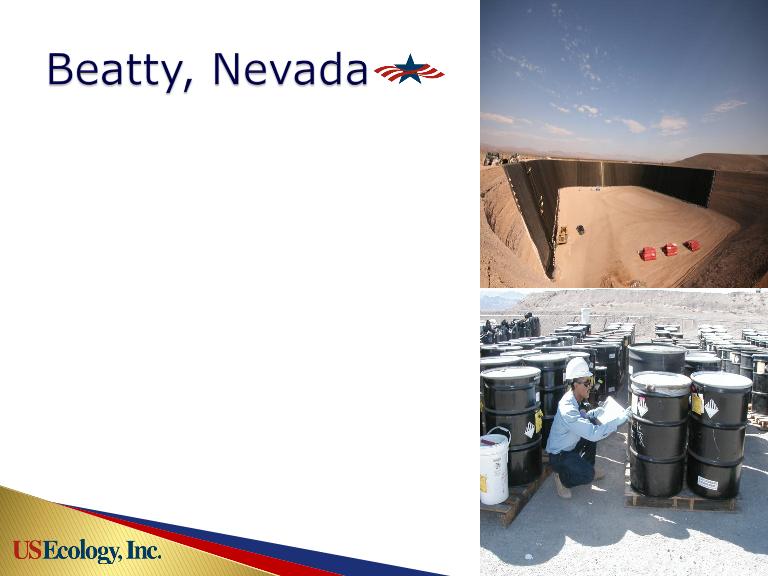
} Great desert location serving
large CA/AZ market
large CA/AZ market
} Specializing in containers and
difficult to treat waste streams
difficult to treat waste streams
} State-of-the-art treatment
building with high capacity
drum handling capability
building with high capacity
drum handling capability
} New disposal space
constructed - March of 2011
constructed - March of 2011
} 10+ years of permitted
capacity
capacity
} Regulated monopoly for low-
level radioactive waste in 11
western states
level radioactive waste in 11
western states
} Market pricing for certain
naturally occurring radioactive
material
naturally occurring radioactive
material
} Generates strong cash flow,
limited growth potential
limited growth potential
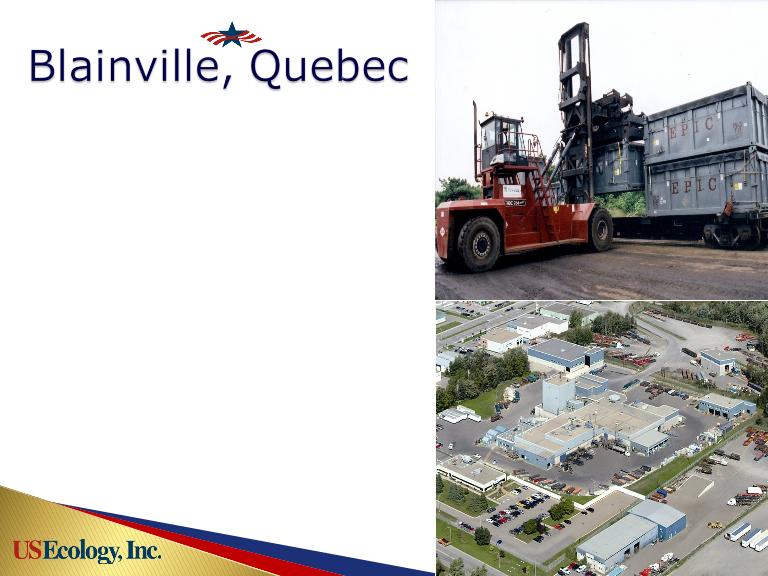
} Acquired October 2010
} Provides access to NE U.S.
and Canada markets
and Canada markets
} Superb natural conditions
for disposal
for disposal
} High proportion of Base
business
business
} State-of-the-art treatment
building and proprietary
process
building and proprietary
process
} Q1 net income increased 82%
◦ $3.3 million, $0.18 per share
◦ EPS includes ~$0.04 in foreign currency gains
◦ Compares to $1.8 million, $0.10 in Q1 2010
} Total revenue increased 75% (29% ex-Stablex)
◦ $34.1 million ($9.0 million provided by Stablex)
◦ Compares to $19.5 million in Q1 2010
◦ Average selling prices increased 2%
} Waste volumes disposed increased 67% (28% ex-Stablex)
◦ 199,000 tons vs. 119,000 tons
} Stablex integration continuing
◦ Slight negative impact to earnings with further integration activities
} Strong performance across U.S. Operations, notably:
◦ Gulf Coast Oil & Gas Markets - Thermal Recycling services
◦ Government business
◦ So. California industrial markets
14
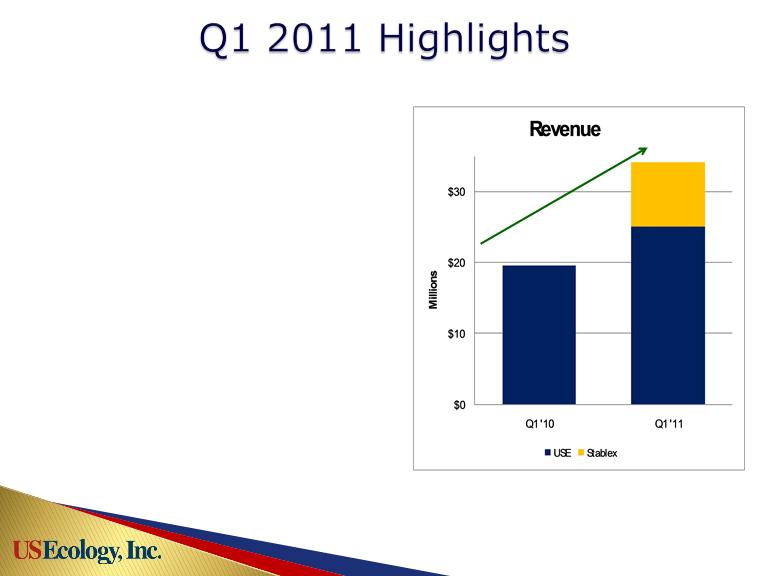
} Quarterly Revenue
◦ Total revenue up 75%; 29% increase
excluding Stablex
excluding Stablex
◦ Base business up 69% from Q1
2010, up 19% excluding Stablex
2010, up 19% excluding Stablex
◦ Event business up 48% from Q1
2010, 15% excluding Stablex
2010, 15% excluding Stablex
◦ Volumes up 67%; Up 28% without
Stablex
Stablex
◦ Average Selling price up 2%
15
*Includes transportation services
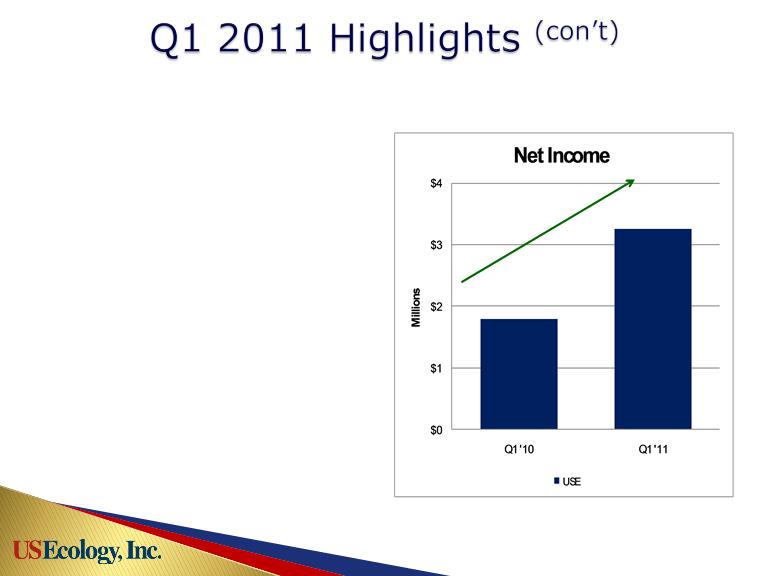
} Quarterly Earnings
◦ Operating earnings up 54%
◦ Net income up 82%
– Included $1.25 million gain on foreign
currency
currency
◦ Earnings per share up 80%
– Up 40% without foreign currency gain
16

} Commercial projects - optimistic 2011
} Recurring “Base Business” market - modest growth
and general improvement in industrial output
and general improvement in industrial output
} “Event Business” opportunities are increasing -
large clean-up opportunities exist
large clean-up opportunities exist
} Thermal markets are improving
17
General Market Trends
18

} Expect 2011 earnings from $0.75 to $0.85 per
share, excluding any FX gains/losses
share, excluding any FX gains/losses
◦ Growth of 9% to 23% over 2010 reported results of
$0.69 per share
$0.69 per share
◦ Expect 2nd half of 2011 to be stronger than 1st half in all
sectors
sectors
◦ Stablex expected to contribute to full year earnings
19
Business Outlook
} Industry leader with almost 1/3 of total disposal market
} Markets for our services are improving
} Unique and irreplaceable set of disposal assets with high
barriers to entry
barriers to entry
} High operating leverage creates significant earnings
upside as volumes increase
upside as volumes increase
} Return on invested capital: 11.9% ttm
} Attractive dividend yield of nearly 4.0%
} Acquisitions part of future growth strategy
20