Attached files
| file | filename |
|---|---|
| 8-K - 8-K - SOUTHERN FIRST BANCSHARES INC | d28224.htm |
EXHIBIT 99.1


During the course of this presentation, management may make projections and forward-looking statements regarding events or the future financial performance of Southern First Bancshares, Inc. We wish to caution you that these forward-looking statements involve certain risks and uncertainties, including a variety of factors (including a downturn in the economy, greater than expected non-interest expenses, increased competition, fluctuations in interest rates, regulatory actions, excessive loan losses and other factors) that may cause Southern First’s actual results to differ materially from the anticipated results expressed or implied in these forward-looking statements. Therefore, we can give no assurance that the results contemplated in the forward-looking statements will be realized. Investors are cautioned not to place undue reliance on these forward-looking statements and are advised to review the risk factors that may affect Southern First’s operating results in documents filed by Southern First Bancshares, Inc. with the Securities and Exchange Commission, including the annual report on Form 10-K and other required filings. Southern First assumes no duty to update the forward-looking statements made in this presentation.

|
|
|
|
|
|
|
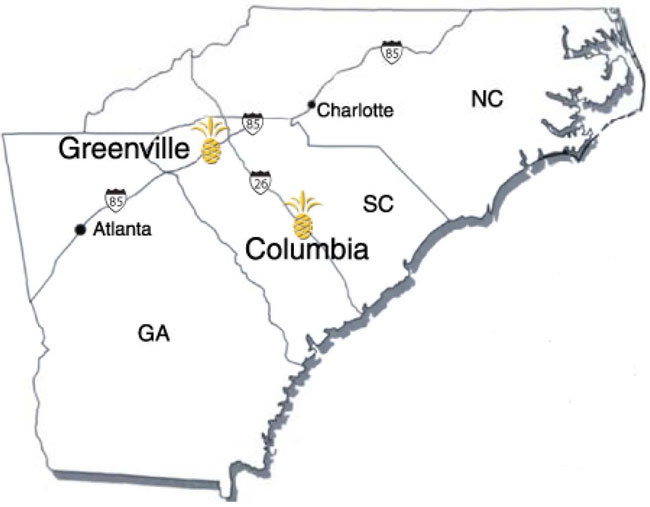
• Greenville First Bank opened in 2000 |
|
|
|
|
|
|
|
• $736 million in total assets (1) |
|
|
|
• 8th largest bank headquartered in SC |
|
|
|
•$564 million in total net loans |
|
|
|
•$536 million in total deposits |
|
|
|
|
|
|
|
• Greenville SC market – 4 offices |
|
|
|
• #6 market share out of 35 banks (2) |
|
|
|
|
|
|
|
• Columbia SC market – 2 offices |
|
|
|
•$118 million in total deposits (1) |
|
|
|
|
|
|
|
• SFST – 104 total employees |
|
(1) |
Year-end 2010 |
|
|
(2) |
June 2010 FDIC |
|

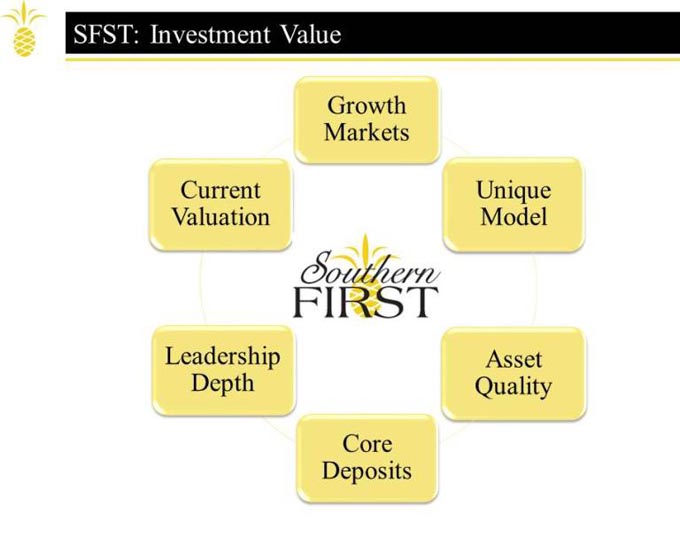
Southern First performance:
| - | exceeds peer banks | |
| - | earnings / asset quality / deposit growth |
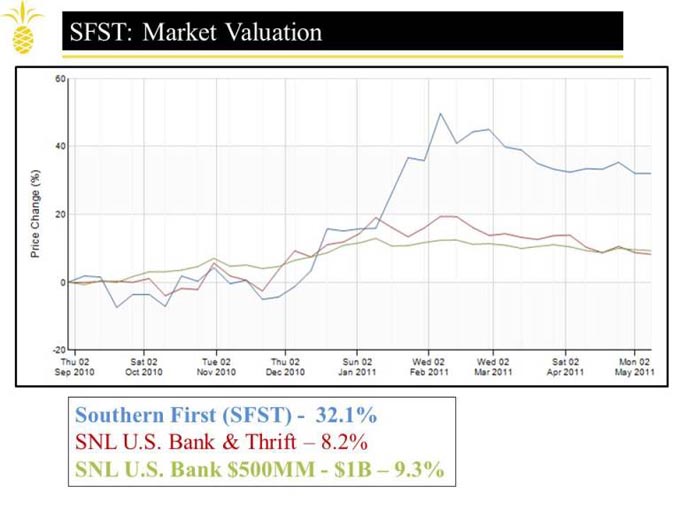
Southern First (SFST) - market valuation:
| - | stock trades near peer multiples | |
| - | trades at 60% of tangible book value |

| • | Generated pre-TARP earnings of $890 thousand | |
| • | Net interest margin continues to expand | |
| • | 4th quarter earnings increase 188% over prior year | |
| • | Spread and non-interest revenue are increasing |
| ($ Thousands) | 2010 | 2009 | % increase | |||||||
| Net interest income | $ | 20,212 | $ | 19,282 | 4.8 | % | ||||
| Non-interest income | $ | 2,371 | $ | 1,843 | 28.6 | % | ||||
| Total revenue | $ | 22,583 | $ | 21,125 | 6.9 | % | ||||
| Pre-tax / Pre-provision earnings (1) | $ | 6,693 | $ | 6,074 | 10.2 | % | ||||
(1) Pre-tax earnings + provision for loan losses

| 2010 | 2009 | ||||||
| Nonperforming loans / loans: | 1.63 | % | 2.04 | % | |||
| Nonperforming assets / assets: | 2.03 | % | 2.15 | % | |||
| Net charge-offs / loans: | .86 | % | .63 | % | |||
| 3 straight quarters of improving nonperforming loans | 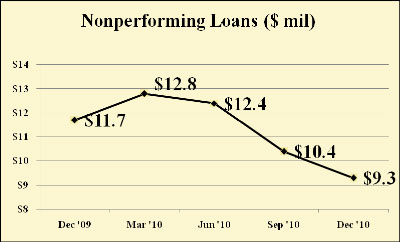 |

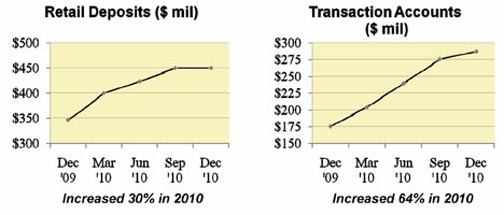
| • | $104 million in total retail deposit growth | |
| • | 30% increase in number of core transaction accounts | |
| • | $79 million in new client transaction accounts |

| Southern | All SC | SNL Banks | ||||||||
| 2010 year-end data | First | Banks | $500M - $1B | |||||||
| EARNINGS | ||||||||||
| Return on avg. assets | .12 | % | -.21 | % | .03 | % | ||||
| Return on avg. equity | 1.47 | % | -2.25 | % | .28 | % | ||||
| ASSET QUALITY | ||||||||||
| Net charge offs / loans | .86 | % | 2.05 | % | 1.37 | % | ||||
| Non performing assets / assets | 2.03 | % | 5.55 | % | 3.91 | % | ||||
| CAPITAL STRENGTH | ||||||||||
| Equity / Assets | 9.58 | % | 9.53 | % | 9.16 | % | ||||
| EFFICIENCY | ||||||||||
| Assets per employee | $ | 7.07 mil | $ 4.21 mil | |||||||

| • | Lower credit costs and nonperforming assets | |
| • | Preserve sound capital ratios | |
| • | Improve margin and generate earnings momentum | |
| • | Continue momentum in client growth and retail deposits | |
| • | Lower regulatory risk profile | |
| • | Create unforgettable client experiences | |
| • | Communicate the Southern First story |

| Q1 Results: | 2011 | 2010 | |||||
| Earnings : (before TARP expenses) | $ 537 thousand | $ 18 thousand | |||||
| Net interest margin: | 3.18 | % | 2.83 | % | |||
| Nonperforming assets / assets: | 1.95 | % | 2.21 | % | |||
| Net charge-offs / loans: | .51 | % | .86 | % | |||
| Retail deposit growth: | $ 36 million | $ 53 million | |||||
| Total risk based capital: | 13.35 | % | 13.10 | % | |||
| Allowance coverage of nonperforming loans: | 76.56 | % | 61.80 | % | |||
| Stock price / tangible book value: | 62 | % | 57 | % | |||

| Banking Landscape | ||
| • | Changing rapidly and permanently | |
| Strategic Focus | ||
| • | Create a distinguishing value for the client | |
| • | Intense focus on asset quality and risk management | |
| • | Build a talented team recognized for market experience, depth of risk management and ability to generate value | |
| • | Maintain a strong balance sheet | |
| • | Capitalize on efficient Client FIRST model | |
| • | Operate in great markets | |

| Growth Plan | ||
| • | Proven ability to grow organically | |
| • | Continue momentum in client growth and core deposits | |
| • | Banker acquisition / market disruption | |
| • | Strategic opportunities | |
| – Industry consolidation | ||
| Capital Plan | ||
| • | TARP repayment | |
| – Considering participation in the Small Business Lending Fund | ||
| – Timing / dilution of additional capital are critical factors | ||
| • | Strategic growth | |
| • | Earnings momentum / organic capital | |