Attached files
| file | filename |
|---|---|
| 8-K - FORM 8-K - ENDURANCE SPECIALTY HOLDINGS LTD | c17583e8vk.htm |
| EX-99.1 - EX-99.1 - ENDURANCE SPECIALTY HOLDINGS LTD | c17583exv99w1.htm |
Exhibit 99.2
| Boston Investor MeetingMay 19, 2011 Endurance Specialty Holdings Investor Presentation |
| Forward looking statements & regulation G disclaimer Safe Harbor for Forward Looking StatementsSome of the statements in this presentation include forward-looking statements which reflect our current views with respect to future events and financial performance. Such statements include forward-looking statements both with respect to us in general and the insurance and reinsurance sectors specifically, both as to underwriting and investment matters. Statements which include the words "expect," "intend," "plan," "believe," "project," "anticipate," "seek," "will," and similar statements of a future or forward-looking nature identify forward-looking statements in this presentation for purposes of the U.S. federal securities laws or otherwise. We intend these forward-looking statements to be covered by the safe harbor provisions for forward-looking statements in the Private Securities Litigation Reform Act of 1995.All forward-looking statements address matters that involve risks and uncertainties. Accordingly, there are or may be important factors that could cause actual results to differ from those indicated in the forward-looking statements. These factors include, but are not limited to, the effects of competitors' pricing policies, greater frequency or severity of claims and loss activity, changes in market conditions in the agriculture insurance industry, termination of or changes in the terms of the U.S. multiple peril crop insurance program, a decreased demand for property and casualty insurance or reinsurance, changes in the availability, cost or quality of reinsurance or retrocessional coverage, our inability to renew business previously underwritten or acquired, our inability to maintain our applicable financial strength ratings, our inability to effectively integrate acquired operations, uncertainties in our reserving process, changes to our tax status, changes in insurance regulations, reduced acceptance of our existing or new products and services, a loss of business from and credit risk related to our broker counterparties, assessments for high risk or otherwise uninsured individuals, possible terrorism or the outbreak of war, a loss of key personnel, political conditions, changes in insurance regulation, changes in accounting policies, our investment performance, the valuation of our invested assets, a breach of our investment guidelines, the unavailability of capital in the future, developments in the world's financial and capital markets and our access to such markets, government intervention in the insurance and reinsurance industry, illiquidity in the credit markets, changes in general economic conditions and other factors described in our most recently filed Annual Report on Form 10-K and Quarterly Report on Form 10-Q. Forward-looking statements speak only as of the date on which they are made, and we undertake no obligation publicly to update or revise any forward-looking statement, whether as a result of new information, future developments or otherwise.Regulation G DisclaimerIn presenting the Company's results, management has included and discussed certain non-GAAP measures. Management believes that these non-GAAP measures, which may be defined differently by other companies, better explain the Company's results of operations in a manner that allows for a more complete understanding of the underlying trends in the Company's business. However, these measures should not be viewed as a substitute for those determined in accordance with GAAP. For a complete description of non-GAAP measures and reconciliations, please review the Investor Financial Supplement on our web site at www.endurance.bm.The combined ratio is the sum of the loss, acquisition expense and general and administrative expense ratios. Endurance presents the combined ratio as a measure that is commonly recognized as a standard of performance by investors, analysts, rating agencies and other users of its financial information. The combined ratio, excluding prior year net loss reserve development, enables investors, analysts, rating agencies and other users of its financial information to more easily analyze Endurance's results of underwriting activities in a manner similar to how management analyzes Endurance's underlying business performance. The combined ratio, excluding prior year net loss reserve development, should not be viewed as a substitute for the combined ratio. Net premiums written is a non-GAAP internal performance measure used by Endurance in the management of its operations. Net premiums written represents net premiums written and deposit premiums, which are premiums on contracts that are deemed as either transferring only significant timing risk or transferring only significant underwriting risk and thus are required to be accounted for under GAAP as deposits. Endurance believes these amounts are significant to its business and underwriting process and excluding them distorts the analysis of its premium trends. In addition to presenting gross premiums written determined in accordance with GAAP, Endurance believes that net premiums written enables investors, analysts, rating agencies and other users of its financial information to more easily analyze Endurance's results of underwriting activities in a manner similar to how management analyzes Endurance's underlying business performance. Net premiums written should not be viewed as a substitute for gross premiums written determined in accordance with GAAP. Return on Average Equity (ROAE) is comprised using the average common equity calculated as the arithmetic average of the beginning and ending common equity balances for stated periods. Return on Beginning Equity (ROBE) is comprised using the beginning common equity for stated periods. The Company presents various measures of Return on Equity that are commonly recognized as a standard of performance by investors, analysts, rating agencies and other users of its financial information. 2 |
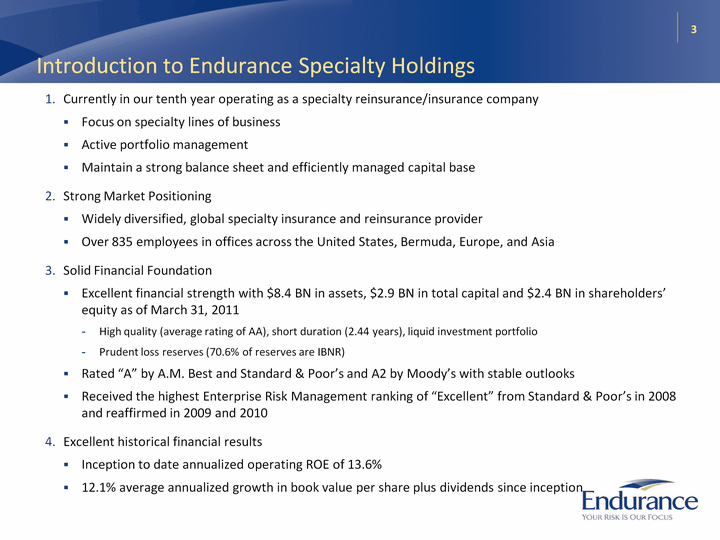
| Introduction to Endurance Specialty Holdings Currently in our tenth year operating as a specialty reinsurance/insurance companyFocus on specialty lines of businessActive portfolio managementMaintain a strong balance sheet and efficiently managed capital baseStrong Market PositioningWidely diversified, global specialty insurance and reinsurance provider Over 835 employees in offices across the United States, Bermuda, Europe, and AsiaSolid Financial FoundationExcellent financial strength with $8.4 BN in assets, $2.9 BN in total capital and $2.4 BN in shareholders' equity as of March 31, 2011High quality (average rating of AA), short duration (2.44 years), liquid investment portfolioPrudent loss reserves (70.6% of reserves are IBNR)Rated "A" by A.M. Best and Standard & Poor's and A2 by Moody's with stable outlooksReceived the highest Enterprise Risk Management ranking of "Excellent" from Standard & Poor's in 2008 and reaffirmed in 2009 and 2010Excellent historical financial resultsInception to date annualized operating ROE of 13.6%12.1% average annualized growth in book value per share plus dividends since inception 3 |
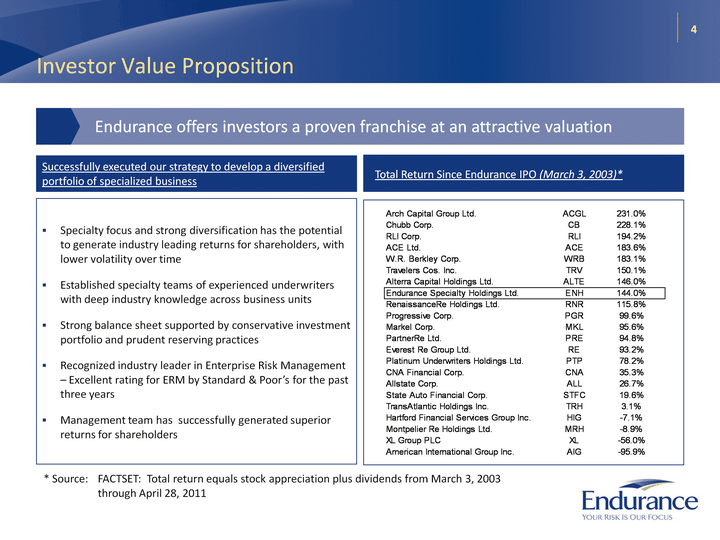
| 4 Investor Value Proposition Specialty focus and strong diversification has the potential to generate industry leading returns for shareholders, with lower volatility over timeEstablished specialty teams of experienced underwriters with deep industry knowledge across business unitsStrong balance sheet supported by conservative investment portfolio and prudent reserving practicesRecognized industry leader in Enterprise Risk Management - Excellent rating for ERM by Standard & Poor's for the past three yearsManagement team has successfully generated superior returns for shareholders Successfully executed our strategy to develop a diversified portfolio of specialized business Total Return Since Endurance IPO (March 3, 2003)* Endurance offers investors a proven franchise at an attractive valuation * Source: FACTSET: Total return equals stock appreciation plus dividends from March 3, 2003 through April 28, 2011 |
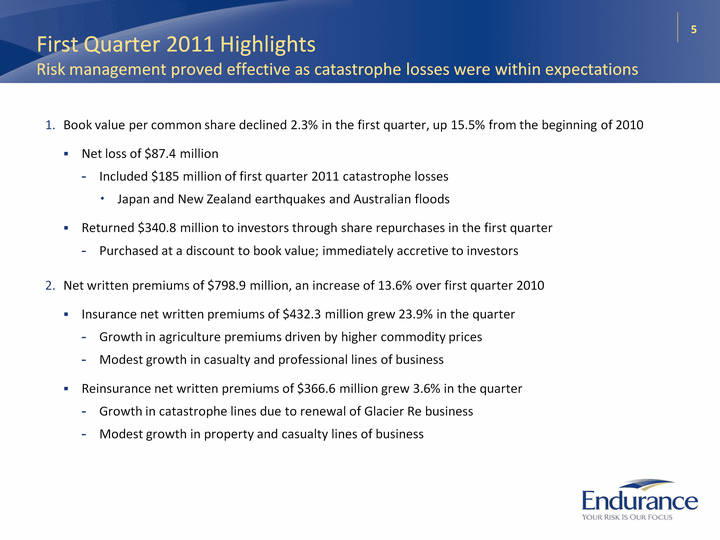
| First Quarter 2011 Highlights Risk management proved effective as catastrophe losses were within expectations Book value per common share declined 2.3% in the first quarter, up 15.5% from the beginning of 2010 Net loss of $87.4 million Included $185 million of first quarter 2011 catastrophe lossesJapan and New Zealand earthquakes and Australian floodsReturned $340.8 million to investors through share repurchases in the first quarterPurchased at a discount to book value; immediately accretive to investorsNet written premiums of $798.9 million, an increase of 13.6% over first quarter 2010Insurance net written premiums of $432.3 million grew 23.9% in the quarterGrowth in agriculture premiums driven by higher commodity pricesModest growth in casualty and professional lines of businessReinsurance net written premiums of $366.6 million grew 3.6% in the quarterGrowth in catastrophe lines due to renewal of Glacier Re businessModest growth in property and casualty lines of business 5 |
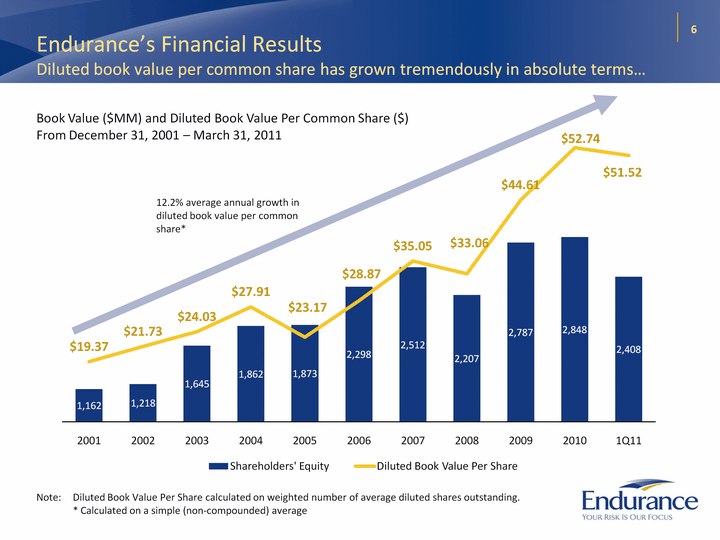
| 6 Endurance's Financial Results Diluted book value per common share has grown tremendously in absolute terms... Book Value ($MM) and Diluted Book Value Per Common Share ($)From December 31, 2001 - March 31, 2011 (CHART) Note: Diluted Book Value Per Share calculated on weighted number of average diluted shares outstanding. * Calculated on a simple (non-compounded) average 12.2% average annual growth in diluted book value per common share* |
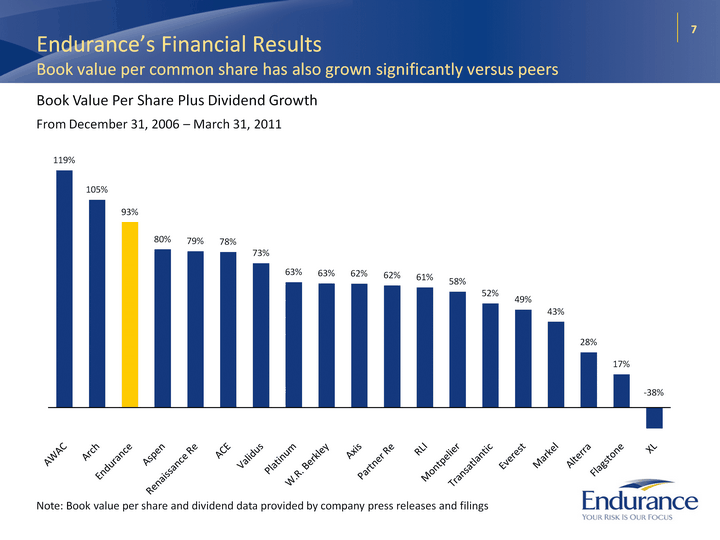
| Endurance's Financial Results Book value per common share has also grown significantly versus peers 7 Book Value Per Share Plus Dividend GrowthFrom December 31, 2006 - March 31, 2011 (CHART) Note: Book value per share and dividend data provided by company press releases and filings |
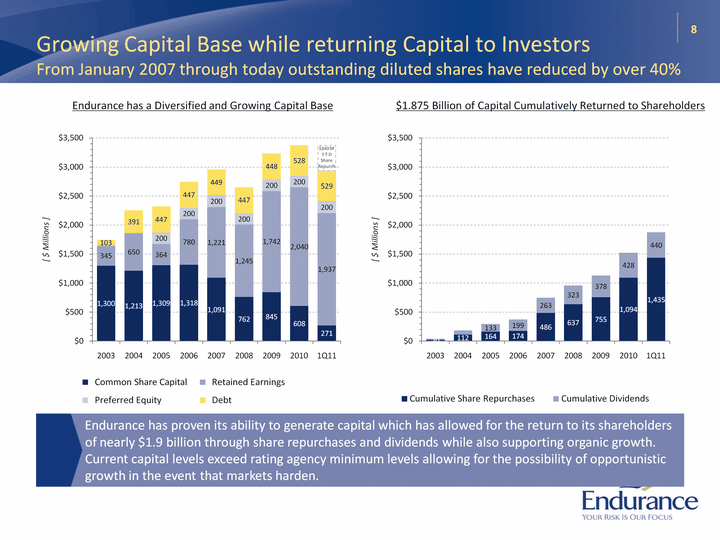
| Growing Capital Base while returning Capital to Investors From January 2007 through today outstanding diluted shares have reduced by over 40% Endurance has a Diversified and Growing Capital Base Endurance has a Diversified and Growing Capital Base $1.875 Billion of Capital Cumulatively Returned to Shareholders 8 Endurance has proven its ability to generate capital which has allowed for the return to its shareholders of nearly $1.9 billion through share repurchases and dividends while also supporting organic growth. Current capital levels exceed rating agency minimum levels allowing for the possibility of opportunistic growth in the event that markets harden. |
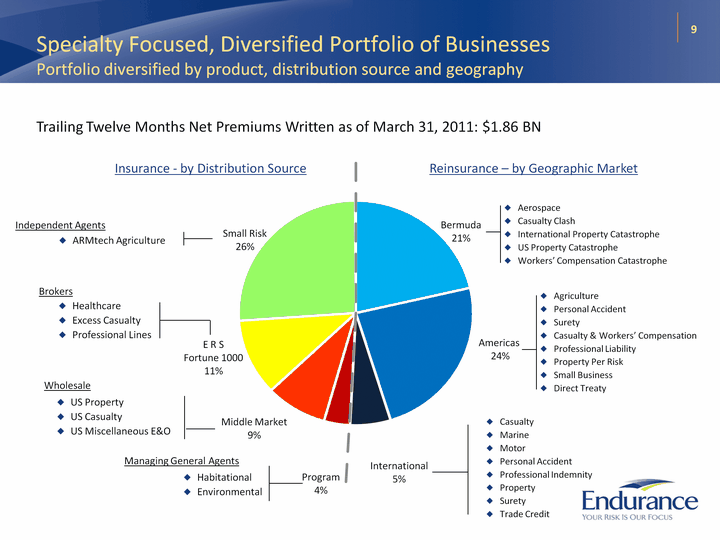
| 9 Specialty Focused, Diversified Portfolio of Businesses Portfolio diversified by product, distribution source and geography Trailing Twelve Months Net Premiums Written as of March 31, 2011: $1.86 BN Reinsurance - by Geographic Market Insurance - by Distribution Source AgriculturePersonal AccidentSuretyCasualty & Workers' CompensationProfessional LiabilityProperty Per RiskSmall BusinessDirect Treaty AerospaceCasualty ClashInternational Property CatastropheUS Property CatastropheWorkers' Compensation Catastrophe ARMtech Agriculture US PropertyUS CasualtyUS Miscellaneous E&O HealthcareExcess CasualtyProfessional Lines HabitationalEnvironmental International5% E R SFortune 100011% Middle Market9% Bermuda21% Americas 24% Program4% CasualtyMarineMotorPersonal AccidentProfessional IndemnityPropertySuretyTrade Credit Small Risk26% Independent Agents Brokers Wholesale Managing General Agents |
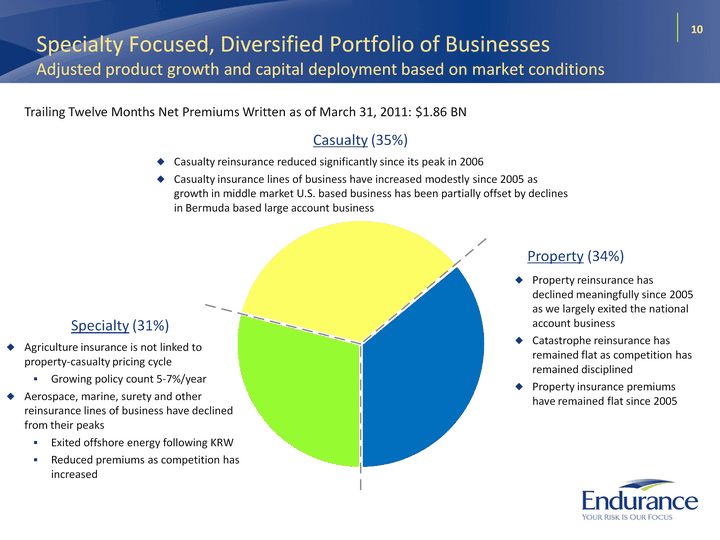
| 10 Specialty Focused, Diversified Portfolio of Businesses Adjusted product growth and capital deployment based on market conditions Trailing Twelve Months Net Premiums Written as of March 31, 2011: $1.86 BN Property (34%) Casualty (35%) Property reinsurance has declined meaningfully since 2005 as we largely exited the national account businessCatastrophe reinsurance has remained flat as competition has remained disciplinedProperty insurance premiums have remained flat since 2005 Agriculture insurance is not linked to property-casualty pricing cycleGrowing policy count 5-7%/yearAerospace, marine, surety and other reinsurance lines of business have declined from their peaksExited offshore energy following KRWReduced premiums as competition has increased Specialty (31%) Casualty reinsurance reduced significantly since its peak in 2006Casualty insurance lines of business have increased modestly since 2005 as growth in middle market U.S. based business has been partially offset by declines in Bermuda based large account business |
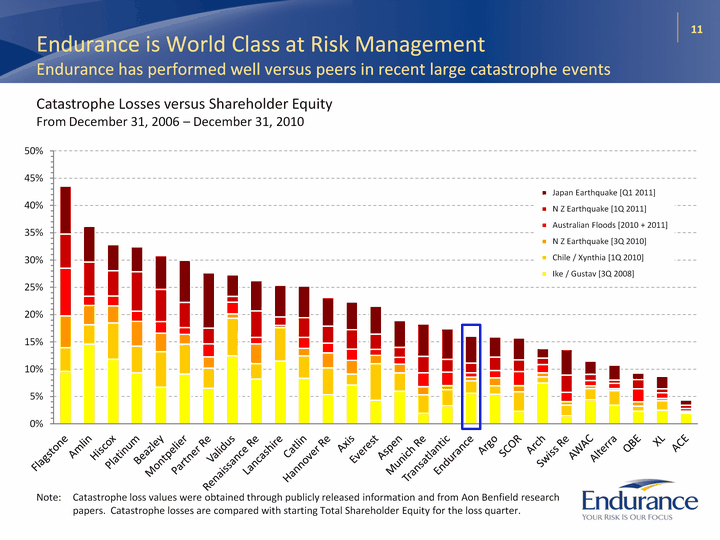
| Endurance is World Class at Risk Management Endurance has performed well versus peers in recent large catastrophe events 11 Catastrophe Losses versus Shareholder EquityFrom December 31, 2006 - December 31, 2010 (CHART) Note: Catastrophe loss values were obtained through publicly released information and from Aon Benfield research papers. Catastrophe losses are compared with starting Total Shareholder Equity for the loss quarter. |
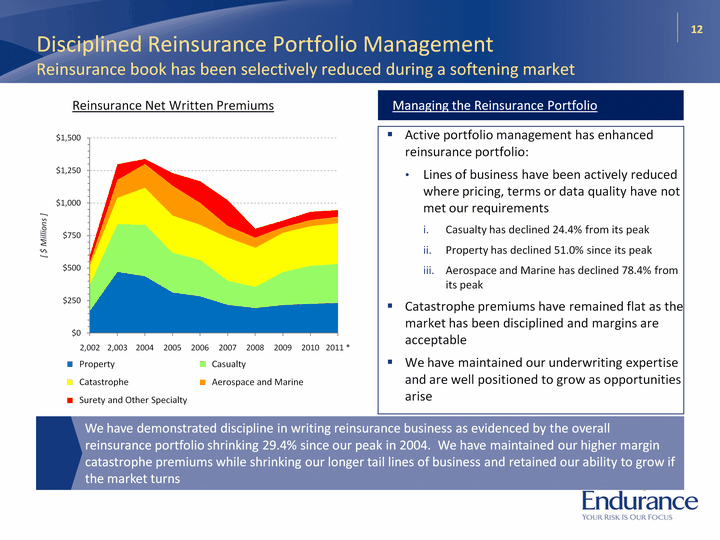
| Disciplined Reinsurance Portfolio Management Reinsurance book has been selectively reduced during a softening market Reinsurance Net Written Premiums Reinsurance Net Written Premiums Managing the Reinsurance Portfolio 12 We have demonstrated discipline in writing reinsurance business as evidenced by the overall reinsurance portfolio shrinking 29.4% since our peak in 2004. We have maintained our higher margin catastrophe premiums while shrinking our longer tail lines of business and retained our ability to grow if the market turns Active portfolio management has enhanced reinsurance portfolio:Lines of business have been actively reduced where pricing, terms or data quality have not met our requirementsCasualty has declined 24.4% from its peakProperty has declined 51.0% since its peakAerospace and Marine has declined 78.4% from its peakCatastrophe premiums have remained flat as the market has been disciplined and margins are acceptableWe have maintained our underwriting expertise and are well positioned to grow as opportunities arise |
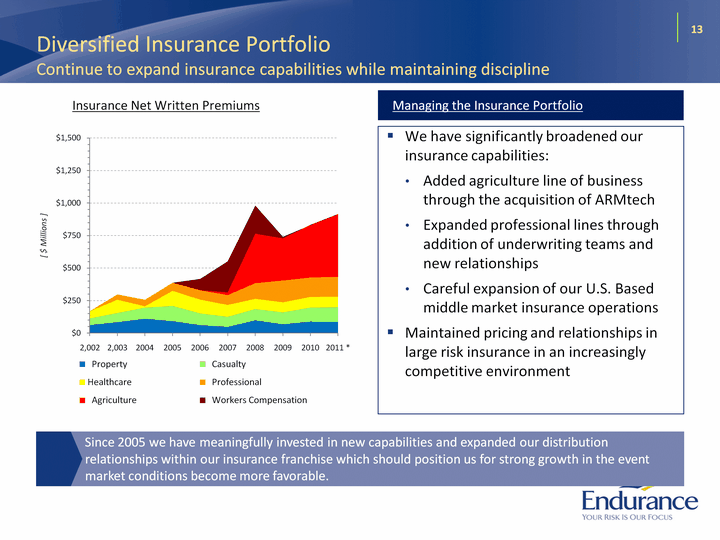
| Diversified Insurance Portfolio Continue to expand insurance capabilities while maintaining discipline Insurance Net Written Premiums Insurance Net Written Premiums Managing the Insurance Portfolio 13 Since 2005 we have meaningfully invested in new capabilities and expanded our distribution relationships within our insurance franchise which should position us for strong growth in the event market conditions become more favorable. We have significantly broadened our insurance capabilities:Added agriculture line of business through the acquisition of ARMtech Expanded professional lines through addition of underwriting teams and new relationshipsCareful expansion of our U.S. Based middle market insurance operationsMaintained pricing and relationships in large risk insurance in an increasingly competitive environment |
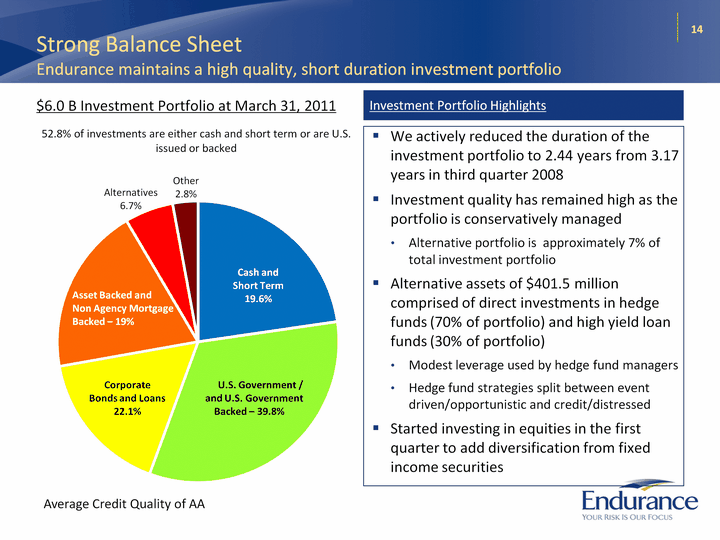
| Strong Balance Sheet Endurance maintains a high quality, short duration investment portfolio $6.0 B Investment Portfolio at March 31, 2011 52.8% of investments are either cash and short term or are U.S. issued or backed Investment Portfolio Highlights We actively reduced the duration of the investment portfolio to 2.44 years from 3.17 years in third quarter 2008Investment quality has remained high as the portfolio is conservatively managed Alternative portfolio is approximately 7% of total investment portfolioAlternative assets of $401.5 million comprised of direct investments in hedge funds (70% of portfolio) and high yield loan funds (30% of portfolio)Modest leverage used by hedge fund managersHedge fund strategies split between event driven/opportunistic and credit/distressedStarted investing in equities in the first quarter to add diversification from fixed income securities 14 Cash andShort Term19.6% U.S. Government /and U.S. GovernmentBacked - 39.8% Other2.8% Alternatives6.7% Asset Backed andNon Agency MortgageBacked - 19% CorporateBonds and Loans22.1% Average Credit Quality of AA |
| Conclusion Endurance is a compelling investment opportunity Strategically managing our business through the soft marketSelectively reduced reinsurance premiums, especially in competitive longer tail linesInvested in agriculture insurance business which is not linked to the property-casualty market cycleAccounts for 26% of net premiums writtenActive capital deployment to return excess capital to shareholdersReduced diluted shares outstanding by over 40% since 1/1/2007Maintain a short duration, highly liquid investment portfolioPositioned to reduce potential impact of rising interest ratesExcellent balance sheet strength and liquidityHigh quality short duration investment portfolio; fixed maturity investments have an average credit quality of AAPrudent reserving philosophy and strong reserve position; strong history of favorable developmentIndustry leading Enterprise Risk ManagementCapital levels well in excess of rating agency minimums provide flexibility to grow in potentially hardening marketsThe outlook for Endurance's key areas of specialization remain attractiveAgriculture business provides diversification from the property-casualty marketsCatastrophe lines have remained disciplined and profitable and markets appear to be hardeningEndurance is currently trading at a discount to book, despite strong absolute and relative performance and strong market positioning 15 |

| Appendix |
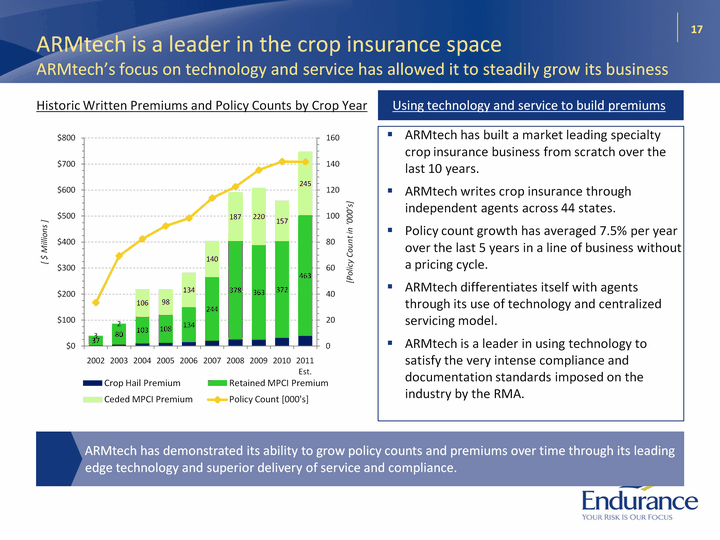
| ARMtech is a leader in the crop insurance space ARMtech's focus on technology and service has allowed it to steadily grow its business Historic Written Premiums and Policy Counts by Crop Year Historic Written Premiums and Policy Counts by Crop Year Using technology and service to build premiums 17 ARMtech has demonstrated its ability to grow policy counts and premiums over time through its leading edge technology and superior delivery of service and compliance. ARMtech has built a market leading specialty crop insurance business from scratch over the last 10 years.ARMtech writes crop insurance through independent agents across 44 states.Policy count growth has averaged 7.5% per year over the last 5 years in a line of business without a pricing cycle. ARMtech differentiates itself with agents through its use of technology and centralized servicing model. ARMtech is a leader in using technology to satisfy the very intense compliance and documentation standards imposed on the industry by the RMA. |
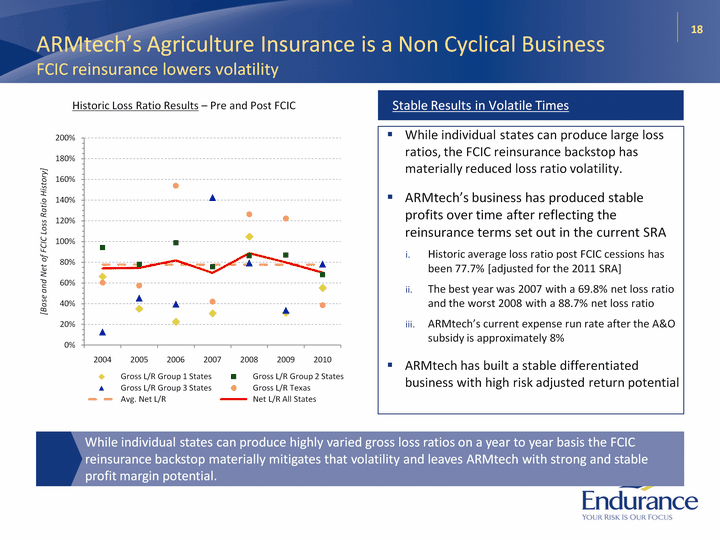
| ARMtech's Agriculture Insurance is a Non Cyclical Business FCIC reinsurance lowers volatility Historic Loss Ratio Results - Pre and Post FCIC Historic Loss Ratio Results - Pre and Post FCIC Stable Results in Volatile Times 18 While individual states can produce highly varied gross loss ratios on a year to year basis the FCIC reinsurance backstop materially mitigates that volatility and leaves ARMtech with strong and stable profit margin potential. While individual states can produce large loss ratios, the FCIC reinsurance backstop has materially reduced loss ratio volatility.ARMtech's business has produced stable profits over time after reflecting the reinsurance terms set out in the current SRAHistoric average loss ratio post FCIC cessions has been 77.7% [adjusted for the 2011 SRA]The best year was 2007 with a 69.8% net loss ratio and the worst 2008 with a 88.7% net loss ratioARMtech's current expense run rate after the A&O subsidy is approximately 8%ARMtech has built a stable differentiated business with high risk adjusted return potential |
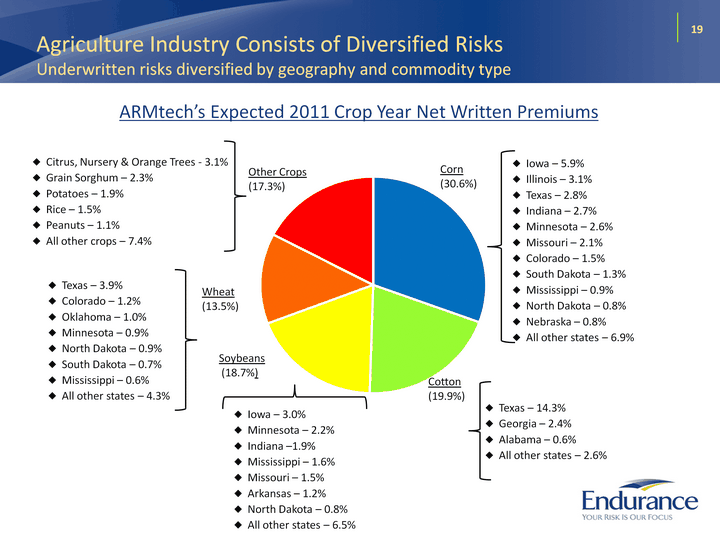
| 19 Agriculture Industry Consists of Diversified Risks Underwritten risks diversified by geography and commodity type ARMtech's Expected 2011 Crop Year Net Written Premiums Iowa - 5.9%Illinois - 3.1%Texas - 2.8%Indiana - 2.7%Minnesota - 2.6%Missouri - 2.1%Colorado - 1.5%South Dakota - 1.3%Mississippi - 0.9%North Dakota - 0.8%Nebraska - 0.8%All other states - 6.9% Corn(30.6%) Texas - 14.3%Georgia - 2.4%Alabama - 0.6%All other states - 2.6% Cotton (19.9%) Iowa - 3.0%Minnesota - 2.2%Indiana -1.9%Mississippi - 1.6%Missouri - 1.5%Arkansas - 1.2%North Dakota - 0.8%All other states - 6.5% Soybeans (18.7%) Other Crops (17.3%) Wheat (13.5%) Texas - 3.9%Colorado - 1.2%Oklahoma - 1.0%Minnesota - 0.9%North Dakota - 0.9%South Dakota - 0.7%Mississippi - 0.6%All other states - 4.3% Citrus, Nursery & Orange Trees - 3.1%Grain Sorghum - 2.3%Potatoes - 1.9%Rice - 1.5%Peanuts - 1.1%All other crops - 7.4% |
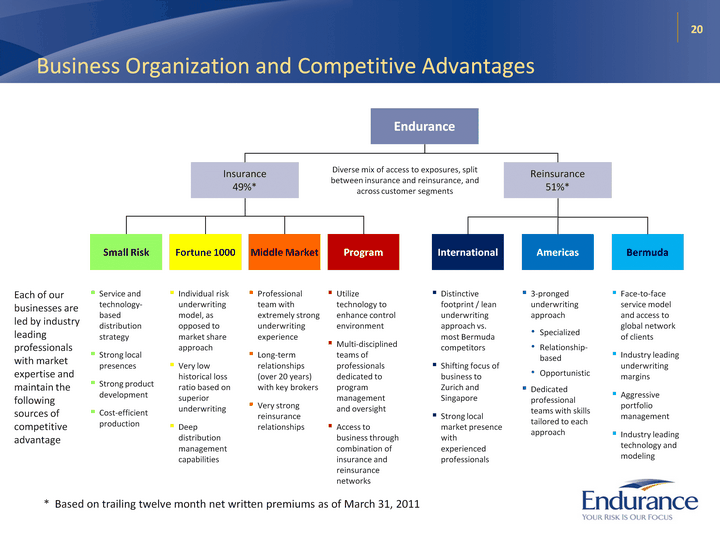
| 20 Business Organization and Competitive Advantages Each of our businesses are led by industry leading professionals with market expertise and maintain the following sources of competitive advantage Endurance Insurance49%* Fortune 1000 Small Risk Program Americas International Middle Market Bermuda Reinsurance51%* Diverse mix of access to exposures, split between insurance and reinsurance, and across customer segments Service and technology- based distribution strategyStrong local presencesStrong product developmentCost-efficient production Individual risk underwriting model, as opposed to market share approachVery low historical loss ratio based on superior underwritingDeep distribution management capabilities Professional team with extremely strong underwriting experienceLong-term relationships (over 20 years) with key brokersVery strong reinsurance relationships Utilize technology to enhance control environmentMulti-disciplined teams of professionals dedicated to program management and oversightAccess to business through combination of insurance and reinsurance networks Distinctive footprint / lean underwriting approach vs. most Bermuda competitorsShifting focus of business to Zurich and SingaporeStrong local market presence with experienced professionals 3-pronged underwriting approachSpecializedRelationship- basedOpportunisticDedicated professional teams with skills tailored to each approach Face-to-face service model and access to global network of clientsIndustry leading underwriting marginsAggressive portfolio managementIndustry leading technology and modeling * Based on trailing twelve month net written premiums as of March 31, 2011 |
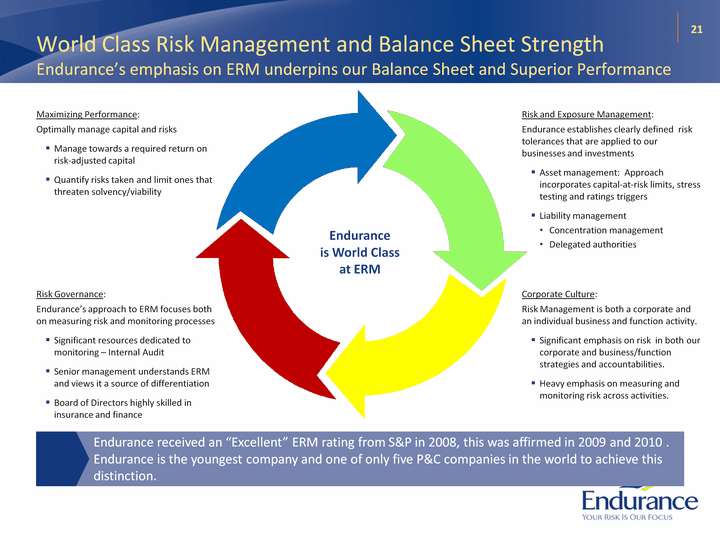
| 21 World Class Risk Management and Balance Sheet Strength Endurance's emphasis on ERM underpins our Balance Sheet and Superior Performance Enduranceis World Classat ERM Risk and Exposure Management:Endurance establishes clearly defined risk tolerances that are applied to our businesses and investmentsAsset management: Approach incorporates capital-at-risk limits, stress testing and ratings triggersLiability managementConcentration managementDelegated authorities Corporate Culture:Risk Management is both a corporate and an individual business and function activity.Significant emphasis on risk in both our corporate and business/function strategies and accountabilities.Heavy emphasis on measuring and monitoring risk across activities. Risk Governance:Endurance's approach to ERM focuses both on measuring risk and monitoring processesSignificant resources dedicated to monitoring - Internal AuditSenior management understands ERM and views it a source of differentiation Board of Directors highly skilled in insurance and finance Maximizing Performance:Optimally manage capital and risksManage towards a required return on risk-adjusted capital Quantify risks taken and limit ones that threaten solvency/viability Endurance received an "Excellent" ERM rating from S&P in 2008, this was affirmed in 2009 and 2010 . Endurance is the youngest company and one of only five P&C companies in the world to achieve this distinction. |
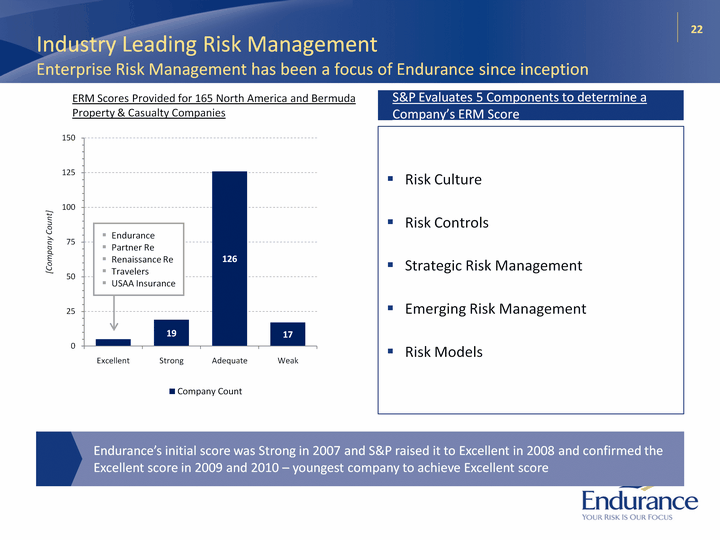
| Industry Leading Risk Management Enterprise Risk Management has been a focus of Endurance since inception ERM Scores Provided for 165 North America and Bermuda Property & Casualty Companies Property & Casualty Companies Property & Casualty Companies S&P Evaluates 5 Components to determine aCompany's ERM Score 22 Endurance's initial score was Strong in 2007 and S&P raised it to Excellent in 2008 and confirmed the Excellent score in 2009 and 2010 - youngest company to achieve Excellent score Risk CultureRisk ControlsStrategic Risk ManagementEmerging Risk ManagementRisk Models EndurancePartner ReRenaissance ReTravelersUSAA Insurance |
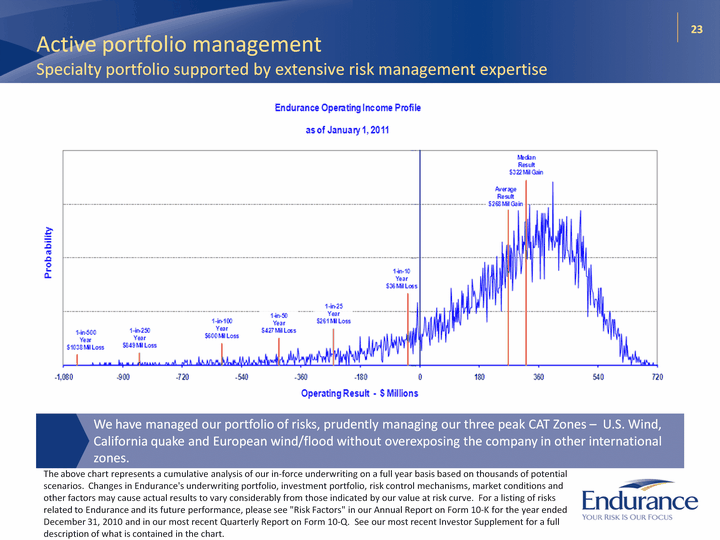
| 23 Active portfolio management Specialty portfolio supported by extensive risk management expertise We have managed our portfolio of risks, prudently managing our three peak CAT Zones - U.S. Wind, California quake and European wind/flood without overexposing the company in other international zones. The above chart represents a cumulative analysis of our in-force underwriting on a full year basis based on thousands of potential scenarios. Changes in Endurance's underwriting portfolio, investment portfolio, risk control mechanisms, market conditions and other factors may cause actual results to vary considerably from those indicated by our value at risk curve. For a listing of risks related to Endurance and its future performance, please see "Risk Factors" in our Annual Report on Form 10-K for the year ended December 31, 2010 and in our most recent Quarterly Report on Form 10-Q. See our most recent Investor Supplement for a full description of what is contained in the chart. |
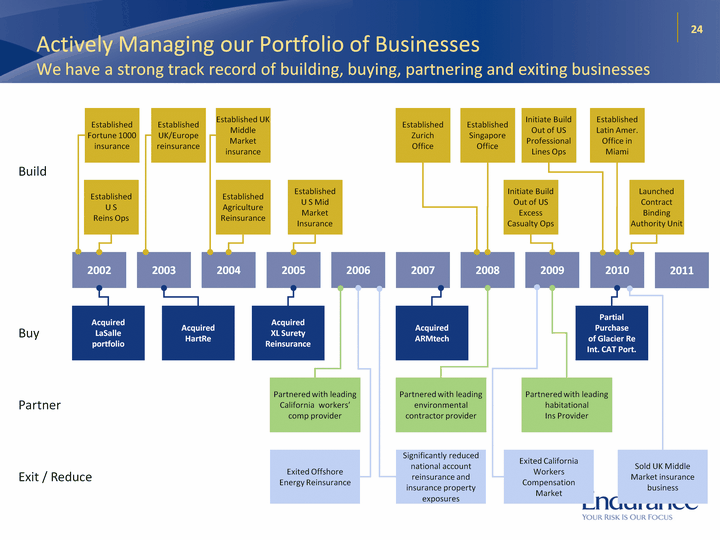
| 2011 2008 2006 2002 2003 2004 2005 2007 2009 2010 24 Actively Managing our Portfolio of Businesses We have a strong track record of building, buying, partnering and exiting businesses Buy Build Partner AcquiredLaSalleportfolio AcquiredHartRe Acquired ARMtech Partnered with leading California workers' comp provider AcquiredXL Surety Reinsurance EstablishedU SReins Ops Established UK/Europe reinsurance Established Fortune 1000 insurance Established UK Middle Market insurance EstablishedU S Mid MarketInsurance Established Agriculture Reinsurance Partnered with leading environmental contractor provider Partnered with leading habitationalIns Provider Established Singapore Office Established ZurichOffice Partial Purchaseof Glacier ReInt. CAT Port. Initiate Build Out of US Excess Casualty Ops Initiate Build Out of US Professional Lines Ops Established Latin Amer. Office in Miami Launched Contract Binding Authority Unit Exit / Reduce Exited Offshore Energy Reinsurance Significantly reduced national account reinsurance and insurance property exposures Exited California Workers CompensationMarket Sold UK Middle Market insurance business |
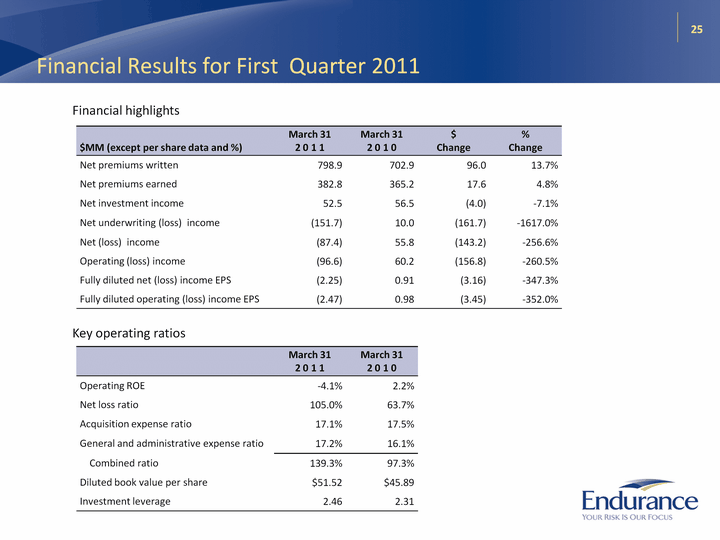
| 25 Financial Results for First Quarter 2011 $MM (except per share data and %) March 31 2 0 1 1 March 312 0 1 0 $Change %Change Net premiums written 798.9 702.9 96.0 13.7% Net premiums earned 382.8 365.2 17.6 4.8% Net investment income 52.5 56.5 (4.0) -7.1% Net underwriting (loss) income (151.7) 10.0 (161.7) -1617.0% Net (loss) income (87.4) 55.8 (143.2) -256.6% Operating (loss) income (96.6) 60.2 (156.8) -260.5% Fully diluted net (loss) income EPS (2.25) 0.91 (3.16) -347.3% Fully diluted operating (loss) income EPS (2.47) 0.98 (3.45) -352.0% Financial highlights March 312 0 1 1 March 312 0 1 0 Operating ROE -4.1% 2.2% Net loss ratio 105.0% 63.7% Acquisition expense ratio 17.1% 17.5% General and administrative expense ratio 17.2% 16.1% Combined ratio 139.3% 97.3% Diluted book value per share $51.52 $45.89 Investment leverage 2.46 2.31 Key operating ratios |
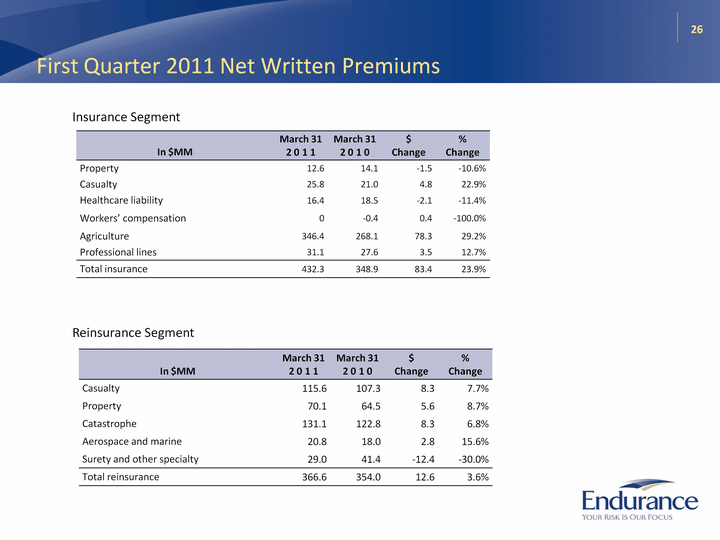
| 26 First Quarter 2011 Net Written Premiums In $MM March 312 0 1 1 March 312 0 1 0 $Change %Change Property 12.6 14.1 -1.5 -10.6% Casualty 25.8 21.0 4.8 22.9% Healthcare liability 16.4 18.5 -2.1 -11.4% Workers' compensation 0 -0.4 0.4 -100.0% Agriculture 346.4 268.1 78.3 29.2% Professional lines 31.1 27.6 3.5 12.7% Total insurance 432.3 348.9 83.4 23.9% Insurance Segment In $MM March 312 0 1 1 March 312 0 1 0 $Change %Change Casualty 115.6 107.3 8.3 7.7% Property 70.1 64.5 5.6 8.7% Catastrophe 131.1 122.8 8.3 6.8% Aerospace and marine 20.8 18.0 2.8 15.6% Surety and other specialty 29.0 41.4 -12.4 -30.0% Total reinsurance 366.6 354.0 12.6 3.6% Reinsurance Segment |
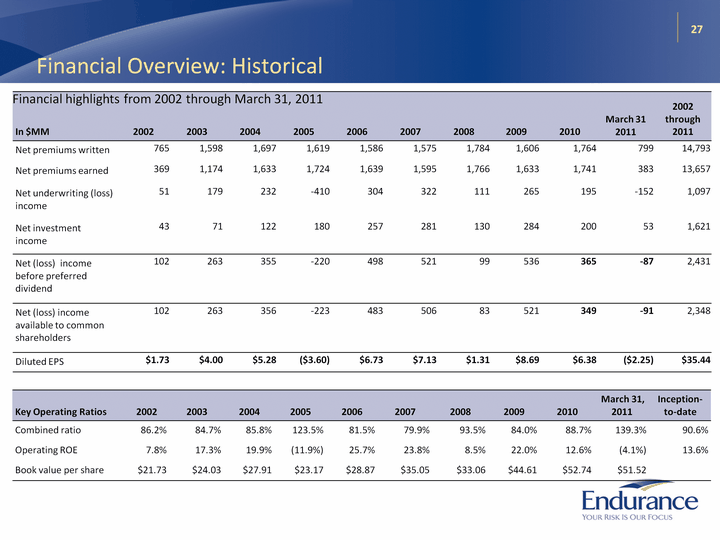
| 27 Financial Overview: Historical In $MM 2002 2003 2004 2005 2006 2007 2008 2009 2010 March 31 2011 2002 through 2011 Net premiums written 765 1,598 1,697 1,619 1,586 1,575 1,784 1,606 1,764 799 14,793 Net premiums earned 369 1,174 1,633 1,724 1,639 1,595 1,766 1,633 1,741 383 13,657 Net underwriting (loss) income 51 179 232 -410 304 322 111 265 195 -152 1,097 Net investment income 43 71 122 180 257 281 130 284 200 53 1,621 Net (loss) income before preferred dividend 102 263 355 -220 498 521 99 536 365 -87 2,431 Net (loss) income available to common shareholders 102 263 356 -223 483 506 83 521 349 -91 2,348 Diluted EPS $1.73 $4.00 $5.28 ($3.60) $6.73 $7.13 $1.31 $8.69 $6.38 ($2.25) $35.44 Financial highlights from 2002 through March 31, 2011 Key Operating Ratios 2002 2003 2004 2005 2006 2007 2008 2009 2010 March 31, 2011 Inception-to-date Combined ratio 86.2% 84.7% 85.8% 123.5% 81.5% 79.9% 93.5% 84.0% 88.7% 139.3% 90.6% Operating ROE 7.8% 17.3% 19.9% (11.9%) 25.7% 23.8% 8.5% 22.0% 12.6% (4.1%) 13.6% Book value per share $21.73 $24.03 $27.91 $23.17 $28.87 $35.05 $33.06 $44.61 $52.74 $51.52 |