Attached files
| file | filename |
|---|---|
| 8-K - 8-K - CF Industries Holdings, Inc. | a11-12662_18k.htm |
Exhibit 99.1
|
|
Corporate Development Supply Chain Sales Finance Legal Operations Human Resources Dv Sc Sa Fi Le Op Hr CF Industries NYSE: CF BMO 2011 Farm to Market Conference May 18, 2011 |
|
|
Steve Wilson Chairman, President, and Chief Executive Officer |
|
|
Certain statements contained in this communication may constitute "forward-looking statements." All statements in this communication, other than those relating to historical information or current condition, are forward-looking statements. These forward-looking statements are subject to a number of risks and uncertainties, many of which are beyond our control, which could cause actual results to differ materially from such statements. Important factors that could cause actual results to differ materially from our expectations include, among others: the volatile cost of natural gas in the areas where our production facilities are principally located; the cyclical nature of our business and the agricultural sector; the global commodity nature of our fertilizer products, the impact of global supply and demand on our selling prices, and the intense global competition in the consolidating markets in which we operate; conditions in the U.S. agricultural industry; reliance on third party transportation providers; our ability to integrate the Terra businesses promptly and effectively and to achieve the cost savings and synergies we anticipate from the acquisition within the expected time frame or at all, the potential for disruption from the acquisition to make it more difficult for us to maintain relationships with customers, employees or suppliers, and the impact of system integration efforts, including the implementation of a new enterprise resource planning (ERP) system; weather conditions; risks associated with expansion of our business, including unanticipated adverse consequences and the significant resources that could be required; potential liabilities and expenditures related to environmental and health and safety laws and regulations; our potential inability to obtain or maintain required permits and governmental approvals or to meet financial assurance requirements; future regulatory restrictions and requirements related to greenhouse gas emissions and climate change; our inability to predict seasonal demand for our products accurately; the impact of changing market conditions on our forward sales programs; risks involving derivatives and the effectiveness of our risk measurement and hedging activities; the reliance of our operations on a limited number of key facilities and the significant risks and hazards against which we may not be fully insured; risks associated with joint ventures; acts of terrorism and regulations to combat terrorism; difficulties in securing the supply and delivery of raw materials we use and increases in their costs; risks associated with international operations; the concentration of our sales with certain large customers; losses on our investments in securities; deterioration of global market and economic conditions; our substantial indebtedness and the limitations on our operations imposed by the terms of our indebtedness; our ability to comply with the covenants under our indebtedness and to make payments under such indebtedness when due; potential inability to refinance our indebtedness in connection with any change of control affecting us; and loss of key members of management and professional staff. Forward-looking statements are given only as of the date of this release and we disclaim any obligation to update or revise the forward-looking statements, whether as a result of new information, future events or otherwise, except as required by law. Safe Harbor Statement |
|
|
Record Profits and Cash Flow Any-quarter record First quarter record 2006 2007 2008 2009 2010 2011 Earnings per Share Operating Cash Flow (millions) |
|
|
Company Overview North America’s largest producer of nitrogen fertilizer and #2 in the world Third largest producer of phosphate fertilizer among public companies 80% Nitrogen 20% Phosphate Based on 2010 consolidated sales Segment Mix |
|
|
Nitrogen Segment Sales Volume (000 st) North America’s leading producer of all four primary nitrogen products World’s leading producer of UAN Segment size doubled with acquisition of Terra Industries in April 2010 6.5 million nutrient tons annual nitrogen capacity (converted to 14.0 million product tons) Seven nitrogen production complexes in North America, plus three 50%-owned joint venture plants in Trinidad and the U.K. Extensive transportation and storage capability supporting highly seasonal agriculture business 2008 2009 2010 2011 Terra acquisition |
|
|
Nitrogen Segment Results Source: Green Markets 2009 2010 2011 In millions, except as noted 2011 Q1 H/(L) 2010 Q1 H/(L) 2010 Q4 Sales $ 926 $ 599 $ (77) Gross margin 443 345 22 - Percent 48% 18 pts 6 pts Volume (000 st) 2,841 1,643 (509) Average selling prices ($/st) - Ammonia $ 494 $ 173 $ 42 - Urea 371 65 48 - UAN 277 72 71 - AN 251 n/a 40 Gas cost $/MMBtu $ 4.32 $ (0.81) $ 0.03 Ammonia Urea UAN-32 Mid-Cornbelt Prices |
|
|
Low Gas Prices Despite Strong Demand Storage inventories reached a new record high in November, exceeding the five year average by nearly 400 BCF Winter 2010/2011 was the coldest in a decade, which boosted heating demand and erased nearly all of the surplus storage compared to the five year average Despite strong winter withdrawals, spot prices remain in the mid-$4 range due to sustained production growth Source: EIA (lower 48 states only) U.S. Natural Gas Storage (BCF) Total NG Weighted Degree Days Source: NOAA, BMO Capital Markets |
|
|
Phosphate Segment World scale mine and fertilizer plant in central Florida 3.5 million tons of rock annually 2 million tons annual DAP/MAP capacity Strong position in domestic phosphate fertilizer market Access to export markets through Tampa port facility and Keytrade relationship Exported to more than 20 countries on five continents in the last two years |
|
|
Phosphate Segment Results Source: Green Markets In millions, except as noted 2011 Q1 H/(L) 2010 Q1 H/(L) 2010 Q4 Sales $ 248 $ 73 $ 13 Gross margin 83 51 20 - Percent 33% 15 pts 6 pts Volume (000 st) 440 (40) (37) - DAP 331 (43) (23) - MAP 109 3 (14) - Domestic 394 5 1 - Export 46 (45) (38) Average selling prices ($/st) - DAP $ 562 $ 201 $ 72 - MAP 569 190 70 DAP Central Florida Price 2009 2010 2011 |
|
|
Production Records Set in Q1 Complexes setting a new record in at least one plant Ammonia Phosphate Monthly record 6 Yes Any month record 4 Yes First quarter record 4 Yes Any quarter record 3 Tied Memo: Q1 Operating Rate 100% 99% |
|
|
Reduction in Net Debt Millions Term loan was repaid in full in the first quarter See slide 23 for reconciliation of net debt $3,478 $2,011 $1,928 $1,590 $1,228 |
|
|
Customer Deposit Seasonality Five-year average change in customer advances (millions) Customer advances typically grow in Q1 and Q3 before primary application seasons Magnitude of Q2 change in deposits depends on market appetite for forward business for summer/fall |
|
|
U.S. Corn Demand and Stocks (Billion Bushels) Source: USDA, CF |
|
|
Source: USDA, Green Markets, CF U.S. Crop Budget – 2011/12 (Returns per Acre) Corn Soybeans Wheat Cotton Revenue Yield (bu/acre) 162.6 44.3 42.5 862.0 Season Average Farm Price $5.40 $12.00 $6.75 $0.95 Total Revenue $879 $532 $295 $928 Variable Costs Fertilizers $139 $24 $64 $96 Seed Costs $88 $62 $19 $76 Other (Interest, Insurance, Etc.) $96 $55 $54 $290 Total Variable Costs $323 $141 $136 $463 Total Cost $583 $375 $306 $807 Returns Over: Variable Cost $557 $391 $159 $465 Total Cost $296 $157 ($11) $120 Breakeven Crop Price Over: Variable Cost $1.99 $3.18 $3.20 $0.54 Total Cost $3.59 $8.47 $7.19 $0.94 Fertilizer Product Cost: Nitrogen $81 $3 $43 $61 Phosphate $34 $11 $18 $21 Potash $24 $11 $3 $14 |
|
|
Corn Planting Progress Percent Planted This Last Last 5-Year Week Week Year Avg. E. Corn Belt Illinois 69 34 96 76 Indiana 29 4 86 66 Michigan 41 8 81 69 Ohio 7 2 84 71 W. Corn Belt Iowa 92 69 96 87 Minnesota 47 28 95 83 Missouri 79 59 85 71 Nebraska 84 57 89 85 North Dakota 14 3 58 56 South Dakota 44 17 56 57 Wisconsin 35 16 78 69 Southern Plains Colorado 75 51 79 70 Kansas 84 66 85 82 Texas 93 87 95 94 Southeast Kentucky 45 19 94 78 North Carolina 98 95 100 99 Tennessee 67 42 93 91 Northeast Pennsylvania 34 10 70 62 U.S. 63 40 87 77 Source: USDA |
|
|
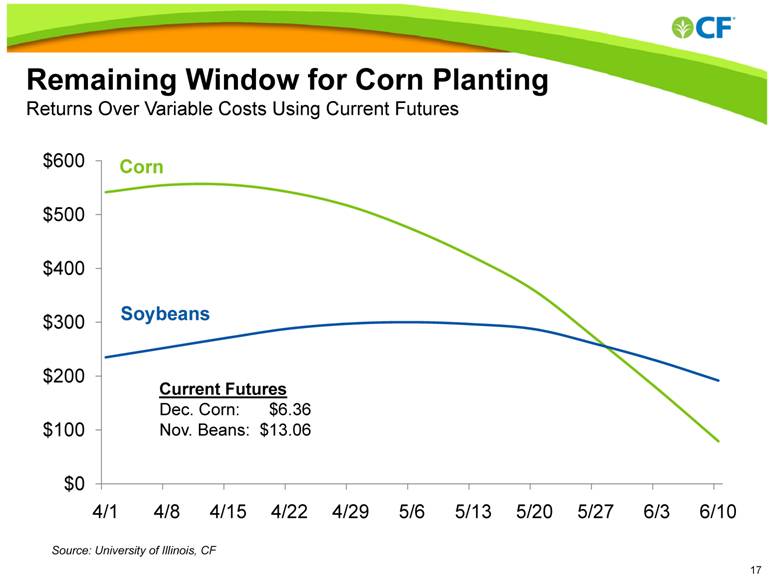
Remaining Window for Corn Planting Returns Over Variable Costs Using Current Futures Current Futures Dec. Corn: $6.36 Nov. Beans: $13.06 Source: University of Illinois, CF Corn Soybeans |
|
|
UAN: A High Value-Added Product North American UAN Production Capacity (million tons/year, 32% basis) Attributes Non-volatile liquid Contains urea (fast release) and AN (slow release) Typically 28-32% nitrogen 2.6 tons of UAN required to replace the nitrogen content of 1 ton of ammonia Advantages Can be blended with crop protection chemicals or irrigation water, reducing passes through the fields Relatively easy to transport and store Can be applied easily after planting, facilitating earlier planting Source: IFDC, company reports, CF |

|
|
China Urea Export Tariff $U.S. per tonne at port China’s low export tariff season for urea extends from July through October The sliding scale tariff would be higher than 7% at prevailing prices Production costs in China have risen with energy prices Expect significantly lower exports in 2011 vs. 2010 A similar tariff structure applies to phosphate exports Final Exporter Sale Price Tax Rate Proceeds $ 275 7% $ 257 300 7% 280 325 14% 303 350 20% 316 375 26% 328 400 31% 340 Assumes that benchmark price includes 7 percent tax |
|
|
Projected U.S. Corn Plantings (million acres) Source: USDA Before 2011: One year over 90MM acres |
|
|
Favorable Conditions, Leading Positions Industry Conditions Continuing strong farm economics High global demand for fertilizer Favorable supply environment Low domestic gas costs Company-Specific Factors Leadership in all nitrogen products Largest, most robust logistics system |
|
|
For more information, please visit www.cfindustries.com |
|
|
Non-GAAP Information Net debt (net cash) is defined as total debt minus cash, cash equivalents and short-term investments, plus customer advances. We include customer advances in this calculation to reflect the liability associated with our obligations to supply fertilizer in the future, which offsets cash received in the form of customer advances. Net debt (net cash) does not include distributions of earnings payable to noncontrolling interest holders. We use net debt (net cash) in the evaluation of our capital structure. (in millions) Reconciliation of debt to net debt (net cash): April 15, June 30, September 30, December 31, March 31, 2010 2010 2010 2010 2011 Total debt 3,627.8 $ 2,601.2 $ 2,255.6 $ 1,959.0 $ 1,618.1 $ Less: cash, cash equivalents and short-term investments 500.0 (1) 601.4 648.4 800.8 1,137.3 Plus: customer advances 350.0 (1) 10.8 321.1 431.5 747.3 Net debt 3,477.8 $ 2,010.6 $ 1,928.3 $ 1,589.7 $ 1,228.1 $ (1) The amounts at April 15, 2010 are approximate. |