Attached files
| file | filename |
|---|---|
| 8-K - FORM 8-K - People's United Financial, Inc. | d8k.htm |
 2
nd
Quarter 2011 Investor Presentation
May 17, 2011
*
*
*
*
*
*
*
Exhibit 99.1
*
*
*
*
*
*
*
*
*
*
*
*
* |
 1
Corporate Overview
Snapshot, as of March 31, 2011
1842
Founded:
518
ATMs:
341
Branches:
$18.1 billion
Deposits:
$17.5 billion
Loans:
$25.0 billion
Assets:
$4.7 billion
Market Capitalization (5/16/11)
NASDAQ (PBCT)
People’s United Financial, Inc. |
 2
Primary Objectives
Optimize the existing business
+
Deploy capital in high risk-adjusted return initiatives
Return the franchise to >1.25% Operating ROAA |
 3
The Northeast Region is Best Commercial Banking Market
in the United States
Population density
Limited amount of land available for development
Construction entitlements are difficult to win
Deep educational and healthcare sectors provide long-lasting infrastructure,
attract talented young people, consistently spawn new businesses
Significant “quiet wealth”
which adds credit strength to the region
Mega bank acquisitions of mid-size banks have left a void of
relationship- based, service focused banks |
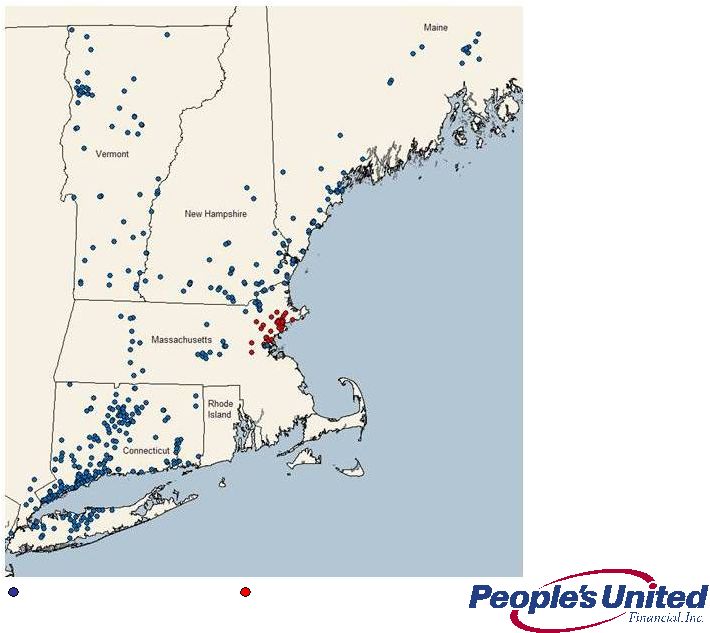 4
Deepening Presence in NYC Metro and Boston MSA
People’s United (PBCT)
Danvers Bancorp (DNBK) |
 5
Strong Pro Forma Deposit Market Position
Connecticut
Branches
$BN
%
1
B of A
166
20.7
21.7
2
Webster
136
11.5
12.1
3
People's United
162
9.7
10.1
4
Wells Fargo
76
8.3
8.6
5
TD Bank
80
5.2
5.5
6
First Niagara
74
4.9
5.1
7
JPM Chase
49
3.9
4.0
8
Liberty
42
2.7
2.8
9
RBS
51
2.6
2.8
10
Citi
20
2.2
2.3
Massachusetts
Vermont
New York
New Hampshire
Maine
Branches
$BN
%
1
B of A
280
44.2
24.2
2
RBS
257
24.5
13.4
3
Santander
230
13.6
7.4
4
TD Bank
159
8.7
4.8
5
Eastern
96
6.2
3.4
6
Independent
70
3.7
2.0
7
People's United
59
3.6
2.0
8
Middlesex
33
3.6
2.0
9
Boston Private
9
2.4
1.3
10
Berkshire Hills
37
2.0
1.2
Branches
$BN
%
1
People's United
46
2.6
24.3
2
TD Bank
37
2.0
18.5
3
Merchants
34
1.0
9.8
4
RBS
24
0.8
8.0
5
KeyCorp
13
0.8
7.7
6
Northfield
13
0.5
4.4
7
Community
14
0.4
3.6
8
Union
13
0.3
3.3
9
Passumpsic
7
0.3
3.1
10
Berkshire Hills
7
0.3
2.8
Branches
$BN
%
1
JPM Chase
811
287.4
34.3
2
Citi
261
66.6
7.9
3
HSBC
377
65.9
7.9
4
B of A
380
55.2
6.6
5
Capital One
290
32.6
3.9
6
M&T
278
23.5
2.8
7
Wells Fargo
87
20.4
2.4
8
TD Bank
203
18.9
2.3
9
KeyCorp
229
15.2
1.8
10
Astoria
85
11.2
1.3
37
People's United
38
2.2
0.3
Branches
$BN
%
1
RBS
82
6.9
26.3
2
TD Bank
74
4.8
18.2
3
B of A
35
4.6
17.5
4
People's United
33
1.4
5.2
5
LSB Financial
20
0.8
3.2
6
Santander
20
0.8
3.1
7
Northway
19
0.6
2.5
8
New Hamp. Thrift
19
0.6
2.3
9
Centrix
6
0.5
2.1
10
Meredith Village
11
0.5
1.8
Branches
$BN
%
1
TD Bank
57
3.2
15.0
2
KeyCorp
61
2.7
12.7
3
B of A
35
1.7
8.0
4
Bangor Bancorp
57
1.7
7.9
5
Camden National
38
1.6
7.3
6
First Bancorp
14
0.9
4.5
7
Machias
13
0.8
3.9
8
People's United
31
0.8
3.9
9
Norway
21
0.7
3.3
10
Bar Harbor
13
0.7
3.1
Deposits of $20.2BN
#1 in Fairfield County, CT, 64 branches, $5.4BN, 17.8% market share
#2 in Essex County, MA, 24 branches, $2.0BN, 12.3% market share
Source: SNL Financial |
 6
6
Low Cost of Deposits
Publicly Traded Northeast Banks, $5BN < Assets <$100BN
Source: SNL Financial
Total
Cost of
Assets ($BN)
Deposits (%)
Company Name
City
State
2011Q1
2011Q1
1
M&T Bank Corporation
Buffalo
NY
67.9
0.31
2
First Niagara Financial Group, Inc.
Buffalo
NY
21.4
0.48
3
Boston Private Financial Holdings, Inc.
Boston
MA
6.0
0.58
4
People's United Financial, Inc.
Bridgeport
CT
25.0
0.59
5
NBT Bancorp Inc.
Norwich
NY
5.5
0.60
6
Community Bank System, Inc.
De Witt
NY
5.5
0.60
7
Webster Financial Corporation
Waterbury
CT
18.0
0.65
8
Valley National Bancorp
Wayne
NJ
14.4
0.71
9
Fulton Financial Corporation
Lancaster
PA
16.0
0.75
10
National Penn Bancshares, Inc.
Boyertown
PA
8.5
0.77
11
New York Community Bancorp, Inc.
Westbury
NY
41.0
0.78
12
F.N.B. Corporation
Hermitage
PA
9.8
0.80
13
Provident Financial Services, Inc.
Iselin
NJ
6.8
0.81
14
First Commonwealth Financial Corporation
Indiana
PA
5.8
0.83
15
Signature Bank
New York
NY
12.4
0.89
16
Susquehanna Bancshares, Inc.
Lititz
PA
14.0
0.91
17
Northwest Bancshares, Inc.
Warren
PA
8.1
1.11
18
CapitalSource Inc.
Chevy Chase
MD
9.3
1.15
19
Investors Bancorp, Inc. (MHC)
Short Hills
NJ
9.8
1.18
20
Astoria Financial Corporation
Lake Success
NY
17.7
1.29
21
Hudson City Bancorp, Inc.
Paramus
NJ
52.4
1.33 |
 7
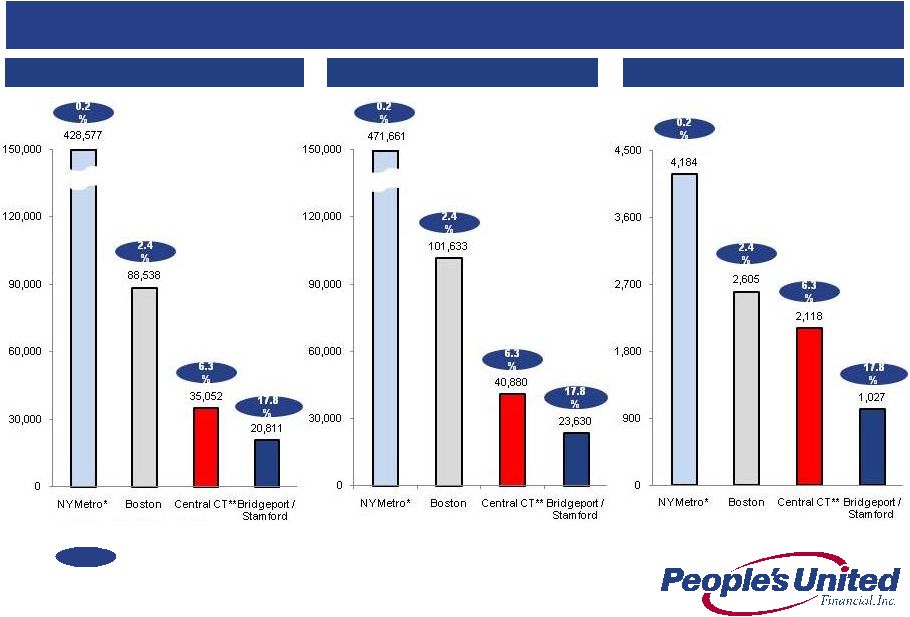
< 20 Employees
Commercial Market Opportunity by MSA
Source: SBA firms and employment by MSA 2007
*
NY
Metro
area
includes
New
York,
Northern
New
Jersey,
and
Long
Island
MSA
** Central Connecticut includes New Haven and Hartford MSAs
> 500 Employees
< 500 Employees
Pro Forma Deposit Market Share Overall within identified MSA
Number of firms by size
People’s United is growing in NYC Metro and Boston Metro,
areas rich with potential commercial, non-commodity relationships
|
 8
Capital Deployment
Primary
focus
is
to
deploy
capital
via
organic
growth
–
“new
markets,
new
products, cross-sell”
Announced
an
increase
to
our
dividend
(19th
consecutive
annual
dividend
increase),
our
pro
forma dividend yield is ~4.9%
Repurchased $191MM of stock in 2010 at a weighted average price of $13.35
Repurchased an additional $61MM of stock in 1Q11 at an average price of $13.09
Prohibited from repurchasing shares until the Danvers Bancorp deal closes
Acquisitions
Closed 4 deals in 2010: Financial Federal, Butler Bank, RiverBank, Smithtown
Danvers
Bancorp
shareholders
approved
the
merger
with
People’s
United
on
May
13
th
Building
relationships
with
banks
$1BN
-
$20BN
in
asset
size
Maintaining price discipline in light of challenging industry conditions
|
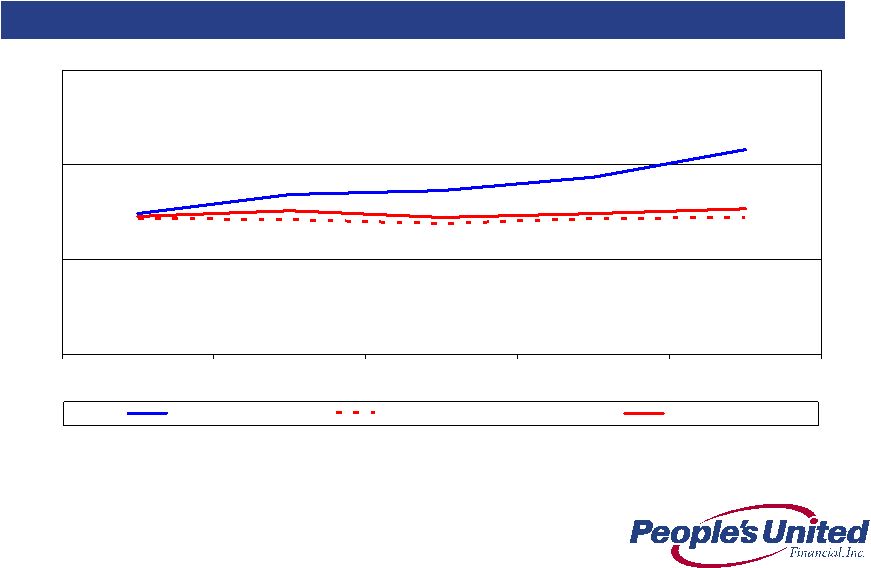
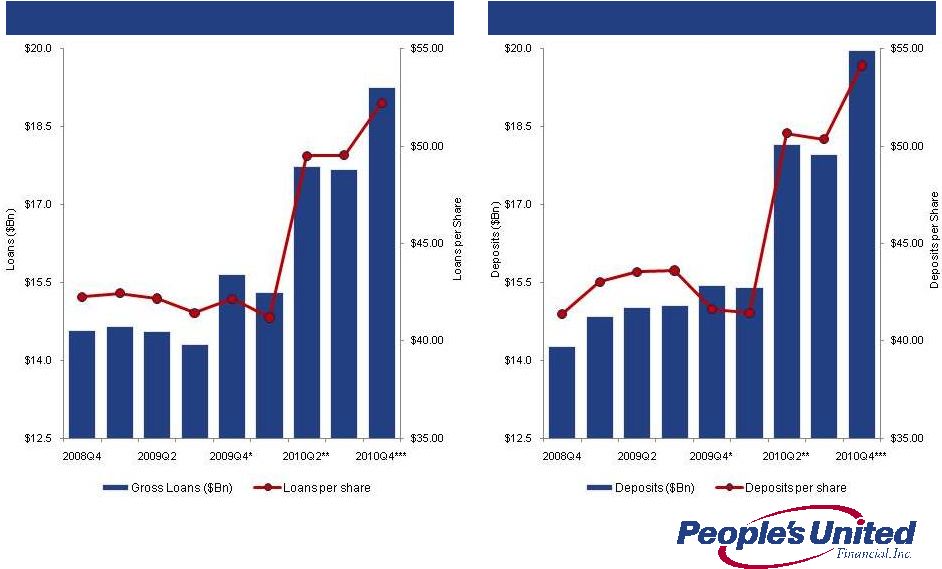 9
Loans
Deposits
Growing Future Earnings Per Share
Loans and Deposits per Share
* Pro forma for FIF acquisition
* *Pro forma for SMTB & LSBX acquisitions
**
*Pro
forma
for
DNBK
acquisition |
 10
Operating earnings of $53.8 million, or $0.15 per share
Net interest margin of 4.16%; up 29 bps from Q4 2010
Total loan growth of $195MM or 4.5% linked-quarter annualized
Deposit growth of $177MM or 3.9% linked-quarter annualized
Strong non-interest income –
wealth management income improvement
of 9% linked-quarter annualized
Efficiency ratio improved to 66.2%
NPAs
as a percentage of originated loans, REO and repossessed assets
fell to 1.96% from 2.09% as of Q4 2010
First Quarter 2011 Results
Overview |
 11
Net Interest Margin
Linked Quarter Change
11
3.87%
4.16%
-0.08%
-0.06%
0.16%
0.12%
0.15%
Q4 2010
Margin
Hedge Income
Decrease
Calendar Days
PUEF
Accretion
Adjustment
Investment Mix
& Yield
Full Quarter
Smithtown &
River
Q1 2011
Margin |
 12
Net Interest Margin
Last Five Quarters
12
3.49%
3.69%
3.74%
3.87%
4.16%
1Q 2010
2Q 2010
3Q 2010
4Q 2010
1Q 2011 |
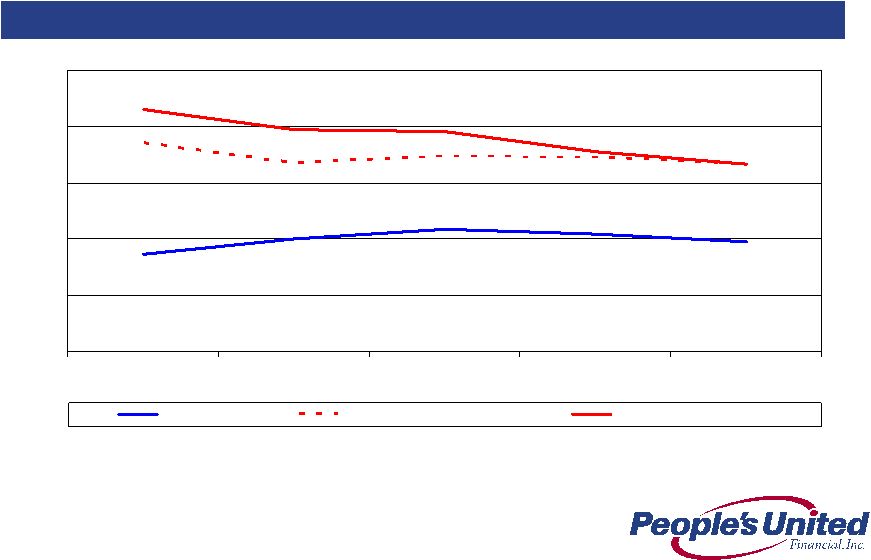
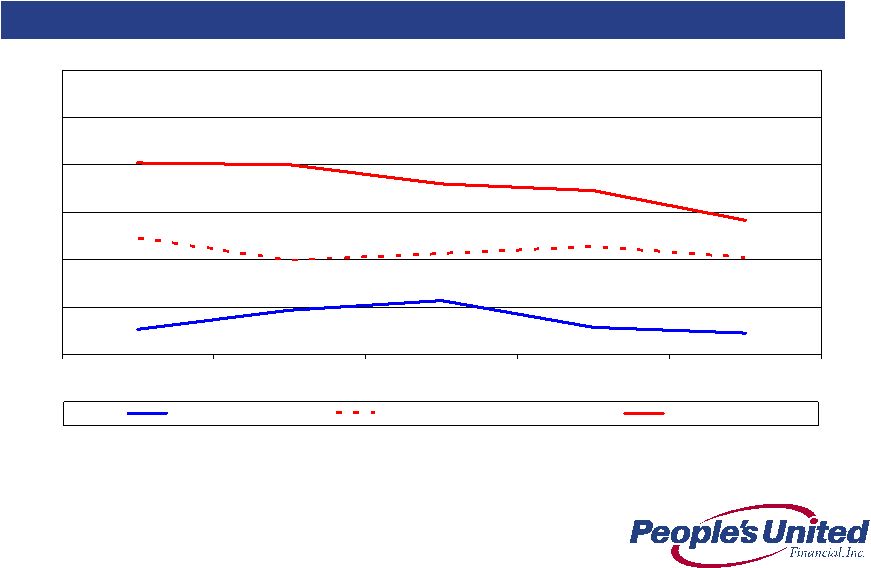
 13
Last Five Quarters
4.16
3.43
3.54
2.00
3.00
4.00
5.00
Q1 2010
Q2 2010
Q3 2010
Q4 2010
Q1 2011
PBCT
Peer Group Mean
Top 50 Banks
Net Interest Margin
Compared to Peers and Top 50 Banks
Source: SNL Financial and Company filings |
 14
We do not expect short-term interest rates to rise in 2011, however, we do expect
Fed tightening to begin in 2012
Given short-term interest rates are very low and are expected to remain low for
the near term, we have continued to accumulate securities
For
Q1
2011
we
were
4.5x
–
5.0x
as
asset
sensitive
as
the
estimated
median
of
our
peers depending
on scenario
For an immediate parallel increase of 100bps, our net interest income is projected to
increase by ~$40MM on an annualized basis
Yield curve twist scenarios confirm that we are reasonably well protected from bull
flattener and benefit considerably from bear flattener environments
Notes:
1.
Analysis is as of 3/31/11 filings
2.
Data as of 3/31/11 SEC filings, where exact +100bps shock up scenario data was not
provided PBCT interpolated based on data disclosed 3.
Data as of 3/31/11 filings, where exact +200bps shock up scenario data was
not provided PBCT interpolated based on data disclosed Current Asset
Sensitivity Net Interest Income at Risk ¹
Analysis involves PBCT estimates, see notes below
Change in Net Interest Income
Scenario
Lowest
Amongst Peers
Highest
Amongst Peers
Peer Median
PBCT Multiple to
Peer Median
Shock Up
100bps ²
-0.6%
5.6%
0.9%
5.0x
Shock Up
200bps ³
-0.1%
11.2%
2.5%
4.5x |
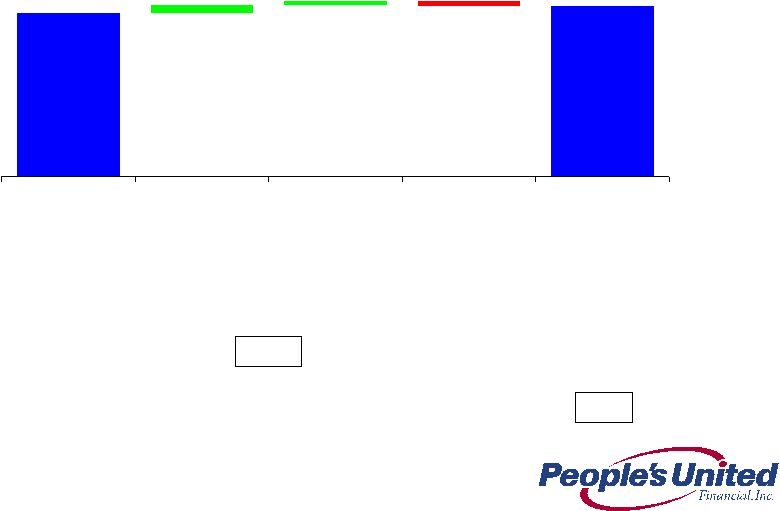 15
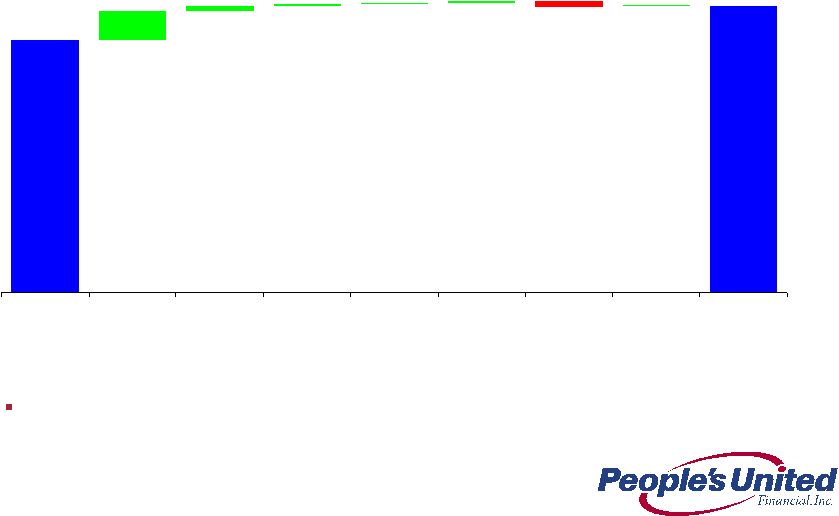
Loans
Linked Quarter Change
(in $ millions)
15
Annualized
Linked Quarter Change:
11.0%
12.3%
(30.3%)
Originated Annualized
Linked Quarter Change:
11.4%
Total Annualized
Linked Quarter Change:
4.5%
17,328
277
136
(218)
17,523
Dec 31, 2010
Commercial
Banking
Retail & Business
Banking
Acquired
Mar 31, 2011 |
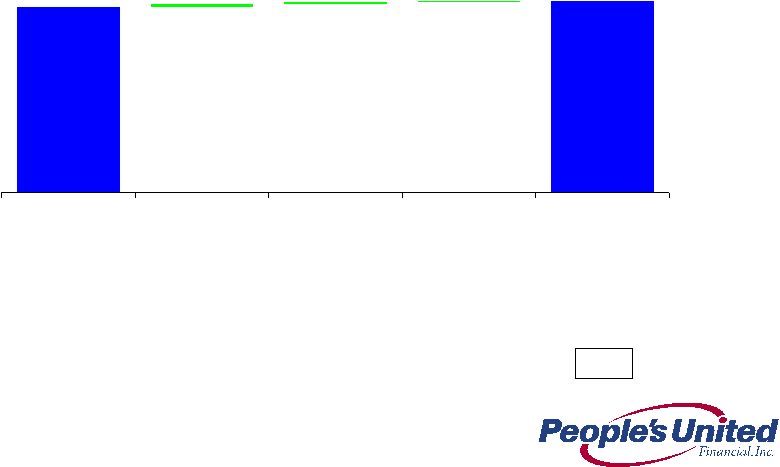 16
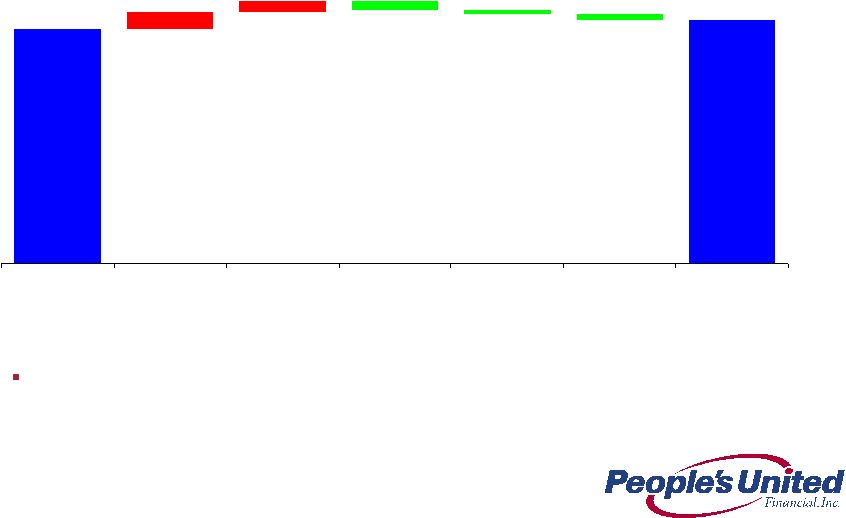
Deposits
Linked Quarter Change
(in $ millions)
16
Annualized
Linked Quarter Change:
2.1%
64.9%
5.9%
Total Annualized
Linked Quarter Change:
3.9%
17,933
18,110
34
63
80
Dec 31, 2010
Legacy
De Novo
Acquired
Mar 31, 2011 |
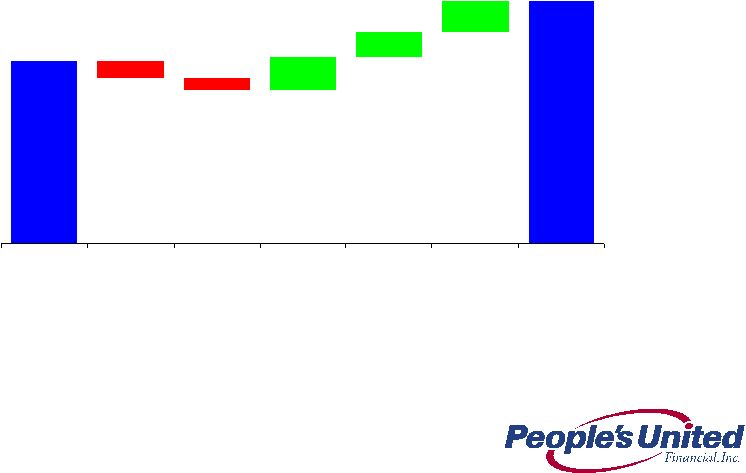
 17
(1.1)
0.3
0.3
0.3
1.0
5.5
0.2
74.6
68.1
4Q 2010
Gain on
Smithtown
Loan Sales
Insurance
Investment
Management
Brokerage
Bank Service
Charges
Gain on
Residential
Loan Sales
Other
1Q 2011
Non-interest income
Linked Quarter Change
(in $ millions)
17
Includes a $5.5MM gain on sale of non-performing Smithtown loans
|
 18
Non-interest expense
Linked Quarter Change
(in $ millions)
18
199.1
202.8
(2.8)
(1.7)
( 3.9)
5.0
7.1
4Q 2010
Compensation &
Benefits
Occupancy &
Equipment
Professional &
Outside Svc
Merger-related
expenses
Other
1Q 2011
Expenses essentially flat despite full quarter impact of Smithtown and
RiverBank |
 19
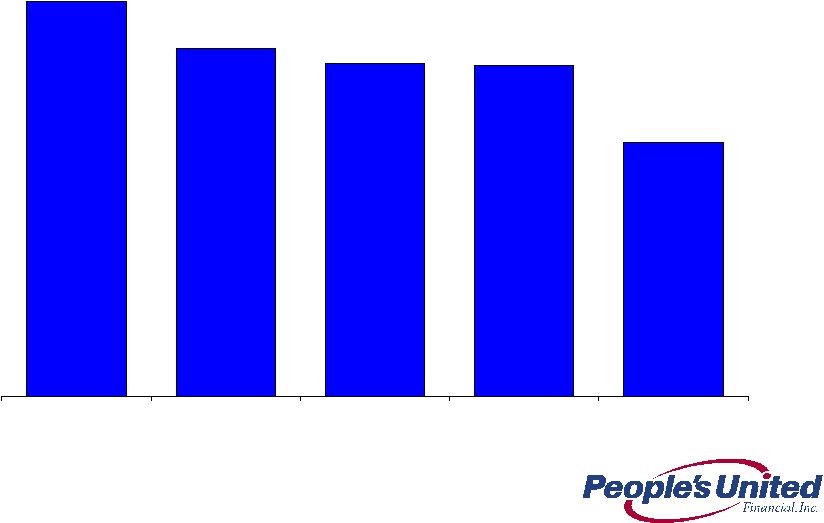
Efficiency Ratio
Historical Trend
75%
72%
71%
71%
66%
1Q 2010
2Q 2010
3Q 2010
4Q 2010
1Q 2011 |
 20
Last Five Quarters
1.96
3.33
3.33
0.00
1.00
2.00
3.00
4.00
5.00
Q1 2010
Q2 2010
Q3 2010
Q4 2010
Q1 2011
PBCT
Peer Group Median
Top 50 Banks by Assets
Asset Quality
NPAs / Loans & REO* (%)
*
Non-performing
assets
(excluding
acquired
non-performing
loans)
as
a
percentage
of
originated
loans
plus
all
REO
and
repossessed
assets;
acquired
non-performing
loans
excluded
as
risk
of
loss
has
been
considered
by
virtue
of
our
estimate
of
acquisition-date fair value and/or the existence of an FDIC loss sharing
agreement Source: SNL Financial and Company filings
|
 21
Last Five Quarters
0.22
1.02
1.41
0.00
0.50
1.00
1.50
2.00
2.50
3.00
Q1 2010
Q2 2010
Q3 2010
Q4 2010
Q1 2011
PBCT
Peer Group Mean
Top 50 Banks
Asset Quality
Net Charge-Offs / Avg. Loans (%)
Source: SNL Financial and Company filings |
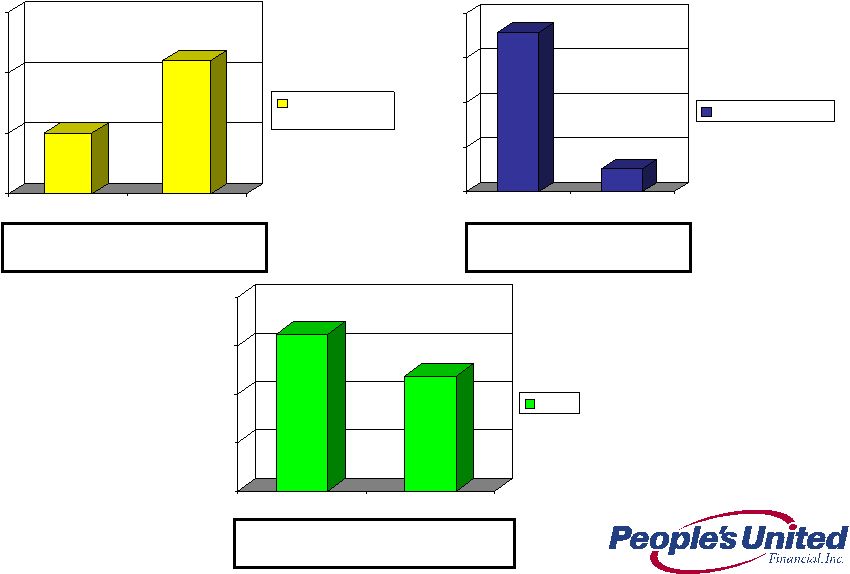 22
Allowance for Loan Losses
Coverage Detail
(in $ millions)
1.50%
1.55%
1.60%
1.65%
NPLs:Loans
ALLL:Loans
Commercial
Banking
0.00%
0.50%
1.00%
1.50%
2.00%
NPLs:Loans
ALLL:Loans
Retail Banking
Commercial ALLL -
$165.7 million
104% of Commercial NPLs
Retail ALLL -
$11.8 million
15% of Retail NPLs
Total ALLL -
$177.5 million
74% of Total NPLs
0.00%
0.50%
1.00%
1.50%
2.00%
NPLs:Loans
ALLL:NPLs
Total |
 23
Acquired Loan Portfolio
Actual Credit Experience vs. Expectations
Acquired loans initially recorded at fair value (inclusive of related credit mark)
without carryover of historical ALLL
Accounting model is cash-flow based:
Contractual
cash
flows
(principal
&
interest)
less
Expected
cash
flows
(principal
&
interest)
=
non-accretable
difference
(utilized
to
absorb
actual
portfolio
losses)
Expected
cash
flows
(principal
&
interest)
less
fair
value
=
accretable
yield
Cash flows are both acquisition and pool specific
Expected cash flows are regularly reassessed and compared to actual cash
collections Better
than
expected
credit
experience
results
in
reclass
of
non-accretable
difference
to
accretable yield (prospective yield adjustment over the life of the loans)
As of 3/31/2011
(in $ millions)
Carrying
Amount
NPLs
a
Remaining
Non-Accretable
Difference
Remaining
Non-Accretable
Difference:NPLs
Charge-offs
Incurred Since
Acquisition
FinFed (2/18/10)
$ 574.6
$ 59.2
$ 28.2
47.6%
$ 8.5
Butler (4/16/10)
99.9
14.3
35.3
246.9%
2.9
RiverBank (11/30/10)
484.3
8.3
16.8
202.4%
-
Smithtown (11/30/10)
b
1,516.1
242.6
329.1
135.7%
48.6
Total
$2,674.9
$324.4
$409.4
(a)
Represent
contractual
amounts;
loans
meet
People’s
United
Financial’s
definition
of
a
non-performing
loan but are not subject to classification as non-accrual in the same manner
as originated loans. Rather, these loans are considered to be accruing
loans because their interest income relates to the accretable yield
recognized at the pool level and not to contractual interest payments at the loan level.
(b)
Smithtown charge-offs include $17.7M incurred upon Q1 2011 sale of
non-performing loans. |
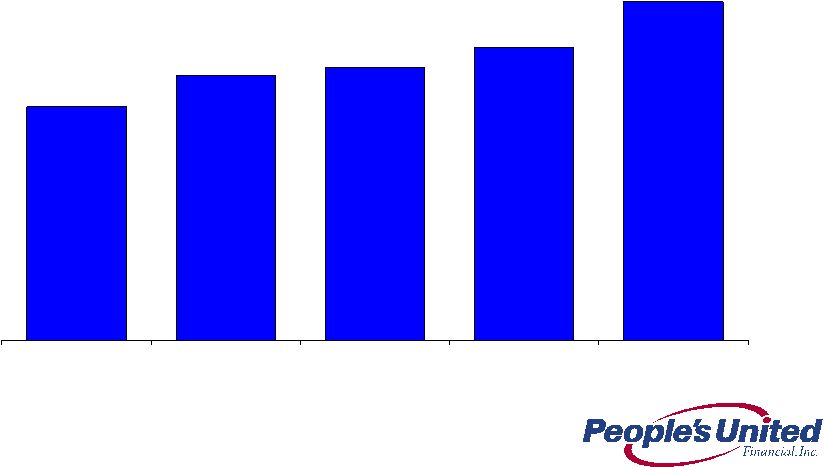
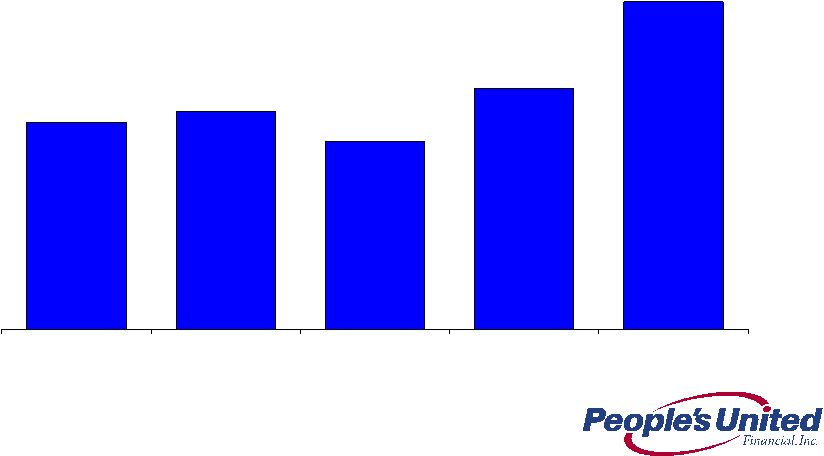 24
Operating ROAA Progress
Last Five Quarters
0.55%
0.58%
0.50%
0.64%
0.87%
1Q 2010
2Q 2010
3Q 2010
4Q 2010
1Q 2011 |
 25
Summary
Premium brand built over 169 years
High quality Northeast footprint characterized by wealth, density and commercial
activity
Strengthened leadership team
Low cost of deposits
Strong net interest margin
Superior asset quality
Focus on non-commodity/relationship based lending
Growing
loans
and
deposits
within
footprint
-
in
two
of
the
largest
MSAs
in the
country (New York City, #1 and Boston, #10)
Efficiently growing loans and deposits per share
Significantly more asset sensitive than peers
Pro forma tangible common equity ratio of ~12%
Sustainable Competitive Advantage |
| Appendix
*
*
*
*
*
*
*
*
*
*
*
*
*
*
*
*
*
* |
 27
Peer Group
Company Name
Ticker
State
1
Associated Banc-Corp
ASBC
WI
2
Astoria Financial Corporation
AF
NY
3
BOK Financial Corporation
BOKF
OK
4
City National Corporation
CYN
CA
5
Comerica Incorporated
CMA
TX
6
Commerce Bancshares, Inc.
CBSH
MO
7
Cullen/Frost Bankers, Inc.
CFR
TX
8
First Horizon National Corporation
FHN
TN
9
Flagstar Bancorp, Inc.
FBC
MI
10
Fulton Financial Corporation
FULT
PA
11
Hudson City Bancorp, Inc.
HCBK
NJ
12
M&T Bank Corporation
MTB
NY
13
Marshall & Ilsley Corporation
MI
WI
14
New York Community Bancorp, Inc.
NYB
NY
15
Synovus Financial Corp.
SNV
GA
16
TCF Financial Corporation
TCB
MN
17
Valley National Bancorp
VLY
NJ
18
Webster Financial Corporation
WBS
CT
19
Zions Bancorporation
ZION
UT |
 For
more information, investors may contact: Peter Goulding, CFA
203-338-6799
peter.goulding@peoples.com
*
*
*
*
*
*
*
*
*
*
*
*
*
*
*
*
*
* |