Attached files
| file | filename |
|---|---|
| EX-23.1 - CONSENT OF ERNST & YOUNG LLP - NEWGISTICS, INC | dex231.htm |
Table of Contents
Index to Financial Statements
As filed with the Securities and Exchange Commission on May 16, 2011
Registration No. 333-172709
UNITED STATES SECURITIES AND EXCHANGE COMMISSION
Washington, D.C. 20549
AMENDMENT NO.2
TO
Form S-1
REGISTRATION STATEMENT
UNDER
THE SECURITIES ACT OF 1933
NEWGISTICS, INC.
(Exact name of Registrant as Specified in Its Charter)
| Delaware | 4731 | 74-2937236 | ||
| (State or Other Jurisdiction of Incorporation or Organization) |
(Primary Standard Industrial Classification Code Number) |
(IRS Employer Identification No.) |
2700 Via Fortuna, Suite 300
Austin, Texas 78746
(512) 225-6000
(Address, Including Zip Code, and Telephone Number, Including Area Code, of Registrant’s Principal Executive Offices)
Michael J. Twomey
Chief Financial Officer
2700 Via Fortuna, Suite 300
Austin, Texas 78746
(512) 225-6000
(Name, Address, Including Zip Code, and Telephone Number, Including Area Code, of Agent for Service)
Copies to:
| Samer M. Zabaneh Philip W. Russell DLA Piper LLP (US) 401 Congress Avenue, Suite 2500 Austin, Texas 78701 |
Paul R. Tobias Wilson Sonsini Goodrich & Rosati, Professional Corporation 900 South Capital of Texas Highway Las Cimas IV, Fifth Floor Austin, Texas 78746 |
Approximate date of commencement of proposed sale to the public: As soon as practicable after this registration statement becomes effective.
If any of the securities being registered on this form are to be offered on a delayed or continuous basis pursuant to Rule 415 under the Securities Act of 1933, as amended (the “Securities Act”), check the following box. ¨
If this form is filed to register additional securities for an offering pursuant to Rule 462(b) under the Securities Act, check the following box and list the Securities Act registration statement number of the earlier effective registration statement for the same offering. ¨
If this form is a post-effective amendment filed pursuant to Rule 462(c) under the Securities Act, check the following box and list the Securities Act registration statement number of the earlier effective registration statement for the same offering. ¨
If this form is a post-effective amendment filed pursuant to Rule 462(d) under the Securities Act, check the following box and list the Securities Act registration statement number of the earlier effective registration statement for the same offering. ¨
Indicate by check mark whether registrant is a large accelerated filer, an accelerated filer, a non-accelerated filer, or a smaller reporting company. See the definitions of “large accelerated filer,” “accelerated filer,” and “smaller reporting company” in Rule 12b-2 of the Exchange Act. (check one): ¨ Large accelerated filer, ¨ Accelerated filer, x Non-accelerated filer (do not check if a smaller reporting company) or ¨ Smaller reporting company.
The registrant hereby amends this registration statement on such date or dates as may be necessary to delay its effective date until the registrant shall file a further amendment which specifically states that this registration statement shall thereafter become effective in accordance with Section 8(a) of the Securities Act of 1933, as amended, or until the registration statement shall become effective on such date as the Securities and Exchange Commission, acting pursuant to such Section 8(a), may determine.
Table of Contents
Index to Financial Statements
The information in this preliminary prospectus is not complete and may be changed. These securities may not be sold until the registration statement filed with the Securities and Exchange Commission is effective. This preliminary prospectus is not an offer to sell nor does it seek an offer to buy these securities in any jurisdiction where the offer or sale is not permitted.
SUBJECT TO COMPLETION, DATED MAY 16, 2011
IPO PRELIMINARY PROSPECTUS

Shares
Common Stock
$0.001 per share
We are selling shares of common stock and the selling stockholders are selling shares of common stock.
Prior to this offering, there has been no public market for our common stock. The initial public offering price of the common stock is expected to be between $ and $ per share. We have applied to list our common stock on the NASDAQ Global Select Market under the symbol “NEWG.”
The underwriters have an option to purchase a maximum of additional shares to cover over-allotments of shares.
Investing in our common stock involves risks. See “Risk Factors” on page 12.
| Per Share | Total | |||||||
| Public Offering Price |
$ | $ | ||||||
| Underwriting Discount |
$ | $ | ||||||
| Proceeds, before expenses, to us |
$ | $ | ||||||
| Proceeds, before expenses, to Selling Stockholders |
$ | $ | ||||||
These securities are not deposits, savings accounts, or other obligations of any bank or savings association and are not insured or guaranteed by the Federal Deposit Insurance Corporation or any other governmental agency.
Neither the Securities and Exchange Commission nor any state securities commission has approved or disapproved of these securities or passed upon the adequacy of this prospectus. Any representation to the contrary is a criminal offense.
| Stifel Nicolaus Weisel | Piper Jaffray |
| BB&T Capital Markets | William Blair & Company |
The date of this prospectus is , 2011.
Table of Contents
Index to Financial Statements
| Page | ||||
| i | ||||
| 1 | ||||
| 12 | ||||
| Special Note Regarding Forward-Looking Statements and Industry Data |
26 | |||
| 27 | ||||
| 27 | ||||
| 28 | ||||
| 30 | ||||
| 32 | ||||
| Management’s Discussion and Analysis of Financial Condition and Results of Operations |
35 | |||
| 58 | ||||
| 76 | ||||
| 82 | ||||
| 99 | ||||
| 103 | ||||
| 105 | ||||
| 110 | ||||
| Certain Material U.S. Federal Tax Consequences for Non-U.S. Holders Of Common Stock |
112 | |||
| 116 | ||||
| 122 | ||||
| 122 | ||||
| 122 | ||||
| F-1 | ||||
You should rely only on the information contained or incorporated by reference in this prospectus. We have not authorized anyone to provide you with information different from that contained in this prospectus. We and the selling stockholders are offering to sell shares of common stock and seeking offers to buy shares of common stock only in jurisdictions where offers and sales are permitted. The information contained in this prospectus is accurate only as of the date of this prospectus, regardless of the time of delivery of this prospectus or of any sale of the common stock.
In this prospectus “Company,” “we,” “us,” and “our” refer to Newgistics, Inc. and its subsidiaries. Unless otherwise indicated, all information in this prospectus assumes no exercise of the underwriters’ over-allotment option.
Dealer Prospectus Delivery Obligation
Until , 2011 (25 days after the commencement of this offering), all dealers that effect transactions in these securities, whether or not participating in this offering, may be required to deliver a prospectus. This is in addition to the dealer’s obligation to deliver a prospectus when acting as an underwriter and with respect to unsold allotments or subscriptions.
Table of Contents
Index to Financial Statements
GLOSSARY OF PARCEL, FREIGHT, AND RETAIL INDUSTRY TERMS
“Customer” means, for our parcel solutions business, a direct-to-consumer retailer, logistics service provider, or other business that utilizes our parcel delivery or return solutions. For our freight services business, customer means a manufacturer, distributor, or other business that utilizes our less-than-truckload, or LTL, and truckload transportation management solutions. We refer to an individual or organization that purchases merchandise from our parcel solutions customers as a consumer.
“Direct-to-consumer” means the marketing, selling, and shipment of merchandise by retailers, manufacturers, and distributors directly to the end consumer, typically bypassing traditional brick-and-mortar retail locations. Direct-to-consumer sales channels may include websites, catalogues, television commercials, shopping networks, smartphones, and other mobile devices and media.
“E-commerce” means, according to the U.S. Census Bureau, the sale of goods and services where an order is placed by the buyer, or price and terms of sale are negotiated over an internet, extranet, electronic data interchange network, electronic mail, or other online system. Payment may or may not be made online.
“Electronic shopping and mail-order houses” means the industry group, as classified by the U.S. Census Bureau, that consists of establishments primarily engaged in retailing merchandise using non-store means, such as catalogues, toll-free telephone numbers, or electronic media, such as interactive televisions or computers.
“First-mile” means the first stage of our parcel return service and represents the transportation of a parcel by a USPS carrier from the consumer’s home or workplace to a Post Office.
“Gross LTL billings” means the dollar amount of customer freight purchases in our freight services business using our negotiated LTL carrier contracts.
“Last-mile” means the final stage of our parcel delivery service and represents the transportation of a parcel by a USPS carrier from a Post Office to the consumer’s home or workplace.
“Less-than-truckload” or “LTL” means a shipment that typically weighs less than 10,000 pounds and is consolidated with shipments from multiple shippers in a single trailer.
“National Distribution Center” means a USPS facility that serves as a centralized mail processing and transfer point for designated geographic areas. As of May 16, 2011, there were 21 National Distribution Centers in the USPS network.
“Newgistics SmartLabel” means our pre-paid, pre-addressed label that can be generated at the point-of-sale or shipment, after the sale by a customer service representative, or printed by a consumer returning merchandise. The Newgistics SmartLabel features intelligent barcodes that are scanned to provide shippers with detailed information related to each parcel return.
“Parcel consolidators” means third-party service providers that pick up, sort, and transport a shipper’s parcels, and then deposit them into the USPS system for final delivery.
“Parcel Return Service” or “PRS” means the USPS workshare discount program that permits approved providers to retrieve returned parcels from designated USPS locations.
“Parcel Select” means the USPS workshare program that enables parcel consolidators to sort, consolidate, and ship parcels directly to USPS facilities or local Post Offices for last-mile delivery by the USPS to the final destination.
i
Table of Contents
Index to Financial Statements
“Parcel yield” means the revenue per parcel that we receive for each parcel we ship.
“SmartCenter” means one of our six parcel distribution and processing facilities located in the U.S., which are equipped with information management systems and automated sorting equipment with built-in redundancies designed to ensure delivery accuracy.
“Sort” means to separate mail by a scheme or zipcode range.
“Truckload” means a shipment from one customer that is dedicated an entire trailer from origin to destination.
“Truckload brokerage” means the customer shipments for which our freight services business arranges the pickup and delivery of truckload freight using third-party carriers.
ii
Table of Contents
Index to Financial Statements
You should read the following summary together with the more detailed information concerning our company, the common stock being sold in this offering, and our consolidated financial statements and related notes appearing in this prospectus and in the documents incorporated by reference in this prospectus. Because this is only a summary, you should read the rest of this prospectus, including the documents incorporated by reference in this prospectus, before you invest in our common stock. Read this entire prospectus carefully, especially the risks described under the section titled “Risk Factors.”
Our Business
Overview
We are a leading U.S. provider of technology-enabled parcel and freight transportation solutions to direct-to-consumer retailers, manufacturers, distributors, and logistics service providers. We operate in two business segments: parcel solutions and freight services.
In our parcel solutions business, we manage the delivery of large volumes of parcels from e-commerce, catalogue, and televised home shopping retailers primarily to consumers’ homes and returns from consumers back to retailers. By consolidating parcels from many customers and consumers and using the United States Postal Service, or the USPS, for last-mile delivery and first-mile pickup, we are able to provide cost-effective, reliable, and convenient shipping solutions. Utilizing our proprietary web-based technology platform, we believe our customers are able to improve their parcel shipping processes, reduce transportation and inventory costs, and improve consumer satisfaction. We provide parcel solutions to many leading U.S. online, catalogue, and other direct-to-consumer retailers, and leading third-party logistics providers, including CDS Global, Inc., GENCO ATC, Lands’ End, Mason, Neiman Marcus, QVC, Universal Screen Arts Group, and Victoria’s Secret, who constituted eight of our top twelve customers based on revenue during the first fiscal quarter of 2011.
We offer a national, integrated parcel delivery and return solution to our parcel solutions customers. For parcel deliveries, we consolidate many customers’ parcels having the same regional destination at one of our six SmartCenter parcel processing and distribution facilities and transport them to USPS distribution facilities in those regions to take advantage of lower cost USPS local delivery rates. For merchandise returns, the USPS picks up parcels from many consumers in the same region and consolidates them at USPS distribution facilities where we retrieve and transport them to one of our SmartCenters to be returned to our customers in aggregated shipments. We received, sorted, and transported an aggregate of approximately 41.3 million parcels and 11.5 million parcels at our SmartCenter distribution and processing facilities in fiscal 2010 and the first fiscal quarter of 2011, respectively.
Our proprietary, web-based technology platform, Intelligent Logistics Management, or ILM, can be integrated with our customers’ and third-party enterprise systems, thus enabling us to customize our parcel solutions to meet the requirements of each customer’s unique supply chain strategy. Through our technology platform, our customers are able to track individual parcels, receive in-transit parcel status and delivery confirmations, and transfer shipment-level data to their financial and customer management systems. Our customers have the ability to create customized reports using our software tools, enabling them to monitor service quality, confirm billing accuracy, and perform business analysis to identify potential operational improvements related to parcel deliveries and returns. We create and host customer-branded websites in which consumers can track parcels, initiate the return or exchange process, and arrange for pickup of returns. We believe these tools allow our customers to significantly reduce call center costs and improve the overall consumer shopping experience.
1
Table of Contents
Index to Financial Statements
We created an innovative parcel return solution that utilizes the extensive USPS local network and our proprietary software applications to improve the consumer return process. Our Newgistics SmartLabel technology and strategic alliance with the USPS simplifies the returns process by offering consumers pre-paid return via pickup from their home or workplace or drop off at any USPS collection box or Post Office. Specific product and consumer data embedded in the intelligent barcodes in our Newgistics SmartLabel provide our customers with the ability to sort and process returned merchandise based on predetermined business rules. This feature provides our customers visibility into their return process, which we believe allows them to manage inventory more efficiently and process credit to customers more quickly.
In our freight services business, we offer a range of less-than-truckload, or LTL, truckload, and expedited transportation management solutions that utilize capacity provided by third-party carriers. Our freight services offerings include rate negotiation, carrier selection, carrier and routing management, bill and audit administration, and consolidated freight payment services.
For both our parcel solutions and our freight services businesses, we utilize a non-asset based operating model. We do not own the transportation equipment used to transport our customers’ shipments. Instead, we rely on the USPS for local pickup and delivery of parcels, and capacity provided by third-party carriers for all of our other parcel and freight services transportation requirements.
We are led by an experienced management team with extensive industry knowledge. We believe that our focus on quality, innovation and customer service, extensive distribution network, and strong relationships with the USPS and third-party carriers have contributed to our leading market position.
We believe the significant growth we have experienced reflects both our ability to provide valuable services at a competitive price and the substantial growth in the direct-to-consumer retail industry. Our revenue for fiscal 2008, 2009, and 2010, was $129.3 million, $168.7 million, and $174.6 million, respectively, representing a 16.2% compound annual growth rate over the same period. Our operating income for fiscal 2008, 2009, and 2010 was $3.9 million, $8.4 million, and $13.4 million, respectively, representing a 86.1% compound annual growth rate for the same period. Our net income for fiscal 2008, 2009, and 2010 was $3.8 million, $13.1 million, and $21.4 million, respectively. Please see our Selected Consolidated Financial and Other Data, including the adjustments to net income related to our preferred stock warrant liability and net deferred tax asset valuation allowance.
Market Opportunity
Our parcel solutions segment operates within the rapidly growing direct-to-consumer parcel market while our freight services segment operates within the third-party logistics, or 3PL, market. Both markets are large and have favorable trends that we believe provide us significant growth opportunities.
Direct-to-Consumer Parcel Market
According to The Colography Group, or Colography, a leading research and consulting firm to the transportation industry, in a study commissioned by us, revenue generated in the less-than-70 pound U.S. parcel market, the primary market in which our parcel solutions business participates, was $54.8 billion in 2009. In the same study, Colography estimates that $37.7 billion of this market was related to delivery of parcels with transit times of two or more days, of which approximately 31%, measured by number of shipments, represented deliveries from businesses to residences, or direct-to-consumer deliveries.
We believe the growth of the U.S. parcel market is increasingly being driven by growth in direct-to-consumer retail sales, especially growth in e-commerce retail sales. Retailers, manufacturers, and distributors are increasingly using multiple direct-to-consumer channels to market and sell products, responding to changing consumer purchasing patterns. Direct-to-consumer sales channels include websites,
2
Table of Contents
Index to Financial Statements
catalogues, television commercials, shopping networks, smartphones, and other mobile devices and media. Utilizing direct-to-consumer channels in addition to, or in lieu of, brick-and-mortar store locations allows retailers to capture sales to consumers who prefer to shop utilizing alternative channels.
We believe a number of key trends are reshaping the retail industry, positively affecting the direct-to-consumer parcel market, including:
The growth of direct-to-consumer retail sales is significantly outpacing the growth of the broader retail market. According to the U.S. Census Bureau, sales from electronic shopping and mail-order houses increased at a 9.1% compound annual growth rate from $113.9 billion in 2000 to $270.8 billion in 2010. During this same period, total retail sales increased at only a 2.8% compound annual growth rate. In 2009, e-commerce sales represented the largest and one of the fastest growing components of sales from electronic shopping and mail-order houses. According to the U.S. Census Bureau, e-commerce sales increased at a 20.1% compound annual growth rate, from $27.5 billion in 2000 to $143.4 billion in 2009, the latest annual data available. We believe the following trends will drive continued growth in the direct-to-consumer retail market:
| • | traditional brick-and-mortar retailers are increasingly using the internet as an alternative sales channel and distinct profit-generating business unit; |
| • | online purchases are increasing as consumers become more aware of the convenience of expanded product selection and availability of online shopping, and improvements in security and electronic payment technology; |
| • | adoption of mobile internet applications is accelerating and rapid introduction of new mobile technologies is improving internet accessibility and increasing the number of internet users; and |
| • | direct-to-consumer retailers are increasingly offering free shipping and adopting services that make the return process more convenient, in an effort to improve consumer satisfaction. |
The increase in direct-to-consumer sales and marketing channels is creating challenges for retailers. Fulfilling direct-to-consumer orders creates customer service and supply chain management challenges for retailers. Consumers want both the convenience of shopping online and on-time, reliable parcel delivery. However, since consumers shopping online cannot inspect the merchandise at the time of purchase, they return or exchange merchandise at a higher rate than when shopping in a store. Both the consumer and retailer desire to track these deliveries and returns, with the consumer expecting a prompt credit for returned merchandise and the retailer wanting to quickly and efficiently return merchandise to stock.
A convenient, cost-effective parcel return and delivery capability is critical to direct-to-consumer retailers. We believe reliable, convenient, and cost-effective parcel return and delivery services are an essential component of successful direct-to-consumer retail sales strategies, and are increasingly a point of competitive differentiation among retailers. Direct-to-consumer retailers also desire return and delivery solutions that enable them to improve inventory management, streamline supply chain processes, and ensure consumer satisfaction. Critical elements of a parcel return and delivery service meeting these needs include:
| • | reliable, convenient, and cost-effective parcel shipping; |
| • | shipment tracking during return and delivery; |
| • | technology integration into the customers’ enterprise systems to allow them to efficiently manage their supply chain processes; |
| • | pre-paid return via pickup at home, work, or other convenient locations; |
| • | flexible solutions tailored to the specific needs of the retailer and consumers; and |
| • | a high level of customer service supported by an understanding of the retailers’ business practices. |
3
Table of Contents
Index to Financial Statements
Third-Party Logistics Services Market
Our freight services segment operates in the U.S. 3PL market. According to Armstrong & Associates, Inc., or Armstrong, a leader in supply chain market research and consulting, the outsourced U.S. 3PL market grew at a compound annual rate of 10.6% from 2000 to 2008, before declining 15.7% in 2009. In January 2011, Armstrong estimated that the U.S. 3PL market grew 13.5% to $121.6 billion in 2010 and that in 2010, $36.2 billion of this market would be related to the domestic transportation management market, the primary market in which our freight services business operates.
Today’s business environment requires companies to continually improve the efficiency and cost-effectiveness of their distribution services while maintaining focus on core competencies. Companies face competitive pressures to reduce transportation costs and improve customer service and are increasingly recognizing the efficiencies of outsourcing. This trend towards outsourcing certain supply chain functions is driving the use of 3PL providers such as freight brokers, freight forwarders, customs brokers, warehouse providers, transportation management providers, and distribution companies.
Our Competitive Strengths
We believe the following competitive strengths will continue to drive our success in the future:
Leading value-added parcel return solution. We collaborated with the USPS during the development of the Parcel Return Service, or PRS, a USPS program that permits approved providers to retrieve returned parcels from designated USPS facilities. We were the first USPS approved PRS provider, and, as of April 2, 2011, we, United Parcel Service, Inc., or UPS, and FedEx Corporation, or FedEx, were the only approved PRS providers. During the 12-month period ended September 30, 2010, we shipped approximately 22.9 million parcel returns, representing approximately 80.4% of the returns shipped through the PRS program during that period. Our parcel return solution simplifies the returns process by offering consumers pre-paid return via pickup by the USPS at the consumer’s home or workplace or via drop-off at any USPS collection box or Post Office. We create and host customer-branded websites in which consumers can initiate returns or exchanges, obtain return shipping labels, arrange for pickup at their residences, and track parcels. Intelligent barcodes embedded in our Newgistics SmartLabel provide our customers with order, product, and consumer data more quickly, enabling them to more efficiently manage their transportation and returns processing resources.
Reliable and cost-effective integrated parcel return and delivery network. Our transportation network is designed to meet the growing demand from direct-to-consumer retailers for a reliable, cost-effective, and convenient return and delivery service. We use our technology platform to integrate our SmartCenters and third-party carriers and rely on the USPS first-mile and last-mile network to provide a reliable residential transportation service with end-to-end shipment visibility. Over 97% of the measurable parcels we shipped in fiscal 2010 were delivered in less than seven business days, averaging less than 3.7 business days from receipt by us or the USPS to delivery. Because we process both deliveries and returns within a single network, we are able to procure transportation capacity at a lower cost by purchasing from third-party transportation providers on a round-trip basis, which reduces the transportation costs they incur repositioning equipment for subsequent loads. As our parcel volumes increase and density in our SmartCenters and third-party carrier network increases, we believe we will be able to lower our transportation and processing cost per parcel and reduce parcel transit time.
Flexible and customizable parcel solutions. Our parcel solutions allow our customers to customize their parcel delivery and return processes to support their own unique supply chain, customer service, and marketing strategies. We handle a wide range of mail and parcel classifications and, unlike the major integrated express and parcel carriers, we allow our customers to combine both mail and parcels into one
4
Table of Contents
Index to Financial Statements
shipment for pickup by us or delivery to our SmartCenters. Our SmartCenters and technology platform are designed to be flexible, allowing customers to optimize their own internal fulfillment and outbound tendering procedures without having to conform to our system. Our proprietary technology platform allows our customers to customize parcel sorting and routing based on shipment, product, and consumer information.
Scalable proprietary information technology platform. Our proprietary, web-based ILM technology platform provides parcel visibility, shipment level data transfer and reporting, and consumer-interfacing tools. We have invested significant resources in developing our industry leading ILM suite of solutions and enterprise tools. Our proprietary technology platform is capable of handling a significant increase in the number of customers we serve and shipments we process with minimal additional capital investment. Our applications can be integrated into our customers’ order, warehouse, billing, consumer relationship, and financial management systems, enabling real-time data transfer and customized data reporting based on the customer’s own preferences. We expect to continue to develop and offer new solutions to improve the efficiencies and performance of our customers’ supply chains, lower their operating costs, and enhance the satisfaction of their consumers.
High level of customer service. We have built our business on the principle of superior customer service, which is critical to our success. Each parcel solutions customer is assigned a dedicated account manager who is responsible for customer service. We train and empower our account managers and customer service representatives to resolve customer concerns as quickly as possible. Account managers are also responsible for identifying opportunities for improvement in our customers’ parcel processes and working with our sales, operations, and technology teams to design and implement enhancements to improve their performance. We operate a 24-hour customer call center where our team of customer service representatives are available via telephone, instant messaging, or e-mail to provide assistance regarding parcel tracking, handling instructions, shipment data transfer, or any other matter. We utilize a proactive customer service process to identify opportunities to do more for our customers and to increase customer retention.
Long-term relationships with our parcel solutions customers. Our parcel solutions customers include many leading U.S. direct-to-consumer retailers, consumer electronics manufacturers, and third-party logistics and fulfillment providers. We have established long-term relationships with many of our parcel solutions customers. Most of our parcel services contracts have initial terms of one to three years. We have experienced an 87.4% renewal rate of parcel solutions contracts expiring during the past three fiscal year period.
Non-asset based business model. Our non-asset based operating model enables us to scale our business up and down in response to changing business conditions. Furthermore, our operating model requires no investment in transportation equipment and minimal investment in facilities, which we believe enhances our returns on invested capital and assets. We obtain all of our network transportation capacity from third-party transportation providers and utilize the USPS for last-mile delivery and first-mile parcel pickup. All of our SmartCenter facilities are leased. Our net capital expenditures for fiscal 2008, 2009, and 2010, were $3.5 million, $2.9 million, and $2.2 million respectively, which represented 2.7%, 1.7%, and 1.3% of our total revenue, respectively. We believe our non-asset based business model enhances our ability to grow our revenue with relatively minimal capital investment.
Experienced senior management and postal operations team. We have attracted a knowledgeable and talented senior management team with extensive industry experience and a complementary mix of operational and technical capabilities, sales and marketing experience, and financial management skills. Our management team is led by our Chief Executive Officer, William J. Razzouk. Mr. Razzouk has substantial
5
Table of Contents
Index to Financial Statements
industry experience and previously has held various management positions with FedEx, ultimately serving as the Executive Vice President, Worldwide Customer Operations. We also have a postal operations team with extensive operational management experience with the USPS.
Our Strategy
Our objective is to strengthen our position as a leading provider of parcel transportation solutions and grow our parcel solutions and freight services businesses through the following strategies:
Expand our customer base. We intend to develop new long-term customer relationships by capitalizing on our leadership in parcel return solutions, our scalable technology, and our experience in the direct-to-consumer retail market. Historically, we have targeted high-volume, direct-to-consumer retailers that we believe value our solutions-based approach. Recently, we hired additional marketing and sales leadership and developed a targeted marketing strategy to expand our presence with middle market direct-to-consumer retailers. We also developed new technology solutions to facilitate the adoption of our solutions by these customers. We plan to continue to hire additional sales representatives, develop new technology solutions, and increase the use of demand-generation tools to identify and acquire new customers. We will continue to pursue high-volume, direct-to-consumer parcel customers as a significant component of our growth strategy.
Further penetrate our existing base of rapidly growing customers. We believe our existing customer base presents a significant opportunity for future growth. According to the U.S. Census Bureau, the electronic shopping and mail-order retail industry, the industry in which many of our parcel solutions customers participate, grew over three times faster than the overall retail industry from 2000 to 2010. We initiated our parcel return services in 2002 and established significant scale in return volumes before adding our delivery service offering in 2008. Many of our existing parcel returns customers would benefit from the operating efficiency and cost reduction we believe is achievable by also purchasing their parcel delivery solutions from us. In addition, we intend to expand our service offerings with our existing customers through the continued enhancement of our technology and processing capabilities.
Increase volumes to leverage existing parcel solutions infrastructure. In order to achieve our service delivery time commitments, we operate a scheduled transportation network that requires our transportation providers to depart our SmartCenters at a designated time regardless of shipment volumes. Although we do not own or lease transportation assets, our scheduled network design results in inherent operating leverage in our business model. As parcel volumes increase and excess purchased transportation capacity is absorbed, we achieve higher levels of capacity utilization resulting in a decrease in our transportation and processing cost per parcel. Our SmartCenter network and technology platform are capable of handling large increases in parcel volume with minimal additional capital investment or corresponding increases in operating costs. For example, the number of parcels shipped through our network increased from 26.8 million in fiscal 2008 to 41.3 million in fiscal 2010, or 54.1%, while our parcel solutions segment operating expenses increased from $18.9 million to $21.8 million, or 15.3%, during the same period.
Selectively pursue strategic acquisitions. We intend to actively pursue acquisitions of non-asset or asset-light logistics providers that complement our existing services and capabilities, diversify and further penetrate our customer base, and accelerate our earnings growth.
6
Table of Contents
Index to Financial Statements
Risks Affecting Us
Our business is subject to a number of risks that you should understand before making an investment decision. These risks are discussed more fully in the section titled “Risk Factors” following this prospectus summary. Some of these risks are:
| • | current and future competition could impair our business operations and financial condition; |
| • | we rely on the USPS to provide our parcel solutions; |
| • | a significant portion of our revenue is derived from a limited number of customers, and any loss of, or significant decrease in parcel volume from, these customers could harm our results of operations; |
| • | if our third-party carriers do not meet our needs or expectations, or those of our customers, our business could suffer; |
| • | any disruption in operations at our SmartCenter facilities could lead to significant costs and could reduce our revenue, harm our business reputation, and have a material adverse effect on our financial results; and |
| • | our business is particularly sensitive to changes in the economy, and the current U.S. and global economic climate may pose additional risks and exacerbate existing risks to our business. |
Corporate Information
We were incorporated in December 1999 and are headquartered in Austin, Texas. Our principal executive offices are located at 2700 Via Fortuna, Suite 300, Austin, Texas 78746. Our telephone number is (512) 225-6000. Our website address for our operations is www.newgistics.com. The information contained in, or that can be accessed through, our website is not part of this prospectus.
Newgistics®, SmartLabel®, Intelligent Returns Management®, Returns Marketing®, ReturnCart®, ReturnValet®, Advance Return Notification®, and “Returns Aren’t Just Boxes. They’re Customers®” are registered trademarks in the United States and are the property of Newgistics, Inc. Our unregistered trademarks include: Intelligent Logistics Management™, Flexship™, and SmartCenter™. This prospectus contains additional trade names, trademarks, and service marks of other companies. We do not intend our use or display of other companies’ trade names, trademarks, or service marks to imply a relationship with, or endorsement or sponsorship of us by, these other companies.
7
Table of Contents
Index to Financial Statements
THE OFFERING
| Common stock offered by us |
shares |
| Common stock offered by selling stockholders |
shares |
| Common stock to be outstanding after this offering |
shares |
| Over-allotment option |
shares |
| Use of proceeds |
We intend to use our net proceeds from this offering primarily to redeem all of the outstanding shares of our series F preferred stock and accrued dividends thereon for approximately $12.2 million and general corporate purposes, including working capital. We will not receive any of the proceeds from the sale of shares by the selling stockholders. See the section titled “Use of Proceeds.” |
| Proposed NASDAQ Global Select Market symbol |
NEWG |
The number of shares of common stock to be outstanding after this offering is based on 624,292,507 shares of our common stock outstanding as of April 2, 2011. Such number excludes:
| • | 115,146,802 shares issuable upon the exercise of options outstanding as of April 2, 2011, having a weighted-average exercise price of $0.07 per share; |
| • | 5,446,906 shares issuable upon the exercise of warrants outstanding as of April 2, 2011, having a weighted-average exercise price of $0.12 per share; |
| • | 7,740,054 additional shares available after April 2, 2011 for future grant under our 2000 Stock Option/Stock Issuance Plan, or 2000 Stock Plan; and |
| • | additional shares available after April 2, 2011 for future grant under our 2011 Equity Incentive Plan, or 2011 Equity Plan. |
Except as otherwise indicated, all information in this prospectus reflects and assumes (i) the reverse split of each outstanding share of our common stock into of a share of common stock prior to the effectiveness of the registration statement of which this prospectus is a part, (ii) the conversion of our preferred stock, other than series F preferred stock, into shares of common stock, (iii) no exercise by the underwriters of their over-allotment option, and (iv) no exercise of options or warrants outstanding as of April 2, 2011.
8
Table of Contents
Index to Financial Statements
SUMMARY HISTORICAL CONSOLIDATED FINANCIAL AND OTHER DATA
The following summary historical consolidated financial and other data for fiscal years 2008, 2009, and 2010 are derived from our audited consolidated financial statements. The following summary historical financial and other data for the three months ended April 3, 2010 and April 2, 2011 are derived from our unaudited consolidated financial statements and related notes included elsewhere in this prospectus. Our fiscal year ends on the Saturday closest to December 31 and consists of either 52 weeks or, as was the case for fiscal 2008, 53 weeks. Our 2008, 2009, and 2010 fiscal years ended on January 3, 2009, January 2, 2010, and January 1, 2011, respectively. You should read this data together with our audited consolidated financial statements and related notes included elsewhere in this prospectus and the information under the sections titled “Selected Consolidated Financial and Other Data” and “Management’s Discussion and Analysis of Financial Condition and Results of Operations.” See note 2 to our audited consolidated financial statements for a description of the calculation of basic and diluted net income (loss) per share. Additionally, our historical results are not necessarily indicative of the results expected for any future period.
9
Table of Contents
Index to Financial Statements
| Fiscal Year | First Fiscal Quarter | |||||||||||||||||||
| 2008 | 2009 | 2010 | 2010 | 2011 | ||||||||||||||||
| (unaudited) | ||||||||||||||||||||
| (in thousands, except per share and average parcel yield amounts) |
||||||||||||||||||||
| Revenue |
$ | 129,316 | $ | 168,714 | $ | 174,562 | $ | 42,672 | $ | 50,927 | ||||||||||
| Cost of revenue |
98,582 | 132,044 | 132,831 | 32,632 | 38,810 | |||||||||||||||
| Gross profit |
30,734 | 36,670 | 41,731 | 10,040 | 12,117 | |||||||||||||||
| Operating expenses: |
||||||||||||||||||||
| Selling, general and administrative |
25,126 | 26,060 | 26,113 | 6,458 | 7,816 | |||||||||||||||
| Research and development |
1,742 | 2,205 | 2,231 | 591 | 309 | |||||||||||||||
| Total operating expenses |
26,868 | 28,265 | 28,344 | 7,049 | 8,125 | |||||||||||||||
| Income from operations |
3,866 | 8,405 | 13,387 | 2,991 | 3,992 | |||||||||||||||
| Other income (expense): |
||||||||||||||||||||
| Interest and other income (expense), net |
104 | 62 | 10 | 9 | 1 | |||||||||||||||
| Change in fair value of interest rate swap |
(341 | ) | 174 | 145 | 34 | 21 | ||||||||||||||
| Change in fair value of preferred stock warrant liability |
- | 1,907 | 7,262 | 1,432 | 126 | |||||||||||||||
| Interest expense, including amortization of debt discount |
(1,425 | ) | (1,454 | ) | (939 | ) | (330 | ) | (25 | ) | ||||||||||
| Other income (expense), net |
(1,662 | ) | 689 | 6,478 | 1,145 | 123 | ||||||||||||||
| Income (loss) before income taxes |
2,204 | 9,094 | 19,865 | 4,136 | 4,115 | |||||||||||||||
| Income tax benefit (expense) |
1,617 | 4,054 | 1,565 | 523 | (2,051 | ) | ||||||||||||||
| Net income |
$ | 3,821 | $ | 13,148 | $ | 21,430 | $ | 4,659 | $ | 2,064 | ||||||||||
| Net income (loss) attributable to common stockholders: |
||||||||||||||||||||
| Basic |
$ | (2,243 | ) | $ | 792 | $ | 3,004 | $ | 687 | $ | 232 | |||||||||
| Diluted |
$ | (2,243 | ) | $ | 1,333 | $ | 14,168 | $ | 3,227 | $ | 1,938 | |||||||||
| Net income (loss) per share attributable to common stockholders: |
||||||||||||||||||||
| Basic |
$ | (0.03 | ) | $ | 0.01 | $ | 0.04 | $ | 0.01 | $ | 0.00 | |||||||||
| Diluted |
$ | (0.03 | ) | $ | 0.01 | $ | 0.02 | $ | 0.00 | $ | 0.00 | |||||||||
| Weighted-average shares used in computing net income (loss) per share attributable to common stockholders: |
||||||||||||||||||||
| Basic |
74,321 | 74,357 | 76,156 | 74,351 | 76,803 | |||||||||||||||
| Diluted |
74,321 | 133,832 | 870,361 | 892,414 | 759,937 | |||||||||||||||
| Pro forma net income attributable to common stockholders (unaudited): |
||||||||||||||||||||
| Net income |
$ | 21,430 | $ | 4,659 | $ | 2,064 | ||||||||||||||
| Change in fair value of preferred stock warrant liability |
(7,262 | ) | (1,432 | ) | (126 | ) | ||||||||||||||
| Pro forma net income attributable to common stockholders (unaudited) |
$ | 14,168 | $ | 3,227 | $ | 1,938 | ||||||||||||||
| Pro forma net income per share attributable to common stockholders (unaudited): |
||||||||||||||||||||
| Basic |
$ | 0.02 | $ | 0.01 | $ | 0.00 | ||||||||||||||
| Diluted |
$ | 0.02 | $ | 0.00 | $ | 0.00 | ||||||||||||||
| Pro forma weighted-average shares used in computing pro forma and pro forma as adjusted net income per share attributable to common stockholders (unaudited) (1): |
||||||||||||||||||||
| Basic |
628,277 | 626,472 | 628,924 | |||||||||||||||||
| Diluted |
697,859 | 695,953 | 701,669 | |||||||||||||||||
| Pro forma as adjusted net income attributable to common stockholders (unaudited) (2): |
||||||||||||||||||||
| Pro forma net income attributable to common stockholders (unaudited) |
$ | 14,168 | $ | 3,227 | $ | 1,938 | ||||||||||||||
| Decrease in net deferred tax asset valuation allowance (2) |
(6,572 | ) | (1,069 | ) | - | |||||||||||||||
| Pro forma as adjusted net income attributable to common stockholders (unaudited) (2) |
$ | 7,596 | $ | 2,158 | $ | 1,938 | ||||||||||||||
| Pro forma as adjusted net income per share attributable to common stockholders (unaudited) (2): |
||||||||||||||||||||
| Basic |
$ | 0.01 | $ | 0.00 | $ | 0.00 | ||||||||||||||
| Diluted |
$ | 0.01 | $ | 0.00 | $ | 0.00 | ||||||||||||||
| Consolidated statement of cash flows data: |
||||||||||||||||||||
| Net cash provided by (used in): |
||||||||||||||||||||
| Operating activities |
$ | 6,194 | $ | 7,066 | $ | 18,479 | $ | 4,153 | $ | 3,023 | ||||||||||
| Investing activities |
$ | (10,559 | ) | $ | (2,879 | ) | $ | (2,229 | ) | $ | (161 | ) | $ | (692 | ) | |||||
| Financing activities |
$ | 1,891 | $ | (2,115 | ) | $ | (17,311 | ) | $ | (6,912 | ) | $ | 82 | |||||||
| Other data: |
||||||||||||||||||||
| Total capital expenditures |
$ | 3,470 | $ | 2,883 | $ | 2,231 | $ | 163 | $ | 369 | ||||||||||
| Adjusted EBITDA (unaudited) (3) |
$ | 7,567 | $ | 12,781 | $ | 18,166 | $ | 4,221 | $ | 5,230 | ||||||||||
| Parcel volume (number of parcels) |
26,752 | 37,930 | 41,282 | 10,035 | 11,469 | |||||||||||||||
| Average parcel yield |
$ | 4.47 | $ | 4.23 | $ | 3.99 | $ | 4.03 | $ | 4.22 | ||||||||||
| Gross LTL carrier billings |
$ | 121,096 | $ | 94,674 | $ | 104,537 | $ | 23,929 | $ | 28,874 | ||||||||||
10
Table of Contents
Index to Financial Statements
| (1) | Pro forma and pro forma as adjusted basic weighted-average shares outstanding reflect the (i) effect of the reverse split of each outstanding share of our common stock into of a share of common stock prior to the effectiveness of the registration statement of which this prospectus is a part and (ii) conversion of our convertible preferred stock (using the if-converted method) into common stock, except for series F preferred stock, as though the conversion had occurred. Pro forma and pro forma as adjusted diluted weighted-average shares outstanding also reflects the effect of any dilutive stock options and warrants. |
| (2) | In fiscal 2010 and the first fiscal quarter of 2011, we decreased our valuation allowance for net deferred tax assets by $6.6 million and $1.1 million, respectively. As of April 2, 2011, no such valuation allowance remains. We have presented pro forma as adjusted net income attributable to common stockholders to remove the effect of the release of valuation allowance in fiscal 2010 as we do not expect a similar release in future years. |
| (3) | For further discussion regarding Adjusted EBITDA, see footnote (3) to the table in section titled “Selected Consolidated Financial and Other Data.” |
| As of April 2, 2011 | ||||||||||||
| Actual | Pro Forma (1) |
Pro Forma As Adjusted (2) |
||||||||||
| (in thousands) | ||||||||||||
| (unaudited) | ||||||||||||
| Consolidated balance sheet data: |
||||||||||||
| Cash |
$ | 4,545 | $ | 4,545 | $ | |||||||
| Working capital |
8,101 | 8,101 | ||||||||||
| Total assets |
50,954 | 50,954 | ||||||||||
| Long-term debt, including current portion |
- | - | ||||||||||
| Convertible preferred stock warrant liability |
457 | - | ||||||||||
| Total liabilities |
12,351 | 11,894 | ||||||||||
| Redeemable convertible preferred stock |
123,837 | 12,237 | ||||||||||
| Stockholders’ equity (deficit) |
$ | (85,234 | ) | $ | 26,823 | $ | ||||||
| (1) | The pro forma column in the balance sheet data table above reflects the (i) effect of the reverse split of each outstanding share of our common stock into of a share of common stock prior to the effectiveness of the registration statement of which this prospectus is a part, (ii) automatic conversion of all of our outstanding convertible preferred stock, except for series F, into 546,674,400 shares of common stock upon the completion of this offering, and (iii) reclassification of the preferred stock warrant liability to common stock and additional paid-in capital immediately prior to the closing of this offering. |
| (2) | The pro forma as adjusted column in the balance sheet data table above reflects (i) the effect of the reverse split of each outstanding share of our common stock into of a share of common stock, (ii) the automatic conversion of all of our outstanding convertible preferred stock, except for series F, into 546,674,400 shares of common stock upon the completion of this offering, (iii) the reclassification of the preferred stock warrant liability to common stock and additional paid-in capital immediately prior to the closing of this offering, (iv) our sale of shares of common stock in this offering at the initial public offering price of $ per share, which is the mid-point of the price range on the cover of this prospectus, and after deducting the underwriting discount and estimated offering expenses payable by us and the application of our net proceeds from this offering, and (v) our redemption of 85,017 remaining outstanding shares of series F preferred stock and payment of accrued dividends thereon for an aggregate amount of $12.2 million. |
11
Table of Contents
Index to Financial Statements
An investment in our common stock involves a high degree of risk. You should carefully consider the risks and uncertainties described below before deciding whether to purchase shares of our common stock. The trading price of our common stock could decline due to any of these risks, and you may lose all or part of your investment. In assessing these risks, you should also refer to the other information contained or incorporated by reference in this prospectus, including our consolidated financial statements and related notes.
Risks Related to Our Business
Current and future competition could impair our business operations and financial condition.
Competition in the direct-to-consumer parcel and third-party logistics, or 3PL, market is intense and highly sensitive to price and service level, especially in periods of little or no economic growth, such as the recent recession. We compete against asset-based and non-asset based transportation and logistics companies, some of which have greater financial and marketing resources than we do and more recognizable brands, including:
| • | global asset-based integrated parcel carriers, such as FedEx Corporation, or FedEx, and United Parcel Service, Inc., or UPS; |
| • | parcel consolidators that utilize the first-mile and last-mile delivery capabilities of the USPS; |
| • | regional parcel service providers that offer services in a specific market segment or service area; |
| • | 3PL providers that offer comprehensive transportation management solutions; |
| • | truckload carriers and less-than-truckload, or LTL, carriers; and |
| • | internal shipping departments of businesses with substantial transportation requirements. |
Historically, we have lost customers due to price competition and at times have elected to reduce prices or delay price increases in response to competitive pressure. Further rate pressure may adversely affect our revenue and income from operations.
There are many competitive factors that could impair our operating results, including the following:
| • | price competition by our competitors to gain or retain business, especially during times of declining growth rates in the economy, which competition may limit our ability to maintain or increase our rates, maintain our operating margins, or retain or grow our business; |
| • | the solicitation by shippers of bids from multiple carriers for their shipping needs and the resulting reduction in rates or loss of business to competitors; |
| • | additional competition if new competitors are attracted to the direct-to-consumer parcel market due to the market’s growth; |
| • | the development of competitive technology solutions by competitors with significant financial resources and experience in the direct-to-consumer parcel market; and |
| • | the offering by our competitors of comparable or a wider range of services. |
Increased competition may lead to reduced revenue and profit margins, or a loss of market share, any of which could harm our business.
If the USPS ceases to provide services to us, or materially and adversely modifies the terms of such services, our financial results would be substantially and adversely affected.
We rely on the USPS network to provide our parcel solutions. Our shipping services contract with the USPS may be terminated by us or the USPS with 30 days’ notice for any reason, and by the Postal Regulatory Commission at any time, and the USPS may terminate our PRS contract upon 30 days’ notice if the USPS determines that we have not complied with certain material provisions of the PRS contract. Without the USPS,
12
Table of Contents
Index to Financial Statements
we would be forced to cease offering our parcel solutions, which represent a substantial majority of our revenue.
The USPS has the ability to modify postal rates and to change the terms of programs in which we participate on a periodic basis. Many of our parcel solutions customer contracts have limits on the size of any USPS price increase that can be passed on to our customers, and any significant price increases could make us less competitive.
Further, from time to time, the future of the USPS and its current network are evaluated by lawmakers seeking to reduce federal budgets by closing USPS locations or reducing USPS services. To the extent that any actions related to the USPS are implemented and have an adverse effect on the services or pricing provided by the USPS to us, our business and financial results could be adversely affected.
Additionally, any disruption or significant change within the USPS network could impact our current or future postage costs and the level of service we can provide to our customers.
A significant portion of our revenue is derived from a limited number of customers, and any loss of, or significant decrease in parcel volume from, these customers could harm our results of operations.
Historically, we have experienced significant customer concentration. Revenue from our two largest customers, QVC and GENCO ATC, accounted for 20.8% and 16.3% of our total revenue in fiscal 2009, respectively, and 28.0% and 11.5% of our total revenue in fiscal 2010, respectively. Revenue from our ten largest customers in each of fiscal 2009 and 2010 together accounted for 57.8% and 57.4% of our total revenue, respectively. We are likely to continue to experience ongoing customer concentration. The loss or significant reduction of business from one or more of our major customers would adversely affect our results of operations. In addition to the loss of revenue, our network efficiency and margins on our remaining business would be adversely affected at reduced volumes.
If our third-party carriers do not meet our needs or expectations, or those of our customers, our business could suffer.
The success of our business depends on our ability to meet our customers’ service expectations. We do not own or control the transportation assets or operations of the carriers that transport our customers’ parcels or freight, and we do not employ the people directly involved in delivering the parcels or freight. In addition to the USPS, we rely on other independent third-parties, including our competitors, to provide truckload, LTL, and courier services. If we are unable to secure sufficient and quality transportation services to meet our commitments to our customers, our customers might switch to our competitors temporarily or permanently and our operating results could be adversely affected. Many of these risks are beyond our control and difficult to anticipate, including:
| • | quality issues with respect to services provided by the carriers that transport our customers’ parcel or freight; |
| • | changes in rates charged by transportation providers; |
| • | supply shortages in the transportation industry; |
| • | interruptions in service or stoppages in transportation as a result of labor disputes; |
| • | negligence, theft, or other damage to assets being shipped; and |
| • | changes in regulations impacting the transportation industry. |
If any of the third parties we rely on do not meet our needs or expectations, or those of our customers, our professional reputation may be damaged and our business could be harmed.
13
Table of Contents
Index to Financial Statements
Any disruption in operations at our SmartCenter facilities could lead to significant costs and could reduce our revenue, harm our business reputation, and have a material adverse effect on our financial results.
We process each parcel we transport in one of our six SmartCenter facilities. Please see the section titled “Business—Facilities.” Any destruction, failure, impairment, or downtime in one of our SmartCenter facilities could affect a significant percentage of our parcel solutions customers. The destruction, failure, or impairment of any of our SmartCenter facilities would require us to redistribute parcels to our remaining SmartCenter facilities and could result in a significant increase in the time it takes us to process and transport parcels. Since our ability to attract and retain customers depends on our ability to provide customers with reliable and timely service, interruptions in our service could harm our reputation. The services we provide are subject to failure resulting from numerous factors, including:
| • | human error or accidents; |
| • | power loss; |
| • | equipment failure; |
| • | improper building maintenance in the buildings in which our facilities are located; |
| • | security breaches; |
| • | fires, earthquakes, hurricanes, tornadoes, floods, and other natural disasters; |
| • | epidemics; |
| • | water damage; |
| • | terrorism; |
| • | theft, sabotage, and vandalism; and |
| • | failure by us or our vendors to provide adequate service to our equipment. |
Any interruptions could cause our customers to seek damages for losses incurred, require us to replace existing equipment, damage our reputation, cause existing customers to cancel or elect to not renew their contracts with us, and make it more difficult for us to attract new customers. Any of these events could materially increase our expenses or reduce our revenue, which would have a material adverse effect on our operating results.
Our business is particularly sensitive to changes in the economy. The current U.S. and global economic climate may pose additional risks and exacerbate existing risks to our business.
The transportation industry is especially susceptible to trends in economic activity, such as the recent recession. Our primary business is to transport goods, so our business levels are directly tied to the purchase and production of goods—key macro-economic measurements. When individuals and businesses purchase and produce fewer goods, fewer goods are transported. Additionally, economic conditions may adversely affect our customers’ business levels, the amount of services they need, and their ability to pay for our services. Continued or increased economic weakness could have a material adverse effect on our business or financial condition.
If our senior management team and our postal operations team do not remain with us in the future, our business, operating results, and financial condition could be adversely affected.
We have been successful in attracting a knowledgeable and talented senior management team and postal operations team. Our future success will depend to a significant extent on the continued services of the members of our senior management team and our postal operations team. The loss of services provided by any
14
Table of Contents
Index to Financial Statements
one of these individuals could adversely affect our business, operating results and financial condition, and could divert senior management time in searching for one or more replacements.
If we are unable to attract additional sales representatives, or if a significant number of our sales representatives leave us, our ability to increase our revenue could be negatively impacted.
Our ability to expand our business will depend, in part, on our ability to attract additional sales representatives. Competition for qualified sales representatives can be intense, and we may be unable to hire them when we need them or at all. Any difficulties we experience in attracting additional sales representatives could have a negative impact on our ability to expand our customer base, increase revenue, and continue our growth.
In addition, we must retain our current sales representatives and properly incentivize them to obtain new customers. If a significant number of our sales representatives were to leave us or join our competitors, our revenue could be negatively impacted. In certain circumstances, we have entered into agreements with our sales representatives that contain non-compete provisions to mitigate this risk, but we may need to litigate to enforce our rights under these agreements, which could be time-consuming, expensive, and ineffective. A significant increase in the turnover rate among our current sales representatives could also increase our recruiting costs and decrease our operating efficiency, which could lead to a decline in the demand for our services.
If we are unable to maintain the level of service we currently provide to our customers, our reputation may be damaged, resulting in a loss of business.
We compete with other transportation providers based on reliability, delivery time, security, visibility, and personalized service. If we are unable to deliver our services in a timely, reliable, secure, and personalized manner while providing visibility into delivery or return status of our parcels, our reputation and business may suffer.
We may not be able to continue to add new customers, and retain and increase sales to our existing customers, which could adversely affect our operating results.
Our revenue growth is dependent on our ability to continually attract new customers and retain existing customers, while expanding our service offerings. Growth in the demand for our solutions may be inhibited, and we may be unable to sustain growth in our customer base for a number of reasons, including, but not limited to:
| • | challenges in marketing our solutions in a cost-effective manner to new customers or in new markets; |
| • | difficulty in expanding sales to existing customers; |
| • | our inability to build and promote our brand; and |
| • | real or perceived problems with our delivery time, reliability, security, visibility, or service. |
Our obligation to pay the USPS and other carriers is not contingent upon receipt of payment from our customers, and we extend credit to certain customers as part of our business model.
In our parcel solutions business, we take full risk of credit loss for the transportation services we procure from the USPS and other carriers. Our obligation to pay our carriers is not contingent upon receipt of payment from our customers. If any significant customer fails to pay for our services, our operating results would be negatively impacted.
We extend credit to certain customers in the ordinary course of business as part of our business model. By extending credit, we increase our exposure to uncollected receivables. The current economic conditions have resulted in an increasing trend of business failures, downsizing, and delinquencies, which may cause an
15
Table of Contents
Index to Financial Statements
increase in our credit risk. If we fail to monitor and manage effectively any increased credit risk, our immediate and long-term liquidity may be adversely affected.
If we are unable to maintain our proprietary, web-based technology platform, our business would be adversely affected.
The provision and application of information technology is an important competitive factor in the direct-to-consumer parcel market. Among other things, our information systems must frequently interact with those of our customers and transportation providers. Our future success will depend on our ability to deploy technology that meets industry standards and customer demands. Although there are redundancy systems and procedures in place, the failure of the hardware or software that supports our information technology systems could significantly disrupt customer workflows and cause economic losses for which we could be held liable and which would damage our reputation.
We rely heavily on our proprietary, web-based technology platform to track and store externally and internally generated market data, analyze the capabilities of our carrier network, and select cost-effective carriers in the appropriate transportation mode. To keep pace with changing technologies and customer demands, we must correctly interpret and address market trends and enhance the features and functionality of our proprietary technology platform in response to these trends, which may lead to significant ongoing research and development costs. We may be unable to accurately determine the needs of our customers and the trends in the direct-to-consumer parcel market or to design and implement the appropriate features and functionality of our technology platform in a timely and cost-effective manner, which could result in decreased demand for our services and a corresponding decrease in our revenue. Despite testing, we may be unable to detect defects in existing or new versions of our proprietary software, or errors may arise in our software. Any failure to identify and address such defects or errors could result in loss of revenue or market share, liability to customers or others, diversion of resources, injury to our reputation, and increased service and maintenance costs. Correction of such errors could prove to be impossible or very costly, and responding to resulting claims or liability could similarly involve substantial cost.
In addition, our competitors may have or may develop information technology systems that permit them to be more cost-effective and otherwise better situated to meet customer demands than we are able to develop. Larger competitors may be able to develop or license information technology systems more cost-effectively than we can by spreading the cost across a larger customer base, and competitors with greater financial resources may be able to develop or purchase information technology systems that we cannot afford. If we fail to meet the demands of our customers or protect against disruptions of both our and our customers’ operations, we may lose customers, which could seriously harm our business and adversely affect our operating results and operating cash flow.
Further, we license from third parties a variety of software that is used in our technology platform. As a result, the success and functionality of our technology platform is dependent upon our ability to continue to license the software components upon which it is built. There can be no assurances that we will be able to maintain these licenses or replace the functionality provided by this software on commercially reasonable terms or at all. Additionally, while we are not aware of any infringement, we could be subject to claims of infringement in the future. The failure to maintain these licenses or any significant delay in the replacement of, or interference in, our use of this software or any claims of infringement, even those without merit, could have a material adverse effect on our business, financial condition, and results of operations.
Our ability to provide our proprietary, web-based services relies heavily on our telecommunication service providers, our electronic delivery systems, and the internet, which exposes us the risk of increased prices and disruptions of essential services.
Our ability to deliver our proprietary, web-based services depends upon the capacity, reliability, and security of services provided to us by our telecommunication service providers, our electronic delivery systems, and the
16
Table of Contents
Index to Financial Statements
internet. We have little or no control over the operation, quality, or maintenance of these services or whether the vendors will improve their services or continue to provide services that are essential to our business. In addition, our telecommunication service providers may increase the prices at which they provide services, which would increase our costs. If our telecommunication service providers were to cease to provide essential services or to significantly increase their prices, we could experience significant delays in obtaining new or replacement services, which could significantly harm our reputation and could cause us to lose customers and revenue. Moreover, our ability to deliver information using the internet may be impaired because of infrastructure failures, service outages at third-party internet providers, or increased government regulation. If disruptions, failures, or impairments of our electronic delivery systems or the internet occur, our ability to effectively provide technology-enabled transportation and supply chain management services and to serve our customers could be impaired.
A significant privacy breach could adversely affect our business, and we may be required to increase our spending on data security.
The provision of service to our customers and the operation of our network involve the storage and transmission of proprietary information and sensitive or confidential data, including personal information of customers, employees, and others. Breaches in security could expose us, our customers, or the individuals affected to a risk of loss or misuse of this information, resulting in litigation and potential liability for the company, as well as the loss of existing or potential customers, damage to our brand and reputation, or disruptions in our operations. In addition, the cost and operational consequences of implementing further data protection measures could be significant.
We may not be able to identify suitable acquisition candidates, effectively integrate newly acquired businesses, or achieve expected operating results from acquisitions.
Part of our growth strategy is to increase our revenue and improve our operating results through the acquisition of complementary businesses. There can be no assurance that suitable candidates for acquisitions will be identified or, if suitable candidates are identified, that acquisitions can be completed on acceptable terms, if at all.
In 2007, we added parcel delivery solutions and freight transportation management services through our acquisitions of Cornerstone Shipping Solutions, Inc. and Newgistics Freight Services, Inc., formerly known as Logistics Management, Inc. We may continue to make acquisitions in the future. The success of our acquisitions will depend on our ability to identify, negotiate, complete, and integrate businesses and, if necessary, to obtain satisfactory debt or equity financing to fund those acquisitions. If we finance an acquisition with debt financing, we will incur interest expense and may have to comply with financing covenants or secure that debt obligation with our assets. Further, mergers and acquisitions are inherently risky, and any mergers and acquisitions we complete may not be successful. Any mergers and acquisitions we do would involve numerous risks, any of which could have a material adverse effect on our business and the market price of our common stock, including the following:
| • | failure of the acquired company to achieve anticipated revenue, earnings, or cash flows; |
| • | assumption of liabilities that were not disclosed to us or that exceed our estimates; |
| • | difficulties in integrating and managing the combined operations, technologies, and service offerings; |
| • | diversion of our management’s attention or other resources from our existing business; |
| • | our inability to maintain the key business relationships and the reputations of the businesses we acquire; |
| • | uncertainty of entry into markets in which we have limited or no prior experience or in which competitors have stronger market positions; |
17
Table of Contents
Index to Financial Statements
| • | our dependence on unfamiliar affiliates and partners of the companies we acquire; |
| • | insufficient revenue to offset our increased expenses associated with acquisitions; |
| • | our responsibility for the liabilities of the businesses we acquire; |
| • | our inability to maintain internal standards, controls, procedures, and policies; |
| • | potential accounting charges; |
| • | potential loss of key employees of the companies we acquire; and |
| • | dilution of our stockholders’ ownership interests if we finance all or any portion of the purchase price of any acquisition by issuing equity. |
If we fail to protect our intellectual property rights, our competitive position could be harmed or we could incur significant expense to enforce our rights.
We depend on our ability to protect our proprietary technology. We rely on trade secret, patent, copyright and trademark laws, and confidentiality agreements with employees and third parties, all of which offer only limited protection. The steps we have taken to protect our proprietary rights may not be adequate to preclude misappropriation of our proprietary information or infringement of our intellectual property rights, and our ability to police such misappropriation or infringement is uncertain. We have two issued patents, which may be contested, circumvented, or invalidated. Further, we do not know whether any of our pending patent applications will result in the issuance of patents or whether the examination process will require us to narrow our claims, and even if patents are issued, they may be contested, circumvented, or invalidated. Moreover, the rights granted under any issued patents may not provide us with a competitive advantage, and, as with any technology, competitors may be able to develop similar or superior technologies to our own, now or in the future. For example, our Intelligent Returns Management, or IRM, solution incorporates our patented technology. As a substantial portion of our total revenue is generated from customers that use IRM, any loss of our patent rights or circumvention of our patents by competitors may result in a loss of competitive advantage and could adversely affect our operating results.
In addition to patented technology, we rely upon unpatented proprietary technology, processes, and know-how. We generally seek to protect this information in part by entering into confidentiality agreements with our employees, consultants, and third parties. These agreements may be breached, and we may not have adequate remedies for any such breach. In addition, our trade secrets may otherwise become known or be independently developed by competitors. If we are unable to protect the confidentiality of our proprietary information and know-how, the value of our technology and products could be adversely affected, which could in turn adversely affect our business, financial condition, and results of operations.
Protecting against the unauthorized use of our trademarks and other proprietary rights is expensive, difficult, time consuming, and, in some cases, impossible. Litigation may be necessary in the future to enforce or defend our intellectual property rights, to protect our trade secrets, or to determine the validity or scope of the proprietary rights of others. Such litigation could result in substantial cost and diversion of management resources, either of which could harm our business, financial condition, and operating results. Furthermore, many of our current and potential competitors have the ability to dedicate substantially greater resources to enforce their intellectual property rights than we do. Accordingly, despite our efforts, we may not be able to prevent third parties from infringing upon or misappropriating our intellectual property.
Significant fluctuations in LTL prices and capacity could have an adverse impact on our freight services business.
We negotiate contract rate schedules with LTL carriers on behalf of our freight services customers. These rate schedules are established in contracts between us and the LTL carriers and are generally fixed for one year,
18
Table of Contents
Index to Financial Statements
providing our customers with the assurance of fixed transportation rates and fuel surcharge schedules for one year. However, our customers are not obligated to use us exclusively for their freight services needs. Significant fluctuations in LTL prices or capacity could result in a lower “spot” rate, or the rate charged for a single shipping transaction, which could make our prices less competitive and cause customer attrition, which could result in an adverse impact on our revenue and operating results.
We may need additional capital in the future, which may not be available to us on favorable terms, or at all, and may dilute your ownership of our common stock.
After this offering, we will have an aggregate of shares of common stock authorized but unissued and not reserved for issuance under our stock option plans or otherwise. We may issue all of these shares without any action or approval by our stockholders, subject to certain limitations of the NASDAQ Global Select Market. We may require additional capital from equity or debt financing in the future in order to take advantage of strategic opportunities, including more rapid expansion of our business or the acquisition of complementary service offerings, technologies, or businesses, or simply to provide capital to support our existing business. We may not be able to secure timely additional financing on favorable terms, or at all. The terms of any additional financing may place limits on our financial and operating flexibility. If we raise additional funds or finance acquisitions through further issuances of equity, convertible debt securities, or other securities convertible into equity, you and our other stockholders could suffer significant dilution in your percentage ownership of our company, and any new securities we issue could have rights, preferences, and privileges senior to those of holders of our common stock, including shares of common stock sold in this offering. If we are unable to obtain adequate financing or financing on terms satisfactory to us, if and when we require it, our ability to grow or support our business and to respond to business challenges could be significantly limited.
We are subject to claims arising from services provided by third-party carriers we engage for transportation services.
We use the services of various third-party transportation carriers. From time to time, the drivers employed and engaged by the carriers with whom we contract are involved in accidents which may result in damage to parcels or serious personal injuries. In addition, from time to time, parcels may be lost, stolen, or otherwise damaged during transport. The resulting types and amounts of damages may be excluded by or exceed the amount of insurance coverage maintained by the contracted carrier. Although these drivers are not our employees and all of these drivers are employees, owner-operators, or independent contractors working for carriers, claims have been and, in the future may be, asserted against us for their actions, or for our actions in retaining them. Claims against us may exceed the amount of our insurance coverage, or may not be covered by insurance at all. A material increase in the frequency or severity of accidents, liability claims, or workers’ compensation claims, or unfavorable resolutions of claims could materially and adversely affect our customer relationships and operating results. In addition, significant increases in insurance costs or the inability to purchase insurance as a result of these claims could reduce our profitability.
If our employees were to unionize, our operating costs would likely increase.
Our employees are not currently represented by a collective bargaining agreement. However, we have no assurance that our employees will not unionize in the future, which could increase our operating costs, force us to alter our operating methods, and have a material adverse effect on our operating results.
We are subject to business risks and increasing costs associated with the direct-to-consumer parcel and 3PL markets, including seasonality, that are largely out of our control, any of which could have a material adverse effect on our business, financial condition, and results of operations.
We are subject to business risks and increasing costs associated with the direct-to-consumer parcel and 3PL markets that are largely out of our control, any of which could adversely affect our business, financial condition, and results of operations. The factors contributing to these risks and costs include weather, excess
19
Table of Contents
Index to Financial Statements
capacity in the transportation industry, terrorist attacks, rising insurance premiums, the risk of outbreak of epidemics, and the risk of widespread disruption of our technology systems. Our results of operations may also be affected by seasonal factors.
We may be sued by third parties for infringement of their intellectual or proprietary rights.
Our use of our proprietary, web-based technology to provide our services could be challenged by claims that such use infringes, misappropriates or otherwise violates the intellectual property rights of a third party. Any intellectual property claims, with or without merit, could be time-consuming and costly to resolve, could divert management’s attention from our business, and could require us to pay substantial monetary damages. Any settlement or adverse judgment resulting from such a claim could require us to enter into a licensing agreement to continue using the technology that is the subject of the claim, or could otherwise restrict or prohibit our use of such technology. There can be no assurance that we would be able to obtain a license on commercially reasonable terms, if at all, from the party asserting an infringement claim, or that we would be able to develop or license a suitable alternative technology to permit us to continue offering the affected services to our customers. A claim, with or without merit, could result in substantial costs and divert management’s attention.
Inflation could materially increase our operating expenses, which could have a material adverse affect on our results of operations.
Inflation can have an impact on our operating costs. Inflation could cause interest rates, fuel, wages, and other costs to increase, which would adversely affect our results of operations unless freight rates correspondingly increase, in the case of our freight services business, and unless we are able to increase prices, in the case of our parcel solutions business.
High fuel prices may increase third-party carrier prices, and to the extent we are unable to pass such increased costs on to our customers, our financial results would be adversely affected.
Fuel prices have increased in 2011 and continue to be volatile and difficult to predict. In the event fuel prices continue to rise, third-party carriers can be expected to charge higher prices to cover their higher operating expenses. Our gross profits and income from operations will be adversely affected if we are unable to pass these increased expenses to our customers through fuel surcharges or otherwise.
20
Table of Contents
Index to Financial Statements
Risks Related to this Offering and Ownership of Our Common Stock
The trading price of our common stock is likely to be volatile, and you might not be able to sell your shares at or above the initial public offering price.
The trading price of our common stock following this offering may be highly volatile and could be subject to wide fluctuations in response to various factors, including but not limited to, those described in this “Risk Factors” section, some of which are beyond our control. Furthermore, our common stock has no prior trading history. Factors affecting the trading price of our common stock will include:
| • | variations in our operating results or the operating results of similar companies; |
| • | announcements of technological innovations, new services or service enhancements, and strategic alliances or agreements by us or by our competitors; |
| • | marketing and advertising initiatives by us or our competitors; |
| • | the gain or loss of customers; |
| • | threatened or actual litigation; |
| • | recruitment or departure of senior management or postal operations personnel; |
| • | changes in the estimates of our operating results or changes in recommendations by any securities analysts that follow our common stock; |
| • | market conditions in our industry, the industries of our customers, and the economy as a whole; |
| • | the overall performance of the equity markets; |
| • | sales of shares of our common stock by existing stockholders; |
| • | volatility in our stock price, which may lead to higher stock-based compensation expense under applicable accounting standards; and |
| • | adoption or modification of regulations, policies, procedures, or programs applicable to our business. |
In addition, the stock market in general, and the markets for technology or parcel and freight transportation services companies, have experienced extreme price and volume fluctuations that have often been unrelated or disproportionate to the operating performance of those companies. Broad market and industry factors may harm the market price of our common stock regardless of our actual operating performance. These fluctuations may even be more pronounced in the trading market for our stock shortly following this offering. Each of these factors, among others, could adversly affect your investment in our common stock. Some companies that have had volatile market prices for their securities have had securities class action lawsuits filed against them. If a suit were filed against us, regardless of its merits or outcome, it could result in substantial costs and divert management’s attention.
Our securities have no prior market and our stock price may decline after the offering.
Prior to this offering, there has been no public market for shares of our common stock. Although we have applied to have our common stock quoted on the NASDAQ Global Select Market, an active public trading market for our common stock may not develop or, if it develops, may not be maintained after this offering. We and the representatives of the underwriters will negotiate to determine the initial public offering price. The initial public offering price may be higher than the trading price of our common stock following this offering. As a result, you could lose all or part of your investment.
21
Table of Contents
Index to Financial Statements
Insiders will continue to have substantial control over us after this offering, which may limit our stockholders’ ability to influence corporate matters and delay or prevent a third party from acquiring control over us.
Upon completion of this offering, our directors and executive officers and their affiliates will beneficially own, in the aggregate, approximately % of our outstanding common stock compared to % represented by the shares sold in this offering. Further, we anticipate that Kenneth P. DeAngelis and Philip S. Siegel, members of our board of directors and general partners of Austin Ventures, and entities affiliated with Austin Ventures, will hold an aggregate of approximately % of our common stock following this offering. This significant concentration of ownership may adversely affect the trading price for our common stock because investors often perceive disadvantages in owning stock in companies with controlling stockholders. In addition, these stockholders will be able to exercise influence over all matters requiring stockholder approval, including the election of directors and approval of corporate transactions, such as a merger or other sale of our company or its assets. This concentration of ownership could limit your ability to influence corporate matters and may have the effect of delaying or preventing a change in control, including a merger, consolidation, or other business combination involving us, or discouraging a potential acquirer from making a tender offer or otherwise attempting to obtain control, even if that change in control would benefit our other stockholders. For information regarding the ownership of our outstanding stock by our executive officers and directors and their affiliates, please see the section titled “Principal and Selling Stockholders.”
Our stock price could decline due to the large number of outstanding shares of our common stock eligible for future sale.
Sales of substantial amounts of our common stock in the public market following this offering, or the perception that these sales could occur, could cause the market price of our common stock to decline. These sales could also make it more difficult for us to sell equity or equity-related securities in the future at a time and price that we deem appropriate.
Upon completion of this offering, we will have shares of common stock outstanding. The shares sold in this offering will be immediately tradable without restriction. Of the remaining shares, shares will be eligible for sale upon the expiration of lock-up agreements subject in some cases to volume and other restrictions under Rules 144 and 701 under the Securities Act of 1933, as amended, or the Securities Act, and various vesting agreements. In addition, shares subject to outstanding warrants, and shares that are subject to outstanding options, will become eligible for sale in the public market to the extent permitted by the provisions of various vesting agreements, the lock-up agreements and Rules 144 and 701 under the Securities Act. If these additional shares are sold, or if it is perceived that they will be sold, in the public market, the trading price of our common stock could decline.
The lock-up agreements expire 180 days after the date of this prospectus, except that the 180-day period may be extended in certain cases for up to 34 additional days under certain circumstances where we announce or pre-announce earnings or a material event occurs within approximately 17 days prior to, or approximately 16 days after, the termination of the 180-day period. The representatives of the underwriters may, in their sole discretion and at any time without notice, release all or any portion of the securities subject to lock-up agreements.
Following this offering, holders of % of our common stock not sold in this offering will be entitled to rights with respect to the registration of these shares under the Securities Act. Please see the section titled “Description of Capital Stock—Registration Rights.” If we register their shares of common stock following the expiration of the lock-up agreements, these stockholders could sell those shares in the public market without being subject to the volume and other restrictions of Rule 144 and Rule 701.
22
Table of Contents
Index to Financial Statements
After this offering, we intend to register approximately shares of our common stock that we have issued or may issue under our equity plans. Of these shares, shares will be eligible for sale upon the exercise of vested options after the expiration of the lock-up agreements.
Our management team has limited experience managing a public company, and compliance efforts may divert its attention from the day-to-day management of our business.
The individuals who now constitute our management team have limited experience managing a publicly traded company and limited experience complying with the increasingly complex laws pertaining to public companies. Our management team may not successfully or efficiently manage our transition into a public company that will be subject to significant oversight and reporting obligations under federal securities laws. In particular, these new obligations will require substantial attention from our senior management and divert their attention away from the day-to-day management of our business, which could materially and adversely impact our business operations.
We will incur significant increased expenses and administrative burdens as a public company, which could have a material adverse effect on our operations and financial results.
We will face increased legal, accounting, administrative, and other costs and expenses as a public company that we do not incur as a private company. The Sarbanes-Oxley Act of 2002, or the Sarbanes-Oxley Act, including the requirements of Section 404, as well as rules and regulations subsequently implemented by the Securities and Exchange Commission, or SEC, the Public Company Accounting Oversight Board, and the NASDAQ Global Select Market, impose additional reporting and other obligations on public companies. We expect that compliance with public company requirements will increase our costs and make some activities more time-consuming. A number of those requirements will require us to carry out activities we have not done previously. For example, we will create new board committees and adopt new internal controls and disclosure controls and procedures. In addition, we will incur additional expenses associated with our SEC reporting requirements. For example, under Section 404 of the Sarbanes-Oxley Act, for our annual report on Form 10-K for our fiscal year ending December 30, 2012, we will need to document and test our internal control procedures, our management will need to assess and report on the effectiveness of our internal control over financial reporting, and our independent accountants will need to issue an opinion on the effectiveness of those controls. Furthermore, if we identify any issues in complying with those requirements (for example, if we or our auditors identify a material weakness or significant deficiency in our internal control over financial reporting), we could incur additional costs rectifying those issues, and the existence of those issues could adversely affect us, our reputation, or investor perceptions of us. We also expect that it will be more expensive to obtain director and officer liability insurance. Risks associated with our status as a public company may make it more difficult for us to attract and retain qualified persons to serve on our board of directors or as executive officers. We expect that the additional reporting and other obligations imposed on us by these rules and regulations will increase our legal and financial compliance costs and the costs of our related legal, accounting, and administrative activities by approximately $1.0 million per year. These increased costs will require us to divert a significant amount of money that we could otherwise use to expand our business and achieve our strategic objectives. Advocacy efforts by stockholders and third-parties may also prompt even more changes in governance and reporting requirements, which could further increase our costs.
If we fail to maintain proper and effective internal controls, our ability to produce accurate and timely financial statements could be impaired, which could harm our operating results, our ability to operate our business, and investors’ views of us.
Ensuring that we have adequate internal financial and accounting controls and procedures in place so that we can produce accurate financial statements on a timely basis is a costly and time-consuming effort that needs to be re-evaluated frequently. Our internal control over financial reporting is a process designed to provide reasonable assurance regarding the reliability of financial reporting and the preparation of financial statements in accordance with U.S. generally accepted accounting principles. We are in the process of documenting,
23
Table of Contents
Index to Financial Statements
reviewing and improving our internal controls and procedures for compliance with Section 404 of the Sarbanes-Oxley Act, which requires annual management assessment of the effectiveness of our internal control over financial reporting and a report by our independent auditors. Both we and our independent auditors will be testing our internal controls in connection with the audit of our financial statements for the fiscal year ending December 30, 2012. If we fail to maintain proper and effective internal controls, our ability to produce accurate and timely financial statements could be impaired, which could harm our operating results, harm our ability to operate our business, and reduce the trading price of our stock.
If securities or industry analysts do not publish research or publish unfavorable or misleading research about our business, our stock price and trading volume could decline.
The trading market for our common stock will depend in part on the research and reports that securities or industry analysts publish about us or our business. We do not currently have and may never obtain research coverage by securities and industry analysts. If no or few securities or industry analysts commence coverage of our company, the trading price for our stock would be negatively impacted. In the event we obtain securities or industry analyst coverage, if one or more of the analysts who covers us downgrades our stock or publishes unfavorable or misleading research about our business, our stock price would likely decline. If one or more of these analysts ceases coverage of our company or fails to publish reports on us regularly, we could lose visibility in the market for our stock and demand for our stock could decrease, which could cause our stock price or trading volume to decline.
Because our initial public offering price is substantially higher than the pro forma as adjusted net tangible book value per share of our outstanding common stock, new investors will experience immediate and substantial dilution as a result of this offering and future equity issuances.
We expect the initial public offering price per share of our common stock to be substantially higher than the pro forma as adjusted net tangible book value per share of our common stock based on the total value of our tangible assets less our total liabilities immediately following this offering. As a result, investors purchasing common stock in this offering will experience immediate and substantial dilution of approximately $ per share, the difference between the price you pay for our common stock and its pro forma as adjusted net tangible book value after the completion of this offering. Any issuance of shares in connection with the exercise of stock options, warrants, or otherwise would dilute the percentage ownership held by the investors who purchase our shares in this offering.
Anti-takeover provisions in our charter documents and Delaware law could discourage, delay, or prevent a change in control of our company and may affect the trading price of our common stock.
We are a Delaware corporation and the anti-takeover provisions of the Delaware General Corporation Law, which apply to us, may discourage, delay or prevent a change in control by prohibiting us from engaging in a business combination with an interested stockholder for a period of three years after the stockholder becomes an interested stockholder, even if a change in control would be beneficial to our existing stockholders. For more information, see the section titled “Description of Capital Stock—Anti-Takeover Effects of Our Charter and Bylaws and Delaware Law.” In addition, our amended and restated certificate of incorporation and amended and restated bylaws may discourage, delay or prevent a change in our management or control over us that stockholders may consider favorable. Our amended and restated certificate of incorporation and amended and restated bylaws, which will be in effect as of the closing of this offering:
| • | authorize the issuance of “blank check” convertible preferred stock that could be issued by our board of directors to defend against a takeover attempt; |
| • | establish a classified board of directors, as a result of which the successors to the directors whose terms have expired will be elected to serve from the time of election and qualification until the third annual meeting following their election; |
24
Table of Contents
Index to Financial Statements
| • | require that directors only be removed from office for cause and only upon a supermajority stockholder vote; |
| • | provide that vacancies on the board of directors, including newly created directorships, may be filled only by a majority vote of directors then in office rather than by stockholders; |
| • | prevent stockholders from calling special meetings; and |
| • | prohibit stockholder action by written consent, requiring all actions to be taken at a meeting of the stockholders. |
We currently do not intend to pay dividends on our common stock and, consequently, your only opportunity to achieve a return on your investment is if the price of our common stock appreciates.
We currently do not plan to declare dividends on shares of our common stock in the foreseeable future. Any payment of future dividends will be at the discretion of our board of directors, subject to compliance with certain covenants contained in our credit facility, which limit our ability to pay dividends, and will depend on our financial condition, results of operations, capital requirements, general business conditions, and other factors that our board of directors may deem relevant. For more information, see the section titled “Dividend Policy.” Consequently, your only opportunity to achieve a return on your investment in our company will be if the market price of our common stock appreciates and you sell your shares at a profit. There is no guarantee that the price of our common stock that will prevail in the market after this offering will ever exceed the price that you pay.
Our management will have broad discretion over the use of the proceeds we receive in this offering and might not apply those proceeds in ways that increase the value of your investment.
Our management will have broad discretion to use the net proceeds from this offering, and you will be relying on the judgment of our management regarding the application of these proceeds. Our management might not apply the net proceeds of this offering in ways that increase the value of your investment. We expect to use approximately $12.2 million of the net proceeds from this offering to redeem our outstanding series F preferred stock and pay accrued dividends thereon, and the balance for general corporate purposes, including working capital and capital expenditures, which may in the future include investments in, or acquisitions of, complementary businesses, services or technologies. We have not allocated the net proceeds for general corporate purposes to any specific purpose. Our management might not be able to yield a significant return, if any, on any investment of these net proceeds. You will not have the opportunity to influence our decisions on how the net proceeds from this offering are used. For more information, please see the section titled “Use of Proceeds.”
25
Table of Contents
Index to Financial Statements
SPECIAL NOTE REGARDING FORWARD-LOOKING STATEMENTS AND INDUSTRY DATA
This prospectus, including the sections titled “Summary,” “Risk Factors,” “Management’s Discussion and Analysis of Financial Condition and Results of Operations,” and “Business,” contains forward-looking statements. Forward-looking statements convey our current expectations or forecasts of future events. All statements contained in this prospectus, other than statements of historical fact, are forward-looking. You can identify forward-looking statements by terminology such as “anticipates,” “believes,” “can,” “continue,” “could,” “estimates,” “expects,” “intends,” “may,” “plans,” “seeks,” “should,” “will,” or “would” or the negative of these terms or similar expressions.
There are a number of important factors that could cause our actual results to differ materially from the results anticipated by these forward-looking statements. These important factors include those that we discuss in this prospectus in the section titled “Risk Factors.” You should read these factors and the other cautionary statements made in this prospectus as being applicable to all related forward-looking statements wherever they appear in this prospectus. If one or more of these factors materialize, or if any underlying assumptions prove incorrect, our actual results, performance or achievements may vary materially from any future results, performance or achievements expressed or implied by these forward-looking statements. The forward-looking statements contained in this prospectus are excluded from the safe harbor protection provided by the Private Securities Litigation Reform Act of 1995 and Section 27A of the Securities Act which does not extend to initial public offerings. We undertake no obligation to update publicly any forward-looking statements, whether as a result of new information, future events or otherwise, except as required by law.
Unless otherwise indicated, information contained in this prospectus concerning our industry and the markets in which we operate, including our general expectations and market position, market opportunity, and market share, is based on information from various sources (including the U.S. Census Bureau, Armstrong & Associates, The Colography Group in a report commissioned by us, other industry publications, surveys and forecasts, and our internal research) and on assumptions that we have made, which we believe are reasonable, based on those data and other similar sources and on our knowledge of the markets for our services. In addition, projections, assumptions, and estimates of our future performance and the future performance of the industry in which we operate are necessarily subject to a high degree of uncertainty and risk due to a variety of factors, including those described in “Risk Factors” and elsewhere in this prospectus. These and other factors could cause results to differ materially from those expressed in the estimates included in this prospectus.
26
Table of Contents
Index to Financial Statements
We estimate that the net proceeds to us from this offering will be approximately $ , based upon an assumed initial public offering price of $ per share, the mid-point of the range set forth on the cover page of this prospectus, after deducting underwriting discounts and commissions and estimated offering expenses payable by us. If the underwriters exercise their over-allotment option in full, the net proceeds to us will be approximately $ . A $1.00 increase (decrease) in the assumed initial public offering price of $ per share would increase (decrease) the net proceeds to us from this offering by approximately $ million, assuming the number of shares offered by us, as set forth on the cover page of this prospectus, remains the same and after deducting underwriter discounts and estimated offering expenses payable by us.
We will not receive any proceeds from the sale of shares of common stock by the selling stockholders. The selling stockholders include certain of our executive officers and members of our board of directors or entities affiliated with or controlled by them.
We intend to use approximately $12.2 million of the net proceeds from this offering to redeem all of the outstanding shares of our series F preferred stock, including approximately $3.7 million of accumulated and unpaid dividends on our outstanding shares of series F preferred stock, which accrued at a rate of 18% per annum on the original issue price of each such share of series F preferred stock from its original issuance date until March 9, 2007. All of the outstanding shares of our series F preferred stock are held by certain of our affiliates and, as a result, our affiliates will receive all of the $12.2 million of net proceeds from this offering used to redeem shares of our series F preferred stock.
Other than as described above, we do not have current specific plans for the use of a significant portion of the net proceeds from this offering. Our management will have broad discretion in the application of the net proceeds and investors will be relying upon the judgment of our management regarding their application. We generally intend to use the balance of the net proceeds of this offering for working capital and other general corporate purposes, including to finance our growth, develop new solutions, fund capital expenditures, or expand our existing business through investments in or acquisitions of other businesses, solutions, or technologies. However, we do not have agreements or commitments for any acquisitions at this time. Pending the uses mentioned above, we intend to invest the net proceeds of this offering in short-term, interest-bearing, investment-grade securities.
We have never declared or paid any cash dividends on our common stock. Neither Delaware law nor our amended and restated certificate of incorporation requires our board of directors to declare dividends on our common stock. Any future determination to declare cash dividends on our common stock will be made at the discretion of our board of directors, subject to compliance with certain covenants contained in our credit facility, which limit our ability to pay dividends, and will depend on our financial condition, results of operations, capital requirements, general business conditions, and other factors that our board of directors may deem relevant. We do not anticipate paying cash dividends on our common stock for the foreseeable future.
27
Table of Contents
Index to Financial Statements
The following table sets forth our capitalization as of April 2, 2011:
| • | On an actual basis; |
| • | On a pro forma basis to give effect to the (i) reverse split of each outstanding share of common stock into of a share of common stock prior to the effectiveness of the registration statement of which this prospectus is a part, and (ii) automatic conversion of all of our outstanding convertible preferred stock, except for series F preferred stock, into 546,674,400 shares of common stock upon the completion of this offering; and |
| • | On a pro forma as adjusted basis to give effect to the (i) reverse split of each outstanding share of common stock into of a share of common stock prior to the effectiveness of the registration statement of which this prospectus is a part, (ii) automatic conversion of all of our outstanding convertible preferred stock, except for series F preferred stock, into 546,674,400 shares of common stock upon the completion of this offering, (iii) sale of shares of common stock by us in this offering at an assumed initial public offering price of $ per share, the mid-point of the range set forth on the cover page of this prospectus, and after deducting estimated underwriting discounts and commissions and estimated offering expenses payable by us, and (iv) redemption of the 85,017 remaining outstanding shares of series F preferred stock and payment of accrued dividends thereon for approximately $12.2 million. |
The pro forma as adjusted information set forth in the table below is for illustrative purposes only and will adjust based on the actual initial public offering price and other terms of this offering determined at pricing.
28
Table of Contents
Index to Financial Statements
You should read the information in this table together with our consolidated financial statements and related notes and “Management’s Discussion and Analysis of Financial Condition and Results of Operations” appearing elsewhere in this prospectus.
| As of April 2, 2011 | ||||||||||||
| Actual | Pro Forma | Pro Forma As Adjusted |
||||||||||
| (in thousands, except share and per share amounts) | ||||||||||||
| (unaudited) | ||||||||||||
| Cash and cash equivalents |
$ | 4,545 | $ | 4,545 | $ | |||||||
| Long-term debt, including current portion |
$ | - | $ | - | $ | |||||||
| Convertible preferred stock warrant liability |
457 | - | ||||||||||
| Redeemable convertible preferred stock $0.001 par value, 528,130,523 shares authorized and issuable in series, 499,491,871 shares issued and outstanding, actual; 85,017 shares issued and outstanding, pro forma, no shares issued or outstanding, pro forma as adjusted |
123,837 | 12,237 | ||||||||||
| Stockholders’ equity (deficit): |
||||||||||||
| Preferred stock, $0.001 par value, no shares authorized, actual; shares authorized and no shares issued and outstanding, pro forma and pro forma as adjusted |
- | - | ||||||||||
| Common Stock; $0.001 par value; 900,000,000 shares authorized; 77,618,107 shares issued and outstanding, actual; 900,000,000 shares authorized; shares issued and outstanding, pro forma; shares authorized; shares issued and outstanding, pro forma as adjusted (1) |
78 | 623 | ||||||||||
| Additional paid-in capital |
9,555 | 121,067 | ||||||||||
| Accumulated deficit |
(94,867 | ) | (94,867 | ) | ||||||||
| Total stockholders’ equity (deficit) |
(85,234 | ) | 26,823 | |||||||||
| Total capitalization |
$ | 39,060 | $ | 39,060 | $ | |||||||
| (1) | A $1.00 increase (decrease) in the assumed initial public offering price of $ per share would increase (decrease) cash and cash equivalents, additional paid-in capital, total stockholders’ equity and total capitalization by approximately $ million, assuming the number of shares offered by us, as set forth on the cover page of this prospectus, remains the same and after deducting underwriter discounts and estimated offering expenses payable by us. |
29
Table of Contents
Index to Financial Statements
As of April 2, 2011, we had pro forma net tangible book value of $13.7 million, or $ per share of common stock. Pro forma net tangible book value per share represents the amount of our total tangible assets reduced by the amount of our total liabilities plus the reclassification of the preferred stock warrant liability to additional paid-in capital and divided by the total number of shares of common stock outstanding, after giving effect to the reverse split of our common stock prior to the effectiveness of the registration statement of which this prospectus is a part and the conversion of our convertible preferred stock (other than our series F preferred stock) into shares of common stock upon the completion of this offering. Dilution in pro forma net tangible book value per share to new investors in this offering represents the difference between the amount per share paid by purchasers of shares of common stock in this offering and the pro forma net tangible book value per share of common stock immediately after the completion of this offering. After giving effect to the foregoing, the sale of shares of common stock offered by us in this offering at an assumed initial public offering price of $ per share, the mid-point of the range set forth on the cover page of this prospectus, our redemption of the 85,017 remaining outstanding shares of series F preferred stock and payment of accrued dividends thereon for approximately $12.2 million, and after deducting the estimated underwriting discounts and estimated offering expenses payable by us, our pro forma as adjusted net tangible book value as of April 2, 2011 would have been $ million, or $ per share of common stock. This represents an immediate increase in net tangible book value of $ per share to existing stockholders and an immediate dilution of $ per share to new investors in our common stock. The following table illustrates this dilution on a per share basis:
| Assumed initial public offering price per share |
$ | |||||||
| Pro forma net tangible book value per share as of April 2, 2011, before giving effect to this offering |
$ | |||||||
| Increase in net tangible book value per share attributable to new investors |
||||||||
| Pro forma as adjusted net tangible book value per share after giving effect to this offering |
||||||||
| Dilution per share to new investors in this offering |
$ | |||||||
If the underwriters exercise their option to purchase additional shares of our common stock in full, the pro forma as adjusted net tangible book value per share after this offering would be $ per share, and the dilution in pro forma as adjusted net tangible book value per share to new investors in this offering would be $ per share.
The following table summarizes, on a pro forma basis as discussed above as of April 2, 2011 and after giving effect to the offering, based on an assumed initial public offering price of $ per share, the differences between existing stockholders and new investors with respect to the number of shares of common stock purchased from us, the total consideration paid to us and the average price per share paid.
| Shares Purchased | Total Consideration | Average Price Per Share |
||||||||||||||||||
| Number | Percent | Amount | Percent | |||||||||||||||||
| Existing stockholders |
% | $ | % | $ | ||||||||||||||||
| New investors |
||||||||||||||||||||
| Total |
100.0 | % | $ | 100.0 | % | |||||||||||||||
If the underwriters exercise their over-allotment option in full, our existing stockholders would own % and our new investors would own % of the total number of shares of our common stock outstanding after this offering.
30
Table of Contents
Index to Financial Statements
If all our outstanding options and warrants had been exercised, as of April 2, 2011, we would have had a negative net tangible book value of $ million, or $ per share, and the pro forma net tangible book value after this offering would have been $ million, or $ per share, causing dilution to new investors of $ per share.
31
Table of Contents
Index to Financial Statements
SELECTED CONSOLIDATED FINANCIAL AND OTHER DATA
The following selected consolidated financial data should be read in conjunction with the consolidated financial statements and the notes to those statements and “Management’s Discussion and Analysis of Financial Condition and Results of Operations” and other financial information included elsewhere in this prospectus. The selected consolidated financial data in this section is not intended to replace the financial statements and is qualified in its entirety by the consolidated financial statements and related notes thereto included elsewhere in this prospectus. We have derived the following consolidated statement of operations data for fiscal 2008, 2009, and 2010 and consolidated balance sheet data as of the end of fiscal 2009 and 2010 from our audited consolidated financial statements included elsewhere in this prospectus. We have derived the following consolidated statement of operations data for fiscal 2006 and 2007 and consolidated balance sheet data as of the end of fiscal 2006, 2007, and 2008 from our audited consolidated financial statements not included in this prospectus. The selected consolidated statements of operations data for the three months ended April 3, 2010 and April 2, 2011, and the selected consolidated balance sheet data as of April 2, 2011 are derived from our unaudited condensed consolidated financial statements and related notes included elsewhere in this prospectus. See note 2 to our audited consolidated financial statements for a description of the calculation of basic and diluted net loss per share. Historical results are not necessarily indicative of future results.
32
Table of Contents
Index to Financial Statements
| Fiscal Year | First Fiscal Quarter | |||||||||||||||||||||||||||
| 2006 | 2007 | 2008 | 2009 | 2010 | 2010 | 2011 | ||||||||||||||||||||||
| (unaudited) | ||||||||||||||||||||||||||||
| (in thousands, except per share and average parcel yield amounts) | ||||||||||||||||||||||||||||
| Revenue |
$ | 82,236 | $ | 85,736 | $ | 129,316 | $ | 168,714 | $ | 174,562 | $ | 42,672 | $ | 50,927 | ||||||||||||||
| Cost of revenue |
65,890 | 61,163 | 98,582 | 132,044 | 132,831 | 32,632 | 38,810 | |||||||||||||||||||||
| Gross profit |
16,346 | 24,573 | 30,734 | 36,670 | 41,731 | 10,040 | 12,117 | |||||||||||||||||||||
| Operating expenses: |
||||||||||||||||||||||||||||
| Selling, general and administrative |
12,676 | 17,094 | 25,126 | 26,060 | 26,113 | 6,458 | 7,816 | |||||||||||||||||||||
| Research and development |
2,432 | 1,797 | 1,742 | 2,205 | 2,231 | 591 | 309 | |||||||||||||||||||||
| Total operating expenses |
15,108 | 18,891 | 26,868 | 28,265 | 28,344 | 7,049 | 8,125 | |||||||||||||||||||||
| Income from operations |
1,238 | 5,682 | 3,866 | 8,405 | 13,387 | 2,991 | 3,992 | |||||||||||||||||||||
| Other income (expense): |
||||||||||||||||||||||||||||
| Interest and other income (expense), net |
5 | 32 | 104 | 62 | 10 | 9 | 1 | |||||||||||||||||||||
| Change in fair value of interest rate swap |
- | - | (341 | ) | 174 | 145 | 34 | 21 | ||||||||||||||||||||
| Change in fair value of preferred stock warrant liability |
- | (13,591 | ) | - | 1,907 | 7,262 | 1,432 | 126 | ||||||||||||||||||||
| Interest expense, including amortization of debt discount |
(463 | ) | (1,427 | ) | (1,425 | ) | (1,454 | ) | (939 | ) | (330 | ) | (25 | ) | ||||||||||||||
| Other income (expense), net |
(458 | ) | (14,986 | ) | (1,662 | ) | 689 | 6,478 | 1,145 | 123 | ||||||||||||||||||
| Income (loss) before income taxes |
780 | (9,304 | ) | 2,204 | 9,094 | 19,865 | 4,136 | 4,115 | ||||||||||||||||||||
| Income tax benefit (expense) |
- | (492 | ) | 1,617 | 4,054 | 1,565 | 523 | (2,051 | ) | |||||||||||||||||||
| Net income (loss) |
$ | 780 | $ | (9,796 | ) | $ | 3,821 | $ | 13,148 | $ | 21,430 | $ | 4,659 | $ | 2,064 | |||||||||||||
| Net income (loss) attributable to common stockholders: |
||||||||||||||||||||||||||||
| Basic |
$ | (4,440 | ) | $ | (29,696 | ) | $ | (2,243 | ) | $ | 792 | $ | 3,004 | $ | 687 | $ | 232 | |||||||||||
| Diluted |
$ | (4,440 | ) | $ | (29,696 | ) | $ | (2,243 | ) | $ | 1,333 | $ | 14,168 | $ | 3,227 | $ | 1,938 | |||||||||||
| Net income (loss) per share attributable to common stockholders: |
||||||||||||||||||||||||||||
| Basic |
$ | (0.06 | ) | $ | (0.41 | ) | $ | (0.03 | ) | $ | 0.01 | $ | 0.04 | $ | 0.01 | $ | 0.00 | |||||||||||
| Diluted |
$ | (0.06 | ) | $ | (0.41 | ) | $ | (0.03 | ) | $ | 0.01 | $ | 0.02 | $ | 0.00 | $ | 0.00 | |||||||||||
| Weighted-average shares used in computing net income (loss) per share attributable to common stockholders: |
||||||||||||||||||||||||||||
| Basic |
71,568 | 73,213 | 74,321 | 74,357 | 76,156 | 74,351 | 76,803 | |||||||||||||||||||||
| Diluted |
71,568 | 73,213 | 74,321 | 133,832 | 870,361 | 892,414 | 759,937 | |||||||||||||||||||||
| Pro forma net income attributable to common stockholders (unaudited): |
||||||||||||||||||||||||||||
| Net income |
$ | 21,430 | $ | 4,659 | $ | 2,064 | ||||||||||||||||||||||
| Change in fair value of preferred stock warrant liability |
(7,262 | ) | (1,432 | ) | (126 | ) | ||||||||||||||||||||||
| Pro forma net income attributable to common stockholders (unaudited) |
$ | 14,168 | $ | 3,227 | $ | 1,938 | ||||||||||||||||||||||
| Pro forma net income per share attributable to common stockholders (unaudited): |
||||||||||||||||||||||||||||
| Basic |
$ | 0.02 | $ | 0.01 | $ | 0.00 | ||||||||||||||||||||||
| Diluted |
$ | 0.02 | $ | 0.00 | $ | 0.00 | ||||||||||||||||||||||
| Pro forma weighted-average shares used in computing pro forma and pro forma as adjusted net income per share attributable to common stockholders (unaudited) (1): |
||||||||||||||||||||||||||||
| Basic |
628,277 | 626,472 | 628,924 | |||||||||||||||||||||||||
| Diluted |
697,859 | 695,853 | 701,669 | |||||||||||||||||||||||||
| Pro forma as adjusted net income attributable to common stockholders (unaudited) (2): |
||||||||||||||||||||||||||||
| Pro forma net income attributable to common stockholders (unaudited) |
$ | 14,168 | $ | 3,227 | $ | 1,938 | ||||||||||||||||||||||
| Decrease in net deferred tax asset valuation allowance (2) |
(6,572 | ) | (1.069 | ) | - | |||||||||||||||||||||||
| Pro forma as adjusted net income attributable to common stockholders (unaudited) (2) |
$ | 7,596 | $ | 2,158 | $ | 1,938 | ||||||||||||||||||||||
| Pro forma as adjusted net income per share attributable to common stockholders (unaudited) (2): |
||||||||||||||||||||||||||||
| Basic |
$ | 0.01 | $ | 0.00 | $ | 0.00 | ||||||||||||||||||||||
| Diluted |
$ | 0.01 | $ | 0.00 | $ | 0.00 | ||||||||||||||||||||||
| Other data: |
||||||||||||||||||||||||||||
| Adjusted EBITDA (unaudited) (3) |
$ | 1,724 | $ | 7,892 | $ | 7,567 | $ | 12,781 | $ | 18,166 | $ | 4,221 | $ | 5,230 | ||||||||||||||
| Parcel volume (number of parcels) |
17,605 | 15,947 | 26,752 | 37,930 | 41,282 | 10,035 | 11,469 | |||||||||||||||||||||
| Average parcel yield |
$ | 4.67 | $ | 4.96 | $ | 4.47 | $ | 4.23 | $ | 3.99 | $ | 4.03 | $ | 4.22 | ||||||||||||||
| Gross LTL carrier billings |
$ | - | $ | 94,244 | $ | 121,096 | $ | 94,674 | $ | 104,537 | $ | 23,929 | $ | 28,874 | ||||||||||||||
| (1) | Pro forma and pro forma as adjusted weighted-average shares outstanding reflect the (i) effect of the reverse split of each outstanding share of our common stock into of a share of common stock prior to the effectiveness of the registration statement of which this prospectus is a part and (ii) conversion of our convertible preferred stock (using the if-converted method) into common stock, except for series F preferred stock, as though the conversion had occurred. Pro forma and pro forma as adjusted diluted weighted-average shares outstanding also reflects the effect of any dilutive stock options and warrants. |
33
Table of Contents
Index to Financial Statements
| (2) | Pro forma as adjusted net income per share attributable to common stockholders represents net income as adjusted to (i) exclude the income resulting from the change in fair value of our preferred stock warrant liability of $7.3 million and $0.1 million for fiscal year 2010 and the first fiscal quarter of 2011, respectively, and (ii) exclude the income tax benefit of $6.6 million and $1.1 million resulting from the release of our valuation allowance for our net deferred tax assets during fiscal 2010 and the first fiscal quarter of 2011, respectively. The preferred stock warrant liability will be reclassified to additional paid-in capital before or in connection with this offering and, accordingly, no change in fair value of such liability will occur after this offering. In fiscal 2010, we recorded an income tax benefit due to the release of our remaining valuation allowance for our net deferred tax assets. In periods subsequent to fiscal 2010, we expect to record income tax expense at an effective income tax rate of approximately 40%. |
| (3) | Adjusted EBITDA is calculated as net income (loss), plus net interest expense, including amortization of debt discount, provision for income taxes, depreciation and amortization expense, stock-based compensation expense, and the change in fair value of our interest rate swap and preferred stock warrant liability. Management uses Adjusted EBITDA as a supplemental measure in evaluating its operating performance and when determining executive incentive compensation. Management believes that Adjusted EBITDA is useful to investors in evaluating our operating performance compared to other companies in our industry because it assists in analyzing and benchmarking the performance and value of our business. The calculation of Adjusted EBITDA eliminates the effects of financing, income taxes, and the non-cash accounting effects of our preferred stock warrant liability. These items may vary for different companies for reasons unrelated to the overall operating performance of a company’s business. Adjusted EBITDA is not a financial measure presented in accordance with U.S. generally accepted accounting principles, or GAAP. Although management uses Adjusted EBITDA as a financial measure to assess the performance of our business compared to that of others in our industry, Adjusted EBITDA has limitations as an analytical tool, and you should not consider it in isolation, or as a substitute for analysis of our results as reported under GAAP. Some of these limitations are: |
| • | Adjusted EBITDA does not reflect our cash expenditures, future requirements for capital expenditures, or contractual commitments; |
| • | Adjusted EBITDA does not reflect changes in, or cash requirements for, our working capital needs; |
| • | Adjusted EBITDA does not reflect the significant interest expense or the cash requirements necessary to service interest or principal payments on our debts; |
| • | although depreciation and amortization are noncash charges, the assets being depreciated and amortized will often have to be replaced in the future, and Adjusted EBITDA does not reflect any cash requirements for such replacements; and |
| • | other companies in our industry may calculate Adjusted EBITDA differently than we do, limiting its usefulness as a comparative measure. |
Because of these limitations, Adjusted EBITDA should not be considered a measure of discretionary cash available to us to invest in the growth of our business. We compensate for these limitations by relying primarily on our GAAP results and using Adjusted EBITDA only as a supplemental measure. See the consolidated statements of cash flows included in our consolidated financial statements included elsewhere in this prospectus. The following is a reconciliation of Adjusted EBITDA to net income:
| Fiscal Year | First Fiscal Quarter | |||||||||||||||||||||||||||
| 2006 | 2007 | 2008 | 2009 | 2010 | 2010 | 2011 | ||||||||||||||||||||||
| (unaudited) | ||||||||||||||||||||||||||||
| (in thousands) | ||||||||||||||||||||||||||||
| Net income (loss) |
$ | 780 | $ | (9,796 | ) | $ | 3,821 | $ | 13,148 | $ | 21,430 | $ | 4,659 | $ | 2,064 | |||||||||||||
| Plus: Total net interest expense, including amortization of debt discount |
462 | 1,395 | 1,372 | 1,380 | 931 | 323 | 25 | |||||||||||||||||||||
| Plus/less: Increase (decrease) in fair value of interest rate swap |
- | - | 341 | (174 | ) | (145 | ) | (34 | ) | (21 | ) | |||||||||||||||||
| Plus/less: Provision (benefit) for income taxes |
- | 492 | (1,617 | ) | (4,054 | ) | (1,565 | ) | (523 | ) | 2,051 | |||||||||||||||||
| Plus: Depreciation and amortization |
463 | 2,030 | 3,209 | 4,157 | 4,500 | 1,141 | 1,148 | |||||||||||||||||||||
| Plus: Stock-based compensation |
19 | 180 | 441 | 231 | 277 | 87 | 89 | |||||||||||||||||||||
| Plus/less: Change in fair value of preferred stock warrant liability |
- | 13,591 | - | (1,907 | ) | (7,262 | ) | (1,432 | ) | (126 | ) | |||||||||||||||||
| Adjusted EBITDA |
$ | 1,724 | $ | 7,892 | $ | 7,567 | $ | 12,781 | $ | 18,166 | $ | 4,221 | $ | 5,230 | ||||||||||||||
| Fiscal Year | First Fiscal Quarter | |||||||||||||||||||||||||||
| 2006 | 2007 | 2008 | 2009 | 2010 | 2010 | 2011 | ||||||||||||||||||||||
| (unaudited) | ||||||||||||||||||||||||||||
| (in thousands) | ||||||||||||||||||||||||||||
| Consolidated balance sheet data: |
||||||||||||||||||||||||||||
| Cash |
$ | 7 | $ | 3,595 | $ | 1,121 | $ | 3,193 | $ | 2,132 | $ | 273 | $ | 4,545 | ||||||||||||||
| Total assets |
8,375 | 30,711 | 41,818 | 50,065 | 48,254 | 42,635 | 50,954 | |||||||||||||||||||||
| Working capital |
1,498 | 1,117 | 172 | 3,393 | 5,586 | 2,040 | 8,101 | |||||||||||||||||||||
| Current and long-term debt |
4,566 | 17,436 | 19,318 | 17,259 | - | 10,377 | - | |||||||||||||||||||||
| Convertible preferred stock warrant liability |
13,275 | 27,148 | 27,148 | 25,241 | 17,230 | 23,809 | 457 | |||||||||||||||||||||
| Total liabilities |
23,362 | 51,234 | 58,020 | 52,888 | 28,533 | 40,712 | 12,351 | |||||||||||||||||||||
| Redeemable convertible preferred stock |
83,282 | 107,121 | 113,241 | 117,346 | 107,930 | 114,404 | 123,837 | |||||||||||||||||||||
| Total stockholders’ deficit |
(98,269 | ) | (127,643 | ) | (129,443 | ) | (120,169 | ) | (88,209 | ) | (112,481 | ) | (85,234 | ) | ||||||||||||||
| Other financial data: |
||||||||||||||||||||||||||||
| Net cash provided by (used in) operations |
$ | (781 | ) | $ | 6,142 | $ | 6,194 | $ | 7,066 | $ | 18,479 | $ | 4,153 | $ | 3,023 | |||||||||||||
| Capital expenditures |
749 | 537 | 3,470 | 2,883 | 2,231 | 163 | 369 | |||||||||||||||||||||
34
Table of Contents
Index to Financial Statements
MANAGEMENT’S DISCUSSION AND ANALYSIS OF FINANCIAL CONDITION AND RESULTS OF OPERATIONS
Forward Looking Statements
The following discussion and analysis of our financial condition and results of operations should be read in conjunction with “Selected Consolidated Financial and Other Data” and our consolidated financial statements and related notes included elsewhere in this prospectus. Furthermore, the statements included herein that are not based solely on historical facts are “forward looking statements.” Such forward-looking statements are based on current expectations and assumptions that are subject to risks and uncertainties. Our actual results could differ materially from those anticipated by us in these forward-looking statements as a result of various factors, including those discussed below and elsewhere in this prospectus, particularly under the section titled “Risk Factors.”
Overview
We are a leading provider of parcel and freight transportation solutions to direct-to-consumer retailers, manufacturers, distributors, and third-party logistics and fulfillment providers. Through our strategic alliance with the United States Postal Service, or the USPS, and our network of processing and distribution SmartCenter facilities, we provide nationwide parcel return and delivery services. We also offer a range of less-than-truckload, or LTL, truckload, and expedited transportation management solutions that utilize capacity provided by third-party asset-based carriers.
We were founded in 1999 and have grown to become a leading provider of parcel return management solutions to the direct-to-consumer retail industry. Between 1999 and 2002, we focused on building our core technology infrastructure. In 2002, we launched a dedicated distribution network that utilizes our Newgistics SmartLabel technology to process consumer parcel returns and provide return parcel tracking visibility. In 2004, we collaborated with the USPS to develop the Parcel Return Service, or PRS, a program that permits approved providers to retrieve returned parcels from designated Post Offices or other designated USPS locations. As of April 2, 2011, we, United Parcel Service, Inc., or UPS, and FedEx Corporation, or FedEx, were the only PRS approved providers currently utilizing the program. In 2007, we acquired two businesses, enabling us to offer more comprehensive parcel solutions and to begin providing freight transportation solutions. From fiscal 2008 to fiscal 2010, our annual revenue and gross profit increased 35.0% and 35.8%, respectively, while operating expenses increased 5.5% over the same period. This modest increase in operating expenses relative to the increase in revenue and gross profit was in large part attributable to our nationally integrated return and delivery network and the buying power we have achieved with carriers.
We provide our services through two operating segments: parcel solutions and freight services.
Parcel Solutions Segment
Our parcel solutions segment, which comprised 94.5% of our total revenue and 81.4% of our total gross profit in fiscal 2010, manages and arranges the delivery of parcels from e-commerce, catalogue, and televised home shopping retailers primarily to consumers’ homes and, in the case of merchandise returns, from consumers back to retailers. In the first fiscal quarter of 2011, our parcel solutions segment comprised 94.9% of our total revenue and 83.0% of our total gross profit. By consolidating shipments from many customers and using the USPS for last-mile delivery and first-mile pickup, we are able to provide customers delivering parcels and consumers returning parcels with cost-effective, reliable, and convenient shipping solutions. We believe our proprietary technology platform enables us to provide cost-effective and convenient return and delivery solutions to our customers, allowing them to more efficiently manage their supply chains while providing a more positive experience for their customers. We have a diversified customer base that includes leading direct-to-consumer retailers of apparel, consumer electronics, and other general consumer products. We believe our integrated national network, which enables pickup and delivery directly from and to USPS entry points, provides a compelling value proposition to our customers.
35
Table of Contents
Index to Financial Statements
Parcel solutions revenue is the product of the number of parcels we process and ship during a period multiplied by the average price we charge per parcel processed. The price per parcel shipped varies depending primarily on parcel weight and distance traveled as set forth in contractual pricing arrangements with each customer. Cost of revenue includes postage paid to the USPS for inbound and outbound freight, transportation fees paid to third-party transportation providers, and salary and facility expenses, such as depreciation and amortization, associated with our processing and distribution SmartCenters.
Freight Services Segment
Our freight services segment, which comprised 5.5% of our total revenue and 18.6% of our total gross profit in fiscal 2010, offers LTL and truckload brokerage services in all 50 states through a network of carrier relationships. In the first fiscal quarter of 2011, our freight services segment comprised 5.1% of our total revenue and 17.0% of our total gross profit. We negotiate transportation rates and other arrangements with carriers on behalf of our customers. This approach is designed to provide our customers with committed capacity, responsive service, and rate transparency. We believe our aggregate buying power generally allows us to reduce our customers’ total annual transportation and logistics costs. We also utilize our buying power with third-party carriers to lower the rates we pay to carriers in our own parcel distribution network, thereby reducing transportation costs within our parcel solutions segment.
Freight services revenue consists of LTL commissions, truckload brokerage revenue, and service fees. We earn LTL commissions as a percentage of gross LTL carrier billings. We generate truckload brokerage revenue by procuring truckload transportation capacity on behalf of our customers on a per load basis through our carrier network. Service fees are related to other services we provide, including auditing of freight bills, processing of non-commissionable carrier invoices, and handling of freight payments to the carriers. We recognize LTL revenue, which comprised 77.4% and 78.2% of freight services revenue in fiscal 2010 and the first fiscal quarter of 2011, respectively, on a net basis because we act as an agent, do not establish prices or manage the shipping process, and do not take the risk of loss for collection, delivery, or return. As a result, typically, both operating expenses and operating income are higher as a percentage of revenue in our freight services segment compared to our parcel solutions segment. Cost of revenue within our freight services segment primarily consists of transportation costs paid to third-party carriers related to our truckload brokerage services.
Key Non-Financial Terms and Metrics
We use a number of indicators to monitor our revenue and operating efficiency. Our primary measures of business performance for our parcel solutions segment are parcel volume and parcel yield. Our primary measure of business performance for our freight services segment is gross LTL carrier billings.
Parcel Volume
Parcel volume is the number of parcels shipped in a period. It is a key indicator of the growth and productivity of our business. Generally, an increase in parcel volume in a period would cause an increase in the productivity of our processing centers and transportation network, resulting in lower costs per parcel. Conversely, a decrease in parcel volume in a period generally would result in a decrease in productivity.
Parcel Yield
Parcel yield is a measurement of the revenue per parcel we receive. Parcel yield will vary depending on the applicable USPS defined mail class, distance traveled, fuel prices, and parcel characteristics, such as weight, dimension, and shape.
Gross LTL Carrier Billings
Gross LTL carrier billings is a key measure of our financial performance and productivity within our freight services segment. Gross LTL carrier billings is the dollar amount of customer freight purchases using our negotiated carrier contracts. Since our freight services segment earns a commission equal to a percentage of gross LTL carrier billings, our revenue is a function of total gross LTL carrier billings.
36
Table of Contents
Index to Financial Statements
Set forth below is revenue, gross profit, gross profit margin, operating income, parcel volume, parcel yield, and gross LTL carrier billings information for our reporting segments for fiscal 2008, 2009, and 2010, and the first fiscal quarter of 2010 and 2011:
| Fiscal Year | First Fiscal Quarter | |||||||||||||||||||
| 2008 | 2009 | 2010 | 2010 | 2011 | ||||||||||||||||
| (unaudited) | ||||||||||||||||||||
| (in thousands, except percentages and average parcel yield amounts) | ||||||||||||||||||||
| Parcel solutions segment: |
||||||||||||||||||||
| Revenue |
$ | 119,592 | $ | 160,375 | $ | 164,892 | $ | 40,436 | $ | 48,397 | ||||||||||
| Gross profit |
$ | 21,939 | $ | 29,555 | $ | 33,963 | $ | 8,217 | $ | 10,053 | ||||||||||
| Gross profit margin |
18.3 | % | 18.4 | % | 20.6 | % | 20.3 | % | 20.8 | % | ||||||||||
| Operating income |
$ | 3,008 | $ | 8,011 | $ | 12,195 | $ | 2,810 | $ | 3,774 | ||||||||||
| Parcel volume (number of parcels) |
26,752 | 37,930 | 41,282 | 10,035 | 11,469 | |||||||||||||||
| Average parcel yield |
$ | 4.47 | $ | 4.23 | $ | 3.99 | $ | 4.03 | $ | 4.22 | ||||||||||
| Freight services segment: |
||||||||||||||||||||
| Revenue |
$ | 9,724 | $ | 8,339 | $ | 9,670 | $ | 2,236 | $ | 2,624 | ||||||||||
| Gross profit |
$ | 8,795 | $ | 7,115 | $ | 7,768 | $ | 1,823 | $ | 2,064 | ||||||||||
| Gross profit margin |
90.4 | % | 85.3 | % | 80.3 | % | 81.5 | % | 78.7 | % | ||||||||||
| Operating income |
$ | 859 | $ | 394 | $ | 1,192 | $ | 181 | $ | 218 | ||||||||||
| Gross LTL carrier billings |
$ | 121,096 | $ | 94,674 | $ | 104,537 | $ | 23,929 | $ | 28,874 | ||||||||||
Opportunities and Trends
Our parcel solutions segment customers are primarily direct-to-consumer retailers, which represent a fast growing segment of the retail market. According to the U.S. Census Bureau, sales from electronic shopping and mail-order houses increased at a 9.1% compound annual growth rate from $113.9 billion in 2000 to $270.8 billion in 2010. During this same period, total retail sales increased at only a 2.8% compound annual growth rate. Many of our direct-to-consumer customers are engaged in e-commerce, or the sale of retail merchandise via electronic means, primarily over the internet through online retail channels. In 2009, e-commerce sales represented the largest and one of the fastest growing components of sales from electronic shopping and mail-order houses. According to the U.S. Census Bureau, e-commerce sales increased at a 20.1% compound annual growth rate, from $27.5 billion in 2000 to $143.3 billion in 2009, the latest annual data available. E-commerce retail sales experienced modest growth in 2008 and 2009, despite a severe U.S. recession that caused overall retail sales to decline. We believe growth in direct-to-consumer purchases will continue to outpace growth in overall retail sales, regardless of economic conditions. We expect our revenue to grow as we capitalize on this market opportunity.
Since 2007, our operating income has grown at a faster rate than our revenue primarily as a result of three major initiatives. First, in 2008, we established our own SmartCenter facilities to replace services previously provided by third parties, which helped reduce our processing cost per parcel in fiscal 2008, 2009, and 2010, and the first fiscal quarter of 2011. Second, we invested in technology that enabled us to process increased parcel volumes more efficiently and effectively, without significantly adding headcount. Third, we expanded our transportation carrier network to pickup and deliver parcels to locations within the USPS network closer to the consumer, which reduced our per parcel postage costs and improved operational efficiency. We intend to pursue initiatives to further improve the efficiency and effectiveness of our operations in future periods. We anticipate that as our volumes continue to increase, our efficiency will likely improve without the need for a significant increase in capital expenditures.
From 2007 through 2010, average parcel yield declined 10.7%. This decline in parcel yield was primarily the result of our entry into the delivery market, in which, on average, our parcel weights are lighter than those in the returns market. Our average parcel yield increased in the first fiscal quarter of 2011 as compared to the first fiscal quarter of 2010 as a result of an increase in our pricing and a shift in mail class mix. Future parcel yield is
37
Table of Contents
Index to Financial Statements
difficult to predict as it is influenced by the applicable USPS defined mail class, distance traveled, fuel price, and parcel characteristics, such as weight, dimension, and shape, which vary by customer and are dependent on many factors, including but not limited to the popularity and mix of consumer product purchases, customer advertising and marketing campaigns, technological advances, and the general state of the economy.
We recently have begun a new growth initiative in our parcel solutions business targeted at increasing sales from middle market direct-to-consumer retailers. This initiative includes the hiring of a new Vice President of Marketing, who joined us in January 2011, the expansion of our sales force, and the development of targeted marketing programs to secure customers from this segment. In connection with the initial phases of this growth initiative, we will incur an increase in operating expenses in excess of gross profit generated from this initiative and, as a result, we expect that our operating profit will decrease both in absolute dollars and as a percentage of revenue in fiscal 2011. We anticipate that, following the startup phase, the increase in gross profit both from this expansion initiative and from our other business efforts will have more than offset the increase in operating expenses from this program.
The transportation industry has been very competitive, especially during the recent economic downturn, which adversely affected consumer confidence and spending. Freight pricing is particularly susceptible to changes in the economy, as a reduction in demand from both businesses and consumers result in unused capacity, leading to significant price competition. However, we believe excess capacity in the industry is beginning to lessen as the economy recovers and freight and parcel volumes increase, resulting in increased gross LTL carrier billings and revenue for our freight services segment. Reduced transportation capacity may also increase transportation costs for our parcel solutions segment. However, we anticipate these changes will benefit our overall future business performance, as increased volumes generally result in increased revenue and network efficiencies that offset increases in our transportation costs. Additionally, we have begun implementing initiatives within our parcel solutions segment to minimize any short-term increase in transportation costs, such as incorporating more inter-facility parcel moves to improve utilization of our purchased transportation capacity.
Key Components of Our Results of Operations
Revenue
We primarily generate revenue from each parcel shipped and each freight shipment or load transacted by us on behalf of our customers. Generally, we enter into agreements with our parcel solutions customers for terms ranging from one to three years. In our freight services business, our commission rates are negotiated annually with our carrier partners.
Within our parcel solutions segment, we generate revenue through service fees charged for the processing and shipment of individual parcels. Revenue is recognized at an individual parcel level and varies depending on the applicable USPS defined mail class, distance traveled, fuel prices, and parcel characteristics such as weight, dimension, and shape. Revenue for delivery of parcels is recognized upon delivery to a USPS location, which concludes our contractual obligation. Revenue for parcel returns is recognized when parcels are delivered to our customers’ distribution centers, which concludes our contractual obligation.
Within our freight services segment, for LTL services we negotiate transportation rates and fuel surcharge schedules with carriers on behalf of our customers and earn commissions from the carriers based on a percentage of our customers’ gross LTL carrier billings. We recognize LTL revenue on a per shipment basis at the time we receive carrier invoices. For truckload brokerage services, we generate revenue by procuring transportation services on behalf of our customers. We recognize truckload brokerage revenue on a per truckload basis upon receiving shipment delivery confirmation from our carriers. Truckload brokerage revenue is recognized on a gross basis and therefore represents the total dollar value of truckload services we sell to our customers.
38
Table of Contents
Index to Financial Statements
Cost of Revenue
Cost of revenue within our parcel solutions segment includes postage paid to the USPS for inbound and outbound transportation, fees paid to third-party transportation providers, and salary and facility expenses associated with processing parcels in our SmartCenters. Because we do not own or lease any of our own transportation equipment, the majority of our transportation costs are variable.
Cost of revenue within our parcel solutions segment varies depending on the USPS defined mail class, the USPS entry or retrieval point, distance traveled, and characteristics of the parcel. Our USPS postage cost consists of published and contracted rates on a per parcel basis. Other transportation costs are primarily direct costs paid to our network of third-party carriers and couriers for the transportation of parcels between the USPS and customers’ facilities. We also incur costs associated with the sorting of parcels at our SmartCenter facilities, including salaries of SmartCenter personnel, rent, utilities, communications, and depreciation and amortization. Cost of revenue also includes fees we pay to third-party transportation providers for sortation services at their facilities.
Cost of revenue within our freight services segment primarily consists of transportation costs related to our truckload brokerage services paid to third-party carriers for dedicated truck capacity to transport freight on behalf of our customers. There is no cost of revenue associated with our LTL freight services as we recognize only the commissions we receive from our carriers.
Operating Expenses
Selling, general and administrative expenses consist of salaries and related benefits, bonuses, commissions and stock-based compensation of our sales and marketing, finance and accounting, human resources, information technology, and certain operations personnel. These expenses also include depreciation and amortization, marketing programs, legal, audit, and tax fees, as well as other general corporate expenses. We expect selling, general and administrative expenses to increase in absolute dollars as we continue to add personnel and incur additional expenses as we grow our business and comply with the requirements of operating as a public company.
Research and development costs consist of personnel related costs, including salaries, bonuses, and stock-based compensation, as well as costs of third-party service providers, incurred for the development and enhancement of our technology solutions. We expense all research and development costs as they are incurred.
Interest and Other Income
Interest and other income consists primarily of gains and losses from the sale and or disposition of fixed assets.
Change in Fair Value of Interest Rate Swap
Loans outstanding under our Prior Credit Facility, described below, bore interest per annum at a variable rate based on LIBOR. On August 29, 2008, we entered into an interest rate swap agreement for a notional amount of $10.2 million at a fixed LIBOR rate of 5.94%. Change in fair value of interest rate swap represents the change in fair value of our interest rate swap based on changes in interest rates in the public market. The term of this interest rate swap expired on February 9, 2011.
Change in Fair Value of Preferred Stock Warrant Liability
We have warrants outstanding that are exercisable for our redeemable convertible preferred stock. We record either income or expense as the liability with respect to the warrants fluctuates from period to period. A decrease in the warrant liability results in the recognition of income and an increase in the warrant liability results in the recognition of expense. Prior to or in connection with our initial public offering, these warrants will be exercised or converted into warrants to acquire our common stock. At such time, the liability will be reclassified to additional paid-in capital.
39
Table of Contents
Index to Financial Statements
Interest Expense, Including Amortization of Debt Discount
Interest expense, including amortization of debt discount, consists of interest expense incurred on borrowings under our Credit Facilities and amortization of debt issuance costs. Loans outstanding under our Prior Credit Facility bore interest per year based on LIBOR and was adjusted on a quarterly basis based on our funded debt to EBITDA ratio.
Provision for Income Taxes
Our provision for income taxes includes income tax expense or benefit recorded pursuant to the liability method of accounting for income taxes. Under this method, we recognize deferred tax assets and liabilities for the expected future tax consequences of temporary differences between the respective carrying amounts and tax bases of our assets and liabilities. Our provision for income taxes also includes the effect of a change in our valuation allowance for net deferred tax assets. We establish valuation allowances when necessary to reduce deferred tax assets to the amounts expected to be realized. We evaluate the need for, and the adequacy of, valuation allowances based on the expected realization of our deferred tax assets. The factors we use to assess the likelihood of realization include our latest forecast of future taxable income and available tax planning strategies that could be implemented to realize the net deferred tax assets. In fiscal 2008, 2009, and 2010, our provision for income taxes included a benefit from the result of decreases in our valuation allowance in the amount of $3.9 million, $6.9 million, and $6.6 million, respectively. Such decreases in our valuation allowance were due to our increased expectation of realization of our deferred tax assets, which consist primarily of net operating loss carryforwards, as a result of the improved outlook of our taxable income. As of April 2, 2011, no valuation allowance for net deferred tax assets remains. Therefore, we have assumed our provision for income taxes for fiscal 2011 and future periods to be approximately 40% of our income before income taxes.
Fiscal Periods
Our fiscal year ends on the Saturday closest to December 31 and consists of either 52 weeks or, as was the case of fiscal 2008, 53 weeks. Each quarter of each fiscal year generally consists of 13 weeks, although the fourth quarter of fiscal 2008 had 14 weeks. Our quarter end for the first fiscal quarter of fiscal 2010 and 2011 was April 3, 2010 and April 2, 2011, respectively. Our year end for fiscal 2008, 2009, and 2010 was January 3, 2009, January 2, 2010, and January 1, 2011, respectively. The differing number of days in fiscal years 2008, 2009, and 2010 did not have a material effect on the Company’s results of operations.
40
Table of Contents
Index to Financial Statements
Results of Operations
The following table sets forth our audited consolidated statements of operations for fiscal 2008, 2009, and 2010, and our unaudited condensed consolidated statements of operations for the first fiscal quarters of 2010 and 2011, and the related percentage of total revenue. The period-to-period comparison of financial results is not necessarily indicative of future periods:
Consolidated Statements of Operations Data
| Fiscal Year | First Fiscal Quarter | |||||||||||||||||||||||||||||||||||||||
| 2008 | 2009 | 2010 | 2010 | 2011 | ||||||||||||||||||||||||||||||||||||
| (unaudited) | ||||||||||||||||||||||||||||||||||||||||
| (dollars in thousands) | ||||||||||||||||||||||||||||||||||||||||
| Revenue |
$ | 129,316 | 100.0 | % | $ | 168,714 | 100.0 | % | $ | 174,562 | 100.0 | % | $ | 42,672 | 100.0 | % | $ | 50,927 | 100.0 | % | ||||||||||||||||||||
| Cost of revenue |
98,582 | 76.2 | 132,044 | 78.3 | 132,831 | 76.1 | 32,632 | 76.5 | % | 38,810 | 76.2 | % | ||||||||||||||||||||||||||||
| Gross profit |
30,734 | 23.8 | 36,670 | 21.7 | 41,731 | 23.9 | 10,040 | 23.5 | % | 12,117 | 23.8 | % | ||||||||||||||||||||||||||||
| Operating expenses: |
||||||||||||||||||||||||||||||||||||||||
| Selling, general and administrative |
25,126 | 19.4 | 26,060 | 15.4 | 26,114 | 15.0 | 6,458 | 15.1 | % | 7,816 | 15.3 | % | ||||||||||||||||||||||||||||
| Research and development |
1,742 | 1.3 | 2,205 | 1.3 | 2,231 | 1.3 | 591 | 1.4 | % | 309 | 0.6 | % | ||||||||||||||||||||||||||||
| Total operating expenses |
28,868 | 20.8 | 28,265 | 16.8 | 28,345 | 16.2 | 7,049 | 16.5 | % | 8,125 | 16.0 | % | ||||||||||||||||||||||||||||
| Operating income |
3,866 | 3.0 | 8,405 | 5.0 | 13,387 | 7.7 | 2,991 | 7.0 | % | 3,992 | 7.8 | % | ||||||||||||||||||||||||||||
| Interest and other income |
104 | 0.1 | 62 | 0.0 | 10 | 0.0 | 9 | 0.0 | % | 1 | 0.0 | % | ||||||||||||||||||||||||||||
| Change in fair value of interest rate swap |
(341) | (0.3) | 174 | 0.1 | 145 | 0.1 | 34 | 0.1 | % | 21 | 0.0 | % | ||||||||||||||||||||||||||||
| Change in fair value of preferred stock warrant liability |
- | 0.0 | 1,907 | 1.1 | 7,262 | 4.2 | 1,432 | 3.4 | % | 126 | 0.2 | % | ||||||||||||||||||||||||||||
| Interest expense, including amortization of debt discount |
(1,425) | (1.1) | (1,454) | (0.9) | (939) | (0.5) | (330) | (0.8 | %) | (25) | (0.0 | %) | ||||||||||||||||||||||||||||
| Income before income taxes |
2,204 | 1.7 | 9,094 | 5.4 | 19,864 | 11.4 | 4,136 | 9.7 | % | 4,115 | 8.1 | % | ||||||||||||||||||||||||||||
| Income tax benefit (expense) |
1,617 | 1.3 | 4,054 | 2.4 | 1,565 | 0.9 | 523 | 1.2 | % | (2,051 | ) | (4.0 | %) | |||||||||||||||||||||||||||
| Net income |
$ | 3,821 | 3.0 | % | $ | 13,148 | 7.8 | % | $ | 21,430 | 12.3 | % | $ | 4,659 | 10.9 | % | $ | 2,064 | 4.1 | % | ||||||||||||||||||||
First Fiscal Quarter 2011 Compared to First Fiscal Quarter 2010, Fiscal 2010 Compared to Fiscal 2009 and Fiscal 2009 Compared to Fiscal 2008
The following discussion of our results of operations is based on actual results of operations for fiscal 2008, 2009, and 2010, and the first fiscal quarter of 2010 and 2011. Dollar information provided in the tables below is in thousands.
Revenue
| Fiscal Year | First Fiscal Quarter | |||||||||||||||||||
| 2008 | 2009 | 2010 | 2010 | 2011 | ||||||||||||||||
| (unaudited) | ||||||||||||||||||||
| Revenue |
$ | 129,316 | $ | 168,714 | $ | 174,562 | $ | 42,672 | $ | 50,927 | ||||||||||
41
Table of Contents
Index to Financial Statements
First Fiscal Quarter 2011 Comparison to First Fiscal Quarter 2010. Revenue increased by $8.3 million, or 19.3%, to $50.9 million in the first fiscal quarter of 2011 from $42.7 million in the first fiscal quarter of 2010. The increase in revenue in the first fiscal quarter of 2011 as compared to the first fiscal quarter of 2010 was primarily due to an increase in parcel volume from new and existing customers of 2.1 million parcels, or $8.5 million in revenue, a $1.1 million increase in revenue due to higher parcel yield, and $0.3 million increase in freight services revenue due to an increase in business from new and existing customers. This increase in revenue was partially offset by a $1.7 million decrease due to parcel customer attrition.
2010 Comparison to 2009. Revenue increased by $5.8 million, or 3.5%, to $174.6 million in fiscal 2010 from $168.7 million in fiscal 2009. The increase in revenue in fiscal 2010 as compared to fiscal 2009 was primarily due to an increase in parcel volume from new and existing customers of 9.2 million parcels, or $33.7 million in revenue, and an increase in freight services revenue of $1.3 million. Revenue was partially offset by a $24.3 million decrease in revenue due to customer attrition, of which $9.5 million was due to the loss of a single customer, and a $4.7 million decrease in revenue due to lower parcel yield.
2009 Comparison to 2008. Revenue increased by $39.4 million, or 30.5%, to $168.7 million in fiscal 2009 from $129.3 million in fiscal 2008. The increase in revenue in fiscal 2009 as compared to fiscal 2008 was primarily due to an increase in parcel volume from new and existing customers of 13.8 million, or $65.3 million. Revenue was partially offset by a $14.1 million decrease in revenue due to lower parcel yield, a $10.8 million decrease in revenue due to customer attrition, and a $1.4 million decrease in freight services revenue.
Cost of Revenue
| Fiscal Year | First Fiscal Quarter | |||||||||||||||||||||||||||||||||||||||
| 2008 | 2009 | 2010 | 2010 | 2011 | ||||||||||||||||||||||||||||||||||||
| Transportation costs |
$ | 85,611 | 86.8 | % | $ | 116,563 | 88.3 | % | $ | 115,741 | 87.1 | % | $ | 28,533 | 87.4 | % | $ | 34,302 | 88.4 | % | ||||||||||||||||||||
| Warehouse costs |
11,512 | 11.7 | 15,610 | 11.8 | 16,563 | 12.5 | 3,947 | 12.1 | 4,306 | 11.1 | ||||||||||||||||||||||||||||||
| Other direct costs |
1,460 | 1.5 | (129 | ) | -0.1 | 526 | 0.4 | 152 | 0.5 | 203 | 0.5 | |||||||||||||||||||||||||||||
| Total cost of revenue |
$ | 98,582 | 100.0 | % | $ | 132,044 | 100.0 | % | $ | 132,831 | 100.0 | % | $ | 32,632 | 100.0 | % | $ | 38,810 | 100.0 | % | ||||||||||||||||||||
First Fiscal Quarter 2011 Comparison to First Fiscal Quarter 2010. Cost of revenue increased by $6.2 million, or 18.9%, to $38.8 million in the first fiscal quarter of 2011 from $32.6 million in the first fiscal quarter of 2010. The increase in cost of revenue in the first fiscal quarter of 2011 as compared to the first fiscal quarter of 2010 was primarily due to higher parcel volume from new and existing customers. On a consolidated basis, our cost of revenue as a percent of revenue decreased to 76.2% in the first fiscal quarter of 2011 as compared to 76.5% in the first fiscal quarter of 2010 due to improved optimization of our transportation network and increased productivity at our SmartCenter facilities.
2010 Comparison to 2009. Cost of revenue increased by $0.8 million, or 0.6%, to $132.8 million in fiscal 2010 from $132.0 million in fiscal 2009. The increase in cost of revenue in fiscal 2010 as compared to the prior year was primarily due to higher parcel volume from new and existing customers. On a consolidated basis, our cost of revenue as a percent of revenue decreased to 76.1% in fiscal 2010 as compared to 78.3% in fiscal 2009 due to improved optimization of our transportation network and increased productivity at our SmartCenter facilities.
2009 Comparison to 2008. Cost of revenue increased by $33.5 million, or 33.9%, to $132.0 million in fiscal 2009 from $98.6 million in fiscal 2008. The increase in cost of revenue in fiscal 2009 as compared to the prior year was primarily due to higher parcel volume from new and existing customers. On a consolidated basis, our cost of revenue as a percent of revenue increased to 78.3% in fiscal 2009 as compared to 76.2% in fiscal 2008 due to investments in our transportation network and SmartCenter facilities to accomodate future growth.
42
Table of Contents
Index to Financial Statements
Gross Profit
| Fiscal Year | First Fiscal Quarter | |||||||||||||||||||
| 2008 | 2009 | 2010 | 2010 | 2011 | ||||||||||||||||
| (unaudited) | ||||||||||||||||||||
| Gross profit |
$ | 30,734 | $ | 36,670 | $ | 41,731 | $ | 10,040 | $ | 12,117 | ||||||||||
| Gross profit margin |
23.8 | % | 21.7 | % | 23.9 | % | 23.5 | % | 23.8 | % | ||||||||||
First Fiscal Quarter 2011 Comparison to First Fiscal Quarter 2010. Gross profit increased by $2.1 million, or 20.7%, to $12.1 million in the first fiscal quarter of 2011 from $10.0 million in the first fiscal quarter of 2010. The increase in gross profit and gross profit margin from 23.5% to 23.8% in the first fiscal quarter of 2011 as compared to the first fiscal quarter of 2010 was primarily due to growth in parcel volume. Gross profit within our brokerage services increased by 4.4% year over year due to an increase in shipments.
2010 Comparison to 2009. Gross profit increased by $5.1 million, or 13.8%, to $41.7 million in fiscal 2010 from $36.7 million in fiscal 2009. The increase in gross profit and gross profit margin to 23.9% in fiscal 2010 from 21.7% in fiscal 2009 was primarily due to growth in parcel volume and improved optimization of our transportation network. As our volume increases, we are able to achieve lower per unit costs due to higher densities and increased volume over fixed costs. In addition, during fiscal 2010, we increased the percentage of parcels that were delivered to local Post Offices, thereby achieving price discounts from the USPS. The increase in gross profit year over year was partially offset by a decrease in gross profit margin in our freight services segment from 85.3% in fiscal 2009 to 80.3% in fiscal 2010. This decrease in gross profit margin was primarily due to an increase in revenue attributable to our truckload brokerage services, which have lower gross profit margins than our LTL services, in which commissions are recorded on a net basis.
2009 Comparison to 2008. Gross profit increased by $5.9 million, or 19.3%, to $36.7 million in fiscal 2009 from $30.7 million in fiscal 2008. The increase in gross profit in absolute dollars was primarily due to growth in parcel volume and improved optimization of our transportation network. As our volume increases, we are able to achieve lower per unit costs due to higher densities and increased volume over fixed costs. In addition, during fiscal 2009, we increased the percentage of parcels that were delivered to local Post Offices, thereby achieving price discounts from the USPS. As a percentage of revenue, gross profit decreased to 21.7% in fiscal 2009 from 23.8% in fiscal 2008 primarily due to lower pricing from new customers in an effort to grow our volumes in future periods and thereby improve the efficiency of our transportation network. Additionally, gross profit margin in our freight services segment decreased from 90.4% in fiscal 2008 to 85.3% in fiscal 2009 due to an increase in revenue attributable to our truckload brokerage services, which have lower gross margins than our LTL services, in which commissions are recorded on a net basis.
Selling, General and Administrative
| Fiscal Year | First Fiscal Quarter | |||||||||||||||||||
| 2008 | 2009 | 2010 | 2010 | 2011 | ||||||||||||||||
| (unaudited) | ||||||||||||||||||||
| Selling, general and administrative |
$ | 25,126 | $ | 26,060 | $ | 26,113 | $ | 6,458 | $ | 7,816 | ||||||||||
First Fiscal Quarter 2011 Comparison to First Fiscal Quarter 2010. Selling, general and administrative expenses increased by $1.4 million, or 21.0%, to $7.8 million in the first fiscal quarter of 2011 from $6.5 million in the first fiscal quarter of 2010. As a percentage of revenue, selling, general and administrative expenses remained relatively unchanged at 15.3% in the first fiscal quarter of 2011 as compared to 15.1% in the first fiscal quarter of 2010. The increase in selling, general and administrative expense in absolute dollars primarily relates to an increase in salaries and related benefits due to increased headcount as part of our sales initiative with middle market, direct-to-consumer retailers.
2010 Comparison to 2009. Selling, general and administrative expenses remained relatively unchanged at $26.1 million in fiscal 2010 as compared to fiscal 2009. As a percentage of revenue, selling, general and
43
Table of Contents
Index to Financial Statements
administrative expenses decreased to 15.0% in fiscal 2010 from 15.4% in fiscal 2009. The decrease in selling, general and administrative expense as a percentage of revenue primarily relates to revenue increasing at a faster rate than salaries and related benefits and other expenses.
2009 Comparison to 2008. Selling, general and administrative expenses increased by $0.9 million, or 3.7%, to $26.1 million in fiscal 2009 from $25.1 million in fiscal 2008. The increase in absolute dollars was primarily due to $0.9 million in increased sales commissions. As a percentage of revenue, selling, general and administrative expenses decreased to 15.4% in fiscal 2009 compared to 19.4% in fiscal 2008, due to revenue increasing at a faster rate than salaries and related benefits and other expenses.
Research and Development
| Fiscal Year | First Fiscal Quarter | |||||||||||||||||||
| 2008 | 2009 | 2010 | 2010 | 2011 | ||||||||||||||||
| (unaudited) | ||||||||||||||||||||
| Research and development |
$ | 1,742 | $ | 2,205 | $ | 2,231 | $ | 591 | $ | 309 | ||||||||||
First Fiscal Quarter 2011 Comparison to First Fiscal Quarter 2010. Research and development expense decreased $0.3 million, or 47.7%, to $0.3 million in the first fiscal quarter of 2011 from $0.6 million in the first fiscal quarter of 2010. The decrease in research and development expense is primarily as a result of reduced activity as certain projects near completion.
2010 Comparison to 2009. Research and development expense remained relatively unchanged at $2.2 million in fiscal 2010 as compared to fiscal 2009, as we did not substantially alter our research and development efforts.
2009 Comparison to 2008. In fiscal 2009, research and development expense increased by $0.5 million, or 26.6%, to $2.2 million from $1.7 million in fiscal 2008. In fiscal 2009, we increased our investment in technology enhancements to further improve the efficiency with which we deliver services to our customers.
Interest and Other Income
| Fiscal Year | First Fiscal Quarter | |||||||||||||||||||
| 2008 | 2009 | 2010 | 2010 | 2011 | ||||||||||||||||
| (unaudited) | ||||||||||||||||||||
| Interest and other income |
$ | 104 | $ | 62 | $ | 10 | $ | 9 | $ | 1 | ||||||||||
Interest and other income was minimal in fiscal years 2008, 2009 and 2010, and the first fiscal quarter of 2010 and 2011.
Change in Fair Value of Interest Rate Swap
| Fiscal Year | First Fiscal Quarter | |||||||||||||||||||
| 2008 | 2009 | 2010 | 2010 | 2011 | ||||||||||||||||
| (unaudited) | ||||||||||||||||||||
| Change in fair value of interest rate swap |
$ | (341 | ) | $ | 174 | $ | 145 | $ | 34 | $ | 21 | |||||||||
First Fiscal Quarter 2011 Comparison to First Fiscal Quarter 2010. The change in fair value of our interest rate swap was minimal in the first fiscal quarter of 2010 and 2011.
2010 Comparison to 2009. The change in fair value of our interest rate swap resulted in income of $0.1 million in fiscal 2010 compared to income of $0.2 million in fiscal 2009, representing the change in fair value of our interest rate swap based on changes in interest rates in the public market in each of the respective periods.
44
Table of Contents
Index to Financial Statements
2009 Comparison to 2008. The change in fair value of our interest rate swap resulted in income of $0.2 million in fiscal 2009 compared to expense of $0.3 million in fiscal 2008, representing the change in fair value of our interest rate swap based on changes in interest rates in the public market in each of the respective periods.
Change in Fair Value of Preferred Stock Warrant Liability
| Fiscal Year | First Fiscal Quarter | |||||||||||||||||||
| 2008 | 2009 | 2010 | 2010 | 2011 | ||||||||||||||||
| (unaudited) | ||||||||||||||||||||
| Change in fair value of preferred stock warrant liability |
$ | - | $ | 1,907 | $ | 7,262 | $ | 1,432 | $ | 126 | ||||||||||
First Fiscal Quarter 2011 Comparison to First Fiscal Quarter 2010. We have warrants outstanding that are exercisable for our redeemable convertible preferred stock. In the first fiscal quarter of 2010, we recorded income of $1.4 million as a result of a corresponding decrease in the fair value of the warrants. In the first fiscal quarter of 2011, we recorded income of $0.1 million as a result of a corresponding decrease in the fair value of the warrants. During the first fiscal quarter of 2011, warrants to purchase 185,873,115 shares of our series E preferred stock were exercised and the liability with respect to these warrants was reclassified to redeemable preferred stock and additional paid-in capital.
2010 Comparison to 2009. We have warrants outstanding that are exercisable for our redeemable convertible preferred stock. In fiscal 2009, we recorded income of $1.9 million as a result of a corresponding decrease in the fair value of the warrants. In fiscal 2010, we recorded income of $7.3 million as a result of a corresponding decrease in the fair value of the warrants.
2009 Comparison to 2008. In fiscal 2008, we recorded no income or expense, as the fair value of the warrants did not change. In fiscal 2009, we recorded income of $1.9 million as a result of a corresponding decrease in fair value of the warrants.
We will continue to adjust our preferred stock warrant liability for changes in fair value until the earlier of (1) the exercise or expiration of the warrants or (2) the completion of a liquidation event, including the completion of this offering, at which time all preferred stock warrants remaining unexercised will be converted into warrants to purchase common stock and the liability will be reclassified to additional paid-in capital.
Interest Expense, Including Amortization of Debt Discount
| Fiscal Year | First Fiscal Quarter | |||||||||||||||||||
| 2008 | 2009 | 2010 | 2010 | 2011 | ||||||||||||||||
| (unaudited) | ||||||||||||||||||||
| Interest expense, including amortization of debt discount |
$ | (1,425 | ) | $ | (1,454 | ) | $ | (939 | ) | $ | (330 | ) | $ | (25 | ) | |||||
First Fiscal Quarter 2011 Comparison to First Fiscal Quarter 2010. In the first fiscal quarter of 2011, interest expense, including amortization of debt discount, decreased $0.3 million, or 92.4%, to $25,000 compared to $0.3 million in the first fiscal quarter of 2010. The decrease in interest expense was primarily due to a decrease in average outstanding borrowings.
2010 Comparison to 2009. In fiscal 2010, interest expense, including amortization of debt discount, decreased $0.5 million, or 35.4%, to $0.9 million compared to $1.5 million in fiscal 2009. The decrease in interest expense, including amortization of debt discount, was primarily due to a decrease in average outstanding borrowings.
45
Table of Contents
Index to Financial Statements
2009 Comparison to 2008. In fiscal 2009, interest expense, including amortization of debt discount, remained relatively unchanged as compared to fiscal 2008.
Income Tax Benefit
| Fiscal Year | First Fiscal Quarter | |||||||||||||||||||
| 2008 | 2009 | 2010 | 2010 | 2011 | ||||||||||||||||
| (unaudited) | ||||||||||||||||||||
| Income tax (expense) benefit |
$ | 1,617 | $ | 4,054 | $ | 1,565 | $ | 523 | $ | (2,051 | ) | |||||||||
First Fiscal Quarter 2011 Comparison to First Fiscal Quarter 2010. In the first fiscal quarter of 2010 we recorded an income tax benefit of $0.5 million as a result of the release of the valuation allowance for our net operating loss carryforwards and other deferred tax assets based upon our analyses of whether it was more likely than not that such deferred tax assets were realizable. We recorded income tax expense of $2.1 million in the first fiscal quarter of 2011, which represents our expected overall effective income tax rate of 40% for fiscal 2011 plus additional immaterial expense for certain discrete items related to prior years. As of January 1, 2011 and April 2, 2011, no valuation allowance for net deferred tax assets remains.
2010 Comparison to 2009. In fiscal 2009 and 2010, we recorded an income tax benefit of $4.1 million and $1.6 million, respectively. In both fiscal 2009 and fiscal 2010, the income tax benefit was primarily the result of the release of valuation allowance for our net operating loss carryforwards and other deferred tax assets based upon our analyses of whether it was more likely than not that such deferred tax assets were realizable. As of January 1, 2011, no valuation allowance for net deferred tax assets remains. We expect our provision for income taxes for annual and interim periods subsequent to January 1, 2011 to be an expense that approximates 40% of our income before income taxes.
2009 Comparison to 2008. In fiscal 2008, we recorded an income tax benefit of $1.6 million. In fiscal 2009, we recorded an income tax benefit of $4.1 million. In both fiscal 2008 and fiscal 2009, the income tax benefit was primarily the result of the release of valuation allowance for our net operating loss carryforwards and other deferred tax assets based upon our analyses of whether it was more likely than not that such deferred tax assets were realizable.
Quarterly Results of Operations and Seasonality
The results of operations of our parcel solutions segment generally reflect a seasonal pattern. As our customers increase sales during the holiday season at year-end, the fourth quarter historically has been our strongest volume quarter for deliveries. Return volumes are typically strongest in the first and fourth quarters, as consumers return items purchased during the holiday season. Parcel yield is typically strongest in the first and fourth quarters as parcel weights during these quarters tend to be heavier. While we have experienced seasonality, differences in our revenue and parcel yield between periods have also been impacted by additions or losses of parcel solutions customers. We experienced lower revenue during the first quarter of fiscal 2009 as compared to the second and third quarter of fiscal 2009 due to the fact that a new customer that contributed a significant amount to our total revenue in fiscal 2009 was less active during the first quarter of fiscal 2009. Cost of revenue increased over the course of the quarters presented below primarily due to an increase in operating costs related to the increased sales of our solutions. Historically, our quarterly results of operations have also been significantly impacted by changes in the fair value of our preferred stock warrant liability and releases of valuation allowances for our deferred tax assets. Due to these and other factors, results for any particular quarter may not be indicative of results to be expected for any future quarter or fiscal year.
46
Table of Contents
Index to Financial Statements
The following table sets forth our unaudited quarterly condensed consolidated financial data for the periods presented. You should read the following table in conjunction with our audited consolidated financial statements and related notes appearing elsewhere in this prospectus.
| Fiscal 2009 | Fiscal 2010 | Fiscal 2011 | ||||||||||||||||||||||||||||||||||
| Q1 | Q2 | Q3 | Q4 | Q1 | Q2 | Q3 | Q4 | Q1 | ||||||||||||||||||||||||||||
| (in thousands, except per share and parcel yield amounts) | ||||||||||||||||||||||||||||||||||||
| Revenue |
$ | 38,801 | $ | 41,635 | $ | 42,532 | $ | 45,746 | $ | 42,672 | $ | 40,101 | $ | 41,151 | $ | 50,638 | $ | 50,927 | ||||||||||||||||||
| Cost of revenue |
30,670 | 33,531 | 32,887 | 34,956 | 32,632 | 30,461 | 31,053 | 38,685 | 38,810 | |||||||||||||||||||||||||||
| Gross profit |
8,131 | 8,104 | 9,645 | 10,790 | 10,040 | 9,640 | 10,098 | 11,953 | 12,117 | |||||||||||||||||||||||||||
| Operating income |
1,053 | 1,125 | 2,808 | 3,419 | 2,991 | 2,788 | 3,113 | 4,495 | 3,992 | |||||||||||||||||||||||||||
| Change in fair value of preferred stock warrant liability |
152 | 4,649 | 445 | (3,339 | ) | 1,432 | 3,730 | 3,332 | (1,232 | ) | 126 | |||||||||||||||||||||||||
| Income tax (expense) benefit |
(271 | ) | (299 | ) | (913 | ) | 5,537 | 523 | (1,221 | ) | (1,896 | ) | 4,159 | (2,051 | ) | |||||||||||||||||||||
| Net income |
$ | 601 | $ | 5,166 | $ | 2,000 | $ | 5,381 | $ | 4,659 | $ | 5,106 | $ | 4,391 | $ | 7,274 | $ | 2,064 | ||||||||||||||||||
| Net income (loss) attributable to common stockholders: |
||||||||||||||||||||||||||||||||||||
| Basic |
$ | 49 | $ | 929 | $ | 169 | $ | (420 | ) | $ | 687 | $ | 992 | $ | 780 | $ | 417 | $ | 232 | |||||||||||||||||
| Diluted |
$ | 78 | $ | 5,166 | $ | 289 | $ | (748 | ) | $ | 3,227 | $ | 1,376 | $ | 1,059 | $ | 755 | $ | 1,938 | |||||||||||||||||
| Net income (loss) per share attributable to common stockholders: |
||||||||||||||||||||||||||||||||||||
| Basic |
$ | 0.00 | $ | 0.01 | $ | 0.00 | $ | (0.01 | ) | $ | 0.01 | $ | 0.01 | $ | 0.01 | $ | 0.01 | $ | 0.00 | |||||||||||||||||
| Diluted |
$ | 0.00 | $ | 0.01 | $ | 0.00 | $ | (0.01 | ) | $ | 0.00 | $ | 0.00 | $ | 0.00 | $ | 0.01 | $ | 0.00 | |||||||||||||||||
| Average parcel yield |
$ | 4.60 | $ | 4.18 | $ | 4.10 | $ | 4.11 | $ | 4.03 | $ | 3.94 | $ | 3.88 | $ | 4.10 | $ | 4.22 | ||||||||||||||||||
| Parcel volume |
7,974 | 9,469 | 9,846 | 10,641 | 10,035 | 9,575 | 9,939 | 11,734 | 11,469 | |||||||||||||||||||||||||||
Liquidity and Capital Resources
Historically, we have financed our operations and business acquisitions and met our capital expenditure requirements primarily through the private sale of equity securities and debt financings. However, in the past three years, we have met our financing needs through cash generated from operations and our Prior Credit Facility. As of April 2, 2011, our primary source of liquidity consisted of cash totaling $4.5 million and $7.98 million of available credit under our Current Credit Facility. Working capital at April 2, 2011 was $8.1 million.
Our future capital requirements may vary materially from those now planned and will depend on many factors, including the costs to develop and implement new solutions and applications and the sales and marketing resources needed to further penetrate our market and gain acceptance of new solutions and applications we develop. Historically, we have experienced increases in our expenditures consistent with the growth of our operations and personnel, and we anticipate that our expenditures will continue to increase at the same historical rate as we grow our business, although not at the same historical rate. We believe that the net proceeds from this offering, our existing cash, expected cash generated from operations, and borrowing availability under our Current Credit Facility, will be sufficient to meet our operating needs for the next 12 months, including working capital requirements and capital expenditures. We anticipate that our capital expenditures during fiscal 2011 will not exceed $3.0 million. Of these expenditures, approximately $1.5 million relates to planned updates and maintenance of our SmartCenters and $1.2 million relates to new projects and maintenance on our corporate operations.
47
Table of Contents
Index to Financial Statements
Inflation
Inflation can have an impact on our results of operations. A prolonged period of inflation could cause interest rates, fuel, wages, and other costs to increase, which would adversely affect our results of operations unless freight rates correspondingly increase, in the case of our freight services business, and unless we are able to increase prices, in the case of our parcel solutions business. However, the effect of inflation has been minor over the past three years as, to the extent our costs have increased, we have been able to pass these cost increases onto our customers in the form of freight rate increases or price increases. For example, historically, we have passed increases in fuel costs on to our customers through a corresponding increase in fuel surcharge, minimizing the impact of the increased fuel costs on our operating results. If fuel costs escalate and we are unable to recover these costs with effective fuel surcharges, it would have an adverse effect on our results of operations and profitability.
Cash Flows
A summary of our changes in cash for fiscal years 2008, 2009, and 2010, and the first fiscal quarters of 2010 and 2011 is as follows:
| Fiscal Year | First Fiscal Quarter | |||||||||||||||||||
| 2008 | 2009 | 2010 | 2010 | 2011 | ||||||||||||||||
| (unaudited) | ||||||||||||||||||||
| (in thousands) | ||||||||||||||||||||
| Cash provided by operating activities |
$ | 6,194 | $ | 7,066 | $ | 18,479 | $ | 4,153 | $ | 3,023 | ||||||||||
| Cash used in investing activities |
(10,559 | ) | (2,879 | ) | (2,229 | ) | (161 | ) | (692 | ) | ||||||||||
| Cash provided by (used in) financing activities |
1,891 | (2,115 | ) | (17,311 | ) | (6,912 | ) | 82 | ||||||||||||
| Cash at end of period |
1,121 | 3,193 | 2,132 | 273 | 4,545 | |||||||||||||||
Cash Provided by Operating Activities
We generated $4.2 million and $3.0 million in cash from operations in the first fiscal quarter of 2010 and 2011, respectively. The decrease in cash provided by operating activities in the first fiscal quarter of 2011 compared to the first fiscal quarter of 2010 is primarily due to an increase in accounts receivable of $2.8 million as a result of the timing of customer payments and an increase in prepaid expenses of $1.6 million, of which $1.2 million relates to IPO expenses incurred in the current fiscal quarter, partially offset by improvements in the timing of vendor payments of $1.6 million in the current fiscal quarter. We generated $6.2 million, $7.1 million, and $18.5 million in cash from operations in fiscal 2008, 2009, and 2010, respectively. The increase in cash provided by operating activities in fiscal 2010 as compared to fiscal 2009 was primarily due to an increase in net income after adjustments for non-cash charges. The increase in cash provided by operating activities in fiscal 2009 as compared to fiscal 2008 was primarily due to an increase in net income after adjustments for non-cash charges, partially offset by an increase in working capital related to business growth.
Cash Used in Investing Activities
Cash used in investing activities was $10.6 million, $2.9 million, and $2.2 million in fiscal 2008, 2009, and 2010, respectively. Cash used in investing activities was $0.2 million and $0.7 million in the first fiscal quarter of 2010 and 2011, respectively. Investing activities in the first fiscal quarter of 2011, fiscal 2010, and fiscal 2009 related to investments in our information technology infrastructure. Cash used in investing activities in fiscal 2008 consisted primarily of $7.1 million related to our acquisition of Cornerstone Shipping Solutions, Inc.
Cash Provided by (Used in) Financing Activities
Cash provided by financing activities was $1.9 million in fiscal 2008 and cash used in financing activities was $2.1 million and $17.3 million in fiscal 2009 and 2010, respectively. Cash used and provided by financing
48
Table of Contents
Index to Financial Statements
activities in fiscal 2008, 2009, and 2010, including the first fiscal quarter of 2010, primarily relates to net principal payments and borrowings on our Prior Credit Facility. As of April 2, 2011 and January 1, 2011, we had no debt outstanding under our Current or Prior Credit Facility as all prior borrowings were repaid using cash generated from operations during fiscal 2010. Cash used in financing activities was $6.9 million in the first fiscal quarter of 2010 and cash provided by financing activities was $82,000 in the first fiscal quarter of 2011.
Indebtedness
Prior to March 2011, we utilized a senior secured credit facility, our Prior Credit Facility, provided by Comerica Bank. The Prior Credit Facility was secured by substantially all of our assets and provided senior secured financing of $24.9 million, consisting of a $22.6 million term loan facility and a $2.3 million revolving credit facility, which amounts were subsequently amended and decreased/increased to $17.1 million and $7.8 million, respectively. Available amounts under the revolving portion of our Prior Credit Facility were calculated against a borrowing base, which was limited to 80% of the net amount of eligible accounts receivable, as determined in accordance with the Prior Credit Facility agreement. Loans under the term loan facility bore interest at a floating rate based on our funded debt to EBITDA ratio (see Note 6 to our audited consolidated financial statements).
Historically, we used interest rate swap agreements in an effort to hedge our exposure to fluctuating interest rates related to our Prior Credit Facility. On August 29, 2008, we entered into an interest rate swap agreement for a notional amount of $10.2 million at a fixed LIBOR rate of 5.9%, which settled and expired on February 9, 2011. During fiscal 2008, 2009, and 2010, the weighted-average interest rate on our outstanding borrowings was 6.0%, 5.6%, and 5.5%, respectively.
Our Prior Credit Facility contained customary affirmative covenants regarding, among other things, the delivery of financial and other information to Comerica Bank, maintenance of records, compliance with law, maintenance of property and insurance, and conduct of our existing business, subject in each case to customary exceptions and qualifications. Our Prior Credit Facility also contained certain financial ratio covenants. We were required to maintain a funded debt to EBITDA ratio of less than 2.00:1.00 and a fixed charge coverage ratio of at least 1.25:1.00. Our Prior Credit Facility also contained customary negative covenants that limited our ability to, among other things, dispose of assets, make changes to our governing documents and certain of our agreements, have a change of control, enter into mergers or consolidations, incur additional indebtedness or guarantee indebtedness of others, create liens on our assets, prepay indebtedness, pay dividends and make other distributions on our capital stock, redeem and repurchase our capital stock, make investments, including acquisitions, and enter into transactions with affiliates.
Our Prior Credit Facility included events of default that were customary for a facility of its type, including non-payment default, covenant default (including breaches of the covenants described above), cross-default to other indebtedness, a default if a material adverse change in our business occurs, attachment and levy of material assets default, material inaccuracy of representations and warranties, bankruptcy, and insolvency default, and judgment default. Certain defaults were subject to materiality thresholds and grace periods customary for a facility of its type. The occurrence of an event of default under our Prior Credit Facility could have resulted in the triggering of default interest rates, the acceleration of outstanding term loans and revolving credit line loans, and the exercise of remedies by Comerica Bank. As of April 2, 2011 and January 2, 2010, we were in compliance with all applicable provisions of our Prior Credit Facility.
Our obligations to Comerica Bank under the Prior Credit Facility were also guaranteed by our wholly-owned subsidiary, Newgistics Freight Services, Inc., or NFS.
In March 2011, we terminated our Prior Credit Facility and established a new senior secured credit facility, our Current Credit Facility, with Comerica Bank. Our Current Credit Facility is secured by substantially all of our assets (other than intellectual property, except in certain circumstances) and consists of an $8.0 million revolving credit facility. Available amounts under the Current Credit Facility are calculated against a borrowing
49
Table of Contents
Index to Financial Statements
base, which is limited to 80% of the net amount of eligible accounts receivable, as determined in accordance with the Current Credit Facility agreement. As of April 2, 2011, our borrowing availability was $7.98 million under our Current Credit Facility. As of the date of this registration statement, we have no outstanding borrowings under our Current Credit Facility.
Loans outstanding under our Current Credit Facility bear interest per annum at a rate equal to the greater of (i) the prime rate of Comerica Bank plus 1%, or (ii) LIBOR plus 2.5%. Interest on the Current Credit Facility is payable monthly. The fee in respect to non-use of available funds is 0.125% and is payable quarterly. All loans under the Current Credit Facility may be repaid and reborrowed at any time without penalty or premium, with the balance of all loans due on March 1, 2013.
Our Current Credit Facility contains customary affirmative covenants regarding, among other things, the delivery of financial and other information to Comerica Bank, maintenance of records, compliance with law, maintenance of property and insurance and conduct of our existing business, subject in each case to customary exceptions and qualifications. Our Current Credit Facility also contains customary negative covenants that limit our ability to, among other things, dispose of assets, make changes to our governing documents and certain of our agreements, have a change of control, enter into mergers or consolidations, incur additional indebtedness or guarantee indebtedness of others, create liens on our assets, prepay indebtedness, pay dividends and make other distributions on our capital stock, redeem and repurchase our capital stock, make investments, including acquisitions, and enter into transactions with affiliates.
Our Current Credit Facility contains events of default that are customary for a facility of this type, including non-payment default, covenant default (including breaches of the covenants described above), cross-default to other indebtedness, a default if a material adverse change in our business occurs, attachment and levy of material assets default, material inaccuracy of representations and warranties, bankruptcy, and insolvency default and judgment default. Certain of the defaults are subject to materiality thresholds and grace periods usual for a facility of this type. The occurrence of an event of default under our Current Credit Facility could result in the triggering of default interest rates, the acceleration of the outstanding revolving loans and the exercise of remedies by Comerica Bank.
Our obligations to Comerica Bank under the Current Credit Facility are also guaranteed by NFS.
As of April 2, 2011 and January 1, 2011, we had no outstanding borrowings under our Current or Prior Credit Facility and $7.98 million and $7.8 million in available credit, respectively, under our revolving credit facility, after giving effect to all reserves. As of January 2, 2010, we had $12.8 million and $4.5 million of outstanding borrowings under the term loan and revolving credit line, respectively, and $2.8 million of borrowing availability after giving effect to all reserves.
Contractual Obligations and Commitments
The following table summarizes our contractual obligations associated with lease and purchase obligations as of January 1, 2011:
| Payments Due by Period | ||||||||||||||||||||
| Total | Less than 1 year | 1-3 Years | 3-5 Years | After 5 Years | ||||||||||||||||
| (in thousands) |
||||||||||||||||||||
| Operating leases (1) |
$ | 3,962 | $ | 2,090 | $ | 1,652 | $ | 220 | $ | - | ||||||||||
| Purchase obligations (2) |
209 | 201 | 8 | - | - | |||||||||||||||
| $ | 4,171 | $ | 2,291 | $ | 1,660 | $ | 220 | $ | - | |||||||||||
| (1) | Includes future minimum lease payments. |
| (2) | Consists of minimum services and goods we are committed to purchase in the ordinary course of business. Purchase obligations do not include contracts we can terminate without cause with little or no penalty to us. |
50
Table of Contents
Index to Financial Statements
Critical Accounting Policies and Estimates
Our management’s discussion and analysis of financial condition and results of operations is based upon our financial statements, which have been prepared in accordance with U.S. generally accepted accounting principles, or GAAP. The preparation of these financial statements requires us to make estimates and judgments that affect the reported amounts of assets, liabilities, revenue, and expenses, and related disclosure of contingent assets and liabilities. We evaluate our estimates on an ongoing basis. We base our estimates on historical experience and on various other assumptions that we believe to be reasonable under the circumstances, the results of which form the basis for making judgments about the carrying values of assets and liabilities that are not readily apparent from other sources. To the extent that actual events differ from our estimates and assumptions, there could be a material impact on our financial statements.
In many cases, the accounting treatment of a particular transaction is specifically dictated by GAAP and does not require management’s judgment in its application, while in other cases, management’s judgment is required in selecting among available alternative accounting standards that allow different accounting treatment for similar transactions. We believe that our significant accounting policies, which are described in note 2 to our audited consolidated financial statements, and the accounting policies discussed below are critical to understanding our historical and future performance, as these policies relate to the more significant areas involving management’s judgments and estimates. Our management has reviewed these critical accounting policies, our use of estimates and the related disclosures with our audit committee and our independent registered public accounting firm.
Revenue Recognition
We primarily generate revenue from each parcel shipped and each freight load transacted on behalf of our customers. Revenue is recognized in accordance with ASC Topic 605 “Revenue Recognition” when persuasive evidence of an agreement exists, delivery has occurred, the fee is fixed or determinable, and collection is probable.
Within our parcel solutions segment, we generate revenue through service fees charged for the shipment and processing of individual parcels. Revenue is recognized at an individual parcel level and varies depending on USPS defined mail class, distance traveled, fuel prices, and parcel characteristics, such as weight, dimension, and shape. Revenue for delivery of parcels is recognized upon delivery to a USPS location, which concludes our contractual service obligation. Revenue for parcel returns is recognized when parcels are delivered to customers’ distribution centers, which concludes our contractual service obligation.
Within our freight services segment, for LTL services, we negotiate transportation rates with carriers on behalf of our customers and generate commissions based on our customers’ gross LTL carrier billings. Because we are acting as an agent in the arrangement, commission revenue paid by carriers is recognized on a net basis at the time carrier invoices are received, in accordance with the provisions of ASC 605-45 “Principal Agent Considerations.” For truckload brokerage services, we generate revenue by procuring transportation services on behalf of our customers. Truckload brokerage revenue is recognized upon receiving parcel delivery confirmation from carriers. Retainer revenue for aggregation services is recognized monthly as the services are performed.
Amounts received for services in advance of completion of such services are recorded as deferred revenue.
Allowance for Doubtful Accounts
Based on a review of the current status of our existing accounts receivable and historical collection experience, we have established an estimate of our allowance for doubtful accounts. We make judgments as to our ability to collect outstanding receivables and provide allowances for a portion of receivables when collection becomes doubtful. Provisions are made based on a consideration of the aging of the accounts
51
Table of Contents
Index to Financial Statements
receivable balances, historical write-off experience, current economic conditions and customer-specific information. For those invoices not specifically reviewed, provisions are made based on our collection history and current economic trends. If our actual collections are lower than expected, additional allowances for doubtful accounts may be needed and our future results of operations and cash flows could be negatively affected. Write-offs of accounts receivable and recoveries were insignificant during each of fiscal 2008, 2009, and 2010, and the first fiscal quarter of 2011. A one percent change in our allowance for doubtful accounts would not have a material effect on our consolidated financial statements.
Long-lived Assets, Including Goodwill and Identifiable Intangible Assets
We apply ASC Topic 350 “Intangibles—Goodwill and Other” in accounting for the valuation of goodwill and identifiable intangible assets. In accordance with this guidance, we assess our goodwill on the first day of the fourth fiscal quarter of each year, or more frequently if we believe events or changes in circumstances indicate that goodwill might be impaired. The events and circumstances that we consider include deterioration in the performance of the acquired business, adverse market conditions, adverse changes in applicable laws or regulations, including changes that restrict the activities of the acquired business, and a variety of other circumstances. Because we operate in two segments, we perform the impairment test for each segment or reporting unit by comparing the estimated fair value of each segment to the carrying value of the goodwill in each of the respective segments. Our goodwill impairment test requires the use of fair-value techniques which are inherently subjective.
We determine fair value using a combination of the income approach, which utilizes a discounted cash flow model, and the market value approach. Both of these approaches are developed from the perspective of a market participant. Under the income approach, we calculate the fair value of the segment or reporting unit based on the present value of estimated future cash flows. Under the market approach, we estimate the fair value based on market multiples of revenue and earnings for comparable publicly traded companies or comparable sales transactions of similar companies. The estimates and assumptions used in our calculations include revenue growth rates, expense growth rates, expected capital expenditures to determine projected cash flows, expected tax rates, and an estimated discount rate to determine present value of expected cash flows. These estimates are based on historical experiences, our projections of future operating activity and our weighted-average cost of capital.
Both of these approaches include inherent uncertainties. With the income approach there are uncertainties around our estimates of the future cash flows of our segments; the most significant of which include our estimates of future revenue growth, operating expense growth, and projected cash flows from operations. In making these estimates, we have considered factors important to our business, including gross bookings, pricing, market penetration, competition, seasonality, and customer churn. With the market approach, uncertainties exist around future market valuations of comparable publicly traded companies. Significant changes in these estimates or their related assumptions in the future for the income and market approaches could result in an impairment charge related to our goodwill. As of January 1, 2011 and April 2, 2011, our goodwill balance was $6.5 million.
In addition, we periodically review the estimated useful lives of our identifiable intangible assets, taking into consideration any events or circumstances that might result in either a diminished fair value or revised useful life, using a two-step approach. The first step screens for impairment and, if impairment is indicated, we will employ a second step to measure the impairment. If we determine that impairment has occurred, we will record a write-down of the carrying value and charge the impairment as an operating expense in the period the determination is made. Although we believe goodwill and intangible assets are appropriately stated in our consolidated financial statements, changes in strategy or market conditions could significantly impact these judgments and require an adjustment to the recorded balance. There was no impairment of goodwill or intangible assets with indefinite lives in fiscal years 2008, 2009, or 2010, or the first fiscal quarter of 2011.
In accordance with ASC Topic 360-10 “Property, Plant and Equipment,” we test long-lived assets for impairment when events or changes in circumstances may indicate that the carrying amount of an asset may not
52
Table of Contents
Index to Financial Statements
be recoverable. Recoverability of long-lived assets is measured by a comparison of the carrying amount of an asset to the undiscounted future net cash flows expected to be generated by the asset. If such assets are considered to be impaired, the impairment to be recognized is measured as an amount by which the carrying amount of the assets exceed the discounted future net cash flows.
Preferred Stock Warrants
Freestanding warrants related to shares that are redeemable are accounted for in accordance with the applicable guidance in ASC Topic 480 “Distinguishing Liabilities from Equity.” Under the provisions of this guidance, we classify the freestanding warrants that are related to our convertible preferred stock as a liability on our consolidated balance sheets. The warrants are subject to re-measurement at each balance sheet date, and we recognize any change in fair value as a component of other income (expense). We will continue to adjust the liability for changes in fair value until the earlier of (1) the exercise or expiration of the warrants or (2) the completion of a liquidation event, including the completion of an initial public offering, at which time all preferred stock warrants remaining unexercised will be converted into warrants to purchase common stock and the liability will be reclassified to additional paid-in capital.
We estimate the fair value of the preferred stock warrant liability using the Black-Scholes valuation model which requires us to make a number of estimates and assumptions. For the valuation inputs to the Black-Scholes valuation model, we utilized the following assumptions: (1) estimated fair value of preferred stock—the fair value of our common stock; (2) exercise price—the exercise price of the warrant units; (3) expected life—the remaining term of the warrant units; (4) risk-free interest rate—the U.S. Treasury yield curve in place at each quarterly measurement date; (5) dividend yield—zero; (6) forfeiture rate—zero; and (7) volatility—the same as used for the common stock option grants made during the quarter of each measurement.
| Fiscal Year | First Fiscal Quarter |
|||||||||||||||
| 2008 | 2009 | 2010 | 2011 | |||||||||||||
| (unaudited) | ||||||||||||||||
| Weighted-average fair value of warrants outstanding |
$ | 0.14 | $ | 0.13 | $ | 0.09 | $ | 0.08 | ||||||||
| Risk-free interest rate |
1.25 | % | 0.68 | % | 0.26 | % | 0.26 | % | ||||||||
| Expected volatility |
53.9 | % | 45.0 | % | 29.2 | % | 28.9 | % | ||||||||
| Weighted-average expected life in years |
4.25 | 3.26 | 2.20 | 7.88 | ||||||||||||
| Dividend yield |
0 | % | 0 | % | 0 | % | 0 | % | ||||||||
In estimating the fair value of the convertible preferred stock, we consider the following factors, among others: market transactions with preferred stockholders; quarterly valuation results for the common stock as determined by the board of directors; the rights and privileges of the convertible preferred stockholders in comparison to the common stockholders and expectations of the convertible preferred stockholders regarding our future possible liquidity events. There have been limited market transactions with preferred stockholders, and therefore we have placed a higher consideration on the other noted factors. In considering the above factors, we concluded that the estimated fair value of our common stock was the best indicator of the fair value of the redeemable convertible preferred stock and thus utilized the fair value of the common stock as a reasonable estimate of the fair value of the convertible preferred stock. Significant judgment is required in determining the expected volatility of our common stock. The expected volatility of the stock is determined based on our peer group in the industry in which we do business because we do not have historical volatility data for our own stock. In the future, as we gain historical data for volatility in our own stock, expected volatility may change which could substantially change the measurement date fair value and ultimately the other income (expense) we record.
Stock-Based Compensation
Prior to January 1, 2006, we accounted for employee stock options using the intrinsic value method in accordance with Accounting Principles Board Opinion No. 25, “Accounting for Stock Issued to Employees,” or
53
Table of Contents
Index to Financial Statements
APB No. 25, and Financial Accounting Standards Board, or FASB, Interpretation No. 44, “Accounting for Certain Transactions Involving Stock Compensation, an Interpretation of APB No. 25.” The intrinsic value represents the difference between the per share market price of the stock on the date of grant and the per share exercise price of the respective stock option. We generally grant stock options to employees for a fixed number of shares with an exercise price equal to the fair value of the shares on the date of grant. Under APB No. 25, no compensation expense was recorded for employee stock options granted at an exercise price equal to the market price of the underlying stock on the date of grant.
On January 1, 2006, we adopted the provisions of the applicable guidance under ASC Topic 718 “Compensation—Stock Compensation” for share-based payment transactions. Under the provision of this guidance, stock-based compensation costs for employees are measured on the grant date, based on the estimated fair value of the award on that date, and are recognized as expense over the employee’s requisite service period, which is generally over the vesting period, on a straight-line basis. We adopted this guidance using the prospective transition method. Under this transition method, non-vested option awards outstanding on January 1, 2006, continue to be accounted for under the minimum value method, and all awards granted, modified or settled after the date of adoption are accounted for using the measurement, recognition and attribution provisions of this guidance.
Under the provisions of this guidance, we make a number of estimates and assumptions. The estimation of stock awards that will ultimately vest requires judgment, and to the extent actual results differ from our estimates, such amounts will be recorded as an adjustment in the period estimates are revised. Actual results may differ substantially from these estimates. In valuing share-based awards under this guidance, significant judgment is required in determining the expected volatility of our common stock and the expected term individuals will hold their share-based awards prior to exercising. Expected volatility of the stock is based on our peer group in the industry in which we do business because we do not have historical volatility data for our own stock. The expected term of options granted represents the period of time that options granted are expected to be outstanding and is calculated based on historical information. In the future, as we gain historical data for volatility in our own stock and more data on the actual term employees hold our options, expected volatility and expected term may change, which could substantially change the grant-date fair value of future awards of stock options and ultimately the expense we record.
During 2010 and the first fiscal quarter of 2011, we granted options to purchase our common stock as follows, utilizing the following assumptions in accordance with ASC Topic 718:
| Grant Date |
No. Shares |
Per Share Exercise Price |
Black- Scholes Per Share Fair Value |
Aggregate Fair Value |
Estimated Fair Market Value of Common Stock |
Dividend Yield |
Volatility | Expected Life (Years) |
Forfeitures | Risk-Free Interest Rate |
||||||||||||||||||||||||||||||||||
| 2010: |
||||||||||||||||||||||||||||||||||||||||||||
| First Quarter |
2/23/2010 | 3,500,000 | $ | 0.14 | $ | 0.06 | $ | 210,000 | $ | 0.14 | 0 | % | 49.2 | % | 6.0 | 20.0 | % | 2.48 | % | |||||||||||||||||||||||||
| Second Quarter |
- | - | - | - | - | - | - | - | - | - | - | |||||||||||||||||||||||||||||||||
| Third Quarter |
- | - | - | - | - | - | - | - | - | - | - | |||||||||||||||||||||||||||||||||
| Fourth Quarter |
10/20/2010 | 1,250,000 | $ | 0.18 | $ | 0.06 | $ | 72,625 | $ | 0.18 | 0 | % | 38.9 | % | 6.0 | 2.0 | % | 1.41 | % | |||||||||||||||||||||||||
| 2011: |
||||||||||||||||||||||||||||||||||||||||||||
| First Quarter |
2/9/2011 | 4,500,000 | $ | 0.21 | $ | 0.12 | $ | 531,600 | $ | 0.21 | 0 | % | 58.1 | % | 6.0 | 14.9 | % | 2.7 | % | |||||||||||||||||||||||||
54
Table of Contents
Index to Financial Statements
As of April 2, 2011, we had approximately $0.7 million of unrecognized stock-based compensation expense that will be expensed over a weighted-average period of approximately 3.09 years. The table below shows the intrinsic value of our outstanding vested and unvested options as of April 2, 2011 at the initial public offering price of $ per share, the mid-point of the price range on the cover of this prospectus.
| No. Options Outstanding |
Number of Shares Underlying Options |
Aggregate Intrinsic Value |
||||||
| Vested |
105,254,009 | |||||||
| Unvested |
9,892,793 | |||||||
| Total |
115,146,802 | |||||||
Significant Factors, Assumptions and Methodologies Used in Determining Fair Value
In valuing our common stock, our board of directors utilized valuation methodologies such as an income approach, a market approach and a probability weighted expected return method to estimate the value of our common stock based upon an analysis of expected future cash flows considering possible future liquidity events, as well as the rights and preferences of each share class.
In determining the value of our common stock from the first quarter of 2010 through the third quarter of 2010, our board of directors analyzed fair value using an income approach and a market approach. The income approach seeks to derive the present value of an enterprise based on a discount of future economic benefits. In performing the income approach, our board of directors used the discounted cash flow method. In performing the market approach, our board used the Guideline Public Company Method. The Guideline Public Company Method attempts to determine enterprise value based on comparisons to public companies in similar lines of business.
In determining the value of our common stock starting in the fourth quarter of 2010, our board of directors utilized the probability weighted expected return method and considered four possible scenarios: (i) an acquisition by another company, or an acquisition scenario, (ii) the completion of an initial public offering, or an IPO scenario, (iii) a delayed IPO scenario, and (iv) remaining private, or a private scenario.
In valuing our common stock in the acquisition scenario, we determine a business enterprise value of our company using an income approach which estimates the present value of future estimated debt-free cash flows, based upon forecasted revenue and costs. Our board of directors adds these discounted cash flows to the present value of our estimated enterprise terminal value, the multiple of which is derived from comparable company market data. Our board of directors discounts these future cash flows to their present values using a rate corresponding to our estimated weighted average cost of capital.
In valuing our common stock in the IPO and delayed IPO scenarios, we utilize a market approach which estimates the fair value of a company by applying to that company the market multiples of publicly traded companies operating within the same industry. Based on the range of these observed multiples, we exercise judgment in determining an appropriate multiple to apply to our metrics in order to derive an indication of value.
In valuing our common stock in the private scenario, we apply the income approach utilizing a terminal period value calculated using the Gordon growth model and a residual revenue growth rate in the terminal year based on our expectation of long-term growth.
First Quarter 2010
In the first quarter of 2010, our board of directors considered our performance as well as a valuation report to determine a fair value of our common stock equal to $0.14 per share. The determination was based on the present value of estimated future net cash flows under the income approach and an increase in EBITDA growth for comparable public companies within our industry under the Guideline Public Company Method.
55
Table of Contents
Index to Financial Statements
Second Quarter 2010
In the second quarter of 2010, we did not issue any stock options and therefore our board of directors did not analyze the fair value of our common stock.
Third Quarter 2010
In the third quarter of 2010, we did not issue any stock options and therefore our board of directors did not analyze the fair value of our common stock.
Fourth Quarter 2010
In the fourth quarter of 2010, the U.S. economy continued to stabilize, U.S. stock markets continued to improve, access to capital and debt markets increased, our sales performance showed considerable improvement, and the enterprise value of comparable publicly-traded peers improved. We also commenced due diligence on our IPO process and representatives of our underwriters provided us with estimated valuation ranges for our initial public offering assuming an offering in the second quarter of 2011. Our board of directors considered the above factors, a valuation report dated October 2, 2010, and the probability weighted expected return method to arrive at a fair value of our common stock of $0.18 per share.
First Quarter 2011
In the first quarter of 2011, we continued our IPO process and our sales performance continued to improve. Our board of directors considered the above factors, a valuation report dated January 1, 2011, and the probability weighted expected return method to arrive at a fair value of our common stock of $0.21 per share.
Deferred Tax Asset Valuation Allowance
We recognize deferred tax assets and liabilities based on the differences between the financial statement carrying amount and the tax basis of assets, liabilities, and net operating loss carryforwards. We establish valuation allowances when the recovery of a deferred tax asset is not likely based on historical income, projected future income, the expected timing of the reversals of temporary differences, and the implementation of tax-planning strategies. Significant management judgment is required to determine our provision for income taxes and whether deferred tax assets will be realized in full or in part.
Our net deferred tax asset balance was approximately $12.1 million at April 2, 2011 and primarily related to prepaid and accrued expenses and net operating loss carryforwards. As of April 2, 2011, we did not maintain a valuation allowance related to our ability to realize net operating loss carryforwards in future periods.
Off-Balance Sheet Arrangements
We do not have any off-balance sheet financing arrangements and we do not have any relationships with unconsolidated entities or financial partnerships, such as entities often referred to as structured finance or special purpose entities, which have been established for the purpose of facilitating off-balance sheet arrangements or other contractually narrow or limited purposes.
Quantitative and Qualitative Disclosures About Market Risk
Interest Rate Risk
We had cash of $1.1 million, $3.2 million, $2.1 million, and $4.5 million as of January 3, 2009, January 2, 2010, January 1, 2011, and April 2, 2011, respectively. Any declines in interest rates will reduce future interest income. If overall interest rates had fallen by 10% in fiscal 2010, our interest income would not have been materially affected.
56
Table of Contents
Index to Financial Statements
During fiscal 2010, outstanding borrowings under our Prior Credit Facility bore interest at Comerica Bank’s prime rate plus 0.75% or 6%. As of January 1, 2011 and April 2, 2011 we had no outstanding borrowings under our Prior Credit Facility. In March 2011, we terminated our Prior Credit Facility and established our Current Credit Facility, and we currently have no outstanding borrowings under our Current Credit Facility. If overall interest rates had increased by 10% in fiscal 2010, our interest expense would have increased by $0.7 million. If overall interest rates had increased by 10% during the first fiscal quarter of 2011, our interest expense would not have changed as we had no outstanding borrowings under our Current Credit Facility.
Foreign Currency Risk
Our results of operations and cash flows are not subject to fluctuations due to changes in foreign currency exchange rates. We bill our customers in U.S. dollars and receive payment in U.S. dollars, and all of our operating expenses are denominated in U.S. dollars.
Internal Control Over Financial Reporting
The SEC, pursuant to Section 404 of the Sarbanes-Oxley Act, adopted rules requiring that a reporting company’s management report on and its independent registered public accounting firm attest to the company’s internal control over financial reporting in the company’s annual report. Our first Annual Report on Form 10-K to be filed following the completion of the offering will not include a report of management’s assessment regarding internal control over financial reporting or an attestation report from our independent registered public accounting firm due to a transition period established by SEC rules applicable to newly public companies. Management will be required to provide an assessment of the effectiveness of our internal control over financial reporting as of December 30, 2012.
Recent Accounting Pronouncements
In October 2009, the FASB updated FASB ASC 605, “Revenue Recognition” that amended the criteria for separating consideration in multiple-deliverable arrangements. The amendments establish a selling price hierarchy for determining the selling price of a deliverable. The selling price used for each deliverable will be based on vendor-specific objective evidence if available, third–party evidence if vendor-specific objective evidence is not available, or the estimated selling price if neither vendor-specific objective evidence nor third-party evidence is available. The amendments will change the application of the residual method of allocation and require that arrangement consideration be allocated at the inception of the arrangement to all deliverables using the relative selling price method. The relative selling price method allocates any discount in the arrangement proportionally to each deliverable on the basis of each deliverable’s selling price. This update will be effective prospectively for revenue arrangements entered into or materially modified in fiscal years beginning on or after June 15, 2010. Early adoption is permitted. We believe the impact of adoption of this update will not have a material effect on our financial position or results of operations.
In January 2010, the FASB updated FASB ASC 820, “Fair Value Measurements and Disclosures,” requires additional disclosures and clarifies existing disclosures regarding fair value measurements. The additional disclosures include (i) transfers in and out of Levels 1 and 2 and (ii) activity in Level 3 fair value measurements. The update provides amendments that clarify existing disclosures on (i) level of disaggregation and (ii) disclosures about inputs and valuation techniques. This update is effective for interim and annual reporting periods beginning after December 15, 2009, except for the disclosures about purchases, sales, issuances, and settlements in the roll forward of activity in Level 3 fair value measurements. These disclosures are effective for fiscal years beginning after December 15, 2010, and for interim periods within those fiscal years. We adopted the update on January 3, 2010 as required and concluded it did not have a material impact on our consolidated financial position or results of operations.
57
Table of Contents
Index to Financial Statements
Our Company
We are a leading U.S. provider of technology-enabled parcel and freight transportation solutions to direct-to-consumer retailers, manufacturers, distributors, and third-party logistics and fulfillment providers. We operate in two business segments: parcel solutions and freight services.
In our parcel solutions business, we manage and arrange the delivery of large volumes of parcels from e-commerce, catalogue, and televised home shopping retailers primarily to consumers’ homes and, in the case of merchandise returns, from consumers back to retailers. By consolidating parcels from many customers and consumers and using the United States Postal Service, or the USPS, for last-mile delivery and first-mile pickup, we are able to provide cost-effective, reliable, and convenient shipping solutions. Utilizing our proprietary, web-based technology platform, we believe our customers are able to improve their parcel shipping processes, reduce transportation and inventory costs, and improve consumer satisfaction. We provide parcel solutions to many leading U.S. online, catalogue, and other direct-to-consumer retailers, and leading third-party logistics providers, including CDS Global, Inc., GENCO ATC, Lands’ End, Mason, Neiman Marcus, QVC, Universal Screen Arts Group, and Victoria’s Secret, who constituted eight of our top twelve customers based on revenue during the first fiscal quarter of 2011.
We offer a national, integrated parcel delivery and return solution to our parcel customers. For parcel deliveries, we consolidate many customers’ parcels having the same regional destination at one of our six SmartCenter parcel processing and distribution facilities and transport them to USPS distribution facilities in those regions to take advantage of lower cost USPS local delivery rates. For merchandise returns, the USPS picks up parcels from many consumers in the same region and consolidates them at USPS distribution facilities where we retrieve and transport them to one of our SmartCenters to be returned to our customers in aggregated shipments. We received, sorted, and transported an aggregate of approximately 41.3 million parcels and 11.5 million parcels at our SmartCenter distribution and processing facilities in fiscal 2010 and the first fiscal quarter of 2011, respectively.
Our proprietary, web-based technology platform, Intelligent Logistics Management, or ILM, can be integrated with our customers’ and third-party enterprise systems, thus enabling us to customize our parcel solutions to meet the requirements of each customer’s unique supply chain strategy. Through our technology platform, our customers are able to track individual parcels, receive in-transit parcel status and delivery confirmations, and transfer shipment-level data to their financial and customer management systems. Our customers have the ability to create customized reports using our software tools, enabling them to monitor service quality, confirm billing accuracy, and perform business analysis to identify potential operational improvements related to parcel deliveries and returns. We create and host customer-branded websites in which consumers can track parcels, initiate the return or exchange process, and arrange for pickup of returns. We believe these tools allow our customers to significantly reduce call center costs and improve the overall consumer shopping experience.
We created an innovative parcel return solution that utilizes the extensive USPS local network and our proprietary software applications to improve the consumer return process, a key factor in maintaining consumer satisfaction with direct-to-consumer shopping. Our Newgistics SmartLabel technology and strategic alliance with the USPS simplifies the returns process by offering consumers pre-paid return via pickup from their home or workplace or drop off at any USPS collection box or Post Office. Specific product and consumer data embedded in the intelligent barcodes in our Newgistics SmartLabel provide our customers with the ability to sort and process returned merchandise based on predetermined business rules. This feature provides our customers visibility into their return process, which we believe allows them to manage inventory more efficiently and process credit to consumers more quickly.
58
Table of Contents
Index to Financial Statements
In our freight services business, we offer a range of less-than-truckload, or LTL, truckload, and expedited transportation management solutions that utilize capacity provided by third-party carriers. Our freight services offerings include rate negotiation, carrier selection, carrier and routing management, bill and audit administration, and consolidated freight payment services. For LTL services, after an in-depth consultation and analysis with our customer to identify cost savings opportunities, we negotiate transportation rates and terms with carriers on behalf of our customers, providing our customers with committed capacity, responsive service, and rate transparency. Our customers benefit from our aggregate buying power, and as a result, we believe we are able to reduce our customers’ total annual transportation and logistics costs by approximately 10% to 20%, while providing high quality service.
For both our parcel solutions and our freight services businesses, we utilize a non-asset based operating model. We do not own the transportation equipment used to transport our customers’ shipments. Instead, we rely on the USPS for local pickup and delivery of parcels, and capacity provided by third-party carriers for all of our other parcel and freight services transportation requirements. Our SmartCenter processing and distribution facilities are leased with terms of three to four years. As a result, our business model requires minimal capital investment or fixed expenses, resulting in enhanced free cash flow and return on our invested capital.
We are led by an experienced management team with extensive industry knowledge. We believe that our focus on quality, innovation and customer service, extensive distribution network, and strong relationships with the USPS and third-party carriers have contributed to our leading market position.
We believe the significant growth we have experienced reflects both our ability to provide valuable services at a competitive price and the substantial growth in the direct-to-consumer retail industry. In 2007, we complemented our organic growth with the successful acquisition of two businesses that enabled us to expand our distribution network and service offerings. Our revenue for fiscal 2008, 2009, and 2010 was $129.3 million, $168.7 million, and $174.6 million, respectively, representing a 16.2% compound annual growth rate over the same period. Our operating income for fiscal 2008, 2009, and 2010 was $3.9 million, $8.4 million, and $13.4 million, respectively, representing a 86.1% compound annual growth rate for the same period. Our net income for fiscal 2008, 2009, and 2010 was $3.8 million, $13.1 million, and $21.4 million, respectively. Please see our Selected Consolidated Financial and Other Data, including the adjustments to net income related to our preferred stock warrant liability and net deferred tax asset valuation allowance. See note 13 to our consolidated financial statements for financial information for each our reportable segments.
Market Opportunity
Our parcel solutions segment operates within the rapidly growing direct-to-consumer parcel market while our freight services segment operates within the third-party logistics, or 3PL, market. Both markets are large and have favorable trends that we believe provide us significant growth opportunities.
Direct-to-Consumer Parcel Market
According to The Colography Group, or Colography, a leading research and consulting firm to the transportation industry, in a study commissioned by us, revenue generated in the less-than-70 pound domestic U.S. parcel market, the primary market in which our parcel solutions business participates, was $54.8 billion in 2009. In the same study, Colography estimates that $37.7 billion of this market was related to delivery of parcels with transit times of two or more days, of which approximately 31%, measured by number of shipments, represented deliveries from businesses to residences, or direct-to-consumer deliveries.
We believe the growth of the domestic parcel market is increasingly being driven by growth in direct-to-consumer retail sales, especially growth in e-commerce retail sales. Retailers, manufacturers, and distributors are increasingly responding to changing consumer purchasing patterns by using multiple direct-to-consumer channels such as websites, catalogues, television commercials, shopping networks, smartphones, and other mobile devices and media to market and sell products. Utilizing direct-to-consumer channels in addition to, or in lieu of, brick-and-mortar store locations allows retailers to capture sales to consumers who prefer to shop through alternative channels.
59
Table of Contents
Index to Financial Statements
We believe a number of key trends are reshaping the retail industry, positively affecting the direct-to-consumer parcel market, including:
The growth of direct-to-consumer retail sales is significantly outpacing the growth of the broader retail market. According to the U.S. Census Bureau, sales from electronic shopping and mail-order houses increased at a 9.1% compound annual growth rate from $113.9 billion in 2000 to $270.8 billion in 2010. During this same period, total retail sales increased at only a 2.8% compound annual growth rate. In 2010, sales from electronic shopping and mail-order houses increased 15.7%, while total retail sales increased 7.0%. In 2009, e-commerce sales represented the largest and one of the fastest growing components of sales from electronic shopping and mail-order houses. According to the U.S. Census Bureau, e-commerce sales increased at a 20.1% compound annual growth rate, from $27.5 billion in 2000 to $143.4 billion in 2009, the latest annual data available. We believe the following trends will drive continued growth in the direct-to-consumer retail market:
| • | traditional brick-and-mortar retailers are increasingly using the internet as an alternative sales channel and distinct profit-generating business unit; |
| • | online purchases are increasing as consumers take advantage of the convenience of increased product selection and availability of online shopping, and improvements in security and electronic payment technology; |
| • | adoption of mobile internet applications is accelerating and rapid introduction of new mobile technologies is improving internet accessibility and expanding the number of internet users; and |
| • | direct-to-consumer retailers are increasingly offering free shipping and adopting services that make the return process more convenient, in an effort to improve consumer satisfaction. |
The increase in direct-to-consumer sales and marketing channels is creating challenges for retailers. Fulfilling direct-to-consumer orders creates customer service and supply chain management challenges for retailers. Consumers want both the convenience of shopping online and reliable, on-time parcel delivery. However, since consumers shopping online cannot inspect the merchandise at the time of purchase, they return or exchange merchandise at a higher rate than when shopping in a store. Both the consumer and retailer desire to track these deliveries and returns, with the consumer expecting a prompt credit for returned merchandise and the retailer wanting to quickly and efficiently return merchandise to stock.
A convenient, cost-effective parcel return and delivery capability is critical to direct-to-consumer retailers. We believe reliable, convenient, and cost-effective parcel return and delivery services are an essential component of successful direct-to-consumer retail sales strategies, and are increasingly a point of competitive differentiation among retailers. Direct-to-consumer retailers also desire return and delivery solutions that enable them to improve inventory management, streamline supply chain processes, and ensure consumer satisfaction. Critical elements of a parcel return and delivery service meeting these needs include:
| • | reliable, convenient, and cost-effective parcel shipping; |
| • | shipment tracking during return and delivery; |
| • | technology integration into the customers’ enterprise systems to allow them to efficiently manage their supply chain processes; |
| • | pre-paid return via pickup at home, work, or other convenient location; |
| • | flexible solutions tailored to the specific needs of the retailer and their customer; and |
| • | a high level of customer service supported by an understanding of the retailers’ business practices. |
Third-Party Logistics Services Market
Our freight services segment operates in the U.S. 3PL services market. According to Armstrong & Associates, Inc., or Armstrong, a leader in supply chain market research and consulting, the outsourced U.S. 3PL market grew at a compound annual rate of 10.1%, from 2000 to 2008 before declining 15.7% in 2009. In
60
Table of Contents
Index to Financial Statements
January 2011, Armstrong estimated that the U.S. 3PL market grew 13.5% to $121.6 billion in 2010 and that in 2010, $36.2 billion of this market would be related to the domestic transportation management market, the primary market in which our freight services business operates.
Today’s business environment requires companies to continually improve the efficiency and cost-effectiveness of their distribution services while maintaining focus on core competencies. Companies face competitive pressures to reduce transportation costs and improve customer service and are increasingly recognizing the efficiencies of outsourcing. This trend towards outsourcing certain supply chain functions is driving the use of 3PL providers such as freight brokers, freight forwarders, customs brokers, warehouse providers, transportation management providers, and distribution companies.
Our Competitive Strengths
We believe the following competitive strengths will continue to drive our success in the future:
Leading value-added parcel return solution. We collaborated with the USPS during the development of the Parcel Return Service, or PRS, a USPS program that permits approved providers to retrieve returned parcels from designated USPS facilities. We were the first USPS-approved PRS provider, and, as of April 2, 2011, we, United Parcel Service, Inc., or UPS, and FedEx Corporation, or FedEx, were the only approved PRS providers. During the 12-month period ended September 30, 2010, we shipped approximately 22.9 million parcel returns, representing approximately 80.4% of the returns shipped through the PRS program during that period. Our parcel return solution simplifies the returns process by offering consumers pre-paid return via pickup by the USPS at the consumer’s home or workplace or via drop-off at any USPS collection box or Post Office. We create and host customer-branded websites where consumers can initiate returns or exchanges, obtain return shipping labels, arrange for pickup at their residences, and track parcels. Intelligent barcodes embedded in our Newgistics SmartLabel provide our customers with order, product, and consumer data more quickly, enabling them to more efficiently manage their transportation and returns processing resources.
Reliable and cost-effective integrated parcel return and delivery network. Our transportation network is designed to meet the growing demand from direct-to-consumer retailers for a reliable, cost-effective, and convenient return and delivery service. We use our technology platform to integrate our SmartCenters and third-party carriers and rely on the USPS first-mile and last-mile network to provide a reliable residential transportation service with end-to-end shipment visibility. Over 97% of the measurable parcels we shipped in fiscal 2010 were delivered in less than seven business days, averaging less than 3.7 business days from receipt by us or the USPS to delivery. Because we process both deliveries and returns within a single network, we are able to procure transportation capacity at a lower cost by purchasing from third-party transportation providers on a round-trip basis, which reduces the transportation costs they incur repositioning equipment for subsequent loads. As our parcel volumes increase and density in our SmartCenters and third-party carrier network increases, we believe we will be able to lower our transportation and processing cost per parcel and reduce parcel transit time.
Flexible and customizable parcel solutions. Our parcel solutions allow our customers to customize their parcel delivery and return processes to support their own unique supply chain, customer service, and marketing strategies. We handle a wide range of mail and parcel classifications and, unlike the major integrated express and parcel carriers, we allow our customers to combine both mail and parcels into one shipment for pickup by us or delivery to our SmartCenters. Our SmartCenters and technology platform are designed to be flexible, allowing customers to optimize their own internal fulfillment and outbound tendering procedures without having to conform to our system. Our proprietary technology platform allows our customers to customize parcel sorting and routing based on shipment, product, and consumer information.
61
Table of Contents
Index to Financial Statements
Scalable proprietary information technology platform. Our proprietary, web-based ILM technology platform provides parcel visibility, shipment level data transfer and reporting, and consumer interfacing tools. We have invested significant resources in developing our industry leading ILM suite of solutions and enterprise tools. Our proprietary technology platform is capable of handling a significant increase in the number of customers we serve and shipments we process with minimal additional capital investment. Our applications can be integrated into our customers’ order, warehouse, billing, consumer relationship, and financial management systems, enabling real-time data transfer and customized data reporting based on the customer’s own preferences. We expect to continue to develop and offer new solutions to improve the efficiencies and performance of our customers’ supply chains, lower their operating costs, and enhance the satisfaction of their consumers.
High level of customer service. We have built our business on the principle of superior customer service, which is critical to our success. Each parcel solutions customer is assigned a dedicated account manager who is responsible for customer service. We train and empower our account managers and customer service representatives to resolve customer concerns as quickly as possible. Account managers are also responsible for identifying opportunities for improvement in our customers’ parcel processes, and working with our sales, operations, and technology teams to design and implement enhancements to improve their performance. We operate a 24-hour customer call center where our team of customer service representatives are available via telephone, instant messaging, or e-mail to provide assistance regarding parcel tracking, handling instructions, shipment data transfer, or any other matter. We utilize a proactive customer service process to identify opportunities to do more for our customers and to increase customer retention.
Long-term relationships with our parcel solutions customers. Our parcel solutions customers include many leading U.S. direct-to-consumer retailers, consumer electronics manufacturers, and third-party logistics and fulfillment providers. We have established long-term relationships with many of our parcel solutions customers. Most of our parcel services contracts have initial terms of one to three years. We have experienced an 87.4% renewal rate of parcel solutions contracts expiring during the past three fiscal year period.
Non-asset based business model. Our non-asset based operating model enables us to scale our business up and down in response to changing business conditions. Furthermore, our operating model requires no investment in transportation equipment and minimal investment in facilities, which we believe enhances our returns on invested capital and assets. We obtain all of our network transportation capacity from third-party transportation providers and utilize the USPS for last-mile delivery and first-mile parcel pickup. All of our SmartCenter facilities are leased. Our net capital expenditures for fiscal 2008, 2009, and 2010, were $3.5 million, $2.9 million, and $2.2 million, respectively, which represented 2.7%, 1.7%, and 1.3% of our total revenue, respectively. We believe our non-asset based business model enhances our ability to grow our revenue with relatively minimal capital investment.
Experienced senior management and postal operations team. We have attracted a knowledgeable and talented senior management team with extensive industry experience and a complementary mix of operational and technical capabilities, sales and marketing experience, and financial management skills. Our management team is led by our Chief Executive Officer, William J. Razzouk. Mr. Razzouk has substantial industry experience and previously has held various management positions with FedEx, ultimately serving as the Executive Vice President, Worldwide Customer Operations. We also have a postal operations team with extensive operational management experience with the USPS.
62
Table of Contents
Index to Financial Statements
Our Strategy
Our objective is to strengthen our position as a leading provider of parcel transportation solutions and grow our parcel solutions and freight services businesses through the following strategies:
Expand our customer base. We intend to develop new long-term customer relationships by capitalizing on our leadership in parcel return solutions, our scalable technology, and our experience in the direct-to-consumer retail market. Historically, we have targeted high-volume, direct-to-consumer retailers that we believe value our solutions-based approach. Recently, we hired additional marketing and sales leadership and developed a targeted marketing strategy to expand our presence with middle market direct-to-consumer retailers. We also developed new technology solutions to facilitate the adoption of our solutions by these customers. We plan to continue to hire additional sales representatives, develop new technology solutions, and increase the use of demand-generation tools to identify and acquire new customers. We will continue to pursue high-volume, direct-to-consumer parcel customers as a significant component of our growth strategy.
Further penetrate our existing base of rapidly growing customers. We believe our existing customer base presents a significant opportunity for future growth. According to the U.S. Census Bureau, the electronic shopping and mail-order retail industry, the industry in which many of our parcel solutions customers participate, grew over three times faster than the overall retail industry from 2000 to 2010. We initiated our parcel return services in 2002 and established significant scale in return volumes before adding our delivery service offering in 2008. Many of our existing parcel returns customers would benefit from the operating efficiency and cost reduction we believe is achievable by also purchasing their parcel delivery solutions from us. In addition, we intend to expand our service offerings with our existing customers through the continued enhancement of our technology and processing capabilities.
Increase volumes to leverage existing parcel solutions infrastructure. In order to achieve our service delivery time commitments, we operate a scheduled transportation network that requires our transportation providers to depart our SmartCenters at a designated time regardless of shipment volumes. Although we do not own or lease transportation assets, our scheduled network design results in inherent operating leverage in our business model. As parcel volumes increase and excess purchased transportation capacity is absorbed, we achieve higher levels of capacity utilization resulting in a decrease in our transportation and processing cost per parcel. Our SmartCenter network and technology platform are capable of handling large increases in parcel volume with minimal additional capital investment or corresponding increases in operating costs. For example, the number of parcels shipped through our network increased from 26.8 million in fiscal 2008 to 41.3 million in fiscal 2010, or 54.1%, while our parcel solutions segment operating expenses increased from $18.9 million to $21.8 million, or 15.3%, during the same period.
Selectively pursue strategic acquisitions. We intend to actively pursue acquisitions of non-asset or asset-light logistics providers that complement our existing services and capabilities, diversify and further penetrate our customer base, and accelerate our earnings growth.
Our History
We were incorporated in 1999 and have grown to become a leading provider of parcel return management solutions to the e-commerce retail industry. Between 1999 and 2002, we focused on building our core technology infrastructure. In 2002, we launched a dedicated distribution network utilizing our Newgistics SmartLabel technology to process consumer parcel returns and provide return parcel tracking visibility. In 2004, we collaborated with the USPS to introduce PRS, a program that permits approved providers to retrieve returned parcels from designated Post Office locations or from designated USPS locations.
63
Table of Contents
Index to Financial Statements
During 2007, we acquired two businesses, enabling us to offer more comprehensive and cost-effective parcel and freight transportation solutions. In March 2007, we acquired Newgistics Freight Services, Inc., or NFS, formerly known as Logistics Management, Inc., a provider of transportation management solutions, including carrier and routing management, management information tools, freight bill administration, and consolidated freight payment services. The acquisition of NFS enabled us to leverage NFS’s aggregate purchasing power capability to achieve better rates for our purchased transportation and establish a national platform to grow our logistics services portfolio through both organic and strategic initiatives. In 2010, NFS serviced more than 1,600 small to medium-sized shippers that benefitted from our contractual freight rates with quality national and regional LTL and truckload carriers. In December 2010, we changed the name of NFS to Newgistics Freight Services, Inc.
In December 2007, we acquired Cornerstone Shipping Solutions, Inc., or Cornerstone, a provider of parcel delivery and consolidation solutions that leveraged the USPS network to provide competitive pricing and service. The acquisition of Cornerstone enabled us to supplement our parcel return solutions with parcel delivery solutions, allowing us to offer a highly customized forward and reverse parcel transportation offering in a single integrated network. In January 2009, we merged Cornerstone into Newgistics, Inc.
Our Service Solutions
We offer a broad range of solutions and services through two principal operating segments: parcel solutions and freight services.
Parcel Solutions
In our parcel solutions business, we manage and arrange the delivery of parcels from e-commerce, catalogue, and televised home shopping retailers primarily to consumers’ homes and, in the case of merchandise returns, from consumers back to retailers. Our customer base includes many of the leading online, catalogue, and other direct-to-consumer retailers, consumer electronics manufacturers, and 3PL and fulfillment providers in the United States. Our parcel transportation network leverages the frequency and comprehensive residential coverage of the USPS’ last-mile delivery and first-mile pickup network offering consumers a convenient return and delivery service that is price competitive with comparable services of the major integrated parcel carriers. We process and transport parcels that meet the weight and dimension requirements of the USPS, or parcels that weigh up to 70 pounds and have a maximum combined length and girth of 130 inches. Throughout the transportation process, we provide our customers with continuous access to a secure, web-based portal with analytical capabilities that include end-to-end parcel tracking and parcel characteristics. We shipped approximately 41.3 million parcels and 11.5 million parcels in fiscal 2010 and the first fiscal quarter of 2011, respectively.
Parcel Return Service
Our Intelligent Returns Management, or IRM, solution is designed to simplify the parcel return process for consumers in order to improve the consumer’s purchasing experience, increase consumer loyalty, and generate repeat purchases. We believe that a more convenient return process also reduces “trunk time,” or the amount of time merchandise is held by consumers before being returned. By reducing trunk time, the risk of the returned item becoming obsolete is reduced and the likelihood of a substitute purchase is increased. Using our solutions to process returns and interface with consumers allows our customers to reduce parcel return-related call center activity, reduce associated freight costs, and improve inventory management.
Our technology platform is integrated with most of our return customers’ distribution systems, enabling them to print our pre-paid, pre-addressed Newgistics SmartLabel at the time the order is fulfilled and include it in the parcel with the merchandise shipped to the consumer. To initiate the return process, the consumer either retrieves the Newgistics SmartLabel from the originally delivered parcel or goes online to our customer’s website to print or request a Newgistics SmartLabel. The consumer then attaches the Newgistics SmartLabel to
64
Table of Contents
Index to Financial Statements
the returning parcel and tenders it to the USPS. The return parcels can be picked up from the consumer’s home or be dropped off at any one of approximately 175,000 USPS collection boxes or any Post Office or other USPS location. Alternatively, consumers may go online to arrange for a scheduled pickup by the USPS at their residence. Return parcels are scanned by USPS personnel upon receipt, and relevant shipment data is electronically transferred from barcodes embedded in our Newgistics SmartLabel through our technology platform to our customer’s enterprise systems. This shipment data includes parcel characteristics, order number, and the consumer identity, or other data fields incorporated into the label based on our customer’s label specifications. Using this data, our customers can track return parcels, transmit electronic receipt confirmation to consumers and customer service representatives, and can more quickly provide return sales credit to the consumer.
Based on information contained in the Newgistics SmartLabel, the USPS stages a return parcel at a designated USPS facility where the parcels are consolidated for pickup by one of our third-party transportation providers and transported to one of our SmartCenters. Once a parcel is in our SmartCenter network, we scan and sort for destination according to customer-established rules. We consolidate return parcels into a single shipment or load for delivery to a customer designated facility, minimizing handling by our customers and reducing their transportation costs. We also offer our customers the ability to customize delivery times based on their preferences. Throughout the return process, we provide our customers with continuous access to a secure, web-based portal with analytical capabilities that include end-to-end parcel tracking and parcel characteristics. The following illustration demonstrates our end-to-end parcel return process:
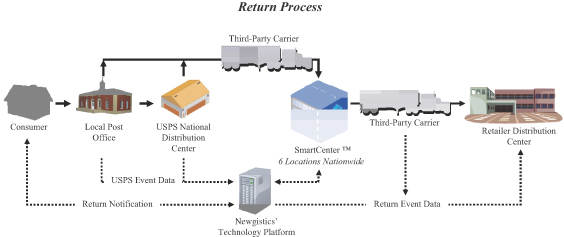
Parcel Delivery Service
We added our parcel delivery offering in December 2007, which has enabled us to offer a national integrated return and delivery solution. We process a wide range of mail and parcel classifications and, unlike the major integrated express and parcel carriers, allow our customers to combine both mail and parcels into one shipment for pickup or delivery to our SmartCenters. We manifest and sort our customers’ parcels into proper USPS shipment classifications based on weight and dimension after they have entered our network, removing this complex and cumbersome process from our customers’ fulfillment and distribution centers and ensuring each parcel is shipped using the lowest cost classification.
Consumer orders placed with direct-to-consumer retailers are fulfilled by our customers or their third-party fulfillment vendors. Our customers consolidate parcels of various sizes and weights and either deliver them to one of our six SmartCenter facilities, or we arrange for pickup by one of our third-party transportation providers. Upon arrival at a SmartCenter, parcels are scanned to verify receipt and transfer shipment manifest data to our customers, which enable them to begin both the revenue recognition process and the accurate allocation of costs earlier in the shipping cycle. Delivery parcels are then sorted into proper USPS mail and
65
Table of Contents
Index to Financial Statements
shipment classifications and properly labeled for accurate delivery through the USPS local delivery network. Parcels are consolidated by destination region and transported by one of our third-party transportation providers for tendering to the USPS at a facility closer to their final destination, thereby bypassing several postal distribution centers along the way. By delivering parcels to a USPS facility close to the consumer’s home, we are able to reduce transit time, minimize handling, and provide discounted prices to our customers.
The following illustration demonstrates our end-to-end parcel delivery process:
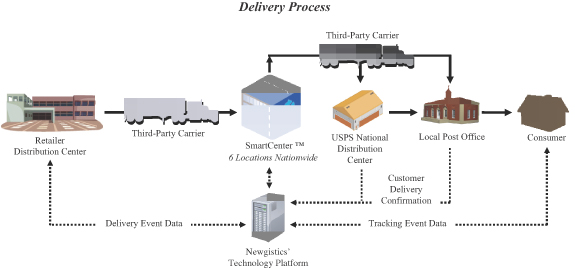
Freight Services
Our freight services segment offers a full-range of non-asset based LTL, truckload, and expedited transportation management services in all 50 states by utilizing an extensive network of asset-based carriers. In fiscal 2010, we utilized 18 asset-based LTL carriers. We have longstanding contractual relationships with the asset-based LTL carriers with which we conduct a majority of our LTL transportation management services. Our freight services are not dependent on any particular carrier and carrier turnover is not significant to our operations. We provide the necessary operational expertise, information technology capabilities, and relationships with asset-based transportation providers to meet the unique needs of our freight services customers.
LTL Services
As part of our LTL services, we negotiate transportation rates with carriers on behalf of our customers, providing our customers with committed capacity, responsive service, and rate transparency. We are able to provide competitive rates to our customers by negotiating favorable rates with our carriers, including capped fuel surcharges that are fixed for one year, allowing our customers to budget their annual transportation costs with little risk of significant price fluctuations. Our customers benefit from our aggregate transportation capacity buying power, and as a result, we believe we are able to reduce our customers’ total annual transportation and logistics costs by approximately 10% to 20%, while providing high quality service. We have established long-term relationships with many of our customers, and provide our asset-based carriers with committed routings, revenue, and customer longevity. In connection with LTL shipments booked by us on behalf of our customers, carriers pay us a commission. The primary components of our freight services capability include the following:
| • | Transportation Network Assessment and Carrier Contracting. We conduct a comprehensive base-line study of each of our customer’s transportation networks by analyzing their current LTL rates and freight patterns |
66
Table of Contents
Index to Financial Statements
| in order to identify cost savings opportunities. Based on our assessment, we recommend a carrier for each lane determined by a combination of service and price. We provide our customers with a summary of projected savings and manage the contract negotiation and execution process with each of the designated carriers. |
| • | Shipment Planning. We analyze freight patterns and consolidation opportunities to maximize cost savings. We also provide rating and routing services to ensure least-cost carrier selection. |
| • | Shipment Management. We provide our customers with real-time rate quotes and shipment tracking via web services, allowing them to provide up to date shipment costs and status to their consumers. |
| • | Freight Bill Administration and Audit Services. We collect electronic freight invoices from third-party carriers and provide payment processing services for our customers. As part of this service, we provide freight bill audit services to ensure that our customers’ invoices conform to contract terms and specific customer pricing arrangements. We also mediate carrier billing disputes on behalf of our customers. |
| • | Management Information Tools. Using our web-based software applications, our customers are able to track individual shipments, access freight rate calculators and rating engines, manage invoice imaging and storage, transfer shipment-level data to their financial management systems, and create customized dashboards and reports detailing carrier activity on an enterprise-wide basis. We identify ongoing savings opportunities for our customers by analyzing all of their transportation purchases and benchmarking these opportunities with our freight services contractual rates. We are then able to quantify cost savings through increased routing compliance with our network of carriers. We select carriers based upon a combination of service and price. |
Truckload Brokerage Services
For our truckload brokerage services, we provide full-service management of every transaction, including rate quoting, load tendering, shipment tracking, delivery confirmation, and invoice payment. We arrange the pickup and delivery of truckload freight using third-party carriers.
Our Proprietary Technology Platform
Through a combination of software licensing and development, we have architected a proprietary technology platform from which our parcel solutions services and applications are derived. The core of our proprietary technology platform is our Intelligent Logistics Management suite, or ILM, which is an enterprise-level platform that is integrated with customer applications, carriers, service providers, and the USPS to provide end-to-end solutions. The platform is deployed on a scalable, reliable, and proven multi-tenant architecture and allows our clients to integrate at the level they desire, whether that is via web service application program interfaces or linking to complete web applications. The platform leverages technology from third-party technology providers, such as Microsoft Corporation, Oracle Corporation, and Informatica Corporation. In addition, our technology has been integrated into leading e-commerce technology platforms, such as Kewill, Inc., Manhattan Associates, Inc., and RedPrairie Corporation.
Our ILM suite of information technology solutions can be integrated into our customers’ information management systems, allowing us to offer solutions tailored to our customers’ specific sales, marketing, and customer service strategies. Using our ILM suite, customers can manage communication with their consumers by utilizing customer-branded websites, manage parcel flow and handling instructions based on parcel contents or brand, and automate the returns authorization and timing of consumer sales credit based on pre-established client-specific business rules. Our ILM suite incorporates the following key features:
| • | real-time order-to-delivery parcel shipment tracking via a flexible integration framework that supports standards based interchange (i.e., XML or EDI) or custom data exchange; |
| • | in-transit parcel status and electronic subscription based delivery notification to consumer and customer service representatives; |
67
Table of Contents
Index to Financial Statements
| • | customer-branded websites for online tracking by a reference meaningful to consumers; |
| • | extensive, secure and customized data reporting to improve efficiency of handling processes and pre-sort accuracy; |
| • | merchant-configurable business rules to tailor services based on consumer type, product category, or brand identity; and |
| • | electronic return authorization based on product-specific criteria. |
As part of our proprietary ILM platform, we have invested significant resources to develop a suite of solutions and enterprise tools that we believe our customers can leverage to gain efficiency in and improve the performance of their supply chain, lower their operating costs, and enhance consumer satisfaction. The key elements of our ILM suite of solutions include the following:
Intelligent Returns Management, or IRM, is a patented enterprise-level solution that provides shippers with control of the returns process by managing both the parcel and the information flow from the point-of-order, or shipment, to the final product destination. We believe the data captured by our IRM solution during the return process improves our customers’ visibility into their reverse supply chain.
Newgistics SmartLabel is a pre-paid, pre-addressed label that can be generated at the point-of-sale, or shipment, after the sale by a customer service representative, or printed by a consumer returning merchandise. Our Newgistics SmartLabel is typically included in the delivery package. The Newgistics SmartLabel features intelligent barcodes that are scanned to provide information, such as product serial numbers, order numbers, return merchandise authorization numbers, the reason for the return, as well as detail about the consumer returning the merchandise. The ILM suite supports the production of labels via the web and can be emailed or printed as a postcard and mailed to consumers.
OneShip is our proprietary, distributed warehouse control system utilized in our SmartCenter facilities. OneShip is a flexible, business rules driven system that allows for automation of workflow and processes for a variety of different warehouse configurations. It is a single system that supports initial scan, sortation, containerization, and manifesting of both return and delivery parcels. Using OneShip, we are able to efficiently manage multiple USPS mail classifications and parcel shipping products at each SmartCenter. This allows our customers to combine mail and parcels into one convenient load for pickup, eliminating costly and labor intensive pre-sorting activities.
Shipment Manager is a web-based portal that is used to access our logistics applications for managing the parcel return and delivery life cycle. This system includes applications for label creation, tracking, returns merchandise authorization, notifications, parcel pickup, advanced exchange, business intelligence, and other management tools. Customers can pick and choose the set of applications by user role and customize the data, content, workflow, and look and feel of each application.
Flexship is a label creation and data collection software program that supports all of our parcel solutions and allows our small and midsized customers to manage their shipments by importing and exporting order data for label creation and exporting label data to their systems.
Our information technology infrastructure provides a high level of security for our proprietary software and systems. The storage mechanism for our systems and database is designed to ensure that power and hardware failures do not result in the loss of critical data. Data is protected from unauthorized access through a combination of security measures, including firewalls, encryption, antivirus software, anti-spy software, passwords, and physical security, with access limited to authorized information technology personnel. In addition to our security infrastructure, our system is backed up daily to prevent the loss of our data due to catastrophic failures and natural disasters.
68
Table of Contents
Index to Financial Statements
In fiscal 2008, 2009, and 2010 and the first fiscal quarter of 2011, we incurred approximately $1.7 million, $2.2 million, $2.2 million, and $0.3 million respectively, related to research and development to further improve our technologies.
Our Strategic Relationship with the USPS
Our non-exclusive relationship with the USPS is an integral part of our operations and is critical to our success. We use the USPS for the last-mile delivery to and the first-mile pickup from consumers for virtually all of our parcel volume.
Since the early 1990’s, the USPS has been offering discounted prices to medium and large shippers and parcel consolidators for delivering parcels into the postal network closer to the final destination. Parcels are sorted, consolidated, and shipped to USPS facilities or local Post Offices for final delivery to consumer residences. The closer a parcel is delivered to the final destination, the higher the USPS discount received, resulting in lower postage costs. Parcels delivered to the Post Office closest to the consumer’s residence incur the lowest postage. When a shipper tenders a parcel for delivery to an end consumer, the USPS requires the parcel to be sorted to either a three digit or five digit zip code, as well as rated based on weight, delivery distance, and the entry facility type. As a result, many shippers prefer to use a third-party consolidator, such as ourselves, to perform this service. This service encompasses multiple USPS mail classifications, including Parcel Select. Parcel Select is a unique service offering that requires carriers to capture certain key attributes that determine USPS pricing and requires volume minimums to qualify for discounted pricing. During the 12-month period ended September 30, 2010, over 268 million parcels were shipped in the United States under the USPS Parcel Select offering, representing a 20% increase over 2009.
In 2004, we collaborated with the USPS to introduce PRS, a program that permits approved providers to retrieve returned parcels from designated Post Offices or from other designated USPS locations. PRS was initially developed as an experimental rate service provided by the USPS only through us and utilized the same concepts as were offered in Parcel Select only in reverse. These concepts involve picking up parcels at postal facilities closer to the consumer’s residence, shipping through a private network of carriers, and consolidating at SmartCenters for bulk shipment back to our customer.
Initially, we provided parcel pickup services at national distribution centers for consolidation and shipment back to our customers. By 2005, we had transitioned to providing parcel pickup services at local Post Offices, as the customer acceptance of this offering made it economical to do so. In 2006, the USPS granted permanent rate status to PRS, signaling its value to shippers and consumers. In 2009, UPS and FedEx joined the PRS program, further validating the capabilities of this service. During the twelve-month period ended September 30, 2010, we shipped approximately 22.9 million parcel returns, representing approximately 80.4% of the returns shipped through the PRS program during that period.
Since the inception of the PRS program, we have worked with the USPS to enhance and improve the program in order to meet or exceed customer expectations. For example, since 2007, our average time from initial pickup to final delivery has improved by over 50%. Working with the USPS, we are scanning parcels multiple times in the return process to provide comprehensive and real-time parcel tracking. The USPS has added scheduled pickup from the home, at no additional charge, allowing consumers to go online and schedule a parcel pickup from their front door. In 2009, the USPS added electronic manifesting to improve processing time and reduce their manual audit efforts, and we were the first program participant to implement this service. We expect to continue to work with the USPS to adopt practices that will improve the efficiency and effectiveness of our offerings.
Our Customers
We provide parcel and freight transportation solutions to customers across a wide range of industries. In fiscal 2010, we provided solutions to over 180 and 1,600 customers in our parcel solutions and freight services
69
Table of Contents
Index to Financial Statements
segments, respectively. In the first fiscal quarter of 2011, we provided solutions to over 130 and 1,100 customers in our parcel solutions and freight services segments, respectively. In fiscal 2010, QVC and GENCO ATC each accounted for more than 10% of our revenue. The loss of either of these customers would have a material adverse effect on our business.
We provide parcel solutions primarily to direct-to-consumer retailers, manufacturers, distributors, and third-party logistics and fulfillment providers. We enter into written contracts with our parcel solutions customers. Although we do not generally require volume commitments or exclusivity with our parcel solutions customers, many of our parcel solutions customers utilize our solutions for all, or a substantial portion, of their parcel return transportation requirements to streamline their transportation and inventory processes in a cost-effective manner. Most of our parcel services contracts have initial terms of one to three years. Our parcel solutions customers pay us per parcel according to contracted pricing. Our customer contracts generally provide us with flexibility to increase prices in the event of price increases by the USPS, although many of our customer contracts have limits on the size of any USPS price increase that can be passed on to the customer. We have experienced an 87.4% renewal rate of parcel solutions contracts expiring during the past three year period.
We provide freight transportation solutions primarily to small and medium-sized businesses across a wide range of industries. We provide our freight services customer base with the benefit of our aggregate buying power of more than 1,600 customers, which we believe results, on average, in 10% to 20% in transportation cost savings to our customers. Our freight services customers authorize us to negotiate rates on their behalf with third-party transportation carriers. Our top ten freight services customers in fiscal 2010 have been customers for an average of approximately 11 years. Our customers are protected from unforeseen rate increases or pricing changes due to our annual pricing agreements with our carriers. Our carriers include reputable national and regional truckload, LTL, and expedited transportation providers.
Our Third-Party Transportation Network
We utilize the USPS and a network of third-party transportation providers to perform our parcel solutions and freight services. Our non-asset based operating model allows us to focus on providing our customers with competitive rates and service, without the concern of asset utilization that is more commonly associated with asset-based transportation providers. We focus on building and enhancing our relationships with reliable transportation providers to ensure that we not only secure competitive rates, but also gain access to consistent capacity, especially during peak shipping seasons. Because we do not own any transportation equipment, our third-party carrier relationships are critical to our success.
We primarily utilize the USPS and other third-party LTL and truckload service providers for our parcel solutions and freight services. Through our relationship with the USPS, we utilize the USPS’ network for first-mile pickup and last-mile delivery services for our parcel solutions. The fees we pay to the USPS are based on weight, dimension, delivery distance, and the entry facility type. We also use courier service providers in our parcel solutions segment to handle the sorting, pickup, and delivery of parcels at USPS facilities. We generally arrange for the transportation of shipments with a select number of qualified carriers in order to leverage our aggregate buying power, effectively manage our service levels, and maintain visibility throughout the shipment cycle.
We typically pay our truckload third-party carriers a contracted rate per mile and a mileage fuel rate. Our LTL carriers are paid based on a rate per pound or a rate per pallet and certain accessorial charges related to the loading and unloading of parcels. We pay couriers a minimum pickup fee or a contracted rate per parcel for either the delivery or pickup of parcels at USPS facilities.
Seasonality
The results of operations of our parcel solutions segment generally reflect a seasonal pattern. As our customers increase sales during the holiday season at year-end, the fourth quarter historically has been our
70
Table of Contents
Index to Financial Statements
strongest quarter for delivery volumes. Return volumes are typically strongest in the first and fourth quarters, as consumers return items purchased during the holiday season. Parcel yield is typically strongest in the first and fourth quarters as parcels tend to be heavier during those quarters.
Marketing and Sales
We market and sell our parcel solutions services through a team of sales professionals located throughout the United States. As of April 2, 2011, we employed 19 sales professionals in our parcel solutions segment. Our parcel solutions sales professionals generally have significant sales experience and are focused on building relationships with current and future customers’ senior management teams. Our senior management team is also significantly involved in marketing our services and many of our parcel solutions contracts were secured through relationships developed between our senior management team and our customers’ senior management.
In our parcel solutions business, we use a collaborative, value-driven sales process that enables us to identify customer-specific operational cost savings and revenue enhancement opportunities available through our solutions. We become aware of sales opportunities through direct efforts of our sales team, referrals from existing customers, requests for proposal, relationships between our senior management and prospective customers, or other means. Customers are secured through a multi-stage sales process that starts with an analysis of the customer’s historic parcel transportation practices and related expenditures to quantify the value potential of our services. Through interaction with the customer’s senior management, we gain a thorough knowledge of the customer’s business processes, which knowledge we incorporate into our solutions. Together with the customer, we co-develop a customized parcel solution supported by our proprietary technology platform and integrated with the customer’s enterprise systems. Each solution is designed to increase the overall efficiency of our customer’s delivery and return practices while increasing consumer satisfaction and revenue potential.
Our parcel solutions sales professionals are supported by a team of account managers. Each parcel solutions customer is assigned a dedicated account manager. Account management personnel are responsible for ensuring customer service, developing relationships with customer personnel, and responding to customer inquiries. Account managers are also responsible for identifying deficiencies or opportunities for improvement in our customers’ delivery and return processes and collaborating with our sales, operations, and information technology teams to design and implement enhancements to our solutions. We believe a proactive approach to customer service can regularly lead to new business opportunities with our customers and increases customer loyalty.
In January 2011, our Vice President of Marketing and Field Sales joined us primarily to drive our sales initiatives with middle market, direct-to-consumer retailers. We intend to expand our sales force and develop targeted marketing strategies to increase our presence with middle market, direct-to-consumer retailers. To support these sales efforts we have developed new technology solutions for customers with lower shipment volumes, as these customers typically have fewer resources than our current customers to fully implement our solutions. In our parcel solutions business, we generally hire experienced sales professionals that can begin marketing our services after limited training on our network and solutions.
In addition to expanding our sales force, we intend to capitalize on cross-selling opportunities with existing customers. In December 2007, we added parcel delivery capabilities, thus enabling us to offer our customers a fully integrated parcel delivery and return solution. Many of our customers currently use either our parcel delivery or return solution, but not both. We believe that our customers would benefit from the operating efficiency and cost reductions possible from purchasing both return and delivery transportation solutions from us.
We market and sell our freight services through a dedicated team of sales professionals located throughout the United States. As of April 2, 2011, we employed 16 sales professionals in our freight services operating segment. We sell our freight service solutions primarily to small and medium-sized businesses that generally
71
Table of Contents
Index to Financial Statements
benefit from our aggregate buying power and our comprehensive order-to-delivery management tools. We also market our services to larger customers, including existing customers of our parcel solutions segment. As part of the sales process, our freight services professionals provide prospective customers with a lane-by-lane analysis, comparing costs on all shipments, along with recommending qualified regional and long haul carriers that meet or exceed the service levels from current service providers.
Intellectual Property
We rely on a combination of patent, copyright, trademark, and trade secret laws, as well as confidentiality procedures, third-party non-disclosure agreements, and contractual restrictions, to establish and protect our proprietary rights.
We have two issued patents, one patent pending re-issue with the United States Patent and Trademark Office, or USPTO, one pending patent application, which the USPTO has allowed, and five other patent applications pending with the USPTO. Our patent and patent applications address areas of the parcel returns process including returns initiation, transportation, processing, and data communication. We also own trademarks and service marks identifying features of our solutions. Protecting our rights to our intellectual property is important, as many of our services and features are based on our proprietary software.
We typically establish agreements with our employees and contractors, and with parties with which we do business in order to limit access to and disclosure of our proprietary information. We cannot be certain the steps we have taken will prevent unauthorized use or reverse engineering of our technology. Moreover, others may independently develop technologies that are competitive with ours or that infringe on our intellectual property. The enforcement of our intellectual property rights also depends on the success of any legal actions against these infringers, but these actions may not be successful, even when our rights have been infringed.
We believe the frequency of assertions of patent infringement is increasing as patent holders, including entities that are not in our industry and who purchase patents as an investment or to monetize such rights by obtaining royalties, use such actions as a competitive tactic as well as a source of additional revenue. Any claim of infringement from a third party, even those without merit, could cause us to incur substantial costs defending against such claims. Furthermore, a party making such a claim, if successful, could secure a judgment that requires us to pay damages. A judgment could also include an injunction or other court order that could prevent us from providing our service. In addition, we might be required to seek a license for the use of such intellectual property, which may not be available on commercially reasonable terms or at all.
Our Competition
The direct-to-consumer parcel services and 3PL markets in which we operate are highly competitive. The direct-to-consumer parcel market is characterized by a few large players that offer a broad range of services based on delivery times and price. The 3PL market is highly fragmented with the largest participant controlling less than 10% of the total market and is characterized by competition based on price and service.
Active participants in our markets include:
| • | global asset-based integrated parcel carriers such as FedEx and UPS, against whom we compete in our parcel solutions segment; |
| • | parcel carriers that utilize the first-mile and last-mile delivery capabilities of the USPS, against whom we compete in our parcel solutions segment; |
| • | regional parcel service providers that offer services in a specific industry segment or service area, against whom we compete in our parcel solutions segment; |
| • | 3PL providers that offer comprehensive transportation management solutions, against whom we compete in our freight services segment; |
72
Table of Contents
Index to Financial Statements
| • | LTL and truckload carriers, against whom we compete in our freight services segment; and |
| • | internal shipping departments at companies that have substantial transportation requirements, many of which would otherwise represent potential sales opportunities for our freight services segment. |
We believe that our ability to provide a broad range of value-based shipping solutions coupled with what we believe to be superior customer service differentiates us from other service providers. To that end, we believe our most significant competitive advantages include:
| • | our comprehensive national parcel solutions offering that is competitively priced in comparison to UPS and FedEx ground residential services; |
| • | our ability to provide flexible and customized parcel transportation solutions that can be integrated into our customers’ information technology applications; |
| • | our customizable suite of enterprise tools that provide end-to-end visibility and in-transit parcel status and delivery event notification, resulting in a more efficient supply chain and an enhanced consumer experience; |
| • | our integrated return and delivery network that enables us to optimize our network and lower our transportation costs per shipment as we increase our parcel volumes; |
| • | our demonstrated track record of providing direct-to-consumer parcel solutions to leading retailers; |
| • | our strategic relationship with the USPS; |
| • | our comprehensive set of freight services that enable us to provide value with cost saving alternatives, real-time, web-based price quotes, and freight bill payment, administration, and auditing; and |
| • | our strategic alliances with leading LTL carriers, providing our freight services customers with guaranteed capacity at favorable rates on fixed shipping rate schedules. |
Our primary parcel solutions competitors have significantly greater financial, technical, marketing, service, and other resources than we have. In addition, these competitors have longer operating histories and greater brand recognition than we have. These competitors may be able to offer lower prices, additional products or services, or other incentives that we cannot match or offer, and may be in a stronger position to respond more quickly to new technologies.
Some of our freight services competitors have significantly greater financial, marketing, service, and other resources than we have. In addition, these competitors have greater brand recognition than we have. Our freight services competitors may offer lower prices or other incentives that we cannot match or offer.
Government Regulation
The Postal Reorganization Act of 1970 created the USPS as an independent establishment of the executive branch of the federal government, and created the Postal Rate Commission, an independent agency, to recommend postal rates. The Postal Accountability and Enhancement Act of 2006 amended the 1970 Act to give the re-named Postal Regulatory Commission revised oversight authority over many aspects of the Postal Service, including postal rates, product offerings, and service standards. In our parcel solutions segment, we contract with the USPS for discounted postage rates, which contracts and rates are subject to approval by the Postal Regulatory Commission.
In our freight services segment, we arrange for the transportation of freight that belongs to other parties and utilize third-party transportation carriers to provide capacity. As a result, we are subject to regulation by the Federal Motor Carrier Safety Administration, or the FMCSA, which is an agency of the U.S. Department of Transportation. The FMCSA has broad regulatory powers in areas such as safety and insurance that relate to interstate broker operations. The freight services industry is also subject to possible regulatory and legislative
73
Table of Contents
Index to Financial Statements
changes, such as the possibility of more stringent safety or security regulations or limits on vehicle weight and size, that could adversely affect the industry by requiring changes in operating practices, increasing the cost of providing transportation services.
Risk Management and Insurance
We require all truckload carriers with whom we work in both segments of our business to carry at least $1.0 million in auto and general liability insurance and $100,000 in cargo insurance. We maintain a contingency cargo insurance policy which may only be used in the event that the carrier’s coverage is not sufficient to handle the size of the claim. For LTL carriers, we require at least $20 per pound in cargo insurance. We do not maintain an insurance policy to handle claims with respect to damaged shipments handled by a LTL carrier. With respect to our courier providers, we require coverage of at least $100 per parcel in cases where they sort and ship our parcels at the piece level. When couriers handle bags that contain multiple parcels, we require coverage of $100 per bag. Generally, a bag contains an average of six to seven parcels. For couriers, we require at least $1.0 million in general liability insurance. We also take steps to ensure that the coverage we provide to our customers for damaged shipments is substantially similar to the coverage that our carriers provide to us.
In our parcel solutions and freight services businesses (other than for LTL shipments), we maintain insurance coverage through a third party to protect against claims for accidents or damaged shipments. If a shipment is damaged during the transportation process, our customer files a claim for the damaged shipment with us, and we bear the risk of recovering the claim amount from the carrier. If we are unable to recover all or any portion of the claim amount from our carrier, we may bear the financial loss. We attempt to mitigate this risk by using our quality program to select carriers with adequate insurance, quality control procedures, and safety ratings. For LTL shipments, if a shipment is damaged during the transportation process, we will assist our customer with filing a claim for the damaged shipment with the LTL carrier.
We maintain insurance for vehicle liability, general liability, errors and omissions, employee benefits liability, and cargo damage claims. Our insurance policies also cover other standard industry risks related to workers’ compensation and other property and casualty risks. Coverage for bodily injury and property damage, including but not limited to products, operations, premises liability, and auto liability, consists of $5.0 million per occurrence or $6.0 million in the aggregate, without a deductible. Under our workers’ compensation policy, we maintain coverage consistent with statutory limits and also have employers’ liability insurance with $5.0 million aggregate coverage and no deductible. Under our cargo policy, we maintain protection at our SmartCenters as well as in-transit coverage, consisting of $1.6 million and $1.2 million per conveyance for parcels containing electronic devices and all other general consumer products, respectively, with deductibles ranging from $10,000 to $50,000 per conveyance. We believe our insurance coverage is comparable in terms and amount of coverage to other companies in our industry.
We establish reserves for anticipated losses and expenses in excess of amounts covered by our carrier and third-party insurance related to vehicle liability, cargo, workers’ compensation, and property damage claims, and we will establish reserves in the future as appropriate. Our reserves are periodically evaluated and adjusted to reflect our experience.
We extend credit to most of our customers as part of our business model. These customers are subject to an approval process prior to any extension of credit. Our finance department reviews each credit request and considers, among other things, payment history, current billing status, recommendations by various rating agencies and capitalization. We believe this review and approval process helps mitigate the risk of customer defaults and related bad debt expense.
Facilities
Our corporate headquarters is located in Austin, Texas, where we lease 18,963 square feet of office space. The primary functions performed at our corporate headquarters are accounting and finance, field operations,
74
Table of Contents
Index to Financial Statements
sales and marketing, and information technology design, integration, and support. We also lease SmartCenter parcel processing and distribution facilities for our parcel solutions segment in Atlanta, Georgia; Fishers, Indiana; Elizabeth, New Jersey; Sparks, Nevada; Mountville, Pennsylvania; and Coppell, Texas. Our freight services segment is based in Fall River, Massachusetts, where we lease an office. We also lease sales offices in Chester, New Jersey and Greenville, South Carolina. All of our assets are located in the United States.
Employees
As of April 2, 2011, we had a total of 224 employees. We consider our employee relations to be good.
Legal Proceedings
From time to time we become involved in litigation relating to claims arising from the ordinary course of our business. We believe that there are no claims or actions pending or threatened against us, the ultimate disposition of which would have a material adverse effect on our financial position or results of operations.
75
Table of Contents
Index to Financial Statements
Executive Officers and Directors
The following table sets forth information regarding our executive officers and directors.
| Name |
Age | Position | ||||
| William J. Razzouk |
63 | Chairman of the Board of Directors, President, and Chief Executive Officer | ||||
| Michael J. Twomey |
63 | Chief Financial Officer | ||||
| Todd A. Everett |
37 | Vice President of Operations | ||||
| Kenneth W. Johnson |
53 | Vice President of National Accounts | ||||
| Alva J. Phillips |
66 | Chief Technology Officer | ||||
| David T. Marinkovich |
45 | Vice President of Marketing and Field Sales | ||||
| Michael A. Desmarais |
44 | Vice President of Operations—Newgistics Freight Services | ||||
| Paul R. Forand |
53 | Vice President of Business Development—Newgistics Freight Services | ||||
| Kenneth P. DeAngelis |
58 | Director | ||||
| Philip S. Siegel |
46 | Director | ||||
| Laura B. Sachar |
49 | Director | ||||
| Stephen M. Mattessich |
56 | Director | ||||
William J. Razzouk has been with Newgistics and served as our President and Chief Executive Officer and as a director since March 2005. Mr. Razzouk has served as the Chairman of our board of directors since March 2011. Mr. Razzouk also serves on the Board of Directors of Waste Connections, Inc., a publicly traded integrated solid waste services company, and Re-Trans, Inc., a privately held transportation management company. Before joining Newgistics, Mr. Razzouk held a number of executive level positions. Mr. Razzouk served in various management capacities at Federal Express Corporation from 1983 to 1996, most recently as Executive Vice President, Worldwide Customer Operations. Between 1996 and joining Newgistics in March 2005, he served in a number of senior management positions, including as Managing Director of Paradigm Capital Partners, LLC, Chairman and Chief Executive Officer of PlanetRx.com, President, Chief Operating Officer, and Director of Storage USA, Inc., President of Advanta Interactive Services, and President and Chief Operating Officer of America Online. Mr. Razzouk holds a bachelor’s degree from the University of Georgia. As our President, Chief Executive Officer and Chairman of the Board, Mr. Razzouk brings direct and relevant information and experience regarding our day-to-day operations to our board discussions.
Michael J. Twomey has been with Newgistics serving as our Chief Financial Officer since February 2006. Prior to joining Newgistics, he served as Chief Financial Officer and then as Transition Executive at NetBotz, Inc., an IP-based security solutions company, from January 2004 to January 2006. Mr. Twomey served in a number of executive positions at IBM, including Vice President of Business Development and Channels for IBM’s Tivoli software business from January 2002 to December 2003, Chief Financial Officer and Vice President of Operations for IBM’s Tivoli software business from January 1999 to December 2001, Controller and Treasurer for IBM Credit Corporation from July 1997 to January 1999, and as Director of Operations and Chief Financial Officer for IBM Greater China from June 1995 to May 1997. Mr. Twomey holds a bachelor’s degree from Queens College, City University of New York.
Todd A. Everett has been with Newgistics since March 2005 serving as our Vice President of Operations since February 2010. He served as our Director of Operations from March 2005 to January 2010. Prior to joining Newgistics, he spent the previous nine years of his career with Intel Corporation where he had responsibility for the company’s outsourced transportation and logistics functions for North and South America. Mr. Everett serves on Iowa State University’s Executive Advisory Council for the Department of Supply Chain and Information Systems. He holds a bachelor’s degree from Iowa State University.
76
Table of Contents
Index to Financial Statements
Kenneth W. Johnson has been with Newgistics since December 2002 serving as our Vice President of Sales until December 2010, when his title was changed to Vice President of National Accounts. He has nearly 30 years of sales, marketing, and operational experience. Prior to joining Newgistics, Mr. Johnson worked for Affiliated Computer Services, where he served as the Senior Vice President, Business Development from February 2001 to May 2002 and Senior Vice President and General Manager from May 1997 to February 2001. Mr. Johnson held numerous sales and marketing positions with IBM from 1981 to 1996. Mr. Johnson holds a bachelor’s degree from Michigan State University.
Alva J. Phillips has been with Newgistics serving as our Chief Technology Officer since January 2004. Prior to joining Newgistics, he served in senior level technology positions with SASCO, Eckerd, Rite-Aid Corporation, Macy’s, and HP Enterprise Services, formerly known as Electronic Data Systems, and as Executive Vice President and Chief Information Officer of Blockbuster, Inc. from February 1995 to March 2001. Mr. Phillips holds a bachelor’s degree from Troy State University.
David T. Marinkovich joined Newgistics in January 2011 as our Vice President of Marketing and Field Sales. Mr. Marinkovich has 20 years of experience in logistics and supply chain technology. Prior to joining Newgistics, he held executive positions with companies including SmartMail, DHL Global Mail, where he served as Senior Vice President of Sales, Marketing and Customer Service from January 2000 through October 2007, Lighting Logistics, where he served as Executive Vice President of Sales and Marketing from October 2007 to January 2009, and most recently Tiger Logistics, where he served as Vice President of Business Development from January 2009 through December 2010. He holds a bachelor’s degree from Indiana State University.
Michael A. Desmarais has been with Newgistics serving as our Vice President of Operations—Newgistics Freight Services since March 2007. Prior to joining Newgistics, he held a variety of positions with NFS, most recently as Vice President of Operations from February 1997 through March 2007. Mr. Desmarais holds a bachelor’s degree from the University of Massachusetts—Dartmouth, as well as a master’s degree in business administration from the University of Rhode Island and a graduate certificate in Supply Chain Management from Northeastern University.
Paul R. Forand has been with Newgistics serving as our Vice President of Business Development—Newgistics Freight Services since March 2007. Prior to joining Newgistics, he held various positions for NFS, most recently as the Vice President of Business Development, a title he held from December 2000 through March 2007.
Kenneth P. DeAngelis has served as a director of Newgistics since July 2000. Mr. DeAngelis co-founded Austin Ventures and has been a general partner of Austin Ventures since 1981. He is a member of the board of directors and past chairman of the PBS affiliate, KLRU-TV, in Austin, Texas, a member of University of Texas at Austin’s Development Board, and a member and past chairman of the Advisory Council of the University of Texas McCombs School of Business. He also serves on the Board of Governors of Hyde Schools, headquartered in Bath, Maine, and as a director for several private companies. He holds a master’s degree in business administration from the Wharton School of the University of Pennsylvania and a bachelor’s degree from Harvard University. Mr. DeAngelis brings experience with both private and public companies to our board of directors. He possesses knowledge in building stockholder value, growing companies, navigating complex mergers and acquisitions and operating as a public company.
Philip S. Siegel founded Newgistics in 1999 and has served as a director since our inception. Mr. Siegel also served as our Chief Executive Officer from December 1999 to June 2000. Mr. Siegel has been a general partner with Austin Ventures since September 2007 and was previously a partner with Austin Ventures since July 2006. Mr. Siegel also served as a venture partner with various Austin Ventures entities since November 1999. Prior to such time, Mr. Siegel served as Vice President, Partner, and Director for the Boston Consulting Group. Mr. Siegel has founded several private companies and also serves on the board of directors of several private companies. He is currently a part-time professor in the Acton School of Management and served as an adjunct professor in the Entrepreneurship Department at the University of Texas Graduate School of Business from
77
Table of Contents
Index to Financial Statements
1999 until 2002. Mr. Siegel holds both a master’s degree in business administration and a bachelor’s degree from the University of Chicago. As a founder of Newgistics, Mr. Siegel is uniquely qualified to serve on our board of directors. In addition to his understanding of our business, his background in consulting, venture capital and private equity allows him to bring relevant experience to our board.
Laura B. Sachar has served as a director of Newgistics since September 2002. She co-founded StarVest Partners, a venture capital firm, and has been a managing member of StarVest Partners since 1999. Ms. Sachar has served and currently serves on the board of directors of several private companies. Prior to co-founding StarVest, Ms. Sachar was responsible for direct private equity investments at Gabelli Securities. Ms. Sachar has a bachelor’s degree from Barnard College, Columbia University, and a master’s degree in business administration from the Columbia University Graduate School of Business. Ms. Sachar’s experience in the venture capital and private equity realm has provided her with knowledge in building stockholder value, which she brings to our board of directors.
Stephen M. Mattessich joined as an independent director of Newgistics in April 2011. He currently serves as the Chief Financial Officer and Treasurer of Rock-It Cargo, USA LLC, which he joined in April 2011. From February 2000 to December 2002. Mr. Mattessich served as the Global Controller of BAX Global, Inc., an international freight forwarding and logistics company. In December 2002, he was promoted to Chief Financial Officer and Executive Vice President, a position he held until February 2006, when BAX Global was acquired by DB Schenker, Inc. Following the acquisition, Mr. Mattessich served as the Chief Financial Officer and Executive Vice President of DB Schenker’s Region Americas operations (including the U.S., Canada, Mexico, and Latin America), where he served until October 2010. Previously, he held various leadership positions in the freight forwarding industry, including Chief Financial Officer of the Air Tiger Group and Chief Accounting Officer of Fritz Companies, Inc. Additionally, he has served as a director on several private company boards. Mr. Mattessich holds a bachelor’s degree from Georgetown University. Mr. Mattessich’s leadership experience in the freight forwarding industry and qualification as an audit committee financial expert qualifies him to serve on our board of directors. His experience includes management of company growth (including through an initial public offering), implementation of diverse strategic plans, and negotiation and management of multiple mergers and acquisitions.
Board Composition
Our board of directors is currently comprised of five members. Our amended and restated certificate of incorporation and our amended and restated bylaws to be effective upon the completion of this offering will provide that the number of our directors shall be fixed from time to time by a resolution of a majority of our board of directors.
Mr. Razzouk serves as our President and Chief Executive Officer and Chairman of the Board. As our Chief Executive Officer, Mr. Razzouk is responsible for our day-to-day operations and implementing our strategy across our business. Since our performance is an important part of our board discussions, Mr. Razzouk brings direct and relevant information and experience as the chair of those discussions.
Our board has designated Mr. Mattessich as lead independent director, to act as the leader of the independent directors and as chairperson of the executive sessions of our independent directors. Our lead independent director serves as a non-exclusive intermediary between the independent directors and management, including our chairman and chief executive officer. Our lead independent director provides input to the chairman in planning agendas for board meetings and will facilitate discussions among the independent directors as appropriate between board meetings.
Director Independence
Our board of directors has undertaken a review of the independence of the directors and considered whether any director has a material relationship with us that could compromise that director’s ability to exercise independent judgment in carrying out his responsibilities. As a result of this review, our board of directors has
78
Table of Contents
Index to Financial Statements
determined that Messrs. DeAngelis, Siegel, Mattessich, and Ms. Sachar are independent directors as defined in accordance with the listing requirements of the NASDAQ Global Select Market. In making these determinations, our directors reviewed and discussed information provided by the directors with regard to each director’s business and personal activities.
Selection Arrangements
Each of Messrs. DeAngelis and Siegel, and Ms. Sachar, were elected to our board of directors according to the provisions of our current voting agreement, which entitles certain holders of our capital stock to elect directors. This right and the voting agreement will terminate upon the completion of this offering, and there will be no further obligation to which the company is a party regarding the election of our directors.
Risk Management
Our risk management function is overseen by our board of directors. Through our management reports, our company policies, such as our corporate governance guidelines, our audit and non-audit services pre-approval policy, our code of business conduct and ethics, and our audit committee’s and compensation committee’s review of financial and other risks, we keep our board of directors apprised of material risks and provide our directors access to all information necessary for them to understand and evaluate how these risks interrelate, how they affect us, and how our management addresses those risks. Currently, Mr. Razzouk, as our Chairman, President, and Chief Executive Officer works with our independent directors and with management once material risks are identified by the board of directors to address such risk. If an identified risk were to pose an actual or potential conflict with management, our independent directors would conduct an assessment by themselves.
Classified Board
Our amended and restated certificate of incorporation and amended and restated bylaws to be effective upon the completion of this offering provide that our board of directors will be divided into three classes of directors, each serving a staggered three-year term. As a result, commencing with our 2012 annual meeting of stockholders, one class, which will be comprised of only a portion of our board of directors, will be elected at each annual meeting for three-year terms. Our board of directors will be classified as follows:
| • | Ms. Sachar will be designated a Class I director whose term will expire at the 2012 annual meeting of stockholders; |
| • | Mr. DeAngelis and Mr. Siegel will be designated Class II directors whose terms will expire at the 2013 annual meeting of stockholders; and |
| • | Mr. Razzouk and Mr. Mattessich will be designated Class III directors whose terms will expire at the 2014 annual meeting of stockholders. |
Any additional directorships resulting from an increase in the number of authorized directors will be distributed among the three classes so that, as nearly as reasonably possible, each class will consist of one-third of the directors. The classification of the board of directors may have the effect of delaying or preventing changes in control of our company. Our amended and restated certificate of incorporation to be effective upon the completion of this offering further provides for the removal of a director only with cause and by the affirmative vote of the holders of a majority of the shares then entitled to vote at an election of our directors.
Committees of Our Board of Directors
Our board of directors has established an audit, compensation, and a nominating and governance committee.
79
Table of Contents
Index to Financial Statements
Audit
Our audit committee currently consists of Ms. Sachar and Messrs. Siegel and Mattessich, with Mr. Mattessich serving as chairman. Our board of directors has determined that Mr. Mattessich and Ms. Sachar meet or will meet upon the completion of this offering the requirements for audit committee independence purposes under the rules and regulations of the SEC and the listing requirements of the NASDAQ Global Select Market, and Mr. Mattessich qualifies as an audit committee financial expert, under SEC rules and regulations and the financial sophistication requirements of the NASDAQ Global Select Market. Our board of directors has determined that each of the members of the audit committee is financially sophisticated. Our audit committee is responsible for, among other things, selecting and hiring our independent auditors and approving the audit and non-audit services to be performed by our independent auditors; evaluating the qualifications, performance, and independence of our independent auditors; monitoring the integrity of our financial statements and our compliance with legal and regulatory requirements as they relate to financial statements or accounting matters; reviewing the adequacy and effectiveness of our internal control policies and procedures; discussing the scope and results of the audit with the independent auditors and reviewing with management and the independent auditors our interim and year-end operating results; and preparing the audit committee report that the SEC requires in our annual proxy statement. Upon the closing of this offering, the composition of our audit committee will comply with all applicable requirements of the SEC and the listing requirements of the NASDAQ Global Select Market. A majority of our audit committee members are independent directors, and after the phase in period under the applicable requirements of the SEC and the listing requirements of the NASDAQ Global Select Market, which we intend to rely upon, all members of our audit committee will be independent directors.
Compensation
Our compensation committee consists of Messrs. DeAngelis and Siegel, with Mr. DeAngelis serving as chairman. Our board of directors has determined that each member of our compensation committee meets the requirements for independence under the current requirements of the NASDAQ Global Select Market, is a non-employee director, as defined by Rule 16b-3 promulgated under the Exchange Act, and an outside director, as defined pursuant to Section 162(m) of the Internal Revenue Code of 1986, as amended. Our compensation committee is responsible for, among other things, reviewing and recommending to our board of directors for approval the salary, bonus, incentive, and equity compensation for our Chief Executive Officer, other executive officers, and directors; reviewing and making recommendations to our board of directors regarding incentive compensation and employee stock purchase and other equity plans; administering our 2000 Stock Plan and 2011 Equity Plan; and preparing the compensation discussion and analysis and compensation committee report that the SEC requires in our annual proxy statement.
Nominating and Governance
Our nominating and governance committee consists of Messrs. DeAngelis, Siegel, and Mattessich, with Mr. DeAngelis serving as chairman. Our board of directors has determined that each designated member of our nominating and corporate governance committee meets the requirements for independence under the requirements of the NASDAQ Global Select Market. The nominating and corporate governance committee will be responsible for, among other things, developing and recommending to our board of directors our corporate governance guidelines, identifying individuals qualified to become board members, overseeing the evaluation of the performance of the board of directors, selecting the director nominees for the next annual meeting of stockholders, and selecting director candidates to fill any vacancies on the board of directors. While we do not have a formal policy on diversity, our nominating and governance committee considers as one of the factors the diversity of the composition of our board and the skill set, background, reputation, type, and length of business experience, and gender of our board members as well as a particular nominee’s contributions to that mix.
80
Table of Contents
Index to Financial Statements
Code of Business Conduct
Our board of directors has adopted a code of business conduct. The code of business conduct will apply to all of our employees, officers, and directors. Upon the effectiveness of the registration statement of which this prospectus forms a part, the full text of our code of business conduct will be posted on our website at www.newgistics.com under the Investor Relations section. We intend to disclose future amendments to our code of business conduct, or certain waivers of such provisions, at the same location on our website identified above and also in public filings. The inclusion of our website address in this prospectus does not include or incorporate by reference the information on our website into this prospectus.
Director Compensation
We currently do not pay our directors who are employees or affiliates of our venture capital or private equity investors any cash or equity compensation for their services as members of our board of directors or any committee of our board of directors. We have a policy of reimbursing our directors for travel, lodging, and other expenses incurred in connection with their attendance at our board or committee meetings. In February 2011, we adopted a director compensation policy under which each non-employee member of our board of directors who is not affiliated with one of our venture capital or private equity investors is entitled to receive the following compensation:
| • | $35,000 per year, payable in equal monthly installments and pro-rated for partial years; |
| • | $5,000 per year, if such director also serves as our audit committee chairman, payable in equal monthly installments and pro-rated for partial years; and |
| • | a grant of an option to purchase a number of shares of our common stock equal to $150,000 divided by the per share price on the date of grant. |
Compensation Committee Interlocks and Insider Participation
None of the members of our compensation committee has at any time during the prior three years been an officer or employee of ours. None of our executive officers currently serves, or in the prior three years has served, as a member of the board of directors or compensation committee of any entity that has one or more executive officers serving on our board or compensation committee. For additional information, see the section titled “Certain Relationships and Related Party Transactions.”
81
Table of Contents
Index to Financial Statements
Compensation Discussion and Analysis
The following discussion and analysis of compensation arrangements of our named executive officers for fiscal 2010 and 2011 should be read together with the compensation tables and related disclosures set forth below. This discussion contains forward-looking statements that are based on our current plans, considerations, expectations and determinations regarding future compensation programs. The actual amount and form of compensation and the compensation programs that we adopt may differ materially from currently planned programs as summarized in this discussion. In addition, this discussion contains performance objectives established by us for fiscal 2010 solely with respect to our compensation programs. Such performance objectives do not constitute guidance regarding our expected future operating results.
Compensation Objectives
The goals of our executive compensation program are to attract, motivate and retain individuals with the skills and qualities necessary to support our customers and grow our business. In fiscal 2010, we designed our executive compensation program to achieve the following objectives:
| • | attract and retain executives experienced in developing and delivering products and services such as our own; |
| • | motivate and reward executives whose experience and skills are critical to our success; |
| • | reward performance; and |
| • | align the interests of our executive officers and stockholders by motivating executive officers to increase stockholder value. |
Determination of Compensation
The responsibility for establishing, administering and interpreting our policies governing the compensation and benefits for our executive officers lies with our compensation committee, which consists entirely of non-employee directors. See the section titled “Management—Committees of Our Board of Directors—Compensation.” For fiscal 2011, our compensation committee has taken the following steps to ensure that our executive compensation and benefit policies are consistent with both our compensation objectives and our corporate governance guidelines:
| • | established a practice, in accordance with the NASDAQ rules, of independently reviewing the performance and determining the compensation earned, paid, or awarded to our Chief Executive Officer; |
| • | established a policy, in accordance with the NASDAQ rules, to review on an annual basis the compensation of our other executive officers with recommendations from our Chief Executive Officer, and to determine what the compensation committee believes to be appropriate total compensation for these executive officers; and |
| • | established an equity grant policy for both new hire and periodic equity awards. |
The compensation committee has historically relied principally upon the experience and expertise of the committee members when determining executive compensation. Each of Messrs. DeAngelis and Siegel, the members of our compensation committee, has been a partner of a private equity firm and has served on the boards of directors and compensation committees of numerous logistics and technology companies. The compensation committee did not retain a compensation consultant and did not benchmark our executive compensation against any specific comparable companies for our fiscal 2010 executive compensation program.
82
Table of Contents
Index to Financial Statements
When determining executive compensation, the compensation committee considers the objectives of our executive compensation policies described above in the context of our financial condition and historical operating results, our operating plan, and economic conditions generally. In connection with executive equity awards specifically, if any, the compensation committee reviews prior equity award levels, the executive’s aggregate equity interests, and the general duties, responsibilities, and performance of the executive officers in their respective positions.
Our compensation committee typically invites our Chief Executive Officer to attend meetings of the compensation committee. Prior to these meetings, our Chief Executive Officer seeks input on Mr. Johnson’s commission plan from our Chief Financial Officer. During deliberations of compensation decisions relating to our executive officers other than our Chief Executive Officer, the compensation committee considers the recommendations of our Chief Executive Officer. The compensation committee then deliberates and makes determinations about executive compensation, for persons other than the Chief Executive Officer. The Chief Executive Officer is typically present throughout these deliberations.
For compensation decisions regarding our Chief Executive Officer, our compensation committee discusses with the Chief Executive Officer his current compensation and his perspective on his compensation for the upcoming year. The compensation committee then deliberates and determines the compensation of the Chief Executive Officer in executive session outside of the presence of our Chief Executive Officer. The committee then communicates its decision on his compensation to him through the chairman of the committee.
Components of Executive Compensation
Our executive compensation program has three primary components—base salaries, cash incentive payments, and equity-based awards granted pursuant to our equity plans described below under “Executive Compensation—Benefit Plans.” Mr. Johnson, our Vice President of National Accounts, receives sales commissions or bonuses in lieu of a cash incentive payment. Our executives also are entitled to certain other benefits described under “Executive Compensation—Benefits.” The compensation committee has not adopted any formal or informal policies for allocating compensation between long-term and currently paid out compensation, between cash and non-cash compensation, or among different forms of non-cash compensation, but rather relies on the experience of its members, its past practices, and management input to establish the different forms of compensation. The compensation committee reserves the right to grant discretionary bonuses to any employee. In fiscal 2010, no discretionary bonuses were granted to our named executive officers.
Base Salary
Our compensation committee believes that base salary is a significant motivating factor in attracting and retaining executive officers. Historically, the compensation committee has set base salaries based on the performance of the business generally and the executive officers’ respective positions and performance with us. In fiscal 2010, our compensation committee increased base salaries for our executive officers by approximately 4%.
Cash Incentive Plan
Our compensation committee annually establishes a cash incentive plan for our parcel solutions business employees, freight services business executives, and our Chief Executive Officer and Chief Financial Officer. All of our executives, other than Mr. Johnson who receives sales commissions and/or bonuses pursuant to a separate commission plan, participate in the cash incentive plan. Our cash incentive amounts are conditioned upon our achievement of objectives established each year by the compensation committee. The compensation committee also retains the right to modify the plan, including the targets and the amounts payable under the plan as well as the right to exercise discretionary authority over the payment of cash incentives. The annual targeted incentive payment of each named executive officer, other than Mr. Johnson, is based upon a percentage
83
Table of Contents
Index to Financial Statements
of base salary. In fiscal 2010, the compensation committee relied on its judgment in establishing these target percentages. The percentage for each named executive officer is as set forth in the following table:
| Aggregate Annual Target Incentive Payment Percentage |
||||
| William J. Razzouk |
80 | % | ||
| Michael J. Twomey |
50 | % | ||
| Todd A. Everett |
50 | % | ||
| Alva J. Phillips |
50 | % | ||
We pay the incentive payments under the cash incentive plan twice each year. The compensation committee establishes first-half targets and full-year targets based on our annual operating plan. We pay incentive payments equal to one-third of the aggregate annual potential incentive payment in the third quarter based on our achievement of first-half targets and pay incentive payments equal to actual incentive payments earned (net of any payments made in the third quarter for achieving first-half targets) in the first quarter of the following fiscal year. Our compensation committee also believes that our executives should be rewarded if we exceed the targets it sets for our executives. Therefore, our plan provides for cash incentives in excess of the targeted percentage of base salary for our executives in the event that our performance exceeds the targets established by the compensation committee.
In fiscal 2010, our executive officers became eligible to receive incentive payments based upon our achievement of targets tied to revenue, new contract bookings, and Operating EBITDA. Our revenue target for Messrs. Razzouk and Twomey refers to revenue from our parcel solutions and freight services businesses and was set at $85.3 million and $182.9 million for the first six months of and all of fiscal 2010, respectively. Our revenue target for Messrs. Phillips and Everett refers to revenue from our parcel solutions segment and was set at $80.9 million and $173.6 million for the first six months of and all of fiscal 2010, respectively. Our new contract bookings target for executive officers refers to the revenue we expect to receive from new parcel solutions customers during the first 12 months of the contract term and was set at $12.4 million and $30.8 million for the first six months of and all of fiscal 2010, respectively. Operating EBITDA is Adjusted EBITDA, less depreciation and amortization included as cost of revenue. Our Operating EBITDA target for Messrs. Razzouk and Twomey refers to Operating EBITDA from our parcel solutions and freight services businesses and was set at $4.9 million and $12.6 million, respectively. Our Operating EBITDA target for Messrs. Phillips and Everett refers to Operating EBITDA from our parcel solutions business and was set at $3.6 million and $9.8 million for the first six months of and all of fiscal 2010, respectively. The achievement of each target was also assigned a relative weight in accordance with the following table:
| Target |
Relative Weight of Target | |||
| Revenue |
30 | % | ||
| New Contract Bookings |
20 | % | ||
| Operating EBITDA |
50 | % | ||
Our compensation committee gave our Operating EBITDA target the most weight as it believes obtaining and maintaining profitable business should be our executives’ primary focus. Revenue was given more weight than new contract bookings as our compensation committee believes that our executives should be focused on obtaining business, whether that is in the form of maintaining existing business from or obtaining additional business from existing customers or adding new customers. The actual amount of cash incentive payable to Messrs. Razzouk and Twomey was to be based upon the percentage of completion of each target in accordance with the following table:
| Percent Achievement of Target |
Percentage Payout | |
| 0% – 79.9% |
0% | |
| 80% – 89.9% |
60% – 79.9% | |
| 90% – 99.9% |
80% – 99.9% | |
| 100% – 104.9% |
100% – 129.9% | |
| 105% – 109.9% |
130% – 149.9% | |
| 110% and higher |
150% |
84
Table of Contents
Index to Financial Statements
The percent achievement of a target within the range provided above was to bear a direct relationship to the percentage payout within the ranges above.
The actual amount of cash incentive payable to Messrs. Phillips and Everett was to be based upon the percentage of completion of each target in accordance with the following table:
| Percent Achievement of Target |
Percentage Payout | |
| 0% – 79.9% |
0% | |
| 80% – 89.9% |
50% - 74.9% | |
| 90% – 99.9% |
75% - 99.9% | |
| 100% – 104.9% |
100% - 119.9% | |
| 105% – 109.9% |
120% - 139.9% | |
| 110% and higher |
140% |
The percent achievement of a target within the range provided above was to bear a direct relationship to the percentage payout within the ranges above.
During the first half of fiscal 2010, we achieved 97.1% of the revenue target, 94.4% of our new contract bookings target, and 149.0% of our Operating EBITDA target for Messrs. Razzouk and Twomey, and 96.5% of the revenue target, 94.4% of our new contract bookings target, and 161.1% of our Operating EBITDA target for Messrs. Phillips and Everett. As a result, Messrs. Razzouk and Twomey received 120.8% of their respective first half incentive payments and Messrs. Phillips and Everett received 114.0% of their respective first half incentive payments. For full fiscal 2010, we achieved 95.4% of the revenue target, 117.7% of our new contract bookings target, and 130.0% of our Operating EBITDA target for Messrs. Razzouk and Twomey, and 95.0% of the revenue target, 117.7% of our new contract bookings target, and 137.2% of our Operating EBITDA target for Messrs. Phillips and Everett. As a result, Messrs. Razzouk and Twomey received 132.0% of their respective second half incentive payments and Messrs. Phillips and Everett received 123.5% of their respective second half incentive payments. The second-half incentive payment earned by each of our named executive officers was determined based upon our full year performance, net of the executive’s first half incentive payment. The bonus amounts earned by our named executive officers during fiscal 2010 are as set forth in the following table:
| Actual First Half Cash Incentive Amount |
Actual Second Half Cash Incentive Amount |
Actual 2010 Total Cash Incentive Earned |
||||||||||
| William J. Razzouk |
$ | 156,235 | $ | 355,503 | $ | 511,738 | ||||||
| Michael J. Twomey |
55,171 | 125,537 | 180,708 | |||||||||
| Todd A. Everett |
36,212 | 94,698 | 130,910 | |||||||||
| Alva J. Phillips |
50,198 | 112,946 | 163,144 | |||||||||
In fiscal 2011, we do not intend to use Operating EBITDA or new contract bookings as targets under our cash inventive plan. Rather, we intend to use only revenue and Adjusted EBITDA targets.
Sales Commissions/Bonuses
We also pay Mr. Johnson sales commissions and bonuses to encourage and reward his contributions to our long-term revenue growth. In fiscal 2010, Mr. Johnson was eligible to receive commissions based upon new contract bookings from our parcel solutions segment and bonuses upon our achievement of a revenue target from our parcel solutions segment of $173.6 million for fiscal 2010. Mr. Johnson was eligible to receive a commission equal to 0.5% of all new contract bookings generated from parcel deliveries in fiscal 2010 and 1.5% of all new contract bookings from parcel returns in fiscal 2010. Mr. Johnson was also entitled to an additional commission of 0.25% on all new contract bookings in excess of $30.8 million in fiscal 2010. In addition, Mr. Johnson was to be paid a $10,000 bonus upon our achievement of 90% of his revenue target, a $5,000 bonus upon our achievement of 95% of his revenue target, a $5,000 bonus upon our achievement of
85
Table of Contents
Index to Financial Statements
100% of his revenue target, and a $5,000 for each whole percentage point by which we exceed 100% of his revenue target. There was no maximum commission that Mr. Johnson could be paid. In fiscal 2010, Mr. Johnson earned commissions of $94,729 on new contract bookings from parcel deliveries and $185,174 on new contract bookings from parcel returns, and a bonus of $10,000 based on our achievement of just less than 95% of the revenue target for his bonus. In fiscal 2011, we do not intend to use new contract bookings as basis for Mr. Johnson’s commissions or bonuses.
Equity Awards
Although we have not implemented any stock ownership guidelines with respect to our executive officers, our compensation committee believes that providing our executive officers with an equity interest helps to align the interests of our executive officers with those of our stockholders.
We have historically granted stock options to our employees, including executive officers, upon hiring and thereafter to a portion of employees generally based on performance. Our board of directors, based on input from the compensation committee, grants all stock options at fair market value on the date of grant. Neither the board of directors nor the compensation committee has adopted any policy or program requiring the annual grant of equity awards to any executive officer or other employee. We have a right to repurchase shares issued upon the exercise of unvested options at cost upon termination of service.
The board of directors determines the size of annual awards, if any, based upon the compensation committee’s subjective assessment of the incentive value of the executive officers’ respective total equity interests relative to their roles in the company and their levels of vested and unvested shares. Consistent with this approach, the board of directors and compensation committee believed that the equity interests of the executive officers were appropriate in fiscal 2010.
Change in Control and Severance Benefits
In addition to benefits upon a change in control under our equity benefit plans described below under “Executive Compensation—Equity Benefit Plans,” certain of our named executive officers are entitled to receive additional compensation or benefits under the severance and change in control provisions contained in their employment agreements or offer letters, and option agreements. The compensation committee established these benefits based upon the experience and expertise of the committee members. Our severance and change in control provisions for the named executive officers are summarized below in “Executive Compensation—Potential Payments upon Termination or Change in Control.”
Benefits
Our executives participate in our standard benefit plans, which are offered to all U.S.-based employees and include our 401(k) plan. Our executives have the opportunity to participate in our health and welfare benefit programs which include a group medical program, a group dental program, life insurance, disability insurance, accidental death and dismemberment insurance and flexible spending accounts. These benefits are the same as those offered to all other U.S.-based employees. Through our benefit programs, each of our named executive officers receives group term life insurance equivalent to 100% of their annual base salary, up to a maximum of $225,000. See the “All Other Compensation” column of the Summary Compensation Table in the section titled “Management—Executive Compensation.”
Tax and Accounting Considerations
Section 162(m) of the Internal Revenue Code generally disallows a tax deduction for compensation in excess of $1.0 million paid to our chief executive officer and our four other most highly paid executive officers. Qualifying performance-based compensation is not subject to the deduction limitation if specified requirements are met. Under applicable guidance from the Department of Treasury for newly-public companies, the deduction limitation generally will not apply to any compensation paid during the period ending with the first
86
Table of Contents
Index to Financial Statements
stockholder meeting to elect directors after the close of the third calendar year following the year in which the initial public offering occurs. In addition, we further generally intend to otherwise structure the performance-based portion of our executive compensation, when feasible, to comply with exemptions in Section 162(m) so that the compensation remains tax deductible to us. Our compensation committee intends to consider the impact of Section 162(m) and other tax and accounting rules and regulations in maintaining an approach to executive compensation that strongly links pay to performance. However, our compensation committee and our board of directors may, in their judgment, authorize compensation payments that do not comply with the exemptions in Section 162(m) when it believes that such payments are appropriate to attract and retain executive talent.
Severance Compensation and Termination Protection
See the section titled “Management—Employment Agreements” or “Executive Compensation—Potential Payments upon Termination or Change in Control” for a description of the tables setting forth the potential payments to be made to each named executive officer and definitions of key terms under these agreements. Our compensation committee believes that these change in control vesting and severance benefits could serve to minimize the distraction caused by a potential transaction involving a change in control and to reduce the risk that an executive would leave their employment before a transaction were consummated.
Summary Compensation Table
The following table presents compensation information for fiscal 2010 paid to or accrued for our principal executive officer, our principal financial officer, and our three other most highly compensated persons serving as executive officers as of January 1, 2011. We refer to these executive officers as our “named executive officers.”
| Name and Principal Position |
Year | Salary | Option Awards (1) |
Non-equity Incentive Plan Compensation (2) |
All Other Compensation (3) |
Total | ||||||||||||||||||
| William J. Razzouk |
2010 | $ | 484,600 | $ | - | $ | 511,738 | $ | 27,040 | $ | 1,023,378 | |||||||||||||
| Chairman of the Board, President, and Chief Executive Officer |
||||||||||||||||||||||||
| Michael J. Twomey |
2010 | 273,800 | - | 180,708 | 10,097 | 464,605 | ||||||||||||||||||
| Chief Financial Officer |
||||||||||||||||||||||||
| Todd A. Everett |
2010 | 206,662 | 210,000 | 130,910 | 9,651 | 557,223 | ||||||||||||||||||
| Vice President of Operations |
||||||||||||||||||||||||
| Kenneth W. Johnson |
2010 | 249,500 | - | 289,903 | 17,515 | 556,918 | ||||||||||||||||||
| Vice President of National Accounts |
||||||||||||||||||||||||
| Alva J. Phillips |
2010 | 264,200 | $ | - | $ | 163,144 | $ | 297 | $ | 427,641 | ||||||||||||||
| Chief Technology Officer |
||||||||||||||||||||||||
| (1) | The amount shown in this column represents the grant date fair value of stock options granted in the respective years as computed in accordance with the FASB ASC 718. The amount shown excludes the impact of estimated forfeitures related to service-based vesting conditions. This amount may not correspond to the actual value that is ultimately realized by Mr. Everett. Mr. Everett was granted 3,500,000 stock options in connection with his appointment as Vice President of Operations in February 2010. See Note 9 to the consolidated financial statements included in this prospectus for a discussion of the relevant assumptions used in calculating the aggregate grant date fair value. Additional information regarding grants awarded in 2010 is presented in the “Grants of Plan-Based Awards in Fiscal 2010” table below. |
| (2) | With the exception of Mr. Johnson, amounts shown in this column represent amounts earned in fiscal 2010 pursuant to the fiscal 2010 cash incentive plan; some of which was paid in February 2011. Amounts shown for Mr. Johnson represent commissions earned pursuant to his fiscal 2010 incentive commission plan. |
| (3) | Includes (i) $9,800 in matching contributions under our 401(k) Plan for Messrs. Razzouk, Twomey, and Johnson, (ii) $9,450 in matching contributions under our 401(k) Plan for Mr. Everett, (iii) $17,240, $297, $297, $201, and $275 in life insurance premiums for Messrs. Razzouk, Twomey, Johnson, Everett, and Phillips, respectively, and (iv) in the case of Mr. Johnson, $7,418 in perquisites related to travel. Mr. Phillips did not participate in our 401(k) Plan in 2010. |
87
Table of Contents
Index to Financial Statements
Grants of Plan-Based Awards in Fiscal 2010
The following table sets forth information regarding grants of awards made to our named executive officers during fiscal 2010.
| Name |
Grant Date |
Estimated Future Payouts under Non-Equity Incentive Plan Awards |
All Other Option Awards: Number of Securities Underlying Options (#) |
Exercise or Base Price of Option Awards ($/SH) |
Grant Date Fair Value of Stock Option Awards ($)(3) |
|||||||||||||||||||||||
| Threshold ($) | Target ($) | Maximum ($) | ||||||||||||||||||||||||||
| William J. Razzouk (1) |
1/2/10 | 65,265 | 387,680 | 581,520 | ||||||||||||||||||||||||
| Michael J. Twomey (1) |
1/2/10 | 16,428 | 136,900 | 205,350 | ||||||||||||||||||||||||
| Todd A. Everett (1) |
1/2/10 | 10,333 | 103,331 | 144,663 | ||||||||||||||||||||||||
| 2/22/10 | 3,500,000 | $ | 0.14 | $ | 210,000 | |||||||||||||||||||||||
| Kenneth W. Johnson (2) |
1/2/10 | - | - | - | ||||||||||||||||||||||||
| Alva J. Phillips (1) |
1/2/10 | 13,210 | 132,100 | 184,940 | ||||||||||||||||||||||||
| (1) | The amounts set forth in these rows under the column “Estimated Future Payouts under Non-Equity Incentive Plan Awards” represent the threshold, target and maximum bonus potential under the fiscal 2010 cash incentive plan. See discussion in “Compensation Discussion and Analysis” above for a description of the conditions for the fiscal 2010 cash incentive plan. |
| (2) | Mr. Johnson’s threshold, target, and maximum commission potential is governed by his 2010 incentive commission plan. Commission rates are based on new contract bookings. See discussion in “Compensation Discussion and Analysis” above for a description of the conditions for his fiscal 2010 incentive commission plan. |
| (3) | The amount shown in this column represents the grant date fair value of stock options granted in the respective years as computed in accordance with the FASB ASC 718. The amount shown excludes the impact of estimated forfeitures related to service-based vesting conditions. This amount may not correspond to the actual value that is ultimately realized by Mr. Everett. See Note 9 to the consolidated financial statements included in this prospectus for a discussion of the relevant assumptions used in calculating the aggregate grant date fair value. |
88
Table of Contents
Index to Financial Statements
Outstanding Equity Awards at Fiscal Year End
The following table sets forth information regarding outstanding option awards held by our named executive officers at January 1, 2011.
| Option Awards | ||||||||||||||||
| Name |
Number of Securities Underlying Unexercised Options (#) Exercisable (1) |
Number of Securities Underlying Unexercised Options (#) Unexercisable |
Option Exercise Price ($) |
Option Expiration Date |
||||||||||||
| William J. Razzouk |
33,400,000 | - | $ | 0.05 | 4/03/2015 | |||||||||||
| 5,000,000 | - | 0.09 | 10/30/2017 | |||||||||||||
| 38,400,000 | ||||||||||||||||
| Michael J . Twomey |
7,155,994 | - | 0.05 | 2/26/2016 | ||||||||||||
| 1,000,000 | - | 0.09 | 10/30/2017 | |||||||||||||
| 8,155,994 | ||||||||||||||||
| Todd A. Everett |
322,500 | - | 0.05 | 5/09/2015 | ||||||||||||
| 177,500 | - | 0.05 | 1/02/2016 | |||||||||||||
| 200,000 | - | 0.09 | 10/30/2017 | |||||||||||||
| 1,428,570 | 2,071,430 | 0.14 | 2/22/2020 | |||||||||||||
| 2,128,570 | 2,071,430 | |||||||||||||||
| Kenneth W. Johnson |
650,000 | - | 0.05 | 2/12/2013 | ||||||||||||
| 2,121,541 | 0.05 | 5/06/2013 | ||||||||||||||
| 1,294,554 | - | 0.05 | 12/14/2014 | |||||||||||||
| 3,967,230 | - | 0.05 | 4/03/2015 | |||||||||||||
| 1,000,000 | - | 0.09 | 10/30/2017 | |||||||||||||
| 9,033,325 | ||||||||||||||||
| Alva J. Phillips |
2,771,542 | - | 0.05 | 2/18/2014 | ||||||||||||
| 2,851,785 | - | 0.05 | 5/09/2015 | |||||||||||||
| 250,000 | - | 0.05 | 5/30/2015 | |||||||||||||
| 1,000,000 | - | 0.09 | 10/30/2017 | |||||||||||||
| 6,873,327 | ||||||||||||||||
| (1) | The amounts set forth in this column reflect the number of shares underlying time-based options that were granted under the 2000 Stock Plan. All of the options of Messrs. Razzouk, Twomey, Johnson, and Phillips are fully vested and exercisable. The first two option grants listed above for Mr. Everett are fully vested and exercisable. Mr. Everett’s remaining options vest 25% after one year from the vesting commencement date of the grant and monthly thereafter over the next three years. The third option listed above for Mr. Everett vests over the four year period beginning October 31, 2007 and ending October 31, 2011, is immediately exercisable, and was vested as to 158,333 shares as of January 1, 2011. The fourth option listed above for Mr. Everett vests over the four year period beginning February 11, 2010 and ending February 11, 2014, is subject to an early exercise provision as to a portion of the option, and was not vested as to any shares as of January 1, 2011. |
89
Table of Contents
Index to Financial Statements
Option Exercises
None of our named executive officers exercised any stock options during fiscal 2010.
Management—Employment Agreements
We are party to the following employment agreements with our named executive officers:
William J. Razzouk
We entered into an employment agreement with William J. Razzouk, our Chairman of the Board, President, and Chief Executive Officer, on March 31, 2005. The agreement was subsequently amended on April 4, 2005 November 8, 2006, and January 2, 2011. Under the agreement, Mr. Razzouk’s base salary was $350,000 per year with a target incentive payment percentage of 50% of base salary annually. Mr. Razzouk’s base salary and target incentive payment percentage periodically have been increased by our compensation committee, and are $530,500, and 100%, respectively, for 2011. Mr. Razzouk is also entitled to reimbursement of reasonable out-of-pocket business expenses. On April 4, 2005, in accordance with the terms of his employment agreement, Mr. Razzouk was granted options to purchase 33,400,000 shares of our common stock at an exercise price of $0.05. These options have all vested. Mr. Razzouk is also eligible to participate in all employee benefit plans. In the event that Mr. Razzouk relocates to Austin, he is entitled to moving expenses not to exceed $225,000. As part of his employment agreement, Mr. Razzouk is entitled to severance benefits upon termination of employment as described below under “Executive Compensation—Potential Payments upon Termination or Change in Control.”
Michael J. Twomey
We entered into an employment agreement (in the form of an employment offer letter) with Michael J. Twomey, our Chief Financial Officer, on February 16, 2006. Under the agreement, Mr. Twomey’s base salary was $215,000 per year with a target incentive payment percentage of 40% of base salary annually. Mr. Twomey’s base salary and target incentive payment percentage have periodically been increased by our compensation committee, and are $291,597, and 50%, respectively, for 2011. On February 27, 2006, in accordance with the terms of his employment agreement, Mr. Twomey was granted an option to purchase 7,155,994 shares of our common stock at an exercise price of $0.05. These options have all vested and are exercisable. As part of his employment agreement, Mr. Twomey is entitled to severance benefits upon termination of employment as described below under “Executive Compensation—Potential Payments upon Termination or Change in Control.”
Todd A. Everett
We entered into an employment agreement (in the form of an employment offer letter) with Todd A. Everett, our Vice President of Operations, on February 11, 2010. Under the agreement, Mr. Everett’s base salary was $212,000 per year with a target incentive payment percentage of 50% of base salary annually. Mr. Everett’s base salary was increased by our compensation committee to $233,200 for 2011 and his target incentive payment percentage remained the same. On February 23, 2010, in accordance with the terms of his employment agreement, Mr. Everett was granted an option to purchase 3,500,000 shares of our common stock at an exercise price of $0.14. As of January 1, 2011, none of these options were vested and 1,428,570 were exercisable. Mr. Everett is also eligible to participate in all employee benefit plans. As part of his employment agreement, Mr. Everett is entitled to severance benefits upon termination of employment as described below under “Executive Compensation—Potential Payments upon Termination or Change in Control.”
Kenneth W. Johnson
We entered into an employment agreement (in the form of an employment offer letter) with Kenneth W. Johnson, our Vice President of National Accounts, on December 23, 2002, as amended by a letter agreement
90
Table of Contents
Index to Financial Statements
with Mr. Johnson on October 31, 2007. Under these agreements, Mr. Johnson’s base salary was $180,000 per year with bonuses to be paid based on a commission program. Mr. Johnson’s base salary has periodically been increased by our compensation committee, and is $261,975 for 2011. The compensation committee approves Mr. Johnson’s commission plan on an annual basis. On February 13, 2003, in accordance with the terms of his employment agreement, Mr. Johnson was granted an option to purchase 650,000 shares of our common stock at an exercise price of $0.05. These options have all vested and are exercisable. Mr. Johnson is also eligible to participate in all employee benefit plans. As part of his employment agreement, Mr. Johnson is entitled to severance benefits upon termination of employment as described below under “Executive Compensation—Potential Payments upon Termination or Change in Control.”
Alva J. Phillips
We entered into an employment agreement (in the form of an employment offer letter) with Alva J. Phillips, our Chief Technology Officer, on January 7, 2004. Under the agreement, Mr. Phillips’ base salary was $185,000 per year with a target incentive payment percentage of 40% of base salary annually. Mr. Phillips’ base salary and target incentive payment percentage have periodically been increased by our compensation committee, and are $274,768, and 50%, respectively, for 2011. He was also granted a $15,000 sign-on bonus and a relocation reimbursement package, not to exceed $30,000. On February 19, 2004, in accordance with the terms of his employment agreement, Mr. Phillips was granted an option to purchase 2,771,542 shares of our common stock at an exercise price of $0.05. These options have all vested and are exercisable. Mr. Phillips is also eligible to participate in all employee benefit plans. As part of his employment agreement, Mr. Phillips is entitled to severance benefits upon termination of employment as described below under “Executive Compensation—Potential Payments upon Termination or Change in Control.”
Executive Compensation—Potential Payments upon Termination or Change in Control
We have entered into employment agreements, described immediately above, that require specific payments and benefits to be provided to our named executive officers in the event of termination of employment. The information below describes the potential payments or benefits to our named executive officers upon (i) termination of employment without cause and (ii) a change in control. The numbers below are calculated as if each named executive officer’s employment terminated as of January 1, 2011, pursuant to the agreements described above in the section titled “Management—Employment Agreements.”
Definitions and Assumptions Applicable to Termination
Certain of our executive officers are entitled to continuation of employee benefits if they are terminated other than for cause. In quantifying employee benefits, we have assumed that our contributions to these officers’ benefit plans will stay at the same levels in 2011 as in 2010. “Cause” is defined in each of our executive officer’s employment agreements.
With respect to Mr. Razzouk’s agreement, cause is defined as termination based on (i) his conviction or plea of “guilty” or “no contest” to any crime constituting a felony in the jurisdiction in which committed, any crime involving moral turpitude (whether or not a felony), or any other violation of criminal law involving fraud, dishonesty or willful misconduct (whether or not a felony); (ii) his refusal to follow the lawful and proper directives of our board of directors; (iii) his breach of his employment agreement or proprietary information and inventions agreement; (iv) his actions that, to a reasonable person, would be likely to materially discredit or damage us or our reputation; or (v) his chronic absence from work for reasons other than illness.
With respect to the agreements of Messrs. Twomey, Johnson, and Phillips, cause is defined as termination based on (i) such executive’s conviction or plea of “guilty” or “no contest” to any crime constituting a felony in the jurisdiction in which committed, any crime involving moral turpitude (whether or not a felony), or any other
91
Table of Contents
Index to Financial Statements
violation of criminal law involving dishonesty or willful misconduct that materially injures us (whether or not a felony); (ii) such executive’s substance abuse that in any manner materially interferes with the performance of the executive’s duty; (iii) such executive’s failure or refusal to perform his duties or to follow the lawful and proper directives of our board of directors that are within the scope of his duties; provided, however, that we first notify the executive in writing stating that such failure or refusal is grounds for termination for cause and the executive fails to cure the conduct within 30 days of receiving such written notice; (iv) such executive’s material breach of his confidentiality, proprietary information and inventions agreement; (v) gross misconduct by such executive that materially damages us; or (vi) such executive’s indictment for a felony violation of the federal securities laws.
With respect to Mr. Everett’s agreement, cause is defined as termination based on (i) such executive’s conviction or plea of “guilty” or “no contest” to any crime constituting a felony in the jurisdiction in which committed, any crime involving moral turpitude (whether or not a felony), or any other violation of criminal law involving dishonesty or willful misconduct that materially injures us (whether or not a felony); (ii) such executive’s substance abuse that in any manner materially interferes with the performance of the executive’s duty; (iii) such executive’s failure or refusal to perform his duties or to follow the lawful and proper directives of our Chief Executive Officer that are within the scope of his duties; provided, however, that we first notify the executive in writing stating that such failure or refusal is grounds for termination for cause and the executive fails to cure the conduct within 30 days of receiving such written notice; (iv) such executive’s material breach of his confidentiality, proprietary information and inventions agreement; (v) gross misconduct by such executive that materially damages us; or (vi) such executive’s indictment for a felony violation of the federal securities laws.
Definition and Effect of a Change in Control
Each executive officer has received an option pursuant to our 2000 Stock Plan. Under the 2000 Stock Plan, each officer’s options will be affected in the event of a “Corporate Transaction,” which by its definition would include a change in control. A Corporate Transaction is defined as (i) a merger or consolidation or other reorganization approved by our stockholders, unless securities representing more than 50% of the total combined voting power of the voting securities of the successor corporation are immediately thereafter beneficially owned, directly or indirectly and in substantially the same proportion, by the persons who beneficially owned our outstanding voting securities immediately prior to such transaction, or (ii) the sale, transfer or other disposition of all or substantially all of our assets in complete liquidation or dissolution. A firmly underwritten public offering of our common stock is not considered a Corporate Transaction.
In the event of a change in control, every officer with unvested options will have his options accelerated pursuant to the terms of our 2000 Stock Plan. Under the terms of this plan, if an officer’s options are (i) not assumed by a successor corporation or (ii) are not to be replaced with a cash incentive program which preserves the spread existing on the unvested option shares at the time of the change in control (which spread is calculated as the excess of the fair market value of the option shares over the exercise price payable for such shares), then such officer’s options will become 100% vested immediately prior to the effective date of the change in control.
In the event of a change in control in which an officer’s options are assumed, if the options granted to an officer under an option grant are less than 50% vested, the number of such unvested options which will become fully vested immediately prior to the effective date of the change in control will be the lesser of (i) the number of options required to give the officer a fully vested interest in 50% of such option grant, or (ii) the number of such options that would have vested had the officer continued in our service for an additional twelve months following the date of the change in control.
If the officer is terminated within one year following a change in control in which his options are assumed, then all of the officer’s options will become 100% vested and may be exercised at any time prior to the earlier of (i) the expiration date of the options and (ii) the expiration of the one year period measured from the date of such termination.
92
Table of Contents
Index to Financial Statements
Immediately following the consummation of a change in control, all outstanding options shall terminate and cease to be outstanding, except to the extent assumed by the successor corporation (or a parent thereof) or replaced with a cash incentive program.
Potential Payments to William J. Razzouk
If we terminate Mr. Razzouk’s employment without cause, he will be entitled to receive twelve months salary in a lump-sum within 15 days of termination. Had Mr. Razzouk’s employment been terminated on January 1, 2011, such payment would amount to $484,600, subject to tax withholding. Mr. Razzouk would also be entitled to receive payments to cover his Fortis catastrophic insurance policy for the twelve month period after termination, not to exceed $12,000. He would also be entitled to continuation of COBRA benefits for this period, which would have amounted to $8,340. All of Mr. Razzouk’s options are vested and will remain exercisable until the earlier of (i) March 30, 2015, (ii) immediately prior to a Corporate Transaction, or (iii) the date six months after the completion of this public offering; provided that Mr. Razzouk will have a minimum of three months after his termination to exercise his options.
Potential Payments to Michael J. Twomey
If we terminate Mr. Twomey’s employment for any reason other than for cause, he will be entitled to receive salary continuation and employee benefits for the shorter of (i) six months or (ii) until Mr. Twomey accepts another position as an employee, consultant or independent contractor. Had Mr. Twomey’s employment been terminated on January 1, 2011, such salary payments would amount to $136,900, subject to tax withholding, and employee benefits would amount to $6,735. Mr. Twomey will also have a period of three months during which to exercise any stock options which are fully vested at the time of his termination. All of Mr. Twomey’s options are vested.
Potential Payments to Todd A. Everett
If we terminate Mr. Everett’s employment for any reason other than for cause, he will be entitled to receive salary continuation and employee benefits for the shorter of (i) six months or (ii) until Mr. Everett accepts another position as an employee, consultant or independent contractor. Had Mr. Everett’s employment been terminated on January 1, 2011, such salary payments would amount to $106,000, subject to tax withholding, and employee benefits would amount to $9,972. Mr. Everett will also have a period of three months during which to exercise any stock options which are fully vested at the time of his termination. As of January 1, 2011, Mr. Everett had 658,333 vested options, 500,000 of which are exercisable at an exercise price of $0.05 and 158,333 of which are exercisable at an exercise price of $0.09.
If Mr. Everett were terminated within one year following a change in control in which his options are assumed or are replaced with a cash incentive program, the vesting of 3,541,667 of Mr. Everett’s options would accelerate such that all of his options would be vested. The total value of Mr. Everett’s vesting acceleration would be $143,750.03, calculated as the difference between the fair market value of our common stock as of January 1, 2011 as determined by our board and the exercise price of all unvested options.
Immediately prior to a change in control in which Mr. Everett’s options are not assumed and are not to be replaced with a cash incentive program, the vesting of 3,541,667 of Mr. Everett’s options would accelerate such that all of his options would be vested. The total value of Mr. Everett’s vesting acceleration would be $143,750.03, calculated as described above.
Immediately prior to a change in control in which Mr. Everett’s options are assumed or are replaced with a cash incentive program, Mr. Everett’s options would accelerate with respect to 1,604,167 options. The total value of Mr. Everett’s vesting acceleration would be $64,166.68, calculated as described above. At that point, 500,000 of his options would be vested and exercisable at an exercise price of $0.05, 158,000 of his options would be vested and exercisable at an exercise price of $0.09, and 1,604,167 of his options would be vested and exercisable at an exercise price of $0.14.
93
Table of Contents
Index to Financial Statements
Potential Payments to Kenneth W. Johnson
If we terminate Mr. Johnson’s employment for any reason other than for cause, he will be entitled to receive salary continuation and employee benefits for the shorter of (i) three months and (ii) until Mr. Johnson accepts another position as an employee, consultant or independent contractor. Had Mr. Johnson’s employment been terminated on January 1, 2011, such salary payments would amount to $62,375, subject to tax withholding, and employee benefits would amount to $5,248. Mr. Johnson will also have a period of three months during which to exercise any stock options which are fully vested at the time of his termination. All of Mr. Johnson’s options are vested.
Potential Payments to Alva J. Phillips
If we terminate Mr. Phillips’ employment for any reason other than for cause, he will be entitled to receive salary continuation and employee benefits for the shorter of (i) six months and (ii) until Mr. Phillips accepts another position as an employee, consultant, or independent contractor. Had Mr. Phillips’ employment been terminated on January 1, 2011, such salary payments would amount to $132,100, subject to tax withholding, and employee benefits would amount to $3,984. Mr. Phillips will also have a period of three months during which to exercise any stock options which are fully vested at the time of his termination. All of Mr. Phillips’ options are vested.
Arrangements with Executive Officers
Each officer’s right to receive severance payments upon a termination other than for cause is contingent upon the execution of a satisfactory general release of all claims in our favor.
Concurrently with the signing of their employment agreements, the named executive officers executed Confidentiality, Proprietary Information and Inventions Agreements. Under these agreements, such officers must disclose all patent applications that they file during the three-year period after their termination of employment with us. Each officer has also agreed to assist us in any way to enforce proprietary rights related to company inventions, even after termination of their employment. Officers have further agreed, for a period of one year after their termination of employment, not to (i) compete with us in any place where we engage in business or propose to engage in business, (ii) participate in the ownership, operation, management, financing, or control of, or render services to, any company that competes with us is any place where we engage in business or propose to engage in business, (iii) solicit the employment services of any current employee or consultant or any employee who has been terminated for less than 6 months, or (iv) solicit or communicate with any customer of ours.
Limitations of Liability; Indemnification of Directors and Officers
Section 145 of the Delaware General Corporation Law authorizes a corporation’s board of directors to grant, and authorizes a court to award, indemnity to officers, directors, and other corporate agents. As permitted by Delaware law, our amended and restated certificate of incorporation to be effective upon the completion of this offering provides that, to the fullest extent permitted by Delaware law, no director will be personally liable to us or our stockholders for monetary damages for breach of fiduciary duty as a director. Pursuant to Delaware law such protection would be not available for liability:
| • | For any breach of a duty of loyalty to us or our stockholders; |
| • | For acts or omissions not in good faith or that involve intentional misconduct or a knowing violation of law; |
| • | For any transaction from which the director derived an improper benefit; or |
| • | For an act or omission for which the liability of a director is expressly provided by an applicable statute, including unlawful payments of dividends or unlawful stock repurchases or redemptions as provided in Section 174 of the Delaware General Corporation Law. |
94
Table of Contents
Index to Financial Statements
Our amended and restated certificate of incorporation to be effective upon the completion of this offering also provides that if Delaware law is amended after the approval by our stockholders of the amended and restated certificate of incorporation to authorize corporate action further eliminating or limiting the personal liability of directors, then the liability of our directors will be eliminated or limited to the fullest extent permitted by Delaware law.
Our amended and restated certificate of incorporation and amended and restated bylaws to be effective upon the completion of this offering further provide that we must indemnify our directors and officers to the fullest extent permitted by Delaware law. The amended and restated certificate of incorporation and bylaws also authorize us to indemnify any of our employees or agents and permit us to secure insurance on behalf of any officer, director, employee or agent for any liability arising out of his or her action in that capacity, whether or not Delaware law would otherwise permit indemnification.
In addition, our amended and restated bylaws to be effective upon the completion of this offering provide that we are required to advance expenses to our directors and officers as incurred in connection with legal proceedings against them for which they may be indemnified and that the rights conferred in the amended and restated bylaws are not exclusive.
We have entered into indemnification agreements with each of our directors and executive officers. These agreements, among other things, require us to indemnify each director and officer to the fullest extent permitted by Delaware law and our amended and restated certificate of incorporation and bylaws to be effective upon the completion of this offering for expenses such as, among other things, attorneys’ fees, judgments, fines and settlement amounts incurred by the director or executive officer in any action or proceeding, including any action by or in our right, arising out of the person’s services as our director or executive officer or as the director or executive officer of any subsidiary of ours or any other company or enterprise to which the person provides services at our request. We also maintain directors’ and officers’ liability insurance.
The SEC has taken the position that personal liability of directors for violation of the federal securities laws cannot be limited and that indemnification by us for any such violation is unenforceable. The limitation of liability and indemnification provisions in our amended and restated certificate of incorporation and bylaws to be effective upon the completion of this offering may discourage stockholders from bringing a lawsuit against our directors and officers for breach of their fiduciary duty. They may also reduce the likelihood of derivative litigation against our directors and officers, even though an action, if successful, might benefit us and other stockholders. Further, a stockholder’s investment may be adversely affected to the extent that we pay the costs of settlement and damage awards against directors and officers as required by these indemnification provisions.
At present, there is no pending litigation or proceeding involving any of our directors, officers or employees for which indemnification is sought, and we are not aware of any threatened litigation that may result in claims for indemnification. We believe that our amended and restated certificate of incorporation and bylaw provisions to be effective upon the completion of this offering and indemnification agreements are necessary to attract and retain qualified persons as directors and executive officers.
Benefit Plans
2011 Equity Plan
Our 2011 Equity Plan was approved by our board of directors in 2011 and will be effective upon its approval by our stockholders, which we expect to occur prior to the closing of this offering. It is intended to make available incentives that will assist us to attract, retain and motivate employees, including officers, consultants and directors. We may provide these incentives through the grant of stock options, stock appreciation rights, restricted stock, restricted stock units, performance shares and units, and other cash-based or stock-based awards.
95
Table of Contents
Index to Financial Statements
A total of shares of our common stock will be initially authorized and reserved for issuance under the 2011 Plan. This reserve will automatically increase on January 1, 2012 and each subsequent anniversary through 2021, by an amount equal to the smaller of (a) 3.0% of the number of shares of common stock issued and outstanding on the immediately preceding December 31, or (b) a lesser amount determined by the board. This reserve will also be increased to include any shares issuable upon exercise of options granted under our 2000 Plan that expire or become unexercised without having been exercised in full.
Appropriate adjustments will be made in the number of authorized shares and other numerical limits in the 2011 Equity Plan and in outstanding awards to prevent dilution or enlargement of participants’ rights in the event of a stock split or other change in our capital structure. Shares subject to awards which expire or are cancelled or forfeited will again become available for issuance under the 2011 Equity Plan. The shares available will not be reduced by awards settled in cash or by shares withheld to satisfy tax withholding obligations. Only the net number of shares issued upon the exercise of stock appreciation rights or options exercised by means of a net exercise or by tender of previously owned shares will be deducted from the shares available under the 2011 Equity Plan.
The 2011 Equity Plan will be generally administered by the compensation committee of our board of directors. Subject to the provisions of the 2011 Equity Plan, the compensation committee will determine in its discretion the persons to whom and the times at which awards are granted, the sizes of such awards, and all of their terms and conditions. The compensation committee will have the authority to construe and interpret the terms of the 2011 Equity Plan and awards granted under it. The 2011 Equity Plan provides, subject to certain limitations, for indemnification by us of any director, officer or employee against all reasonable expenses, including attorneys’ fees, incurred in connection with any legal action arising from such person’s action or failure to act in administering the 2011 Equity Plan.
The 2011 Equity Plan will authorize the compensation committee, without further stockholder approval, to provide for the cancellation of stock options or stock appreciation rights with exercise prices in excess of the fair market value of the underlying shares of common stock in exchange for new options or other equity awards with exercise prices equal to the fair market value of the underlying common stock or a cash payment.
Awards may be granted under the 2011 Equity Plan to our employees, including officers, directors, or consultants or those of any present or future parent or subsidiary corporation or other affiliated entity. All awards will be evidenced by a written agreement between us and the holder of the award and may include any of the following:
| • | Stock options. We may grant nonstatutory stock options or incentive stock options (as described in Section 422 of the Internal Revenue Code), each of which gives its holder the right, during a specified term (not exceeding 10 years) and subject to any specified vesting or other conditions, to purchase a number of shares of our common stock at an exercise price per share determined by the administrator, which may not be less than the fair market value of a share of our common stock on the date of grant. |
| • | Stock appreciation rights. A stock appreciation right gives its holder the right, during a specified term (not exceeding 10 years) and subject to any specified vesting or other conditions, to receive the appreciation in the fair market value of our common stock between the date of grant of the award and the date of its exercise. We may pay the appreciation in shares of our common stock or in cash. |
| • | Restricted stock. The administrator may grant restricted stock awards either as a bonus or as a purchase right at such price as the administrator determines. Shares of restricted stock remain subject to forfeiture until vested, based on such terms and conditions as the administrator specifies. Holders of restricted stock will have the right to vote the shares and to receive any dividends paid, except that the dividends may be subject to the same vesting conditions as the related shares. |
| • | Restricted stock units. Restricted stock units represent rights to receive shares of our common stock (or their value in cash) at a future date without payment of a purchase price, subject to vesting or other conditions |
96
Table of Contents
Index to Financial Statements
| specified by the administrator. Holders of restricted stock units have no voting rights or rights to receive cash dividends unless and until shares of common stock are issued in settlement of such awards. However, the administrator may grant restricted stock units that entitle their holders to dividend equivalent rights. |
| • | Performance shares and performance units. Performance shares and performance units are awards that will result in a payment to their holder only if specified performance goals are achieved during a specified performance period. Performance share awards are rights denominated in shares of our common stock, while performance unit awards are rights denominated in dollars. The administrator establishes the applicable performance goals based on one or more measures of business performance enumerated in the 2011 Equity Plan, such as revenue, gross margin, net income or total stockholder return. To the extent earned, performance share and unit awards may be settled in cash or in shares of our common stock. Holders of performance shares or performance units have no voting rights or rights to receive cash dividends unless and until shares of common stock are issued in settlement of such awards. |
| • | Cash-based awards and other stock-based awards. The administrator may grant cash-based awards that specify a monetary payment or range of payments or other stock-based awards that specify a number or range of shares or units that, in either case, are subject to vesting or other conditions specified by the administrator. Settlement of these awards may be in cash or shares of our common stock, as determined by the administrator. Their holder will have no voting rights or right to receive cash dividends unless and until shares of our common stock are issued pursuant to the award. The administrator may grant dividend equivalent rights with respect to other stock-based awards. |
In the event of a change in control as described in the 2011 Equity Plan, the acquiring or successor entity may assume or continue all or any awards outstanding under the 2011 Equity Plan or substitute substantially equivalent awards. Any awards which are not assumed or continued in connection with a change in control or are not exercised or settled prior to the change in control will terminate effective as of the time of the change in control. The compensation committee may provide for the acceleration of vesting of any or all outstanding awards upon such terms and to such extent as it determines, except that the vesting of all awards held by members of the board of directors who are not employees will automatically be accelerated in full. The 2011 Equity Plan will also authorize the compensation committee, in its discretion and without the consent of any participant, to cancel each or any outstanding award denominated in shares upon a change in control in exchange for a payment to the participant with respect to each share subject to the cancelled award of an amount equal to the excess of the consideration to be paid per share of common stock in the change in control transaction over the exercise price per share, if any, under the award.
The 2011 Equity Plan will continue in effect until it is terminated by the administrator, provided, however, that all awards will be granted, if at all, within 10 years of its effective date. The administrator may amend, suspend or terminate the 2011 Equity Plan at any time, provided that without stockholder approval, the plan cannot be amended to increase the number of shares authorized, change the class of persons eligible to receive incentive stock options, or effect any other change that would require stockholder approval under any applicable law or listing rule.
2000 Stock Plan
Our 2000 Stock Plan was adopted by our board of directors and approved by our stockholders on July 24, 2000. Our 2000 Stock Plan provides for the grant of incentive stock options, nonstatutory stock options, and restricted stock to our employees, directors, and consultants and other independent advisors who provide services to us. As of April 2, 2011, options to purchase 115,146,802 shares of common stock were outstanding and 7,740,054 shares of common stock were reserved for future grant under this plan.
We will not grant any additional awards under our 2000 Stock Plan following this offering. Instead, we will grant equity awards under our 2011 Equity Plan. However, following this offering, our 2000 Stock Plan will continue to govern the terms and conditions of all outstanding equity awards granted under the 2000 Stock Plan.
97
Table of Contents
Index to Financial Statements
The standard form of option agreement under the 2000 Stock Plan provides that options will vest 25% on the first anniversary of the vesting commencement date with the remainder vesting ratably over the next 36 months, subject to continued service through each applicable date. Under our 2000 Stock Plan, our board of directors, or its designated committee, has the authority to grant options with early exercise rights, subject to our repurchase right that lapses as the shares vest on the original vesting schedule, and to provide for accelerated vesting. In the event of a change in control, if the options are (i) not assumed by the successor corporation or (ii) are not to be replaced with a cash incentive program which preserves the spread existing on the unvested option shares at the time of the transaction, then the options will become 100% vested. If the options are assumed by the successor corporation, and the options are less than 50% vested, the number of unvested options which will become fully vested will be the lesser of (i) the number of options required to give the optionholder a fully vested interest in 50% of the total options held at the time of the change in control, or (ii) the number of options that would have vested had the optionholder continued in the company’s service for an additional twelve months following the date of the change in control. If the optionholder is terminated within one year following the change in control, then the options will become 100% vested and the optionholder will have one year to exercise its options.
The standard form of stock issuance agreement under the 2000 Stock Plan provides that restricted stock will vest 25% on the first anniversary of the vesting commencement date with the remainder vesting ratably over the next 36 months, subject to continued service through each applicable date. Shares of restricted stock that do not vest are subject to our right of repurchase or forfeiture. In the event of a change in control, if the repurchase right is not assumed by the successor corporation, then the repurchase right lapses and the restricted stock is treated as 100% vested.
Our 2000 Stock Plan provides that our board of directors, or its designated committee, may equitably and proportionally adjust or substitute outstanding options upon certain events, including, without limitation, changes in our capitalization through stock splits, recapitalizations, mergers or consolidations. Our 2000 Stock Plan restricts the transfer of shares of our common stock issued pursuant to an award for 180 days following this offering.
401(k) Plan
We maintain a 401(k) retirement plan which is intended to be a tax qualified defined contribution plan under Section 401(k) of the Internal Revenue Code. In general, all full-time employees are eligible to participate in the 401(k) plan on the first day of the month following employment. The 401(k) plan includes a salary deferral arrangement pursuant to which participants may elect to reduce their current compensation by up to the statutorily prescribed limit, equal to $16,500 in 2010 if you are under 50 years of age, and $22,000 if you are 50 years of age or older, and have the amount of the reduction contributed to the 401(k) plan. We match 100% of employee contributions up to 3% of total employee compensation plus 50% of the next 2% of total employee compensation, for a total of a possible 4% match if the employee contributes 5%.
98
Table of Contents
Index to Financial Statements
CERTAIN RELATIONSHIPS AND RELATED PARTY TRANSACTIONS
Since December 30, 2007, there has not been, nor is there currently proposed, any transaction or series of similar transactions to which we were or are a party in which the amount involved exceeded or exceeds $120,000 and in which any of our directors, executive officers, holders of more than 5% of any class of our voting securities, or any member of the immediate family of any of the foregoing persons, had or will have a direct or indirect material interest, other than compensation arrangements with directors and executive officers, which are described where required in the section titled “Management,” and the transactions described below.
Option Exercises
Since December 30, 2007, the following executive officers, directors, and holders of more than 5% of any class of our voting securities exercised options held by them:
| Exercise Date |
Optionee | Exercise Price | Number of Options Shares Exercised |
Number of Common Shares Issued |
||||||||||
| 5/18/2010 |
John McAlpin | $ | 0.05 | 1,000,000 | 1,000,000 | |||||||||
Warrant Exercises
Since December 30, 2007, the following executive officers, directors, and holders of more than 5% of any class of our voting securities exercised warrants held by them:
| Exercise Date |
Warrant Holder |
Exercise Price |
Number of Warrant Shares Exercised |
Number of Preferred Shares Issued |
||||||||||
| 12/10/2010 |
Austin Ventures VII, L.P. | $ | 0.001 | 1,793,321 | 1,793,321 | |||||||||
| 12/10/2010 |
StarVest Partners, L.P. | $ | 0.001 | 1,793,321 | 1,793,321 | |||||||||
| 03/03/2011 |
Austin Ventures VII, L.P. (1) | $ | 0.12442 | 116,953,872 | 116,953,872 | |||||||||
| 03/03/2011 |
AV Labs, L.P. (2) | $ | 0.12442 | 40,841,033 | 40,841,033 | |||||||||
| 03/03/2011 |
Philip S. Siegel (3) | $ | 0.12442 | 232,050 | 232,050 | |||||||||
| 03/03/2011 |
StarVest Partners, L.P (4) | $ | 0.12442 | 27,846,160 | 27,846,160 | |||||||||
| (1) | The holder exercised these warrants by tendering 101,104 shares of our series F preferred stock and accrued dividends thereon, which had an aggregate fair value equal to the exercise price. |
| (2) | The holder exercised these warrants by tendering 35,306 shares of our series F preferred stock and accrued dividends thereon, which had an aggregate fair value equal to the exercise price. |
| (3) | The holder exercised these warrants by tendering 201 shares of our series F preferred stock and accrued dividends thereon, which had an aggregate fair value equal to the exercise price. |
| (4) | The holder exercised these warrants by tendering 24,072 shares of our series F preferred stock and accrued dividends thereon, which had an aggregate fair value equal to the exercise price. |
Stock Option Grants
Certain stock option grants to our executive officers in fiscal 2010 and related option grant policies are more fully described in this prospectus under the section titled “Management—Compensation Discussion and Analysis.” We have granted the following options to certain executive officers since December 30, 2007:
In February 2008, we granted David M. Plemons an option to purchase 4,000,000 shares of our common stock at an exercise price of $0.09 per share.
99
Table of Contents
Index to Financial Statements
In February 2009, we granted Michael A. Desmarais an option to purchase 1,000,000 shares of our common stock at an exercise price of $0.12 per share.
In February 2009, we granted Paul R. Forand an option to purchase 1,000,000 shares of our common stock at an exercise price of $0.12 per share.
In February 2010, we granted Todd A. Everett an option to purchase 3,500,000 shares of our common stock at an exercise price of $0.14 per share.
In February 2011, we granted David T. Marinkovich an option to purchase 3,000,000 shares of our common stock at an exercise price of $0.21 per share.
Employment Agreements
We have entered into employment agreements or offer letters with each of our named executive officers. See the sections titled “Management—Employment Agreements” and “Executive Compensation—Potential Payments upon Termination or Change in Control” for a description of these agreements.
On December 21, 2010, we entered into an employment agreement (in the form of an employment offer letter) with David T. Marinkovich, our Vice President of Marketing and Field Sales. Under the agreement, Mr. Marinkovich’s base salary is $235,000 per year with a target bonus of 50% of base salary annually. The agreement provides for an option to purchase up to 3,000,000 shares of stock. These options vest with respect to 25% of the shares on January 3, 2012 and 1/36th of the shares thereafter in equal monthly installments, subject to Mr. Marinkovich’s continued service to us. It also provides a relocation package for Mr. Marinkovich’s move to Austin, Texas in the amount of $50,000.
On March 1, 2011, we entered into a separation agreement and full release of claims with David M. Plemons, our former Vice President of Customer Relations. Under the terms of this agreement, Mr. Plemons agreed to discharge us from any and all claims and liabilities. He further agreed never to institute proceedings against us arising out of his employment. In accordance with the terms of his employment agreement, we agreed to pay Mr. Plemons six months’ base salary continuation, which will amount to $108,200, subject to tax deductions and withholdings. Mr. Plemons’ right to receive these benefits will cease if he breaches any of his obligations under the proprietary information and inventions agreement he signed when he joined us.
Board Offer Letter
On March 29, 2011, we entered into an offer letter with Stephen M. Mattessich pursuant to which we agreed to add Mr. Mattessich to our board of directors. Under the terms of the offer letter, Mr. Mattessich will be paid $40,000 per year, of which $5,000 is paid for chairing the audit committee of our board of directors. In addition, pursuant to the offer letter we agreed to grant Mr. Mattessich an option to purchase the number of shares of our common stock equal to $150,000 divided by the anticipated offering price of a share of common stock in this offering as determined by our board of directors on the date of grant. This option will vest with respect to one fourth of the shares subject to the option on April 4, 2012 and the remaining shares will vest in 36 equal monthly installments thereafter, subject to Mr. Mattessich’s continued service to us on each such vesting date.
Indemnification Agreements
We have entered into indemnification agreements with each of our directors and executive officers. These agreements, among other things, require us to indemnify each director and executive officer to the fullest extent permitted by Delaware law, including indemnification of expenses such as attorneys’ fees, judgments, fines and settlement amounts incurred by the director or executive officer in any action or proceeding, including any action or proceeding by or in right of us, arising out of the person’s services as a director or executive officer. These indemnification agreements also entitle Austin Ventures VII, L.P., AV Labs, L.P. and StarVest Partners, L.P., the venture capital funds that certain of our directors are associated with, to the same indemnification
100
Table of Contents
Index to Financial Statements
rights as the director associated with such venture fund if the venture capital fund’s involvement in any action or proceeding is directly or indirectly related to the director’s service to us as a director. See the section titled “Management—Limitations of Liability; Indemnification of Directors and Officers.”
Registration Rights
We have entered into an investors’ rights agreement with certain of our stockholders, pursuant to which these and other stockholders have registration rights with respect to their shares of common stock in certain circumstances in connection with registrations of securities by us or registrations demanded in accordance with their contractual registration rights by holders of prescribed minimum percentages of the outstanding shares which hold such rights. The total amount of outstanding shares with registration rights is 588,506,269.
The following table summarizes the number of shares subject to registration rights held by our directors and holders of more than 5% of any class of our voting securities, or affiliates of such persons or entities. None of our executive officers hold shares subject to registration rights.
| Stockholder |
Shares Subject to Registration Rights |
|||
| Austin Ventures VII, L.P. (1) |
353,022,859 | |||
| AV Labs, L.P. (1)(3) |
104,040,202 | |||
| StarVest Partners, L.P. (2) |
104,858,479 | |||
| Philip S. Siegel |
3,358,687 | |||
| (1) | Kenneth P. DeAngelis, one of our directors, may be deemed to have voting or dispositive power over Austin Ventures VII, L.P. and AV Labs, L.P. |
| (2) | Laura B. Sachar, one of our directors, may be deemed to have voting or dispositive power over StarVest Partners, L.P. Shares subject to registration rights include 200,932 shares held of record by StarVest Management, Inc. as nominee for StarVest Partners, L.P. Advisory Council Co-Investment Fund. |
| (3) | Philip S. Siegel, one of our directors, may be deemed to have voting or dispositive power over AV Labs, L.P. |
For more information regarding these agreements, please refer to the section titled “Description of Capital Stock—Registration Rights.” This is not a complete description of the registration rights contained in the investors’ rights agreement and is qualified by the full text of the investors’ rights agreement, filed as an exhibit to the registration statement of which this prospectus is a part.
Corporate Opportunity Waiver
Under the “corporate opportunity doctrine,” in certain circumstances our directors, officers and stockholders may have a duty to present to us matters that come before them that are within our line of business or would be deemed of interest to us. Pursuant to our amended and restated certificate of incorporation to be effective upon the completion of this offering, we have renounced any such duty with respect to our non-employee directors except where such matters are presented to them solely in their capacities as our directors. A company is permitted to renounce or waive its right to corporate opportunities under Section 122(17) of Delaware General Corporation Law. An example of when the corporate opportunity waiver could be applicable is in the event that a non-employee director was approached by a company that would like to be acquired, and which is engaged in a line of business that relates to our business. Under Delaware law, a director may, under certain circumstances, be obligated to present this kind of opportunity to the corporation for which they serve as a director. With the waiver set forth in our amended and restated certificate of incorporation to be effective upon the completion of this offering, we have eliminated uncertainty about this kind of question, and our non-employee directors would not have any obligation to present any such opportunities to us. Our non-employee directors would be free to pursue any such opportunities themselves, or to present them to another company, without notifying us or giving us any ability to participate.
101
Table of Contents
Index to Financial Statements
Policies and Procedures for Related Party Transactions
We plan to adopt a formal policy that our executive officers, directors, and principal stockholders, including their immediate family members and affiliates, will not be permitted to enter into a related party transaction with us without the prior consent of our audit committee, or other independent members of our board of directors in the case it is inappropriate for our audit committee to review such transaction due to a conflict of interest. Any request for us to enter into a transaction with an executive officer, director, principal stockholder, or any of such persons’ immediate family members or affiliates, in which the amount involved exceeds $120,000 must first be presented to our audit committee for review, consideration and approval. All of our directors, executive officers and employees will be required to report to our audit committee any such related party transaction. In approving or rejecting the proposed agreement, our audit committee shall consider the relevant facts and circumstances available and deemed relevant to the audit committee, including, but not limited to the risks, costs and benefits to us, the terms of the transaction, the availability of other sources for comparable services or products, and, if applicable, the impact on a director’s independence. Our audit committee shall approve only those agreements that, in light of known circumstances, are in, or are not inconsistent with, our best interests, as our audit committee determines in the good faith exercise of its discretion. All of the transactions described above were entered into prior to the adoption of this policy. Upon completion of this offering, we will post this related party transaction policy on our website at www.newgistics.com. The inclusion of our website address in this prospectus does not include or incorporate by reference the information on our website into this prospectus.
102
Table of Contents
Index to Financial Statements
PRINCIPAL AND SELLING STOCKHOLDERS
The following table and footnotes set forth information with respect to the beneficial ownership of our common stock as of May 13, 2011, subject to certain assumptions set forth in the footnote and as adjusted to reflect the sale of the shares of common stock offered in the public offering under this prospectus for:
| • | Each stockholder, or group of affiliated stockholders, who we know beneficially owns more than 5% of the outstanding shares of our common stock; |
| • | Each of our named executive officers; |
| • | Each of our current directors; |
| • | All of our current directors and current executive officers as a group; and |
| • | Each of the selling stockholders. |
Beneficial ownership of shares is determined under the rules of the SEC and generally includes any shares over which a person exercises sole or shared voting or investment power. Except as indicated by footnote, and subject to applicable community property laws, we believe each person identified in the table possesses sole voting and investment power with respect to all shares of common stock beneficially owned by them. Shares of common stock subject to options and warrants currently exercisable or exercisable within 60 days of May 13, 2011, are deemed to be outstanding for calculating the number and percentage of outstanding shares of the person holding such options and warrants, but are not deemed to be outstanding for calculating the percentage ownership of any other person.
Applicable percentage ownership in the following table is based on 624,960,672 shares of common stock outstanding as of May 13, 2011 after giving effect to the conversion of our preferred stock, other than our series F preferred stock, into shares of common stock, and shares of common stock outstanding after completion of this offering.
Unless otherwise indicated and subject to applicable community property laws, to our knowledge, each stockholder named in the following table possesses sole voting and investment power over the shares listed, except for those jointly owned with that person’s spouse. Unless otherwise noted below, the address of each person listed on the table is c/o Newgistics, Inc., 2700 Via Fortuna, Suite 300, Austin, Texas 78746. Beneficial ownership representing less than 1% is denoted with an asterisk (*).
| Name and Address of Beneficial |
Shares Beneficially Owned Prior to the Offering |
Number of Shares Offered |
Shares Beneficially Owned After the Offering |
Number of Shares to be Sold if Underwriters’ Option is Exercised in Full |
Shares Beneficially Owned After the Offering if Underwriters’ Option is Exercised in Full |
|||||||||||||||||||||||||||
| Shares | Percentage | Shares | Percentage | Shares | Percentage | |||||||||||||||||||||||||||
| 5% Stockholders: |
||||||||||||||||||||||||||||||||
| Austin Ventures VII, L.P. (1) |
353,022,859 | 56.5 | % | |||||||||||||||||||||||||||||
| AV Labs, L.P. (2) |
120,040,202 | 19.2 | % | |||||||||||||||||||||||||||||
| StarVest Partners, L.P. (3) |
104,858,479 | 16.8 | % | |||||||||||||||||||||||||||||
| William J. Razzouk (4) |
38,400,000 | 5.8 | % | |||||||||||||||||||||||||||||
| Named Executive Officers and Directors: |
||||||||||||||||||||||||||||||||
| William J. Razzouk (4) |
38,400,000 | 5.8 | % | |||||||||||||||||||||||||||||
| Michael J. Twomey (5) |
8,155,994 | 1.3 | % | |||||||||||||||||||||||||||||
| Todd A. Everett (6) |
2,128,570 | * | ||||||||||||||||||||||||||||||
| Kenneth W. Johnson (7) |
9,033,325 | 1.4 | % | |||||||||||||||||||||||||||||
| Alva J. Phillips (8) |
6,873,327 | 1.1 | % | |||||||||||||||||||||||||||||
| Laura B. Sachar (9) |
104,858,479 | 16.8 | % | |||||||||||||||||||||||||||||
| Philip S. Siegel (10) |
129,686,389 | 20.7 | % | |||||||||||||||||||||||||||||
| Kenneth P. DeAngelis (11) |
473,063,061 | 75.7 | % | |||||||||||||||||||||||||||||
| Stephen M. Mattessich (12) |
0 | * | ||||||||||||||||||||||||||||||
| All executive officers and directors as a group (12 persons) (13) |
662,158,943 | 94.6 | % | |||||||||||||||||||||||||||||
| Other Selling Stockholders: |
||||||||||||||||||||||||||||||||
103
Table of Contents
Index to Financial Statements
| (1) | 1,793,321 of these shares were acquired upon the exercise of a warrant on December 10, 2010 at an exercise price of $0.001 per share, and 116,953,872 of these shares were acquired upon the exercise of a warrant on March 3, 2011 at an exercise price of $0.12442 per share. Shares are held directly by Austin Ventures VII, LP, or AV VII. AV Partners VII, LP, or AVP VII, is the general partner of AV VII and may be deemed to have sole voting and dispositive power over the shares held by AV VII. Joseph C. Aragona, Kenneth P. DeAngelis and John D. Thornton are the general partners of AVP VII and may be deemed to share voting and dispositive power over the shares held by AV VII. Such persons and entities disclaim beneficial ownership of shares held by AV VII. The address for each of AV VII, AVP VII, and the general partners of AVP VII is 300 West 6th Street, Suite 2300, Austin, Texas 78701. For a discussion of our material relationships with AV VII within the past three years, see the section titled “Certain Relationships and Related Party Transactions.” Does not include 120,040,202 shares owned by AV Labs, L.P., or AV Labs. |
| (2) | 40,841,033 of these shares were acquired upon the exercise of a warrant on March 3, 2011 at an exercise price of $0.12442 per share. Shares are held directly by AV Labs. AVL Partners I, LP, or AVL I, is the general partner of AV Labs and may be deemed to have sole voting and dispositive power over the shares held by AV Labs. AVP VII is the general partner of AVL I and may, with the AVL I investment committee, be deemed to have shared voting and dispositive power over the shares held by AV Labs. Joseph C. Aragona, Kenneth P. DeAngelis, John D. Thornton and Philip S. Siegel are the general partners of AVP VII or AVL I and/or members of the investment committee and may be deemed to share voting and dispositive power over the shares held by AV Labs. Such persons and entities disclaim beneficial ownership of shares held by AV Labs. The address for each of AV Labs, AVP VII and the general partners of AVP VII is 300 West 6th Street, Suite 2300, Austin, Texas 78701. For a discussion of our material relationships with AV Labs within the past three years, see the section titled “Certain Relationships and Related Party Transactions.” Does not include 353,022,859 shares owned by AV VII. |
| (3) | 1,793,321 of these shares were acquired upon the exercise of a warrant on December 10, 2010 at an exercise price of $0.001 per share, and 27,846,160 of these shares were acquired upon the exercise of a warrant on March 3, 2011 at an exercise price of $0.12442 per share. Deborah Farrington, Jeanne Sullivan, and Laura Sachar are members of StarVest Associates LLC, which is the General Partner of StarVest Partners, L.P. and may be deemed to share voting and dispositive power over the shares held by StarVest Partners, L.P. Ms. Farrington, Ms. Sullivan, and Ms. Sachar disclaim beneficial ownership of shares held by StarVest Partners, L.P. This number also includes 200,932 shares held of record by StarVest Management, Inc. as nominee for StarVest Partners, LP Advisory Council Co-Investment Fund, or SV Management. Ms. Farrington, Ms. Sullivan, and Ms. Sachar are stockholders of SV Management and may be deemed to share voting and dispositive power over the shares held by SV Management. Ms. Farrington, Ms. Sullivan, and Ms. Sachar disclaim beneficial ownership of shares held by SV Management. The address for each of StarVest Partners, L.P., SV Management, Ms. Farrington, Ms. Sullivan, and Ms. Sachar is 750 Lexington Avenue, New York, NY 10022. For a discussion of our material relationships with StarVest Partners, L.P. within the past three years, see the section titled “Certain Relationships and Related Party Transactions.” |
| (4) | Represents shares issuable upon the exercise of options fully vested and exercisable within 60 days of May 13, 2011. |
| (5) | Represents shares issuable upon the exercise of options fully vested and exercisable within 60 days of May 13, 2011. |
| (6) | Represents shares issuable upon the exercise of options exercisable within 60 days of May 13, 2011, of which 1,922,916 will be fully vested. On February 23, 2010 we granted Mr. Everett 3,500,000 options, 1,428,570 of which are exercisable within 60 days of May 13, 2011 and 1,239,583 of which will be vested within 60 days of May 13, 2011. |
| (7) | Represents shares issuable upon the exercise of options fully vested and exercisable within 60 days of May 13, 2011. |
| (8) | Represents shares issuable upon the exercise of options fully vested and exercisable within 60 days of May 13, 2011. |
| (9) | Represents 104,657,547 shares held by StarVest Partners L.P. and 200,932 shares held by SV Management. Laura Sachar is a managing member of StarVest Associates LLC, which is the General Partner of StarVest Partners, L.P., and a stockholder of SV Management, and may be deemed to share voting and dispositive power over the shares held by both StarVest Partners, L.P. and SV Management. Ms. Sachar disclaims beneficial ownership of shares held by both StarVest Partners, L.P. and SV Management. |
| (10) | 232,050 of these shares were acquired upon the exercise of a warrant on March 3, 2011 at an exercise price of $0.12442 per share. Also includes 120,040,202 shares held by AV Labs as well as 400,000 shares issuable upon the exercise of options held directly by Mr. Siegel and exercisable within 60 days of May 13, 2011. Mr. Siegel may be deemed to share voting and dispositive power over the shares held by AV Labs. Mr. Siegel disclaims beneficial ownership of shares held by AV Labs. The address for Mr. Siegel is 300 West 6th Street, Suite 2300, Austin, Texas 78701. |
| (11) | Represents 353,022,859 shares held by AV VII and 120,040,202 shares held by AV Labs. Mr. DeAngelis is a general partner of AVP VII, which is the general partner of both AV VII and AVL I. AVL I is the general partner of AV Labs. Accordingly, Mr. DeAngelis may be deemed to share voting and dispositive power over the shares held by AV VII and the shares held by AV Labs. Mr. DeAngelis disclaims beneficial ownership of shares held by both AV VII and AV Labs. |
| (12) | On March 29, 2011, we entered into an offer letter with Mr. Mattessich pursuant to which we agreed, among other things, to grant Mr. Mattessich an option to purchase the number of shares of common stock equal to $150,000 divided by the anticipated offering price of a share of common stock in this offering as determined by our board of directors on the date of grant. As of the date of this registration statement, the offering price of a share of common stock in this offering has not yet been determined, and as such, the number of shares for which his option will be exercisable is not yet known. |
| (13) | Includes 74,991,216 shares issuable upon the exercise of options exercisable within 60 days of May 13, 2011, of which 74,035,562 will be fully vested. |
104
Table of Contents
Index to Financial Statements
The following is a summary of our capital stock and certain provisions of our amended and restated certificate of incorporation and bylaws to be effective upon the completion of this offering. You should refer to our amended and restated certificate of incorporation and amended and restated bylaws, copies of which will be filed as exhibits to the registration statement of which this prospectus is a part.
Immediately following the closing of this offering, our authorized capital stock will consist of shares of common stock, $0.001 par value, and shares of undesignated preferred stock, $0.001 par value.
Common stock
As of April 2, 2011, there were 624,292,507 shares of common stock outstanding that were held of record by approximately 110 stockholders after giving effect to the conversion of our preferred stock into shares of common stock. There will be shares of common stock outstanding (assuming no exercise of the underwriters’ over-allotment option and no exercise of outstanding options) after giving effect to the sale of the shares of common stock offered by this prospectus.
The holders of common stock are entitled to one vote per share on all matters submitted to a vote of our stockholders and do not have cumulative voting rights. Accordingly, holders of a majority of the shares of common stock entitled to vote in any election of directors may elect all of the directors standing for election. Subject to preferences that may be applicable to any preferred stock outstanding at the time, the holders of outstanding shares of common stock are entitled to receive ratably any dividends declared by our board of directors out of assets legally available. See the section titled “Dividend Policy.” Upon our liquidation, dissolution or winding up, holders of our common stock are entitled to share ratably in all assets remaining after payment of liabilities and the liquidation preference of any then outstanding shares of preferred stock. Holders of common stock have no preemptive or conversion rights or other subscription rights. There are no redemption or sinking fund provisions applicable to the common stock.
Preferred stock
Upon the closing of this offering, all outstanding shares of our series A, AA, B, B-1, BB-1, C, CC, D and E preferred stock will be converted into shares of common stock and all our outstanding shares of series F preferred stock will be redeemed with the proceeds from this offering. Pursuant to our amended and restated certificate of incorporation, our board of directors will have the authority, without further action by the stockholders, to issue from time to time up to shares of preferred stock, in one or more series. Our board of directors will determine the rights, preferences, privileges and restrictions of the preferred stock, including dividend rights, conversion rights, voting rights, terms of redemption, liquidation preferences, sinking fund terms and the number of shares constituting any series or the designation of any series, any or all of which may be greater than or senior to the rights of the common stock. The issuance of preferred stock could adversely affect the voting power of holders of common stock and reduce the likelihood that such holders will receive dividend payments and payments upon liquidation, and the likelihood that holders of preferred stock will receive dividend payments and payments upon liquidation may have the effect of delaying, deterring or preventing a change in control, which could depress the market price of our common stock. We have no current plan to issue any shares of preferred stock.
105
Table of Contents
Index to Financial Statements
Warrants
As of April 2, 2011, we had outstanding warrants to purchase:
| • | 10,000 shares of our series A preferred stock at an exercise price of $0.50 per share, which warrant will remain outstanding after this offering through May 15, 2017. The preferred stock for which this warrant can be exercised is convertible into 24,606 shares of our common stock. If this warrant in not exercised prior to the completion of this offering, it will become exercisable for 24,606 shares of our common stock. The warrant shall expire if it has not been exercised prior to the termination date, so long as we give notice of the holder’s right to exercise not less than 30 days before the expiration date. |
| • | 294,018 shares of our series B-1 preferred stock at an exercise price of $0.1488 per share, which warrant will remain outstanding after this offering through August 31, 2017. The preferred stock for which this warrant can be exercised is convertible into 349,440 shares of our common stock. If this warrant in not exercised prior to the completion of this offering, it will become exercisable for 349,440 shares of our common stock. If the warrant has not been exercised prior to the termination date, then the warrant shall be deemed to have been automatically exercised by “cashless” conversion pursuant to the terms of the warrant. |
| • | Eight warrants to purchase an aggregate of 72,477 shares of our series E preferred stock at an exercise price of $0.12442 per share, which warrants were exercised on May 12, 2011. The preferred stock for which these warrants were exercised is convertible into 72,477 shares of our common stock. |
| • | 112,522 shares of our series E preferred stock at an exercise price of $0.12442 per share, which warrant will remain outstanding through April 12, 2016. The preferred stock for which this warrant can be exercised is convertible into 112,522 shares of our common stock. If this warrant in not exercised prior to the completion of this offering, it will become exercisable for 112,522 shares of our common stock. If the warrant has not been exercised prior to the termination date, then the warrant shall be deemed to have been automatically exercised by “cashless” conversion pursuant to the terms of the warrant. |
| • | 3,758,621 shares of our series E preferred stock at an exercise price of $0.12442 per share, which warrant will remain outstanding after this offering through March 9, 2019. The preferred stock for which this warrant can be exercised is convertible into 3,758,621 shares of our common stock. If this warrant in not exercised prior to the completion of this offering, it will become exercisable for 3,758,621 shares of our common stock. The warrant shall expire if it has not been exercised prior to the termination date. |
| • | 1,129,240 shares of our series E preferred stock at an exercise price of $0.12442 per share, which warrant will remain outstanding after this offering through December 31, 2019. The preferred stock for which this warrant can be exercised is convertible into 1,129,240 shares of our common stock. If this warrant in not exercised prior to the completion of this offering, it will become exercisable for 1,129,240 shares of our common stock. The warrant shall expire if it has not been exercised prior to the termination date. |
Registration Rights
We have entered into an investors’ rights agreement dated as of September 30, 2002, as amended, with certain holders of our common and preferred stock. Subject to the terms of this agreement, holders of 588,506,269 shares (on an as converted to common stock basis) have piggyback registration rights. Holders of 588,393,747 of these shares (on an as converted to common stock basis) also have short-form registration rights. Holders of 588,044,307 of these shares (on an as converted to common stock basis) have full registration rights, which includes demand registration rights, piggyback registration rights, and short-form registration rights. The following description of the terms of the registration rights agreement is intended as a summary only and is qualified in its entirety by reference to the investors’ rights agreement filed as an exhibit to the registration statement, of which this prospectus forms a part.
106
Table of Contents
Index to Financial Statements
The holders of these registration rights have waived their contractual rights to include shares held by them in this offering and their rights to demand registration of their shares until the expiration of the lock-up period applicable to this offering (see the section titled “Shares Eligible for Future Sale”).
The registration rights described below will terminate, with respect to any particular stockholder, upon the earlier of (i) five years after the completion of this offering, or (ii) for stockholders who own less than 2% of our outstanding stock, any time after this offering in which all registrable securities held by the particular stockholder may immediately be sold under Rule 144 during any 90-day period. Each party to the investor’s rights agreement has agreed not to sell or otherwise dispose of any shares of our common stock for a period of 180 days following the effective date of this offering.
Demand Registration Rights
At any time, but subject to certain exceptions, the majority of the holders of then outstanding registrable securities with demand registration rights may demand that we effect a registration under the Securities Act covering the public offering and sale of all or part of the registrable securities held by those stockholders, provided that the holders propose to sell at least 50% of the registrable securities then outstanding. Upon any such demand and as soon as practicable, and in any event within 60 days of receipt of such demand, we must effect the registration of the registrable securities that we have been requested to register, together with all other registrable securities that we may have been requested to register by other stockholders pursuant to the piggyback registration rights described below. Notwithstanding the foregoing, with certain exceptions, we are not obligated to effect a demand registration during the effectiveness of a lock-up agreement entered into in connection with a registration statement pertaining to this offering. In addition, we are not obligated to effect a demand registration within 12 months after the effective date of the first demand registration, or if we have already effected two demand registrations or at the time of the request.
We have the ability to delay the filing of a registration statement, subject to certain restrictions, if the board of directors determines in its good faith judgment that it would be seriously detrimental for such registration statement to be filed and it is therefore essential to defer the filing of such registration statement.
Piggyback Registration Rights
All parties to the investors’ rights agreement have piggyback registration rights. Under these provisions, if at any time after the consummation of this offering, we register any securities for public sale, excluding pursuant to any stockholder-initiated demand registration, these stockholders have the right to include their shares in the registration statement, subject to certain exceptions including a registration related solely to an employee benefit plan. Piggyback registration rights will not apply to this offering.
Short-Form Registration Rights
If we become eligible to file registration statements on Form S-3, the holders of at minimum 25% of the then registrable securities may request in writing that we effect a registration on Form S-3 under the Securities Act, so long as the proposed aggregate offering price of the shares to be registered by the holders requesting registration is at least $1.0 million, subject to certain exceptions.
Additionally, if we become eligible to file registration statements on Form S-3, the holders of the majority of the then outstanding registrable securities issued or issuable upon conversion of our series D preferred stock may request in writing that we effect a registration on Form S-3 under the Securities Act, so long as the proposed aggregate offering price of the shares to be registered by the holders requesting registration is at least $500,000, subject to certain exceptions.
Expenses of Registration
With specified exceptions, we are required to pay all expenses of registration, including the fees and expenses of one legal counsel to the holders, but excluding underwriters’ discounts and commissions.
107
Table of Contents
Index to Financial Statements
Anti-Takeover Provisions Under Our Amended and Restated Certificate of Incorporation and Amended and Restated Bylaws and Delaware Law
Certain provisions of Delaware law, our amended and restated certificate of incorporation and amended and restated bylaws to be effective upon completion of this offering contain provisions that could have the effect of delaying, deferring, or discouraging another party from acquiring control of us. These provisions, which are summarized below, may have the effect of discouraging coercive takeover practices and inadequate takeover bids. These provisions are also designed, in part, to encourage persons seeking to acquire control of us to first negotiate with our board of directors. We believe that the benefits of increased protection of our potential ability to negotiate with an unfriendly or unsolicited acquiror outweigh the disadvantages of discouraging a proposal to acquire us because negotiation of these proposals could result in an improvement of their terms.
Amended and Restated Certificate of Incorporation
Undesignated Preferred Stock. As discussed above, our board of directors has the ability to issue preferred stock with voting or other rights or preferences that could impede the success of any attempt to change control of us. These and other provisions may have the effect of deferring hostile takeovers or delaying changes in control or management of our company.
Limitations on the Ability of Stockholders to Act by Written Consent or Call a Special Meeting. We have provided in our amended and restated certificate of incorporation that our stockholders may not act by written consent. This limit on the ability of our stockholders to act by written consent may lengthen the amount of time required to take stockholder actions. As a result, a holder controlling a majority of our capital stock would not be able to amend our bylaws or remove directors without holding a meeting of our stockholders called in accordance with our bylaws.
In addition, our amended and restated certificate of incorporation and bylaws provide that special meetings of the stockholders may be called only by the chairperson of our board of directors, the chief executive officer, the president or the board of directors. A stockholder may not call a special meeting, which may delay the ability of our stockholders to force consideration of a proposal or for holders controlling a majority of our capital stock to take any action, including the removal of directors.
Requirements for Advance Notification of Stockholder Nominations and Proposals. Our amended and restated bylaws establish advance notice procedures with respect to stockholder proposals and the nomination of candidates for election as directors, other than nominations made by or at the direction of the board of directors or a committee of the board of directors. However, our amended and restated bylaws may have the effect of precluding the conduct of certain business at a meeting if the proper procedures are not followed. These provisions may also discourage or deter a potential acquiror from conducting a solicitation of proxies to elect the acquirer’s own slate of directors or otherwise attempting to obtain control of our company.
Board Vacancies Filled Only by Majority of Directors. Vacancies and newly created seats on our board may be filled only by a majority of the number of then-authorized members of our board of directors. Only our board of directors may determine the number of directors on our board. The inability of stockholders to determine the number of directors or to fill vacancies or newly created seats on our board of directors makes it more difficult to change the composition of our board of directors, but these provisions promote a continuity of existing management.
No Cumulative Voting. The Delaware General Corporation Law provides that stockholders are not entitled to the right to cumulate votes in the election of directors unless our amended and restated certificate of incorporation provides otherwise. Our amended and restated certificate of incorporation and bylaws do not expressly provide for cumulative voting.
Directors Removed Only for Cause. Our amended and restated certificate of incorporation provides for the removal of a director only with cause and by the affirmative vote of the holders of a majority of the shares then entitled to vote at an election of our directors.
108
Table of Contents
Index to Financial Statements
Amendment of Charter Provisions. The amendment of certain of the above provisions in our amended and restated certificate of incorporation and our amended and restated bylaws requires approval by holders of at least two-thirds of our outstanding capital stock entitled to vote generally in the election of directors.
Delaware Anti-Takeover Statute. We are subject to Section 203 of the Delaware General Corporation Law which regulates corporate acquisitions of publicly held companies. This law provides that a specified person who, together with affiliates and associates, owns, or within three years did own, 15% or more of the outstanding voting stock of a publicly held Delaware corporation, or an interested stockholder, may not engage in business combinations with the corporation for a period of three years after the date on which the person became an interested stockholder, unless the business combination or the transaction in which the person became an interested stockholder is approved in advance in a manner prescribed by Delaware law. The law does not include interested stockholders prior to the time our common stock is listed on the NASDAQ Global Select Market. The law defines the term “business combination” to include mergers, asset sales and other transactions in which the interested stockholder receives or could receive a financial benefit on other than a pro rata basis with other stockholders. This provision has an anti-takeover effect with respect to transactions not approved in advance by our board of directors, including discouraging takeover attempts that might result in a premium over the market price for the shares of our market price. With approval of our stockholders, we could amend our amended and restated certificate of incorporation in the future to avoid the restrictions imposed by this anti-takeover law.
The provisions of Delaware law and our amended and restated certificate of incorporation could have the effect of discouraging others from attempting hostile takeovers and, as a consequence, they may also inhibit temporary fluctuations in the market price of our common stock that often result from actual or rumored hostile takeover attempts. These provisions may also have the effect of preventing changes in our management. It is possible that these provisions could make it more difficult to accomplish transactions that stockholders may otherwise deem to be in their best interests.
Transfer Agent and Registrar
The transfer agent and registrar for the common stock is American Stock Transfer & Trust Company, LLC. The transfer agent’s address is 59 Maiden Lane, Plaza Level, New York, New York 10038 and its telephone number is (800) 937-5449.
Listing
We have applied to list our common stock on the NASDAQ Global Select Market under the symbol “NEWG.”
109
Table of Contents
Index to Financial Statements
SHARES ELIGIBLE FOR FUTURE SALE
Prior to this offering, there has been no public market for our common stock. Future sales of substantial amounts of our common stock in the public market could reduce prevailing market prices. Furthermore, since a substantial number of shares will be subject to contractual and legal restrictions on resale as described below, sales of substantial amounts of our common stock in the public market after these restrictions lapse could adversely affect the prevailing market price and our ability to raise equity capital in the future.
Upon completion of this offering, we will have outstanding an aggregate of shares of common stock, assuming no exercise of the underwriters’ over-allotment option and no exercise of outstanding options or warrants. Of these shares, all of the shares sold in this offering will be freely tradable without restriction or further registration under the Securities Act, unless these shares are purchased by affiliates. The remaining shares of common stock held by existing stockholders are restricted securities. Restricted securities may be sold in the public market only if registered or if the transaction qualifies for an exemption from registration described below under Rules 144 or 701 promulgated under the Securities Act.
As a result of the contractual restrictions described below and the provisions of Rules 144 and 701, the restricted shares will be available for sale in the public market as follows:
| • | shares will be eligible for sale upon completion of this offering; |
| • | shares will be eligible for sale upon the expiration of the lock-up agreements, described below, beginning 180 days after the date of this prospectus; |
| • | shares will be eligible for sale upon the exercise of outstanding warrants 180 days after the date of this prospectus; and |
| • | shares will be eligible for sale upon the exercise of vested options 180 days after the date of this prospectus. |
Lock-Up Agreements and Obligations
All of our officers, directors, and stockholders, who together hold % of our outstanding common stock (after giving effect to the sale by them of shares in this offering), have agreed not to offer, sell, contract to sell (including any short sale), pledge, hypothecate, establish an open “put equivalent position,” sell any option or contract to purchase, purchase any option or contract to sell, grant any option, right, or warrant for the sale of, or otherwise encumber, transfer or dispose of, or grant any rights with respect to, directly or indirectly, any shares of our common stock or any securities convertible into shares or exercisable or exchangeable for shares of our common stock, or enter into a transaction which would have the same effect, or enter into any swap, hedge or other arrangement that transfers, in whole or in part, any of the economic consequences of ownership of our common stock, whether any such aforementioned transaction is to be settled by delivery of our common stock or such other securities, in cash or otherwise, or publicly disclose the intention to do so, for a period of at least 180 days after the date of this prospectus, except for bona fide gifts, provided that the shares underlying such derivative securities are held subject to such resale restrictions. Transfers or dispositions can be made sooner only under the conditions described above or with the prior written consent of Stifel, Nicolaus & Company, Incorporated and Piper Jaffray & Co. Stifel, Nicolaus & Company, Incorporated and Piper Jaffray & Co. may release any of the shares subject to these lock-up agreements at any time without notice. However, if Stifel, Nicolaus & Company, Incorporated and Piper Jaffray & Co. release any shares held by an officer, director, or stockholder subject to these lock-up agreements, then all parties to these lock-up agreements shall be released from these restrictions on a pro rata basis based on the same percentage of shares released for such officer, director, or stockholder.
In addition, each grant agreement under our 2000 Stock Plan and warrant issued by us contains restrictions similar to those set forth in the lock-up agreements described above limiting the disposition of securities issuable pursuant to those plans for a period of at least 180 days following the date of this prospectus.
110
Table of Contents
Index to Financial Statements
Rule 144
In general, under Rule 144 as currently in effect, once we have been subject to public company reporting requirements for 90 days, a person (or persons whose shares are aggregated) who is not deemed to have been an affiliate of ours at any time during the three months preceding a sale, and who has beneficially owned restricted securities within the meaning of Rule 144 for at least six months (including any period of consecutive ownership of preceding non-affiliated holders) would be entitled to sell those shares, subject only to the availability of current public information about us. A non-affiliated person who has beneficially owned restricted securities within the meaning of Rule 144 for at least one year would be entitled to sell those shares without regard to the provisions of Rule 144.
In general, under Rule 144 as currently in effect, once we have been subject to public company reporting requirements for 90 days, our affiliates or persons selling shares on behalf of our affiliates who own shares that were acquired from us or an affiliate of ours at least six months prior to the proposed sale are entitled to sell upon expiration of the lock-up agreements described above, within any three-month period beginning 90 days after the date of this prospectus, a number of shares that does not exceed the greater of:
| • | 1% of the number of shares of common stock then outstanding, which will equal approximately shares immediately after this offering; or |
| • | The average weekly trading volume of the common stock during the four calendar weeks preceding the filing of a notice on Form 144 with respect to such sale. |
Sales under Rule 144 by our affiliates or persons selling shares on behalf of our affiliates are also subject to certain manner of sale provisions and notice requirements and to the availability of current public information about us.
Rule 701
Rule 701 of the Securities Act, as currently in effect, permits any of our employees, officers, directors or consultants who purchased or receive shares from us pursuant to a written compensatory plan or contract to resell such shares in reliance upon Rule 144, but without compliance with certain restrictions. Subject to any applicable lock-up agreements, Rule 701 provides that affiliates may sell their Rule 701 shares under Rule 144 beginning 90 days after the date of this prospectus without complying with the holding period requirement of Rule 144 and that non-affiliates may sell such shares in reliance on Rule 144 beginning 90 days after the date of this prospectus without complying with the holding period, public information, volume limitation or notice requirements of Rule 144.
Registration Rights
Upon completion of this offering, the holders of an aggregate of shares of our common stock, or their transferees, will be entitled to rights with respect to the registration of their shares under the Securities Act. Registration of these shares under the Securities Act would result in these shares becoming freely tradable without restriction under the Securities Act immediately upon the effectiveness of such registration.
Form S-8 Registration Statements
Following the completion of this offering, we intend to file one or more registration statements on Form S-8 under the Securities Act to register the shares of our common stock that are issuable pursuant to our 2000 Stock Plan and 2011 Equity Plan. See the section titled “Management—Equity Benefit Plans.” Subject to the lock-up agreements described above, other contractual lock-up obligations set forth in the grant agreements under each such plan and any applicable vesting restrictions, shares registered under these registration statements will be available for resale in the public market immediately upon the effectiveness of these registration statements, except with respect to Rule 144 volume limitations that apply to our affiliates.
111
Table of Contents
Index to Financial Statements
CERTAIN MATERIAL U.S. FEDERAL TAX CONSEQUENCES TO NON-U.S. HOLDERS OF COMMON STOCK
This section summarizes the material U.S. federal income and estate tax consequences of the ownership and disposition of our common stock by a non-U.S. holder. For purposes of this summary, a “non-U.S. holder” is any beneficial owner that for U.S. federal income tax purposes is not a U.S. person. The term “U.S. person” means:
| • | an individual citizen or resident of the United States; |
| • | a corporation or entity treated as a corporation for U.S. federal income tax purposes, created or organized under the laws of the United States or any state, including the District of Columbia; |
| • | an estate whose income is subject to U.S. income tax regardless of source; or |
| • | a trust (i) whose administration is subject to the primary supervision of a court within the United States and which has one or more U.S. persons who have authority to control all substantive decisions of the trust or (ii) which has a valid election in effect under applicable U.S. Treasury regulations to be treated as a U.S. person. |
Generally, an individual may be treated as a resident of the United States in any calendar year for U.S. federal income tax purposes by, among other ways, being present in the United States for at least 31 days in that calendar year and for an aggregate of at least 183 days during a three-year period ending in the current calendar year. For purposes of this calculation, such individual would count all of the days in which the individual was present in the current year, one-third of the days present in the immediately preceding year, and one-sixth of the days present in the second preceding year. Residents are taxed for U.S. federal income tax purposes as if they were citizens of the United States.
If a partnership, including any entity treated as a partnership for U.S. federal income tax purposes, is a beneficial owner of common stock, the tax treatment of a partner in the partnership will depend upon the status of the partner and the activities of the partnership. Partnerships that are beneficial owners of our common stock, and partners in such partnerships, should consult their tax advisors regarding the tax consequences to them of the ownership and disposition of our common stock.
This summary applies only to non-U.S. holders who acquire our common stock pursuant to this offering and who hold our common stock as a capital asset (generally property held for investment). This summary generally does not address tax considerations that may be relevant to particular investors because of their specific circumstances, or because they are subject to special rules. Certain former U.S. citizens or long-term residents, controlled foreign corporations, passive foreign investment companies, corporations that accumulate earnings to avoid federal income tax, life insurance companies, tax-exempt organizations, dealers in securities or currencies, brokers, banks or other financial institutions, certain trusts, hybrid entities, pension funds and investors that hold our common stock as part of a hedge, straddle or conversion transaction are among those categories of potential investors that are subject to special rules not covered in this discussion. This summary does not consider the tax consequences for partnerships, entities classified as a partnership for U.S. federal income tax purposes, or persons who hold their interests through a partnership or other entity classified as a partnership for U.S. federal income tax purposes. This summary does not address any U.S. federal gift tax consequences, or state or local or non-U.S. tax consequences. This summary does not provide a complete analysis of all potential tax considerations. The information provided below is based on existing authorities. These authorities may change, or the Internal Revenue Service, or IRS, might interpret the existing authorities differently. In either case, the tax considerations of owning or disposing of common stock could differ from those described below.
INVESTORS CONSIDERING THE PURCHASE OF COMMON STOCK SHOULD CONSULT THEIR OWN TAX ADVISORS REGARDING THE APPLICATION OF THE U.S. FEDERAL INCOME AND ESTATE TAX LAWS TO THEIR PARTICULAR SITUATIONS AND THE CONSEQUENCES OF OTHER U.S. FEDERAL, FOREIGN, STATE OR LOCAL LAWS AND ANY APPLICABLE TAX TREATIES.
112
Table of Contents
Index to Financial Statements
Dividends
Payments of cash and other property that we make to our shareholders with respect to our common stock will constitute dividends to the extent paid from our current or accumulated earnings and profits, as determined under U.S. federal income tax principles. To the extent those dividends exceed our current and accumulated earnings and profits, the dividends will constitute a return of capital and will first reduce a holder’s basis, but not below zero, and then will be treated as gain from the sale of stock.
The gross amount of any dividend (out of earnings and profits) paid to a non-U.S. holder of common stock generally will be subject to U.S. withholding tax at a rate of 30% unless the holder is entitled to an exemption from or reduced rate of withholding under an applicable income tax treaty. In order to receive an exemption or a reduced treaty rate, prior to the payment of a dividend, a non-U.S. holder must provide us with an IRS Form W-8BEN (or successor form) certifying qualification for the exemption or reduced rate.
Dividends received by a non-U.S. holder that are effectively connected with a U.S. trade or business conducted by the non-U.S. holder (and dividends attributable to a non-U.S. holder’s permanent establishment in the United States if an income tax treaty applies) are exempt from this withholding tax. To obtain this exemption, prior to the payment of a dividend, a non-U.S. holder must provide us with an IRS Form W-8ECI (or successor form) properly certifying this exemption. Effectively connected dividends (or dividends attributable to a permanent establishment), although not subject to withholding tax, are taxed at the same graduated rates applicable to U.S. persons, net of certain deductions and credits. In addition, dividends received by a corporate non-U.S. holder that are effectively connected with a U.S. trade or business of the corporate non-U.S. holder (or dividends attributable to a corporate non-U.S. holder’s permanent establishment in the United States if an income tax treaty applies) may also be subject to a branch profits tax at a rate of 30% (or such lower rate as may be specified in an income tax treaty).
A non-U.S. holder who provides us with an IRS Form W-8BEN or an IRS Form W-8ECI will be required to periodically update such form.
A non-U.S. holder of common stock that is eligible for a reduced rate of withholding tax pursuant to an income tax treaty may obtain a refund of any excess amounts currently withheld if an appropriate claim for refund is timely filed with the IRS.
Gain on Disposition of Common Stock
A non-U.S. holder will generally not be subject to U.S. federal income tax on any gains realized on the sale, exchange, or other disposition of common stock unless:
| • | the gain is effectively connected with a U.S. trade or business of the non-U.S. holder (or attributable to a permanent establishment in the United States if an income tax treaty applies), in which case the non-U.S. holder generally will be required to pay tax on the net gain derived from the sale under regular graduated U.S. federal income tax rates and, if the non-U.S. holder is a corporation, the branch profits tax may apply, at a 30% rate or such lower rate as may be specified by an applicable income tax treaty; |
| • | the non-U.S. holder is an individual who is present in the United States for a period or periods aggregating 183 days or more during the calendar year in which the sale or disposition occurs and certain other conditions are met, in which case the non-U.S. holder will be required to pay a flat 30% tax (or such lower rate as may be specified by an applicable income tax treaty between the United States and such non-U.S. holder’s country of residence) on the net gain derived from the disposition, which tax may be offset by U.S. source capital losses, if any, provided that the non-U.S. holder has timely filed U.S. federal income tax returns with respect to such losses; or |
| • | our common stock constitutes a U.S. real property interest by reason of our status as a “U.S. real property holding corporation” for U.S. federal income tax purposes at any time within the shorter of the five-year |
113
Table of Contents
Index to Financial Statements
| period preceding the disposition or the holder’s holding period for our common stock. We believe that we are not currently, and we are not likely to become, a “U.S. real property holding corporation” for U.S. federal income tax purposes. |
If we become a U.S. real property holding corporation after this offering, so long as our common stock is regularly traded on an established securities market and continues to be so traded, a non-U.S. holder will not be subject to U.S. federal income tax on gain recognized from the sale, exchange or other disposition of shares of our common stock as a result of such status unless (i) such holder actually or constructively owned more than 5% of our common stock at anytime during the shorter of (A) the five-year period preceding the disposition, or (B) the holder’s holding period for our common stock, and (ii) we were a U.S. real property holding corporation at any time during such period when the more than 5% ownership test was met. If any gain on your disposition is taxable because we are a U.S. real property holding corporation and your ownership of our common stock exceeds 5%, you will be taxed on such disposition generally in the manner applicable to U.S. persons. Any such non-U.S. holder that owns or has owned, actually or constructively, more than 5% of our common stock is urged to consult that holder’s own tax advisor with respect to the particular tax consequences to such holder for the gain from the sale, exchange or other disposition of shares of our common stock if we were to be or to become a U.S. real property holding company.
Backup Withholding and Information Reporting
Generally, we must report annually to the IRS the amount of dividends paid, the name and address of the recipient, and the amount, if any, of tax withheld. A similar report is sent to the holder. Pursuant to tax treaties or other agreements, the IRS may make its reports available to tax authorities in the non-U.S. holder’s country of residence.
Payments of dividends or of proceeds on the disposition of stock made to a non-U.S. holder may be subject to additional information reporting and backup withholding. Backup withholding will not apply if the non-U.S. holder establishes an exemption, for example, by properly certifying its non-U.S. person status on an IRS Form W-8BEN (or successor form). Notwithstanding the foregoing, backup withholding may apply if either we or our paying agent has actual knowledge, or reason to know, that the holder is a U.S. person.
Backup withholding is not an additional tax. Rather, the U.S. federal income tax liability of persons subject to backup withholding will be reduced by the amount of tax withheld. If withholding results in an overpayment of taxes, a credit or refund may be obtained from the IRS, provided that the required information is furnished to the IRS in a timely manner.
Recent Legislation Relating to Foreign Accounts
Recently enacted legislation generally will impose a U.S. federal withholding tax of 30% on dividends and the gross proceeds of a disposition of our common stock paid after December 31, 2012 to a foreign financial institution (as specifically defined for this purpose) unless such institution enters into an agreement with the U.S. government to withhold on certain payments and to collect and provide to the U.S. tax authorities substantial information regarding U.S. account holders of such institution (which includes certain equity and debt holders of such institution, as well as certain account holders that are foreign entities with U.S. owners). The legislation also will generally impose a U.S. federal withholding tax of 30% on dividends and the gross proceeds of a disposition of our common stock paid after December 31, 2012 to a non-financial foreign entity unless such entity provides the withholding agent with either a certification that it does not have any substantial direct or indirect U.S. owners or provides information regarding direct and indirect U.S. owners of the entity. Under certain circumstances, a non-U.S. holder might be eligible for refunds or credits of such taxes. Holders are encouraged to consult with their own tax advisors regarding the possible implications of the legislation on their investment in our common stock.
114
Table of Contents
Index to Financial Statements
U.S. Federal Estate Tax
The estates of nonresident alien individuals are generally subject to U.S. federal estate tax on property with a U.S. situs. Because we are a U.S. corporation, our common stock will be U.S. situs property and therefore will be included in the taxable estate of a nonresident alien decedent. The U.S. federal estate tax liability of the estate of a nonresident alien may be affected by a tax treaty between the United States and the decedent’s country of residence.
THE PRECEDING DISCUSSION OF U.S. FEDERAL INCOME TAX CONSIDERATIONS IS FOR GENERAL INFORMATION ONLY. IT IS NOT TAX ADVICE. EACH PROSPECTIVE INVESTOR SHOULD CONSULT ITS OWN TAX ADVISOR REGARDING THE PARTICULAR U.S. FEDERAL, STATE, LOCAL, AND FOREIGN TAX CONSEQUENCES OF PURCHASING, HOLDING, AND DISPOSING OF OUR COMMON STOCK, INCLUDING THE CONSEQUENCES OF ANY PROPOSED CHANGE IN APPLICABLE LAWS.
115
Table of Contents
Index to Financial Statements
Subject to the terms and conditions set forth in an underwriting agreement dated the date of this prospectus, we and the selling stockholders have agreed to sell to the underwriters named below, and the underwriters, for whom Stifel, Nicolaus & Company, Incorporated, and Piper Jaffray & Co. are acting as joint-book running managers and representatives, have severally agreed to purchase, the respective numbers of shares of common stock appearing opposite their names below:
| Underwriters |
Number of Shares | |||
| Stifel, Nicolaus & Company, Incorporated |
||||
| Piper Jaffray & Co. |
||||
| BB&T Capital Markets, a division of Scott and Stringfellow, LLC |
||||
| William Blair & Company, L.L.C. |
||||
| Total |
||||
Of the shares to be purchased by the underwriters, shares will be purchased from us and shares will be purchased from the selling stockholders.
The underwriting agreement provides that the obligations of the several underwriters are subject to various conditions, including approval of legal matters by counsel. The underwriting agreement provides that the underwriters are obligated to purchase all the shares of common stock in the offering if any are purchased, other than those shares covered by the over-allotment option described below. If an underwriter defaults, the underwriting agreement provides that the purchase commitments of the non-defaulting underwriters may be increased or the underwriting agreement may be terminated.
The underwriting agreement provides that we and the selling stockholders will indemnify the underwriters against liabilities specified in the underwriting agreement under the Securities Act, or will contribute to payments that the underwriters may be required to make relating to these liabilities.
The underwriters expect to deliver the shares of common stock to purchasers on or about 2011.
Over-Allotment Option
We and the selling stockholders have granted a 30-day over-allotment option to the underwriters to purchase up to a total of additional shares of our common stock from the selling stockholders at the initial public offering price, less the underwriting discount payable by the selling stockholders, as set forth on the cover page of this prospectus. If the underwriters exercise this option in whole or in part, then each of the underwriters will be separately committed, subject to the conditions described in the underwriting agreement, to purchase the additional shares of our common stock in proportion to their respective commitments set forth in the table above.
Determination of Offering Price
Prior to this offering, there has been no public market for our common stock. The initial public offering price will be determined through negotiations between us and the underwriters. In addition to prevailing market conditions, the factors to be considered in determining the initial public offering price will include the valuation multiples of publicly-traded companies that the representatives of the underwriters believe are comparable to us, our financial information, our history and prospects and the outlook for our industry, an assessment of our management, our past and present business operations and relationships, and the prospects for, and timing of, our future sales and an assessment of these factors in relation to market values and various valuation measures of other companies engaged in activities similar to ours.
We cannot assure you that an active or orderly trading market will develop for our common stock or that our common stock will trade in the public markets subsequent to this offering at or above the initial offering price.
116
Table of Contents
Index to Financial Statements
Commissions and Discounts
Shares sold by the underwriters to the public will initially be offered at the initial public offering price set forth on the cover of this prospectus. Any shares sold by the underwriters to securities dealers may be sold at that price less a concession of not more than $ per share from the initial public offering price. If all the shares are not sold at the initial public offering price, the underwriters may change the offering price and the other selling terms. The offering of the shares by the underwriters is subject to receipt and acceptance and subject to the underwriters’ right to reject any order in whole or in part.
The following table summarizes the compensation to be paid to the underwriters by us and the proceeds, before expenses, payable to us and the selling stockholders:
| Total | ||||||||||||
| Per Share |
Without Over- Allotment |
With Over- Allotment |
||||||||||
| Public Offering Price |
||||||||||||
| Underwriting discounts and commissions |
||||||||||||
| Proceeds, before expenses, to us |
||||||||||||
| Proceeds, before expenses, to the selling stockholders |
||||||||||||
We estimate that the expenses of this offering payable by us, not including underwriting discounts and commissions, will be approximately $ . In addition, we will reimburse certain legal fees incurred by the underwriters in connection with this offering.
Indemnification of Underwriters
We and the selling stockholders will indemnify the underwriters against some civil liabilities, including liabilities under the Securities Act and liabilities arising from breaches of our respective representations and warranties contained in the underwriting agreement. If we are unable to provide this indemnification, we and the selling stockholders will contribute to payments the underwriters may be required to make in respect of those liabilities.
No Sales of Similar Securities
The underwriters will require all of our directors and officers and stockholders to agree, subject to certain exceptions, not to offer, sell, contract to sell, pledge, grant any option to purchase, make any short sale or otherwise dispose of any shares of common stock, or any options or warrants to purchase any shares of common stock, or any securities convertible into, exchangeable for or that represent the right to receive shares of common stock without the prior written consent of Stifel, Nicolaus & Company, Incorporated and Piper Jaffray & Co. for a period of 180 days after the date of this prospectus.
We have agreed that for a period of 180 days after the date of this prospectus, we will not, without the prior written consent of Stifel, Nicolaus & Company, Incorporated and Piper Jaffray & Co., offer, sell, contract to sell or otherwise dispose of any securities that are substantially similar to the common stock, including but not limited to any securities that are convertible into or exchangeable for, or that represent the right to receive, common stock or any such substantially similar securities except for the shares of common stock offered in this offering, the shares of common stock issuable upon exercise of outstanding options and warrants on the date of this prospectus and the shares of our common stock that are issued under our 2011 Equity Plan, which we will adopt in connection with this offering.
The 180-day restricted period described in the preceding two paragraphs will be automatically extended if: (1) during the last 17 days of the 180-day restricted period we release earnings results or announce material
117
Table of Contents
Index to Financial Statements
news or a material event or (2) prior to the expiration of the 180-day restricted period, we announce that we will release earnings results during the 16-day period beginning on the last day of the 180-day period, in which case the restrictions described in the preceding paragraph will continue to apply until the expiration of the 18-day period beginning on the date of release of the earnings results or the announcement of the material news or material event.
NASDAQ Global Select Market Listing
We have applied to list our common stock on the NASDAQ Global Select Market under the symbol “NEWG.”
Short Sales, Stabilizing Transactions and Penalty Bids
In order to facilitate this offering, persons participating in this offering may engage in transactions that stabilize, maintain or otherwise affect the price of our common stock during and after this offering. Specifically, the underwriters may engage in the following activities in accordance with the rules of the SEC.
Short sales. Short sales involve the sales by the underwriters of a greater number of shares than they are required to purchase in the offering. Covered short sales are short sales made in an amount not greater than the underwriters’ over-allotment option to purchase additional shares from us in this offering. The underwriters may close out any covered short position by either exercising their over-allotment option to purchase shares or purchasing shares in the open market. In determining the source of shares to close out the covered short position, the underwriters will consider, among other things, the price of shares available for purchase in the open market as compared to the price at which they may purchase shares through the over-allotment option. Naked short sales are any short sales in excess of such over-allotment option. The underwriters must close out any naked short position by purchasing shares in the open market. A naked short position is more likely to be created if the underwriters are concerned that there may be downward pressure on the price of the common stock in the open market after pricing that could adversely affect investors who purchase in this offering.
Stabilizing transactions. The underwriters may make bids for or purchases of the shares for the purpose of pegging, fixing or maintaining the price of the shares, so long as stabilizing bids do not exceed a specified maximum.
Penalty bids. If the underwriters purchase shares in the open market in a stabilizing transaction or syndicate covering transaction, they may reclaim a selling concession from the underwriters and selling group members who sold those shares as part of this offering. Stabilization and syndicate covering transactions may cause the price of the shares to be higher than it would be in the absence of these transactions. The imposition of a penalty bid might also have an effect on the price of the shares if it discourages presales of the shares.
The transactions above may occur on the NASDAQ Global Select Market or otherwise. Neither we nor the underwriters make any representation or prediction as to the effect that the transactions described above may have on the price of the shares. If these transactions are commenced, they may be discontinued without notice at any time.
Discretionary Accounts
The underwriters have informed us that they do not intend sales to discretionary accounts to exceed 5% of the total number of shares of common stock offered by them. The underwriters have informed us that they do not intend to confirm sales to discretionary accounts without the prior specific written approval of the customer.
Relationships
From time to time, certain of the underwriters and/or their respective affiliates have directly and indirectly engaged in various financial advisory, investment banking and commercial banking services for us and our
118
Table of Contents
Index to Financial Statements
affiliates, for which they received customary compensation, fees and expense reimbursement. In addition, from time to time, certain of the underwriters and their affiliates may effect transactions for their own account or the account of customers, and hold on behalf of themselves or their customers, long or short positions in our debt or equity securities or loans, and may do so in the future.
Sales Outside the United States
No action has been taken in any jurisdiction (except in the United States) that would permit a public offering of the common shares, or the possession, circulation or distribution of this prospectus supplement, the accompanying prospectus or any other material relating to us or the common shares in any jurisdiction where action for that purpose is required. Accordingly, the common shares may not be offered or sold, directly or indirectly, and none of this prospectus supplement, the accompanying prospectus or any other offering material or advertisements in connection with the common shares may be distributed or published, in or from any country or jurisdiction except in compliance with any applicable rules and regulations of any such country or jurisdiction. Each of the underwriters may arrange to sell common shares offered hereby in certain jurisdictions outside the United States, either directly or through affiliates, where they are permitted to do so.
Notice to Prospective Investors in the European Economic Area
In relation to each member state of the European Economic Area that has implemented the Prospectus Directive (each, a relevant member state), with effect from and including the date on which the Prospectus Directive is implemented in that relevant member state (the relevant implementation date), an offer of shares of common stock described in this prospectus supplement may not be made to the public in that relevant member state prior to the publication of a prospectus in relation to the shares of common stock that has been approved by the competent authority in that relevant member state or, where appropriate, approved in another relevant member state and notified to the competent authority in that relevant member state, all in accordance with the Prospectus Directive, except that, with effect from and including the relevant implementation date, an offer of securities may be offered to the public in that relevant member state, subject to any variation in that member state by any measure implementing the Prospectus Directive in that member state, at any time:
| • | to legal entities which are authorized or regulated to operate in the financial markets or, if not so authorized or regulated, whose corporate purpose is solely to invest in securities; |
| • | to any legal entity that has two or more of (a) an average of at least 250 employees during the last financial year; (b) a total balance sheet of more than €43,000,000; and (c) an annual net turnover of more than €50,000,000, as shown in its last annual or consolidated accounts; |
| • | to fewer than 100 natural or legal persons (other than qualified investors as defined in the Prospectus Directive) subject to obtaining the prior consent of the underwriters; or |
| • | in any other circumstances that do not require the publication of a prospectus pursuant to Article 3 of the Prospectus Directive; |
provided that no such offer of shares of common stock shall require us or any underwriter to publish a prospectus pursuant to Article 3 of the Prospective Directive.
Each purchaser of shares of common stock described in this prospectus supplement located within a relevant member state will be deemed to have represented, acknowledged and agreed that it is a “qualified investor” within the meaning of Article 2(1)(e) of the Prospectus Directive.
For purposes of this provision, the expression an “offer to the public” in any relevant member state means the communication in any form and by any means of sufficient information on the terms of the offer and the
119
Table of Contents
Index to Financial Statements
securities to be offered so as to enable an investor to decide to purchase or subscribe the securities, as the expression may be varied in that member state by any measure implementing the Prospectus Directive in that member state, and the expression “Prospectus Directive” means Directive 2003/71/EC and includes any relevant implementing measure in each relevant member state.
Notice to Prospective Investors in the United Kingdom
This prospectus and any other material in relation to the shares described herein is only being distributed to, and is only directed at, persons in the United Kingdom that are qualified investors within the meaning of Article 2(1)(e) of the Prospective Directive (“qualified investors”) that also (i) have professional experience in matters relating to investments falling within Article 19(5) of the Financial Services and Markets Act 2000 (Financial Promotion) Order 2005, as amended, or the Order, (ii) who fall within Article 49(2)(a) to (d) of the Order or (iii) to whom it may otherwise lawfully be communicated (all such persons together being referred to as “relevant persons”). The shares are only available to, and any invitation, offer or agreement to purchase or otherwise acquire such shares will be engaged in only with, relevant persons. This offering memorandum and its contents are confidential and should not be distributed, published or reproduced (in whole or in part) or disclosed by recipients to any other person in the United Kingdom. Any person in the United Kingdom that is not a relevant person should not act or rely on this prospectus or any of its contents.
The distribution of this prospectus in the United Kingdom to anyone not falling within the above categories is not permitted and may contravene FSMA. No person falling outside those categories should treat this prospectus as constituting a promotion to him, or act on it for any purposes whatever. Recipients of this prospectus are advised that we, the underwriters and any other person that communicates this prospectus are not, as a result solely of communicating this prospectus, acting for or advising them and are not responsible for providing recipients of this prospectus with the protections which would be given to those who are clients of any aforementioned entities that is subject to the Financial Services Authority Rules.
Notice to Prospective Investors in France
The prospectus supplement and the accompanying prospectus (including any amendment, supplement or replacement thereto) have not been approved either by the Autorité des marchés financiers or by the competent authority of another State that is a contracting party to the Agreement on the European Economic Area and notified to the Autorité des marchés financiers; no security has been offered or sold and will be offered or sold, directly or indirectly, to the public in France within the meaning of Article L. 411-1 of the French Code Monétaire et Financier except to permitted investors, or Permitted Investors, consisting of persons licensed to provide the investment service of portfolio management for the account of third parties, qualified investors (investisseurs qualifiés) acting for their own account and/or a limited circle of investors (cercle restreint d’investisseurs) acting for their own account, with “qualified investors” and “limited circle of investors” having the meaning ascribed to them in Articles L. 411-2, D. 411-1, D. 411-2, D. 411-4, D. 744-1, D. 754-1 and D. 764-1 of the French Code Monétaire et Financier; none of this prospectus supplement and the accompanying Prospectus or any other materials related to the offer or information contained therein relating to our securities has been released, issued or distributed to the public in France except to Permitted Investors; and the direct or indirect resale to the public in France of any securities acquired by any Permitted Investors may be made only as provided by Articles L. 411-1, L. 411-2, L. 412-1 and L. 621-8 to L. 621-8-3 of the French Code Monétaire et Financier and applicable regulations thereunder.
Notice to the Residents of Germany
This document has not been prepared in accordance with the requirements for a securities or sales prospectus under the German Securities Prospectus Act (Wertpapierprospektgesetz), the German Sales Prospectus Act (Verkaufsprospektgesetz), or the German Investment Act (Investmentgesetz). Neither the German Federal Financial Services Supervisory Authority (Bundesanstalt fur Finanzdienstleistungsaufsicht—BaFin) nor any
120
Table of Contents
Index to Financial Statements
other German authority has been notified of the intention to distribute the securities in Germany. Consequently, the securities may not be distributed in Germany by way of public offering, public advertisement or in any similar manner AND THIS DOCUMENT AND ANY OTHER DOCUMENT RELATING TO THE OFFERING, AS WELL AS INFORMATION OR STATEMENTS CONTAINED THEREIN, MAY NOT BE SUPPLIED TO THE PUBLIC IN GERMANY OR USED IN CONNECTION WITH ANY OFFER FOR SUBSCRIPTION OF THE SECURITIES TO THE PUBLIC IN GERMANY OR ANY OTHER MEANS OF PUBLIC MARKETING. The securities are being offered and sold in Germany only to qualified investors which are referred to in Section 3, paragraph 2 no. 1, in connection with Section 2, no. 6, of the German Securities Prospectus Act. This document is strictly for use of the person who has received it. It may not be forwarded to other persons or published in Germany.
Notice to Prospective Investors in Switzerland
This document does not constitute a prospectus within the meaning of Art. 652a of the Swiss Code of Obligations. The shares of common stock may not be sold directly or indirectly in or into Switzerland except in a manner which will not result in a public offering within the meaning of the Swiss Code of Obligations. Neither this document nor any other offering materials relating to the shares of common stock may be distributed, published or otherwise made available in Switzerland except in a manner which will not constitute a public offer of the shares of common stock in Switzerland.
Notice to Prospective Investors in Hong Kong
Our common stock may not be offered or sold by means of any document other than: (i) in circumstances which do not constitute an offer to the public within the meaning of the Companies Ordinance (Cap. 32, Laws of Hong Kong), (ii) to “professional investors” as defined in the Securities and Futures Ordinance (Cap. 571, Laws of Hong Kong) and any rules thereunder, or (iii) in other circumstances which do not result in the document being a “prospectus” within the meaning of the Companies Ordinance. No advertisement, invitation or other document relating our common stock may be issued, whether in Hong Kong or elsewhere, where such document is directed at, or the contents are likely to be accessed or read by, the public of Hong Kong (except if permitted to do so under the laws of Hong Kong), other than with respect to such common stock that is intended to be disposed of only to persons outside of Hong Kong or only to “professional investors” as defined in the Securities and Futures Ordinance and any rules thereunder.
Notice to Prospective Investors in Dubai International Financial Centre
This prospectus relates to an exempt offer in accordance with the Offered Securities Rules of the Dubai Financial Services Authority. This prospectus is intended for distribution only to persons of a type specified in those rules. It must not be delivered to, or relied on by, any other person. The Dubai Financial Services Authority has no responsibility for reviewing or verifying any documents in connection with exempt offers. The Dubai Financial Services Authority has not approved this prospectus nor taken steps to verify the information set out in it, and has no responsibility for it. The shares of our common stock which are the subject of the offering contemplated by this prospectus may be illiquid and/or subject to restrictions on their resale. Prospective purchasers of the shares offered should conduct their own due diligence on the shares. If you do not understand the contents of this prospectus you should consult an authorized financial adviser.
Notice to Prospective Investors in Singapore
This prospectus has not been registered as a prospectus with the Monetary Authority of Singapore. Accordingly, this prospectus and any other document or material in connection with the offer or sale, or invitation for subscription or purchase, of the shares of our common stock may not be circulated or distributed, nor may the shares be offered or sold, or be made the subject of an invitation for subscription or purchase, whether directly or indirectly, to persons in Singapore other than (i) to an institutional investor under
121
Table of Contents
Index to Financial Statements
Section 274 of the Securities and Futures Act, Chapter 289 of Singapore (the “SFA”), (ii) to a relevant person, or any person pursuant to Section 275 (1A), and in accordance with the conditions, specified in Section 275 of the SFA or (iii) otherwise pursuant to, and in accordance with the conditions of, any other applicable provision of the SFA.
Where the shares are subscribed or purchased under Section 275 by a relevant person which is: (a) a corporation (which is not an accredited investor) the sole business of which is to hold investments and the entire share capital of which is owned by one or more individuals, each of whom is an accredited investor; or (b) a trust (where the trustee is not an accredited investor) whose sole whole purpose is to hold investments and each beneficiary is an accredited investor, shares, debentures and units of shares and debentures of that corporation or the beneficiaries’ rights and interest in that trust shall not be transferable for six months after that corporation or that trust has acquired the shares under Section 275 except: (i) to an institutional investor under Section 274 of the SFA or to a relevant person, or any person pursuant to Section 275(1A), and in accordance with the conditions, specified in Section 275 of the SFA; (ii) where no consideration is given for the transfer; or (iii) by operation of law.
DLA Piper LLP (US), Austin, Texas will provide us with an opinion as to the validity of the common stock offered under this prospectus. Wilson Sonsini Goodrich & Rosati, Professional Corporation, Austin, Texas will pass upon certain legal matters related to this offering for the underwriters. Samer M. Zabaneh, a partner of DLA Piper LLP (US), holds 362,260 shares of our common stock.
Our consolidated financial statements at January 1, 2011 and January 2, 2010, and for each of the three fiscal years in the period ended January 1, 2011, appearing in this prospectus and registration statement have been audited by Ernst & Young LLP, independent registered public accounting firm, as set forth in their report thereon appearing elsewhere herein, and are included in reliance upon such report given on the authority of such firm as experts in accounting and auditing.
WHERE YOU CAN FIND ADDITIONAL INFORMATION
We have filed with the SEC a registration statement on Form S-1 under the Securities Act with respect to the shares of common stock offered under this prospectus. As permitted under the rules and regulations of the SEC, this prospectus does not contain all of the information in and exhibits and schedules to the registration statement. For further information with respect to us and our common stock, we refer you to the registration statement and its exhibits and schedules. Statements contained in this prospectus as to the contents of any contract or any other document referred to are not necessarily complete, and in each instance, we refer you to the copy of the contract or other document filed as an exhibit to the registration statement. Each of these statements is qualified in all respects by this reference. You may inspect a copy of the registration statement without charge at the SEC’s Public Reference Room at 100 F Street, NE, Washington, D.C. 20549, and copies of all or any part of the registration statement may be obtained from the Public Reference Room of the SEC, 100 F Street, NE, Washington, DC 20549, upon payment of fees prescribed by the SEC. The SEC maintains an internet site that contains reports, proxy and information statements and other information regarding registrants that file electronically with the SEC. The address of the website is http://www.sec.gov. The public may obtain information on the operation of the Public Reference Room by calling the SEC at (800) SEC-0330.
Upon completion of the offering, we will be subject to the information reporting requirements of the Securities Exchange Act of 1934, as amended, and we will file reports, proxy statements and other information with the SEC.
We intend to furnish our stockholders with annual reports containing financial statements audited by our independent registered public accounting firm and quarterly reports for the first three fiscal quarters of each fiscal year containing unaudited interim financial information. Our telephone number is (512) 225-6000.
122
Table of Contents
Index to Financial Statements
INDEX TO CONSOLIDATED FINANCIAL STATEMENTS
| Newgistics, Inc. Consolidated Financial Statements |
||||
| F-2 | ||||
| Consolidated Balance Sheets as of January 2, 2010 and January 1, 2011 |
F-3 | |||
| Consolidated Statements of Operations for Fiscal Years 2008, 2009 and 2010 |
F-4 | |||
| F-5 | ||||
| Consolidated Statements of Cash Flows for Fiscal Years 2008, 2009 and 2010 |
F-6 | |||
| F-7 | ||||
| Newgistics, Inc. Unaudited Condensed Consolidated Financial Statements |
||||
| Unaudited Condensed Consolidated Balance Sheet as of April 2, 2011 |
F-31 | |||
| F-32 | ||||
| F-33 | ||||
| F-34 | ||||
| Notes to Unaudited Condensed Consolidated Financial Statements |
F-35 | |||
F-1
Table of Contents
Index to Financial Statements
REPORT OF INDEPENDENT REGISTERED PUBLIC ACCOUNTING FIRM
Board of Directors and Stockholders of
Newgistics, Inc. and subsidiaries
We have audited the accompanying consolidated balance sheets of Newgistics, Inc. and subsidiaries as of January 1, 2011 and January 2, 2010, and the related consolidated statements of operations, stockholders’ deficit and cash flows for each of the three fiscal years in the period ended January 1, 2011. These consolidated financial statements are the responsibility of the Company’s management. Our responsibility is to express an opinion on these consolidated financial statements based on our audits.
We conducted our audits in accordance with the standards of the Public Company Accounting Oversight Board (United States). Those standards require that we plan and perform the audit to obtain reasonable assurance about whether the financial statements are free of material misstatement. We were not engaged to perform an audit of the Company’s internal control over financial reporting. Our audits included consideration of internal control over financial reporting as a basis for designing audit procedures that are appropriate in the circumstances, but not for the purpose of expressing an opinion on the effectiveness of the Company’s internal control over financial reporting. Accordingly, we express no such opinion. An audit also includes examining, on a test basis, evidence supporting the amounts and disclosures in the financial statements, assessing the accounting principles used and significant estimates made by management, and evaluating the overall financial statement presentation. We believe that our audits provide a reasonable basis for our opinion.
In our opinion, the consolidated financial statements referred to above present fairly, in all material respects, the financial position of Newgistics, Inc. and subsidiaries at January 1, 2011 and January 2, 2010 and the results of their operations and their cash flows for each of the three fiscal years in the period ended January 1, 2011 in conformity with United States generally accepted accounting principles.
/s/ Ernst & Young LLP
Austin, Texas
March 9, 2011
F-2
Table of Contents
Index to Financial Statements
NEWGISTICS, INC. AND SUBSIDIARIES
CONSOLIDATED BALANCE SHEETS
(in thousands, except per share amounts)
| January 2, 2010 |
January 1, 2011 |
|||||||
| Assets |
||||||||
| Current assets: |
||||||||
| Cash |
$ | 3,193 | $ | 2,132 | ||||
| Accounts receivable, net of allowance of $55 and $71, at January 2, 2010 and January 1, 2011, respectively |
13,465 | 12,204 | ||||||
| Prepaid expenses and other current assets |
2,106 | 2,553 | ||||||
| Total current assets |
18,764 | 16,889 | ||||||
| Property and equipment, net |
4,720 | 4,483 | ||||||
| Goodwill |
6,544 | 6,544 | ||||||
| Intangible assets, net |
9,108 | 7,073 | ||||||
| Deferred tax assets |
10,707 | 13,265 | ||||||
| Other assets |
222 | - | ||||||
| Total assets |
$ | 50,065 | $ | 48,254 | ||||
| Liabilities and stockholders’ deficit |
||||||||
| Current liabilities: |
||||||||
| Accounts payable |
$ | 4,217 | $ | 5,076 | ||||
| Accrued compensation |
2,057 | 2,844 | ||||||
| Accrued transportation costs |
2,707 | 1,866 | ||||||
| Other accrued liabilities |
1,407 | 1,517 | ||||||
| Current portion of long-term debt |
4,983 | - | ||||||
| Total current liabilities |
15,371 | 11,303 | ||||||
| Convertible preferred stock warrant liability |
25,241 | 17,230 | ||||||
| Long-term debt, less current portion |
12,276 | - | ||||||
| Total liabilities |
52,888 | 28,533 | ||||||
| Commitments and contingencies (note 7) |
||||||||
| Redeemable convertible preferred stock (note 9) |
117,346 | 107,930 | ||||||
| Stockholders’ deficit: |
||||||||
| Common Stock; $.001 par value; 900,000 shares authorized; 74,351 and 76,086 shares issued and outstanding at January 2, 2010 and January 1, 2011, respectively |
74 | 76 | ||||||
| Additional paid-in capital |
8,288 | 8,646 | ||||||
| Accumulated deficit |
(128,531 | ) | (96,931 | ) | ||||
| Total stockholders’ deficit |
(120,169 | ) | (88,209 | ) | ||||
| Total liabilities and stockholders’ deficit |
$ | 50,065 | $ | 48,254 | ||||
See accompanying notes to consolidated financial statements.
F-3
Table of Contents
Index to Financial Statements
NEWGISTICS, INC. AND SUBSIDIARIES
CONSOLIDATED STATEMENTS OF OPERATIONS
(in thousands, except per share amounts)
| Fiscal Year | ||||||||||||
| 2008 | 2009 | 2010 | ||||||||||
| Revenue |
$ | 129,316 | $ | 168,714 | $ | 174,562 | ||||||
| Cost of revenue |
98,582 | 132,044 | 132,831 | |||||||||
| Gross profit |
30,734 | 36,670 | 41,731 | |||||||||
| Operating expenses: |
||||||||||||
| Selling, general and administrative |
25,126 | 26,060 | 26,113 | |||||||||
| Research and development |
1,742 | 2,205 | 2,231 | |||||||||
| Total operating expenses |
26,868 | 28,265 | 28,344 | |||||||||
| Income from operations |
3,866 | 8,405 | 13,387 | |||||||||
| Other income (expense): |
||||||||||||
| Interest and other income |
104 | 62 | 10 | |||||||||
| Change in fair value of interest rate swap |
(341 | ) | 174 | 145 | ||||||||
| Change in fair value of preferred stock warrant liability |
- | 1,907 | 7,262 | |||||||||
| Interest expense, including amortization of debt discount |
(1,425 | ) | (1,454 | ) | (939 | ) | ||||||
| Other income (expense), net |
(1,662 | ) | 689 | 6,478 | ||||||||
| Income before income taxes |
2,204 | 9,094 | 19,865 | |||||||||
| Income tax benefit |
1,617 | 4,054 | 1,565 | |||||||||
| Net income |
$ | 3,821 | $ | 13,148 | $ | 21,430 | ||||||
| Net income (loss) attributable to common stockholders: |
||||||||||||
| Basic |
$ | (2,243 | ) | $ | 792 | $ | 3,004 | |||||
| Diluted |
$ | (2,243 | ) | $ | 1,333 | $ | 14,168 | |||||
| Net income (loss) per share attributable to common stockholders: |
||||||||||||
| Basic |
$ | (0.03 | ) | $ | 0.01 | $ | 0.04 | |||||
| Diluted |
$ | (0.03 | ) | $ | 0.01 | $ | 0.02 | |||||
| Weighted-average shares used in computing net income (loss) per share attributable to common stockholders: |
||||||||||||
| Basic |
74,321 | 74,357 | 76,156 | |||||||||
| Diluted |
74,321 | 133,832 | 870,361 | |||||||||
| Pro forma net income attributable to common stockholders (unaudited): |
||||||||||||
| Net income |
$ | 21,430 | ||||||||||
| Change in fair value of preferred stock warrant liability |
(7,262 | ) | ||||||||||
| Pro forma net income attributable to common stockholders (unaudited) |
$ | 14,168 | ||||||||||
| Pro forma net income per share attributable to common stockholders (unaudited): |
||||||||||||
| Basic |
$ | 0.02 | ||||||||||
| Diluted |
$ | 0.02 | ||||||||||
| Pro forma weighted-average shares used in computing pro forma net income per share attributable to common stockholders (unaudited): |
||||||||||||
| Basic |
628,277 | |||||||||||
| Diluted |
697,859 | |||||||||||
See accompanying notes to consolidated financial statements.
F-4
Table of Contents
Index to Financial Statements
NEWGISTICS, INC. AND SUBSIDIARIES
CONSOLIDATED STATEMENTS OF STOCKHOLDERS’ DEFICIT
(in thousands)
| Common Stock | Additional Paid-in Capital |
Accumulated Deficit |
Total Stockholders’ Deficit |
|||||||||||||||||
| Shares | Amount | |||||||||||||||||||
| Balance at December 29, 2007 |
74,304 | $ | 74 | $ | 7,613 | $ | (135,330 | ) | $ | (127,643 | ) | |||||||||
| Exercise of stock options |
34 | - | 2 | - | 2 | |||||||||||||||
| Stock-based compensation expense |
- | - | 441 | - | 441 | |||||||||||||||
| Change in redemption value of redeemable convertible preferred stock |
- | - | - | (6,064 | ) | (6,064 | ) | |||||||||||||
| Net income |
- | - | - | 3,821 | 3,821 | |||||||||||||||
| Balance at January 3, 2009 |
74,338 | 74 | 8,056 | (137,573 | ) | (129,443 | ) | |||||||||||||
| Exercise of stock options |
13 | - | 1 | - | 1 | |||||||||||||||
| Stock-based compensation expense |
- | - | 231 | - | 231 | |||||||||||||||
| Change in redemption value of redeemable convertible preferred stock |
- | - | - | (4,106 | ) | (4,106 | ) | |||||||||||||
| Net income |
- | - | - | 13,148 | 13,148 | |||||||||||||||
| Balance at January 2, 2010 |
74,351 | 74 | 8,288 | (128,531 | ) | (120,169 | ) | |||||||||||||
| Exercise of stock options and issuance of common stock |
1,735 | 2 | 81 | - | 83 | |||||||||||||||
| Stock-based compensation expense |
- | - | 277 | - | 277 | |||||||||||||||
| Change in redemption value of redeemable convertible preferred stock |
- | - | - | 10,170 | 10,170 | |||||||||||||||
| Net income |
- | - | - | 21,430 | 21,430 | |||||||||||||||
| Balance at January 1, 2011 |
76,086 | $ | 76 | $ | 8,646 | $ | (96,931 | ) | $ | (88,209 | ) | |||||||||
See accompanying notes to consolidated financial statements.
F-5
Table of Contents
Index to Financial Statements
NEWGISTICS, INC. AND SUBSIDIARIES
CONSOLIDATED STATEMENTS OF CASH FLOWS
(in thousands)
| Fiscal Year | ||||||||||||
| 2008 | 2009 | 2010 | ||||||||||
| Operating activities |
||||||||||||
| Net income |
$ | 3,821 | $ | 13,148 | $ | 21,430 | ||||||
| Adjustment to reconcile net income to net cash provided by operating activities: |
||||||||||||
| Depreciation and amortization |
3,209 | 4,157 | 4,500 | |||||||||
| Stock-based compensation |
441 | 231 | 277 | |||||||||
| Loss on disposal of assets |
- | 21 | - | |||||||||
| Change in fair value of interest rate swap |
341 | (174 | ) | (145 | ) | |||||||
| Change in fair value of convertible preferred stock warrant liability |
- | (1,907 | ) | (7,262 | ) | |||||||
| Noncash interest expense |
49 | 58 | 139 | |||||||||
| Noncash deferred tax expense |
(1,962 | ) | (4,600 | ) | (2,558 | ) | ||||||
| Changes in operating assets and liabilities: |
||||||||||||
| Accounts receivable, net |
(3,803 | ) | (2,919 | ) | 1,266 | |||||||
| Prepaid expenses and other current assets |
(937 | ) | 70 | (452 | ) | |||||||
| Other long-term assets |
478 | (25 | ) | 222 | ||||||||
| Accounts payable |
2,261 | 31 | 860 | |||||||||
| Accrued compensation |
654 | (374 | ) | 788 | ||||||||
| Accrued transportation costs |
1,901 | (1,136 | ) | (841 | ) | |||||||
| Other accrued liabilities |
(257 | ) | 485 | 255 | ||||||||
| Other long-term liabilities |
(2 | ) | - | - | ||||||||
| Net cash provided by operating activities |
6,194 | 7,066 | 18,479 | |||||||||
| Investing activities |
||||||||||||
| Proceeds from sales of property, plant and equipment |
- | 4 | 2 | |||||||||
| Capitalization of internal use software |
(1,238 | ) | (589 | ) | (131 | ) | ||||||
| Purchases of property and equipment, |
(2,232 | ) | (2,294 | ) | (2,100 | ) | ||||||
| Acquisition of Cornerstone |
(7,089 | ) | - | - | ||||||||
| Net cash used in investing activities |
(10,559 | ) | (2,879 | ) | (2,229 | ) | ||||||
| Financing activities |
||||||||||||
| Borrowings on Term Note |
5,000 | - | - | |||||||||
| Payments on Term Note |
(3,111 | ) | (6,616 | ) | (12,898 | ) | ||||||
| Borrowings (payments) on Prior Credit Facility |
- | 4,500 | (4,500 | ) | ||||||||
| Proceeds from issuance of shares of series E preferred stock |
- | - | 4 | |||||||||
| Proceeds from issuance of shares of common stock |
2 | 1 | 83 | |||||||||
| Net cash (used in) provided by financing activities |
1,891 | (2,115 | ) | (17,311 | ) | |||||||
| Net change in cash |
(2,474 | ) | 2,072 | (1,061 | ) | |||||||
| Cash, beginning of year |
3,595 | 1,121 | 3,193 | |||||||||
| Cash, end of year |
$ | 1,121 | $ | 3,193 | $ | 2,132 | ||||||
| Supplemental disclosure of cash flow information |
||||||||||||
| Interest payments |
$ | 1,376 | $ | 1,396 | $ | 466 | ||||||
| Income tax payments |
$ | 740 | $ | 280 | $ | 1,545 | ||||||
See accompanying notes to consolidated financial statements.
F-6
Table of Contents
Index to Financial Statements
NEWGISTICS, INC. AND SUBSIDIARIES
NOTES TO CONSOLIDATED FINANCIAL STATEMENTS
1. The Company
Newgistics, Inc., a Delaware corporation, or, together with its wholly-owned subsidiaries, the Company, is a leading provider of parcel and freight transportation solutions to direct-to-consumer retailers, manufacturers, distributors, and third-party logistics and fulfillment providers. Through its strategic alliance with the United States Postal Service, or the USPS, and its network of processing and distribution SmartCenter facilities, the Company provides nationwide parcel return and delivery and other transportation services.
The Company operates in two business segments: parcel solutions and freight services. In its parcel solutions business, the Company manages and arranges for the delivery of parcels from e-commerce, catalogue, and televised home shopping retailers primarily to consumers’ residences and, in the case of merchandise returns, from consumers back to retailers. The Company consolidates shipments from many customers and uses the USPS for last mile delivery and first mile pickup.
In its freight services business, the Company offers a range of less-than-truckload, or LTL, truckload, and expedited transportation management solutions that utilize capacity provided by third-party carriers. The Company’s freight services offerings include carrier and routing management, bill and audit administration, and consolidated freight payment services. For LTL services, the Company negotiates transportation rates and terms with carriers on behalf of its customers, providing its customers with committed capacity, responsive service, and rate transparency.
2. Summary of Significant Accounting Policies
Basis of Presentation and Principles of Consolidation
The accompanying consolidated financial statements include the amounts of the Company. All significant intercompany transactions and balances have been eliminated in consolidation. The Company has evaluated subsequent events through the time and date of filing of these financial statements.
Use of Estimates
The preparation of financial statements in conformity with U.S. generally accepted accounting principles, or GAAP, requires management to make estimates and assumptions that affect the reported amounts of assets and liabilities and disclosure of contingent assets and liabilities at the date of the financial statements and reported amounts of revenues and expenses during the reporting periods. Actual results could differ from those estimates, and such differences could be material to the Company’s financial statements.
Fiscal Year
The Company’s fiscal year ends on the Saturday closest to December 31 and consists of either 52 weeks or, as was the case of fiscal 2008, 53 weeks. Each quarter of each fiscal year generally consists of 13 weeks, although the fourth quarter of fiscal 2008 had 14 weeks.
Applicable Accounting Guidance
Any reference in these notes to applicable accounting guidance is meant to refer to the authoritative non-governmental GAAP as found in the Financial Accounting Standards Board’s, or FASB, Accounting Standards Codification, or ASC.
F-7
Table of Contents
Index to Financial Statements
NEWGISTICS, INC. AND SUBSIDIARIES
NOTES TO CONSOLIDATED FINANCIAL STATEMENTS
2. Summary of Significant Accounting Policies (continued)
Revenue Subject to Seasonal Variations
The Company’s business is seasonal. As customers ramp up for the holiday season at year-end, the fourth quarter historically has been the strongest volume quarter for deliveries. Return volumes are typically strongest in the first and fourth quarters, as consumers return items purchased during the holiday season. Parcel yield, or revenue per parcel, is typically strongest in the first and fourth quarters as parcels tend to be heavier.
Segment Information
The Company’s chief operating decision maker is its chief executive officer, who reviews financial information presented for the Company’s parcel solutions business and its freight services business. Accordingly, in accordance with ASC 280, the Company determined that it has two operating segments, parcel solutions and freight services.
Concentration of Credit Risk
Financial instruments which potentially subject the Company to credit risk consist of cash and cash equivalents and accounts receivable. The Company’s cash and cash equivalents are placed with high-credit-quality financial institutions and issuers. The Company performs periodic credit evaluations of its customers’ financial condition and generally does not require collateral. The Company provides for an allowance for doubtful accounts based upon the expected collectability of receivables and historically such losses have been within management’s expectations.
The Company’s customers that accounted for 10% or more of total revenue for the fiscal years ended January 3, 2009, January 2, 2010, and January 1, 2011 are as follows:
| Fiscal Year | ||||||||||||
| 2008 | 2009 | 2010 | ||||||||||
| Customer One |
* | 20.8 | % | 28.0 | % | |||||||
| Customer Two |
21.5 | % | 16.3 | % | 11.5 | % | ||||||
| * | Customer One was not 10% or more of total revenue in fiscal 2008, thus this percentage is not disclosed. |
The Company relies on the USPS network to provide its parcel solutions service offering. Without the USPS, the Company would not be able to offer its parcel solutions, which represents a majority of its total revenue. Additionally, any disruption and/or significant change within the USPS network could impact the Company’s current and/or future postage costs and/or the level of service it experiences in connection with providing its service offerings to its customers.
At January 2, 2010 and January 1, 2011, accounts receivable from customers that accounted for 10% or more of total revenue during the fiscal year totaled approximately 41% and 31%, respectively, of accounts receivable, net.
Cash and Cash Equivalents
Cash and cash equivalents primarily consist of cash deposits and investment securities with original maturities of three months or less when purchased and are stated at cost which approximates fair value. At January 1, 2011 and January 2, 2010, the Company had deposits in financial institutions that exceeded the federally-insured limits by $1.9 million and $2.9 million, respectively.
F-8
Table of Contents
Index to Financial Statements
NEWGISTICS, INC. AND SUBSIDIARIES
NOTES TO CONSOLIDATED FINANCIAL STATEMENTS
2. Summary of Significant Accounting Policies (continued)
Accounts Receivable
In the ordinary course of business, the Company extends credit to its customers. Accounts receivable are recorded at their outstanding principal balances, adjusted by the allowance for doubtful accounts.
In estimating the allowance for doubtful accounts, the Company considers the length of time receivables balances have been outstanding, historical write-off experience, current economic conditions and client-specific information. For those invoices not specifically reviewed, provisions are made based on our collection history and current economic trends. When the Company ultimately concludes that a receivable is uncollectible, the balance is charged against the allowance for doubtful accounts.
The following table summarizes the changes in allowance for doubtful accounts for trade receivables (in thousands):
| Balance at Beginning of Period |
Charged to Expense, Net of Recoveries |
Deduction of Uncollectible Accounts |
Balance at end of Period |
|||||||||||||
| Fiscal 2008 |
$ | 71 | $ | 3 | $ | (7 | ) | $ | 67 | |||||||
| Fiscal 2009 |
67 | 40 | (52 | ) | 55 | |||||||||||
| Fiscal 2010 |
55 | 35 | (19 | ) | 71 | |||||||||||
Fair Value of Financial Instruments
The carrying amounts of the Company’s financial instruments, which include cash and cash equivalents, accounts receivable, accounts payable, accrued expenses, debt and preferred stock warrant liability, approximate fair value. The carrying amounts of the Company’s cash and cash equivalents, accounts receivable, accounts payable, interest rate swap, and accrued expenses approximate fair value because of their short maturities. The carrying amount of the Company’s debt instruments approximate their carrying values based on management’s best estimate of interest rates that would be available to the Company for similar debt obligations as of January 2, 2010 and January 1, 2011. The fair value of the preferred stock warrant liability was estimated using the Black-Scholes valuation model.
Preferred Stock Warrants
Freestanding warrants related to shares that are redeemable are accounted for in accordance with the applicable guidance in ASC 480. Under the provisions of this guidance, the freestanding warrants that are related to the Company’s redeemable preferred stock are classified as liabilities in the accompanying consolidated balance sheets. The warrants are subject to re-measurement at each balance sheet date, and any change in fair value is recognized as a component of other income (expense). The Company will continue to adjust the liability for changes in fair value until the earlier of (i) the exercise or expiration of the warrants or (ii) the completion of a liquidation event, at which time all of the then outstanding preferred stock warrants will be converted into warrants to purchase common stock and, accordingly, the liability will be reclassified to additional paid-in capital. The Company estimates the fair value of the preferred stock warrant liability using the Black-Scholes valuation method.
F-9
Table of Contents
Index to Financial Statements
NEWGISTICS, INC. AND SUBSIDIARIES
NOTES TO CONSOLIDATED FINANCIAL STATEMENTS
2. Summary of Significant Accounting Policies (continued)
The following table summarizes the weighted average fair value of the warrants and the assumptions utilized to develop their fair value at each measurement date:
| Fiscal Year | ||||||||
| 2008 | 2009 | 2010 | ||||||
| Weighted average fair value of warrants outstanding |
$0.14 | $0.13 | $ | 0.09 | ||||
| Risk-free interest rate |
1.25% | 0.68% | 0.26 | % | ||||
| Expected volatility |
53.9% | 45.0% | 29.2 | % | ||||
| Weighted average expected life in years |
4.25 | 3.26 | 2.20 | |||||
| Dividend yield |
0.0% | 0.0% | 0.0 | % | ||||
Derivative Financial Instruments
The Company accounts for derivatives pursuant to ASC Topic 815 (formerly SFAS No. 133, “Accounting for Derivative Instruments and Hedging”), which requires that all derivative instruments be recognized in the financial statements and measured at fair value regardless of the purpose or intent for holding them. The Company makes use of debt financing as a source of funds and is therefore exposed to interest rate fluctuations in the normal course of business. Its Prior Credit Facility was subject to floating interest rates. The Company managed the risk of unfavorable movements in interest rates by hedging the interest rates on a portion of the outstanding loan balance, thereby locking in a fixed rate on a portion of the principal, reducing the effect of possible rising interest rates and making interest expense more predictable. At January 1, 2011, the fair value of the Company’s interest rate swap was a liability of $21,000.
Property and Equipment
Property and equipment are carried at cost less accumulated depreciation. Depreciation of property and equipment for financial reporting purposes is computed using the straight-line method over the estimated useful lives of the assets of three years. Leasehold improvements and assets subject to capital leases are amortized using the straight-line method over the shorter of the terms of the leases or useful lives of the assets.
Capitalized Software Development Costs
The Company capitalizes specific software development costs, including costs to develop software products or the software components of its solutions, as well as software programs to be used solely to meet its internal needs. The costs incurred in the preliminary stages of development related to research, project planning, training, maintenance, general and administrative activities, and overhead are expensed as incurred. The costs of relatively minor upgrades and enhancements to the software are also expensed as incurred. Once an application has reached the development stage, internal and external costs incurred in the performance of application development stage activities, including costs of materials, services and payroll and payroll-related costs for employees and third-party consultants, are capitalized, if direct and incremental, until the software is substantially complete and ready for its intended use. Capitalization ceases upon completion of all substantial testing. Capitalized costs are recorded as part of property and equipment. Internal use software is amortized on a straight-line basis over its estimated useful life, generally three years. During fiscal year 2010, 2009 and 2008, the Company capitalized approximately $0.1 million, $0.6 million and $1.2 million, respectively, related to internally developed software.
F-10
Table of Contents
Index to Financial Statements
NEWGISTICS, INC. AND SUBSIDIARIES
NOTES TO CONSOLIDATED FINANCIAL STATEMENTS
2. Summary of Significant Accounting Policies (continued)
Revenue Recognition
The Company primarily generates revenue from each parcel shipped and each freight load transacted on behalf of its customers. Revenue is recognized when persuasive evidence of an agreement exists, delivery has occurred, the fee is fixed or determinable, and collection is probable.
Within its parcel solutions segment, the Company generates revenue through service fees charged for the shipment and processing of individual parcels. Revenue is recognized at an individual parcel level and will vary depending on USPS defined mail class, distance traveled, fuel prices, and parcel characteristics such as weight, dimension, and shape. Revenue for delivery of parcels is recognized upon delivery to a USPS location, which concludes the Company’s contractual service obligation. Revenue for parcel returns is recognized when parcels are delivered to customers’ distribution centers.
Within the Company’s freight services segment, for LTL services the Company negotiates transportation rates with carriers on behalf of its customers and generates commissions based on its customers’ gross LTL carrier billings. Because the Company is acting as an agent in the arrangement, commission revenue paid by carriers is recognized on a net basis at the time carrier invoices are received, in accordance with the provisions of ASC 605-45 “Principal Agent Considerations”. For truckload brokerage services, the Company generates revenue by procuring transportation services on behalf of its customers. Truckload brokerage revenue is recognized upon receiving parcel delivery confirmation from carriers. Retainer revenues for aggregation services are recognized monthly as the services are performed.
Amounts received for services in advance of completion of such services are recorded as deferred revenue.
Cost of Revenue and Deferred Costs
Cost of revenues primarily consists of USPS related postage costs, freight costs paid to third-party transportation providers, and personnel and facility costs associated with the Company’s distribution and fulfillment centers. Direct and incremental costs related to in-transit parcels are deferred and recognized upon completion of the Company’s service obligation with respect to the delivery or return of the parcel. At both January 1, 2011 and January 2, 2010, the Company deferred $0.9 million in costs which are included in prepaid expenses and other current assets.
Research and Development
Research and development consists of personnel related costs including salaries, bonuses, and stock-based compensation as well as costs of third-party service providers, incurred for the enhancement of the Company’s technology solutions. Such costs are expensed as incurred.
Debt Issuance Costs
Costs incurred in connection with the origination of long-term debt are deferred and amortized over the life of the debt instrument using the effective interest method. As of January 2, 2010 and January 1, 2011, the Company had unamortized debt issuance costs of $0.1 million and $0, respectively.
F-11
Table of Contents
Index to Financial Statements
NEWGISTICS, INC. AND SUBSIDIARIES
NOTES TO CONSOLIDATED FINANCIAL STATEMENTS
2. Summary of Significant Accounting Policies (continued)
Income Taxes
The Company uses the liability method of accounting for income taxes whereby deferred tax assets and liabilities are determined based on temporary differences between the financial reporting bases and the tax bases of assets and liabilities. Deferred tax assets are also recognized for tax net operating loss carryforwards. These deferred tax assets and liabilities are measured using the enacted tax rates and laws that will be in effect when such amounts are expected to reverse or be utilized. Valuation allowances are provided to reduce such deferred tax assets to amounts more likely than not to be ultimately realized.
The income tax provision includes U. S. federal, state and local income taxes and is based on pre-tax income or loss. In determining the estimated annual effective income tax rate, the Company analyzes various factors, including projections of the Company’s annual earnings and taxing jurisdictions in which the earnings will be generated, the impact of state and local income taxes and the ability of the Company to use tax credits and net operating loss carryforwards.
The Company recognizes and measures benefits for uncertain tax positions which require significant judgment by management. The Company evaluates its uncertain tax positions on a quarterly basis and bases these evaluations upon a number of factors, including changes in facts or circumstances, changes in tax law, correspondence with tax authorities during the course of audits and effective settlement of audit issues. Tax positions that meet the more-likely-than-not recognition threshold are measured as the largest amount of the tax benefits, determined on a cumulative probability basis, which is more likely than not to be realized upon ultimate settlement. Future changes in the recognition or measurement of uncertain tax positions could result in material increases or decreases in the Company’s income tax expense in the period in which the Company makes the change, which could have a material impact on its effective income tax rate and operating results.
Advertising
Advertising costs are expensed as incurred. Advertising expenses were approximately $0.1 million in each fiscal year 2010, 2009, and 2008, respectively.
Business Combinations
The Company allocates the total consideration paid to the fair value of the tangible assets, liabilities, and identifiable intangible assets acquired in connection with a business acquisition. Any residual purchase consideration is recorded as goodwill. The allocation of the purchase price requires management to make significant estimates in determining the fair values of assets acquired and liabilities assumed, in particular with respect to identified intangible assets. These estimates are based on the application of valuation models using historical experience and information obtained from the management of the acquired companies. These estimates can include, but are not limited to, the cash flows that an asset is expected to generate in the future, the appropriate weighted average cost of capital and the cost savings expected to be derived from acquiring an asset. These estimates are inherently uncertain and unpredictable. In addition, unanticipated events and circumstances may occur which may affect the accuracy or validity of these estimates.
Goodwill and Intangible Assets
The Company tests goodwill and indefinite-lived intangible assets for impairment annually on the first day of the fourth fiscal quarter of each year, or whenever events or changes in circumstances indicate impairment may
F-12
Table of Contents
Index to Financial Statements
NEWGISTICS, INC. AND SUBSIDIARIES
NOTES TO CONSOLIDATED FINANCIAL STATEMENTS
2. Summary of Significant Accounting Policies (continued)
have occurred. Factors the Company considers important that could trigger an impairment review include, but are not limited to, significant under-performance relative to projected future operating results, significant changes in the manner of its use of the acquired assets or overall business, and/or service offering strategies. The Company evaluates the impairment of goodwill using a two-step process. The first step involves a comparison of the fair value of a reporting unit with its carrying amount. If the carrying amount of the reporting unit exceeds its fair value, the second step of the process involves a comparison of the fair value and carrying amount of the goodwill of that reporting unit and determination of the impairment charge, if any. The Company evaluates other intangible assets with indefinite lives by estimating the fair value of those assets based on estimated future earnings derived from the assets using the income approach model. If the carrying amount of the other intangible assets with indefinite lives exceeds the fair value, the Company would recognize an impairment loss equal to the excess of the carrying value over fair value. If an event occurs that would cause the Company to revise its estimates and assumptions used in analyzing the value of its goodwill and other intangible assets with indefinite lives, the revision could result in a non-cash impairment charge that could have a material impact on the Company’s financial results. The Company has two reporting units and, accordingly, the impairment test is performed at each reporting unit level. There was no impairment of goodwill or intangible assets with indefinite lives in fiscal years 2010, 2009, or 2008.
Impairment of Long-Lived Assets
The Company tests long-lived assets for impairment when events or changes in circumstances may indicate that the carrying amount of an asset may not be recoverable. Recoverability of long-lived assets is measured by a comparison of the carrying amount of an asset to the undiscounted future net cash flows expected to be generated by the asset. If such assets are considered to be impaired, the impairment to be recognized is measured as an amount by which the carrying amount of the assets exceeds the discounted future net cash flows.
Stock-Based Compensation
The Company records stock-based compensation expense for stock options granted to employees based on the estimated fair value for the awards, using the Black-Scholes option pricing model on the date of grant. The Company recognizes expense over the requisite service period, which is generally the vesting period, on a straight-line basis. At each stock option grant date, the Company utilizes peer group data to calculate its expected volatility. Expected volatility is based on historical and expected volatility rates of publicly traded peers. The expected life of each option grant is calculated based on the weighted average of the remaining vested term and the remaining contractual life of each award. The risk-free interest rate is based on the U.S. treasury yield rate with a maturity corresponding to the expected option life assumed at the grant date. The Company estimates potential forfeitures of stock grants and adjusts compensation costs recorded accordingly. The estimate of forfeitures will be adjusted over the service period to the extent that actual forfeitures differ, or are expected to differ. Such changes in estimated forfeitures will be recognized through a cumulative catch-up adjustment in the period of change and will also impact the amount of stock compensation expense to be recognized in future periods. Changes to the underlying assumptions may have a significant impact on the underlying value of the stock options, which could have a material impact on the Company’s consolidated financial statements. The Company has granted stock options at exercise prices believed to be equal to or above the fair market value of its common stock. The fair market value of the common stock underlying stock options granted was determined by the Company’s Board of Directors, with input from management and consideration of contemporaneous third-party valuations.
F-13
Table of Contents
Index to Financial Statements
NEWGISTICS, INC. AND SUBSIDIARIES
NOTES TO CONSOLIDATED FINANCIAL STATEMENTS
2. Summary of Significant Accounting Policies (continued)
Net Income (Loss) Per Share and Pro Forma Net Income Per Share
Net income (loss) per share is presented in conformity with the two-class method required for participating securities. In the event a dividend is paid on common stock, holders of all outstanding series of convertible preferred stock, including preferred stock warrants, are entitled to a proportionate share of any such dividend as if they were holders of common shares (on an as-if converted basis). Accordingly, all of the Company’s outstanding series of convertible preferred stock and warrants for the purchase of its convertible preferred stock are considered to be participating securities. As of January 1, 2011, January 2, 2010, and January 3, 2009, the Company’s outstanding preferred stock and warrants for preferred stock represented approximately 552,367,006 common shares on an as-if converted basis. For all periods presented, dividends attributable to holders of convertible preferred stock and preferred stock warrants were noncumulative. Under the two-class method, basic net income (loss) per share attributable to common stockholders is computed by dividing the net income (loss) attributable to common stockholders by the weighted average number of common shares outstanding during the period. Net income (loss) attributable to common stockholders is determined by allocating undistributed earnings between the holders of common stock, convertible preferred stock, and preferred stock warrants. Diluted net income (loss) per share attributable to common stockholders is computed by using the weighted average number of common shares outstanding, including potential dilutive shares of common stock assuming the dilutive effect of outstanding stock options and warrants using the treasury stock method, the two class method, or the if-converted method, whichever is more dilutive. For fiscal year 2008, outstanding stock options and warrants are anti-dilutive; therefore, diluted net loss per share is the same as basic net loss per share. For fiscal year 2009, the method that resulted in the most dilutive effect for the common stockholder was the two class method. For fiscal year 2010, the method that resulted in the most dilutive effect for the common stockholder was the if-converted method.
On March 3, 2011, warrants for the purchase of 185,873,115 shares of series E preferred stock were exercised via the redemption of 160,683 shares of series F preferred stock and accrued dividends thereon for an aggregate price of $23,126,333. In connection with the IPO, the remaining warrants for the purchase of preferred stock will expire or be converted to warrants for the purchase of common stock. Then in connection with the IPO, all of the Company’s outstanding preferred stock, except for series F preferred stock, will be automatically converted into 546,674,400 shares of common stock. The Company must redeem the remaining series F preferred stock in connection with the IPO. In the computation of basic and diluted historical earnings per share in fiscal years 2008, 2009, and 2010, the Company included the dilutive impact of series F preferred stock of 224,526,571, 221,018,344, and 172,502,122 shares, respectively. For fiscal year 2010 pro forma purposes, the Company did not include the dilutive impact of its series F preferred stock in the computation of fiscal year 2010 pro forma basic and diluted earnings per share because such preferred stock is required to be redeemed and not converted in connection with the IPO.
Pro forma basic and diluted net income per share attributable to common stockholders represents net income, as adjusted to exclude the change in fair value of preferred stock warrant liability, divided by the pro forma weighted average shares outstanding as though the conversion of the Company’s redeemable convertible preferred stock into common stock occurred on the earlier of the original issuance dates of the warrant or preferred stock. Pro forma diluted weighted average shares outstanding also reflects the effect of any dilutive stock options and warrants.
F-14
Table of Contents
Index to Financial Statements
NEWGISTICS, INC. AND SUBSIDIARIES
NOTES TO CONSOLIDATED FINANCIAL STATEMENTS
2. Summary of Significant Accounting Policies (continued)
The following table presents the calculation of basic and diluted net income (loss) per share attributable to common stockholders and pro forma basic and diluted net income per share (in thousands, except per share amounts):
| Fiscal Year | ||||||||||||
| 2008 | 2009 | 2010 | ||||||||||
| Basic: |
||||||||||||
| Net income |
$ | 3,821 | $ | 13,148 | $ | 21,430 | ||||||
| Deemed dividends on participating preferred stock |
(6,064 | ) | (4,106 | ) | 10,170 | |||||||
| Undistributed earnings allocated to participating preferred stock |
- | (8,250 | ) | (28,596 | ) | |||||||
| Net income (loss) attributable to common stockholders |
$ | (2,243 | ) | $ | 792 | $ | 3,004 | |||||
| Weighted average common shares used in computing basic net income (loss) per share |
74,321 | 74,357 | 76,156 | |||||||||
| Net income (loss) per share attributable to common stockholders |
$ | (0.03 | ) | $ | 0.01 | $ | 0.04 | |||||
| Diluted: |
||||||||||||
| Net income |
$ | 3,821 | $ | 13,148 | $ | 21,430 | ||||||
| Deemed dividends on participating preferred stock |
(6,064 | ) | (4,106 | ) | - | |||||||
| Undistributed earnings allocated to participating preferred stock |
- | (7,709 | ) | - | ||||||||
| Change in fair value of preferred stock warrant liability |
- | - | (7,262 | ) | ||||||||
| Net income (loss) attributable to common stockholders |
$ | (2,243 | ) | $ | 1,333 | $ | 14,168 | |||||
| Weighted average common shares used in computing basic net income (loss) per share |
74,321 | 74,357 | 76,156 | |||||||||
| Add weighted average effect of dilutive securities: |
||||||||||||
| Convertible preferred stock |
- | - | 724,623 | |||||||||
| Stock options |
- | 59,475 | 69,582 | |||||||||
| Weighted average common shares used in computing diluted net income (loss) per share |
74,321 | 133,832 | 870,361 | |||||||||
| Net income (loss) per share attributable to common stockholders |
$ | (0.03 | ) | $ | 0.01 | $ | 0.02 | |||||
| Pro Forma net income attributable to common stockholders (unaudited): |
||||||||||||
| Net income |
$ | 21,430 | ||||||||||
| Change in fair value of preferred stock warrant liability |
(7,262 | ) | ||||||||||
| Pro forma net income attributable to common stockholders |
$ | 14,168 | ||||||||||
| Shares used in computing pro forma net income per share attributable to common stockholders (unaudited) |
||||||||||||
| Basic: |
||||||||||||
| Basic weighted average common shares from above |
76,156 | |||||||||||
| Add shares in assumed conversion of convertible preferred stock |
552,121 | |||||||||||
| Shares used in computing pro forma basic net income per share attributable to common stockholders |
628,277 | |||||||||||
| Diluted: |
||||||||||||
| Basic weighted average common shares from above |
628,277 | |||||||||||
| Add stock options |
69,582 | |||||||||||
| Shares used in computing pro forma diluted net income per share attributable to common stockholders |
697,859 | |||||||||||
| Pro forma net income per share attributable to common stockholders (unaudited): |
||||||||||||
| Basic |
$ | 0.02 | ||||||||||
| Diluted |
$ | 0.02 | ||||||||||
F-15
Table of Contents
Index to Financial Statements
NEWGISTICS, INC. AND SUBSIDIARIES
NOTES TO CONSOLIDATED FINANCIAL STATEMENTS
2. Summary of Significant Accounting Policies (continued)
Recent Accounting Pronouncements
In October 2009, the FASB updated ASC Topic 605, “Revenue Recognition,” which amended the criteria for separating consideration in multiple-deliverable arrangements. The amendments establish a selling price hierarchy for determining the selling price of a deliverable. The selling price used for each deliverable will be based on vendor-specific objective evidence if available, third–party evidence if vendor-specific objective evidence is not available, or estimated selling price if neither vendor-specific objective evidence nor third-party evidence is available. The amendments will change the application of the residual method of allocation and require that arrangement consideration be allocated at the inception of the arrangement to all deliverables using the relative selling price method. The relative selling price method allocates any discount in the arrangement proportionally to each deliverable on the basis of each deliverable’s selling price. This update is effective prospectively for revenue arrangements entered into or materially modified in fiscal years beginning on or after June 15, 2010. Early adoption is permitted. The Company believes the impact of adoption of this update will not have a material effect on its financial position or results of operations.
In January 2010, the FASB updated ASC Topic 820, “Fair Value Measurements and Disclosures,” which requires additional disclosures and clarifies existing disclosures regarding fair value measurements. The additional disclosures include (i) transfers in and out of Levels 1 and 2 and (ii) activity in Level 3 fair value measurements. The update provides amendments that clarify existing disclosures on (i) level of disaggregation and (ii) disclosures about inputs and valuation techniques. This update is effective for interim and annual reporting periods beginning after December 15, 2009, except for the disclosures about purchases, sales, issuances, and settlements in the roll forward of activity in Level 3 fair value measurements. These disclosures are effective for fiscal years beginning after December 15, 2010, and for interim periods within those fiscal years. The Company adopted the update on January 3, 2010 as required and concluded it did not have a material impact on its consolidated financial position or results of operations.
3. Property and Equipment
Property and equipment consist of the following (in thousands):
| January 2, 2010 |
January 1, 2011 |
|||||||
| Computer equipment |
$ | 4,020 | $ | 4,325 | ||||
| Construction in progress |
167 | 775 | ||||||
| Purchased and Internally Developed Software |
5,634 | 6,232 | ||||||
| Furniture and fixtures |
537 | 541 | ||||||
| Equipment |
1,819 | 2,340 | ||||||
| Leasehold improvements |
244 | 278 | ||||||
| 12,421 | 14,491 | |||||||
| Accumulated depreciation |
(7,701 | ) | (10,008 | ) | ||||
| $ | 4,720 | $ | 4,483 | |||||
Depreciation expense for property and equipment was $0.9 million, $1.8 million, and $2.5 million for fiscal year 2010, 2009, and 2008, respectively.
F-16
Table of Contents
Index to Financial Statements
NEWGISTICS, INC. AND SUBSIDIARIES
NOTES TO CONSOLIDATED FINANCIAL STATEMENTS
4. Goodwill and Intangible Assets
The Company’s intangible assets consist primarily of intangible assets acquired in business combinations. Intangible assets by operating segment are as follows (in thousands):
| Intangible Asset |
Estimated Useful Life |
Original Estimated Value |
Accumulated Amortization as of January 2, 2010 |
Net Balance as of January 2, 2010 |
Accumulated Amortization as of January 1, 2011 |
Net Balance as of January 1, 2011 |
||||||||||||||||||
| Freight Services: |
||||||||||||||||||||||||
| Customer and carrier relationships |
9 | $ | 9,487 | $ | 2,961 | $ | 6,526 | $ | 4,015 | $ | 5,472 | |||||||||||||
| Developed technology |
4 | 1,992 | 1,399 | 593 | 1,897 | 95 | ||||||||||||||||||
| Non-compete agreements |
3 | 1,108 | 1,038 | 70 | 1,108 | – | ||||||||||||||||||
| 12,587 | 5,398 | 7,189 | 7,020 | 5,567 | ||||||||||||||||||||
| Goodwill |
Indefinite | 2,817 | - | 2,817 | - | 2,817 | ||||||||||||||||||
| Total Freight Services |
$ | 15,404 | $ | 5,398 | $ | 10,006 | $ | 7,020 | $ | 8,384 | ||||||||||||||
| Parcel Solutions: |
||||||||||||||||||||||||
| Customer and carrier relationships |
7 | $ | 2,274 | $ | 650 | $ | 1,624 | $ | 975 | $ | 1,299 | |||||||||||||
| Non-compete agreements |
4 | 350 | 175 | 175 | 263 | 87 | ||||||||||||||||||
| Trademarks |
Indefinite | 120 | - | 120 | - | 120 | ||||||||||||||||||
| 2,744 | 825 | 1,919 | 1,238 | 1,506 | ||||||||||||||||||||
| Goodwill |
Indefinite | 3,727 | - | 3,727 | - | 3,727 | ||||||||||||||||||
| Total Parcel Solutions |
$ | 6,471 | $ | 825 | $ | 5,646 | $ | 1,238 | $ | 5,233 | ||||||||||||||
| Total |
$ | 21,875 | $ | 6,223 | 15,652 | $ | 8,258 | $ | 13,617 | |||||||||||||||
For definite-lived intangible assets, the Company records amortization expense straight-line over the useful life of the respective asset. Amortization of intangible assets during fiscal year 2010, 2009, and 2008 was $2.0 million, $2.3 million, and $2.3 million, respectively.
Future estimated amortization expense of intangible assets as of January 1, 2011 is as follows (in thousands):
| Fiscal 2011 |
$ | 1,596 | ||
| Fiscal 2012 |
1,382 | |||
| Fiscal 2013 |
1,382 | |||
| Fiscal 2014 |
1,382 | |||
| Fiscal 2015 |
1,057 | |||
| Thereafter |
216 | |||
| Total |
$ | 7,015 | ||
F-17
Table of Contents
Index to Financial Statements
NEWGISTICS, INC. AND SUBSIDIARIES
NOTES TO CONSOLIDATED FINANCIAL STATEMENTS
5. Acquisitions
Cornerstone Acquisition
The Company accounts for acquisitions in accordance with ASC Topic 805, with the results of operations attributable to each acquisition included in the consolidated financial statements from the date of acquisition.
On December 31, 2007 (fiscal 2008), the Company acquired all of the outstanding capital stock of Cornerstone Shipping Solutions, or Cornerstone, a provider of parcel delivery and consolidation solutions which leverages the USPS network and utilizes a “zone skipping” strategy to provide competitive pricing and service. The acquisition was funded through debt and existing cash.
The acquisition of Cornerstone enabled the Company to supplement its parcel return solutions with parcel delivery solutions, allowing the Company to offer a highly customized forward and reverse parcel transportation solution.
The acquisition of Cornerstone has been accounted for as a purchase business combination. Assets acquired and liabilities assumed were recorded at fair values as of December 31, 2007. The total purchase price was $7.2 million, including $0.1 million for acquisition-related transaction costs.
The Company obtained a third-party valuation of certain intangible assets in order to allocate the purchase price.
The final purchase price allocation was as follows (in thousands):
| Net assets |
$ | 507 | ||
| Deferred tax assets |
369 | |||
| Intangibles: |
||||
| Customer relationships (7 year useful life) |
2,274 | |||
| Non-compete agreements (4 year useful life) |
350 | |||
| Goodwill (nondeductible) |
3,727 | |||
| Total |
$ | 7,227 | ||
6. Senior Secured Credit Facility
Borrowings outstanding at January 1, 2011 and January 2, 2010, consisted of the following (in thousands):
| January 2, 2010 |
January 1, 2011 |
|||||||
| Term Note due April 9, 2012, payable in monthly installments, including interest at prime with quarterly adjustment based on Funded Debt/EBITDA |
$ | 12,898 | $ | - | ||||
| Less debt discount |
(139 | ) | - | |||||
| Line of credit |
4,500 | - | ||||||
| 17,259 | - | |||||||
| Less current portion |
4,983 | - | ||||||
| Long-term portion |
$ | 12,276 | $ | - | ||||
F-18
Table of Contents
Index to Financial Statements
NEWGISTICS, INC. AND SUBSIDIARIES
NOTES TO CONSOLIDATED FINANCIAL STATEMENTS
6. Senior Secured Credit Facility (continued)
Prior Credit Facility
The Company had a $7.8 million line of credit with Comerica Bank, or the Bank. The line of credit was secured by all the assets of the Company. Available amounts under the revolving line of credit were calculated against a borrowing base. The borrowing base was limited to 80% of the net amount of eligible accounts receivable, as defined in the agreement. At January 1, 2011 and January 2, 2010, the Company had $0 and $4.5 million outstanding on the revolving line of credit, respectively. The revolving line of credit bore interest at a variable rate equal to the greater of the bank’s prime rate plus 1% and 6% (6.00% and 6.00% at January 1, 2011 and January 2, 2010, respectively).
On December 31, 2007, the Company issued a term note payable, or the Term Note, in the amount of $22.6 million. Payments were to be made monthly based on a five year amortization (principal plus interest) beginning in February 2008. An excess cash flow recapture requirement of 50% of earnings after tax plus interest and non-cash expenses less cash capital expenditures (including any capitalization of software) and scheduled principal payments on all indebtedness was to be paid on an annual basis beginning December 31, 2008.
Interest was based on the following Funded Debt/EDITDA table and was adjusted quarterly.
| Funded Debt/EBITDA |
Funded Debt/EBITDA | Funded Debt/EBITDA | ||
| ³2.50x |
< 2.50 and ³ 1.50 | < 1.50 | ||
| Prime + 0.75 |
Prime + 0.00 | Prime – 0.50 |
As an additional consideration to lend, the Bank received a warrant representing 1,129,240 shares of series E preferred stock at an exercise price of $0.12442 per share, which was recorded as a discount on the Term Note.
In March 2009, the Company executed an amendment to the Term Note with the Bank, in which the covenant defaults which occurred during the period from September 2008 through February 2009 were waived. Additionally, the amendment called for certain adjustments to the payment schedule and excess cash flow recapture requirement.
In December 2010, the Company paid all amounts outstanding on the Prior Credit Facility in full.
Current Credit Facility
On March 7, 2011, the Company terminated its Prior Credit Facility and established a new senior secured credit facility, the Current Credit Facility, with Comerica Bank. The Company’s Current Credit Facility is secured by substantially all of its assets and consists of an $8.0 million revolving credit facility. Available amounts under the Current Credit Facility are calculated against a borrowing base, which is limited to 80% of the net amount of eligible accounts receivable, as defined in the Current Credit Facility agreement.
Loans outstanding under the Company’s Current Credit Facility bear interest per annum at a rate equal to the greater of (i) the prime rate of Comerica Bank plus 1%, or (ii) LIBOR plus 2.5%. The fee in respect to non-use of available funds is 0.125%, with no utilization-based decrease and is payable monthly.
The Company’s Current Credit Facility contains customary affirmative covenants regarding, among other things, the delivery of financial and other information to Comerica Bank, maintenance of records, compliance with law, maintenance of property and insurance and conduct of the Company’s existing business. The
F-19
Table of Contents
Index to Financial Statements
NEWGISTICS, INC. AND SUBSIDIARIES
NOTES TO CONSOLIDATED FINANCIAL STATEMENTS
6. Senior Secured Credit Facility (continued)
Company’s Current Credit Facility includes covenants regarding events of default (and related remedies, including acceleration of the loans made thereunder) that are customary for a facility of this type, including payment default, covenant default, cross-default to other indebtedness, material inaccuracy of representations and warranties, bankruptcy and involuntary proceedings, change in control and judgment default. Many of the defaults are subject to certain materiality thresholds and grace periods usual for a facility of this type.
7. Commitments and Contingencies
Lease Commitments
The Company is obligated under operating lease agreements covering the Company’s office and warehouse facilities and certain equipment. The operating leases expire at various times through 2014. Rental expense for all operating leases was approximately $2.5 million, $2.2 million, and $1.4 million for fiscal years 2010, 2009, and 2008, respectively. Future minimum payments under noncancelable leases as of January 1, 2011 are as follows (in thousands):
| Fiscal Year |
Total | |||
| 2011 |
$ | 2,090 | ||
| 2012 |
1,055 | |||
| 2013 |
597 | |||
| 2014 |
199 | |||
| 2015 |
21 | |||
| Total |
$ | 3,962 | ||
Employment Agreements
Certain of the Company’s executive officers are entitled to certain payments if they are terminated without cause. Upon termination without cause, each of such officers is entitled to receive an amount equal to three to twelve months of such officers’ base salary in a single payment or series of payments following termination of employment. Certain officers will be entitled to continue to receive coverage under medical and dental benefit plans for three to twelve months or, with respect to certain of such officers, until such officers are covered under a separate plan from another employer. Upon termination other than for cause following a change in control, each of such officers are entitled to the same benefits as upon termination without cause and will also be entitled to certain acceleration of such officers’ outstanding unvested options at the time of such termination. The aggregate amount payable to the Company’s executive officers under the employment agreements in the event of termination without cause or termination other than for cause following a change of control is approximately $1.0 million.
Legal Proceedings
The Company is involved in various legal proceedings arising in the ordinary course of conducting business. The Company believes that the ultimate outcome of such matters, in the aggregate, will not have a material adverse impact on its financial position, liquidity or results of operations. As of January 1, 2011, the Company does not believe any reserves are necessary.
F-20
Table of Contents
Index to Financial Statements
NEWGISTICS, INC. AND SUBSIDIARIES
NOTES TO CONSOLIDATED FINANCIAL STATEMENTS
7. Commitments and Contingencies (continued)
Indemnification
The Company has agreed to indemnify its directors and executive officers for costs associated with any fees, expenses, judgments, fines and settlement amounts incurred by any of these persons in any action or proceeding to which any of those persons is, or is threatened to be, made a party by reason of the person’s service as a director or officer, including any action by the Company, arising out of that person’s services as the Company’s director or officer or that person’s services provided to any other company or enterprise at the Company’s request. The Company maintains director and officer insurance coverage that would generally enable the Company to recover a portion of any future amounts paid. No expense has been incurred to date for such indemnity obligations.
8. Income Taxes
The components of the provision (benefit) for income taxes attributable to continuing operations are as follows for fiscal year 2008, 2009 and 2010 (in thousands):
| Fiscal Year | ||||||||||||
| 2008 | 2009 | 2010 | ||||||||||
| Income tax provision (benefit): |
||||||||||||
| Current: |
||||||||||||
| Federal |
$ | 36 | $ | 140 | $ | 253 | ||||||
| State |
309 | 406 | 740 | |||||||||
| Total current |
345 | 546 | 993 | |||||||||
| Deferred: |
||||||||||||
| Federal |
(1,962 | ) | (4,600 | ) | (2,558 | ) | ||||||
| State |
- | - | - | |||||||||
| Total deferred |
(1,962 | ) | (4,600 | ) | (2,558 | ) | ||||||
| Total provision (benefit) |
$ | (1,617 | ) | $ | (4,054 | ) | $ | (1,565 | ) | |||
As of January 1, 2011 the Company had federal net operating loss carryforwards of approximately $36.5 million. The net operating losses carryforwards will expire at various dates beginning in 2020, if not utilized. The Company also has a federal alternative minimum tax, or AMT, credit of $0.5 million which has an indefinite carryforward.
Utilization of the net operating losses and credit carryforwards may be subject to a substantial annual limitation due to the “change in ownership” provisions of the Internal Revenue Code of 1986. The annual limitation may result in the expiration of net operating losses and credit carryforwards before utilization.
Deferred income taxes reflect the net tax effects of temporary differences between the carrying amounts of assets and liabilities for financial reporting purposes and the amounts used for income tax purposes.
F-21
Table of Contents
Index to Financial Statements
NEWGISTICS, INC. AND SUBSIDIARIES
NOTES TO CONSOLIDATED FINANCIAL STATEMENTS
8. Income Taxes (continued)
Significant components of the Company’s deferred taxes are as follows (in thousands):
| January 2, 2010 |
January 1, 2011 |
|||||||
| Deferred tax liabilities: |
||||||||
| Prepaid expenses and other |
$ | (464 | ) | $ | (535 | ) | ||
| Depreciable assets |
- | (89 | ) | |||||
| Total deferred tax liabilities |
(464 | ) | (624 | ) | ||||
| Deferred tax assets: |
||||||||
| Depreciable assets |
190 | - | ||||||
| Tax carryforwards |
17,424 | 13,345 | ||||||
| Accrued expenses and other |
129 | 544 | ||||||
| Total deferred tax assets |
17,743 | 13,889 | ||||||
| Net deferred tax asset |
17,279 | 13,265 | ||||||
| Valuation allowance for deferred tax asset |
(6,572 | ) | - | |||||
| Net deferred taxes |
$ | 10,707 | $ | 13,265 | ||||
The valuation allowance decreased by approximately $6.6 million, $6.9 million, and $3.9 million during fiscal years 2010, 2009, and 2008, respectively. The decreases in the Company’s valuation allowance were due to the Company’s increased expectation of realization of its deferred tax assets, which consist primarily of net operating loss carryforwards, as a result of the improved outlook of its taxable income. As of January 1, 2011, no valuation allowance for net deferred tax assets remains.
The Company’s provision (benefit) for income taxes attributable to continuing operations differs from the expected tax expense (benefit) amount computed by applying the statutory federal income tax rate of 35% to income from continuing operations before income taxes in fiscal year 2010, 2009, and 2008, primarily as a result of the following:
| Fiscal Year | ||||||||||||
| 2008 | 2009 | 2010 | ||||||||||
| Federal statutory rate |
35.0 | % | 35.0 | % | 35.0 | % | ||||||
| State taxes, net of federal benefit |
8.0 | 3.9 | 2.9 | |||||||||
| Decrease in deferred tax valuation allowance |
(127.9 | ) | (75.8 | ) | (33.1 | ) | ||||||
| Permanent items |
8.2 | (8.7 | ) | (11.8 | ) | |||||||
| Other |
3.3 | 1.1 | (0.9 | ) | ||||||||
| (73.4 | )% | (44.5 | )% | (7.9 | )% | |||||||
Effective December 29, 2007 (fiscal 2008), the Company adopted a new accounting standard relating to the accounting for uncertain tax positions. The Company recorded no additional tax liability as a result of the adoption of this standard and no adjustments to the December 29, 2007 balance of retained earnings.
The Company’s practice is to recognize interest and/or penalties related to income tax matters in income tax expense. During fiscal year 2010, 2009, and 2008, the Company did not recognize any interest or penalties related to uncertain tax provisions.
F-22
Table of Contents
Index to Financial Statements
NEWGISTICS, INC. AND SUBSIDIARIES
NOTES TO CONSOLIDATED FINANCIAL STATEMENTS
8. Income Taxes (continued)
The Company and its subsidiaries file income tax returns in the U.S. federal, state, and local jurisdictions. The Company is no longer subject to U.S. federal income tax examinations for years before 2007 and is no longer subject to state and local income tax examinations by tax authorities for years before 2007. The Company is not currently under audit in any jurisdictions.
9. Stockholders’ Deficit
Redeemable Convertible Preferred Stock
The following is a summary of redeemable convertible preferred stock issued by the Company (in thousands, except share amounts).
| Number of Shares Authorized |
Shares Issued and Outstanding | Aggregate Liquidation Preference at January 1, 2011 |
||||||||||||||
| January 2, 2010 |
January 1, 2011 |
|||||||||||||||
| Series A |
10,200,000 | 10,190,000 | 10,190,000 | $ | 5,095 | |||||||||||
| Series AA |
13,000,000 | 13,000,000 | 13,000,000 | 6,500 | ||||||||||||
| Series B |
40,322,580 | 40,322,580 | 40,322,580 | 8,468 | ||||||||||||
| Series B-1 |
13,905,913 | 13,611,895 | 13,611,895 | 2,859 | ||||||||||||
| Series BB-1 |
57,452,573 | 57,452,573 | 57,452,573 | 12,065 | ||||||||||||
| Series C |
9,191,992 | 9,191,992 | 9,191,992 | 1,930 | ||||||||||||
| Series CC |
100,698,118 | 100,698,118 | 100,698,118 | 21,147 | ||||||||||||
| Series D |
33,113,647 | 33,113,647 | 33,113,647 | 6,953 | ||||||||||||
| Series E |
250,000,000 | 32,366,292 | 35,952,934 | 7,550 | ||||||||||||
| Series F |
245,700 | 245,700 | 245,700 | 35,363 | ||||||||||||
| 528,130,523 | 310,192,797 | 313,779,439 | $ | 107,930 | ||||||||||||
On December 31, 2004, the Company issued 245,700 shares of series F preferred stock at $100.00 per share. Cumulative dividends accrued on the series F preferred stock at a rate of 18% per year, compounded annually, prior and in preference to any payment of dividends on other series of preferred stock or on the common stock. Pursuant to the amendment of the sixth amended and restated certificate of incorporation, no dividends were accrued after March 9, 2007. As of January 2, 2010 and January 1, 2011 there were $10,792,935 dividends in arrears related to the series F preferred stock.
Noncumulative dividends are paid to the series A, AA, B, B-1, BB-1, C, CC, D and E preferred stockholders only if declared by the Board of Directors, or the Board, at the rate of $0.04, $0.04, $0.012, $0.012, $0.012, $0.0058, $0.0058, $0.00995 and $0.00995 per share, respectively, prior and in preference to any payment of dividends to the common stockholders. No dividends may be declared or paid on the series A, AA, B, B-1, BB-1, or C preferred stock until the full preferential amounts specified on the Company’s sixth amended and restated certificate of incorporation for the series CC, D and E preferred stockholders have been paid or declared and irrevocably set apart. In addition, no dividends may be declared or paid on the series A, B, B-1 or C preferred stock until the full preferential amounts specified on the Company’s sixth amended and restated certificate of incorporation for the series AA and BB-1 preferred stockholders have been paid or declared and irrevocably set apart. Finally, no dividends may be declared or paid on the series A, B, or B-1 preferred stock until the full preferential amounts specified on the Company’s sixth amended and restated certificate of incorporation for the series C preferred stockholders have been paid or declared and irrevocably set apart.
F-23
Table of Contents
Index to Financial Statements
NEWGISTICS, INC. AND SUBSIDIARIES
NOTES TO CONSOLIDATED FINANCIAL STATEMENTS
9. Stockholders’ Deficit (continued)
In the event of a liquidation, dissolution or winding up of the Company, or a Liquidation Event, the series A, B and B-1 preferred stockholders, on a pari passu basis, are entitled to receive a distribution equal to the greater of (i) $0.50, $0.1488 and $0.1488 per share, respectively, plus all declared but unpaid dividends, or (ii) the amount such holder would have received had such holder converted such shares into common stock immediately prior to such liquidation, dissolution or winding up, before any distribution may be made to the common stockholders. In the event of a Liquidation Event, the series C preferred stockholders, prior and in preference to holders of common stock or series A, B and B-1 preferred stock, are entitled to receive a distribution equal to the greater of (i) $0.0728 per share plus all declared but unpaid dividends, or (ii) the amount such holder would have received had such holder converted such shares into common stock immediately prior to such liquidation, dissolution or winding up, before any distribution may be made to the common stockholders or series A, B or B-1 preferred stockholders.
In the event of a Liquidation Event, the series AA and BB-1 preferred stockholders, on a pari passu basis and prior and in preference to holders of common stock or series A, B, B-1 or C preferred stock, are entitled to receive a distribution equal to the greater of (i) $0.50 and $0.1488 per share, respectively, plus all declared but unpaid dividends, or (ii) the amount such holder would have received had such holder converted such shares into common stock immediately prior to such liquidation, dissolution or winding up, before any distribution may be made to the common stockholders or series A, B, B-1, or C preferred stockholders. In the event of a liquidation event, the series CC, D and E preferred stockholders, on a pari passu basis and prior and in preference to holders of series A, B, B-1, C, AA or BB-1 preferred stock, are entitled to receive a distribution equal to the greater of (i) $0.0728, $0.12442 and $0.12442 per share, respectively, plus all declared but unpaid dividends, or (ii) the amount such holder would have received had such holder converted such shares into common stock immediately prior to such liquidation, dissolution or winding up, before any distribution may be made to the common stockholders or the series A, B, B-1, C, AA, BB-1 or C preferred stockholders. In the event of a liquidation event, the series F preferred stockholders, prior and in preference to holders of series A, B, B-1, C, AA, BB-1, CC, D or E preferred stock, are entitled to receive a distribution equal to $100.00 per share plus an amount equal to all declared but unpaid dividends on such share. All distribution rates per share are subject to adjustment as provided in the Company’s Sixth Amended and Restated Certificate of Incorporation.
The series F preferred stock is redeemable at the election of the holders of a majority of the series F preferred stock, or the Series F Election. The redemption price is $35.4 million which is equal to the original issue price plus accrued or declared but unpaid dividends. The preferred stock (other than the series F preferred stock) is mandatorily redeemable at the election of the preferred stockholders after the Series F Election. The redemption price is the greater of (i) the original price plus any accrued but unpaid dividends, or (ii) the fair market value of the applicable series of preferred stock at the redemption date. The Company, however, shall not make any redemption payment without the written consent of the Company’s debt holder.
The preferred stock may be converted into common stock at the option of each preferred stockholder at any time as provided in the Company’s sixth amended and restated certificate incorporation. All of the shares of preferred stock, except series F, will automatically convert to common stock (i) in the event of a qualified public offering, as defined in the related agreement, in which aggregate proceeds of such an offering exceed $25,000,000, or (ii) upon written consent of the holders of at least a majority of the outstanding shares of preferred stock (on an as converted to common stock basis). The conversion rate for the series A, AA, B, B-1, BB-1, C, CC, D and E preferred stock is presently 2.4606, 2.4606, 1.0, 1.1885, 1.1885, 1.0, 1.0, 1.0 and 1.0 shares, respectively, of common stock for one share of respective preferred stock. The conversion rate may be adjusted as provided in the Company’s sixth amended and restated certificate of incorporation. The series F
F-24
Table of Contents
Index to Financial Statements
NEWGISTICS, INC. AND SUBSIDIARIES
NOTES TO CONSOLIDATED FINANCIAL STATEMENTS
9. Stockholders’ Deficit (continued)
preferred stock is convertible into shares of common stock at the fair market value of the common stock at the date of conversion. In the event of a qualified public offering, the series F preferred stock must be redeemed by the Company.
The holders of series A, AA, B, B-1, C, CC, D and E preferred stock are entitled to one vote for each share of common stock into which such share of series A, AA, B, B-1, BB-1, C, CC, D and E preferred stock could then be converted. The series F preferred stock does not vote with the common stock or other series of preferred stock, but does have a separate class vote on certain matters.
Common Stock
The Company has authorized 900,000,000 shares of common stock as of January 1, 2011, of which 57,062,008 shares have been reserved for the conversion of the series A and series AA preferred stock, 124,782,587 shares have been reserved for the conversion of the series B, series B-1 and series BB-1 preferred stock, 109,890,110 shares have been reserved for the conversion of the series C and series CC preferred stock, 33,113,647 shares have been reserved for the conversion of the series D preferred stock, 35,952,934 shares have been reserved for the conversion of the series E preferred stock and 142,120,000 shares have been reserved for issuance upon the exercise of stock options issuable under the 2000 Stock Plan (defined below). The Company has reserved 24,606 shares of common stock for the conversion of the series AA preferred stock issuable upon the exercise of warrants to purchase up to 10,000 shares of series AA preferred stock, 349,440 shares of common stock for the conversion of the series B-1 preferred stock issuable upon the exercise of warrants to purchase up to 294,018 shares of series B-1 preferred stock, and 190,945,975 shares of common stock for the conversion of the series E preferred stock issuable upon the exercise of warrants to purchase up to 190,945,975 shares of series E preferred stock.
Registration Rights
The Company has entered into an investors’ rights agreement dated as of September 30, 2002, as amended, with certain holders of the Company’s common and preferred stock. Subject to the terms of the agreement, holders of certain shares have piggyback registration rights and also have full registration rights, which includes demand registration rights, piggyback registration rights, and short-term registration rights. The registration rights will terminate, with respect to any particular stockholder, upon the earlier of (i) five years after the completion of the IPO, or (ii) for stockholders who own less than 2% of the Company’s common stock, any time after the IPO in which all registrable securities held by the particular stockholder may immediately be sold under Rule 144 during any 90-day period.
Preferred Stock Warrants
The Company has warrants outstanding to purchase shares of preferred stock expiring at various dates through December 2019 as presented in the table below. The fair value of these warrants is adjusted at each reporting period using the Black-Scholes pricing model using assumptions for expected volatility, risk-free interest rate; expected life; and expected dividend rate. In fiscal years 2010, 2009 and 2008, the Company recorded income in the amount of $7.3 million, $1.9 million, and $0 million, respectively, with respect to the revaluation of these warrants, respectively.
F-25
Table of Contents
Index to Financial Statements
NEWGISTICS, INC. AND SUBSIDIARIES
NOTES TO CONSOLIDATED FINANCIAL STATEMENTS
9. Stockholders’ Deficit (continued)
As of January 1, 2011, the Company had the following warrants for the purchase of preferred stock outstanding:
| Preferred Stock Series |
Number of Shares |
Exercise Price Per Share |
Issuance Date | Expiration Date | ||||||||
| Series A |
10,000 | $ | 0.50 | July 2000 | May 15, 2017 | |||||||
| Series B-1 |
294,018 | $ | 0.1488 | December 2000 | August 31, 2017 | |||||||
| Series E |
93,089,016 | $ | 0.12442 | April 2003 | April 11, 2013 | |||||||
| Series E |
36,299 | $ | 0.12442 | July 2003 | April 11, 2013 | |||||||
| Series E |
46,486,397 | $ | 0.12442 | February 2004 | February 6, 2014 | |||||||
| Series E |
18,594,558 | $ | 0.12442 | September 2004 | April 13, 2013 | |||||||
| Series E |
27,739,322 | $ | 0.12442 | November 2004 | April 11, 2013 | |||||||
| Series E |
112,522 | $ | 0.12442 | April 2004 | April 12, 2016 | |||||||
| Series E |
3,758,621 | $ | 0.12442 | March 2007 | March 9, 2019 | |||||||
| Series E |
1,129,240 | $ | 0.12442 | December 2007 | December 31, 2019 | |||||||
On March 3, 2011, the holders of warrants to purchase 185,873,115 shares of our series E preferred stock exercised their warrants by tendering 160,683 shares of series F preferred stock with a redemption value equal to $23,126,333, the aggregate exercise price of the warrants.
Stock Incentive Plans
In July 2000, the Board approved the Company’s 2000 Stock Option/Issuance Plan, as amended, the 2000 Stock Plan. The 2000 Stock Plan provides for: (i) a discretionary option grant program under which eligible persons may be granted options to purchase shares of the Company’s common stock; and (ii) a stock issuance program under which eligible persons may be issued shares of the Company’s common stock directly.
Under the 2000 Stock Plan, stock options may be granted to Company employees (including officers and directors who are employees) and issued at an exercise price not less than 100% of the fair market value of the Company’s common stock at the date of grant, as determined by the Company’s Board, except for stock option grants to a stockholder that owns greater than 10% of the Company’s outstanding common stock in which case the exercise price per share cannot be less than 110% of the fair market value of the Company’s common stock at the date of grant. Options granted under the 2000 Stock Plan are exercisable no later than ten years from the date of grant, except for stock options granted to an individual who owns more than 10% of the voting stock at the date of grant, in which case the option term is five years from the date of grant. Generally, options issued under the 2000 Plan vest 25% one year from the vesting commencement date, and the remaining amount vests ratably over three years.
The stock issuance program under the 2000 Stock Plan allows eligible employees to purchase shares of the Company’s common stock at an exercise price not less than 85% of the fair market value of the Company’s common stock at the date of grant. Such shares may be fully vested when issued or may vest over time as the recipient renders services or as specified performance objectives are attained as determined by the Board.
The fair value of each option award is estimated on the date of grant, or modification, using the Black-Scholes option pricing model. In estimating fair value for new options issued under the 2000 Stock Plan, expected volatility was based completely on historical volatility of comparable publicly-traded companies. As the Company’s historical share option exercise experience does not provide a reasonable basis upon which to
F-26
Table of Contents
Index to Financial Statements
NEWGISTICS, INC. AND SUBSIDIARIES
NOTES TO CONSOLIDATED FINANCIAL STATEMENTS
9. Stockholders’ Deficit (continued)
estimate the expected term, it used the simplified approach to calculate the expected term. Expected life is calculated in two tranches based on the employment level defined as executive or employee. The risk-free rate used in calculating fair value is based on the U.S. Treasury yield bond curve in effect at the time of grant.
The assumptions used to calculate the fair value of options granted are evaluated and revised, as necessary, to reflect market conditions and experience. The following table presents the assumptions we used in calculating the fair value of employee stock options for fiscal year 2008, 2009, and 2010:
| Fiscal | ||||||
| 2008 | 2009 | 2010 | ||||
| Expected dividend yield |
0.00% | 0.00% | 0.00% | |||
| Risk-free interest rate |
2.78% – 3.30 |
1.87% – 2.46 |
1.41% – 2.48 | |||
| Expected life in years |
6 | 6 | 6 | |||
| Expected volatility |
33.4% | 53.9% | 38.9% – 49.2 | |||
For fiscal years 2010, 2009, and 2008, the weighted average grant-date fair value of stock options granted was $0.06, $0.05, and $0.03, respectively.
Total unrecognized stock-based compensation expense, related to unvested stock options under the 2000 Stock Plan, net of expected forfeitures, was $0.6 million as of January 1, 2011. We anticipate this expense to be recognized over a weighted average period of approximately 1.96 years.
A summary of option activity under the 2000 Stock Plan for fiscal year 2010, 2009, and 2008 is presented below:
| Number of Options |
Range of Exercise Prices |
Weighted – Average Exercise Price |
||||||||
| Options outstanding at December 29, 2007 |
108,907,548 | $0.05 –$0.09 | $ | 0.06 | ||||||
| Granted |
7,816,563 | 0.09 | 0.09 | |||||||
| Exercised |
(34,412 | ) | 0.05 | 0.05 | ||||||
| Forfeited |
(125,576 | ) | 0.05 | 0.05 | ||||||
| Options outstanding at January 3, 2009 |
116,564,123 | 0.05 – 0.09 | 0.06 | |||||||
| Granted |
2,500,000 | 0.12 | 0.12 | |||||||
| Exercised |
(13,425 | ) | 0.05 | 0.05 | ||||||
| Forfeited |
(526,875 | ) | 0.09 | 0.09 | ||||||
| Options outstanding at January 2, 2010 |
118,523,823 | 0.05 – 0.12 | 0.06 | |||||||
| Granted |
4,830,000 | 0.14 – 0.18 | 0.15 | |||||||
| Exercised |
(1,734,530 | ) | 0.05 | 0.05 | ||||||
| Forfeited |
(7,923,329 | ) | 0.05 – 0.09 | 0.06 | ||||||
| Options outstanding at January 1, 2011 |
113,695,964 | $0.05 – $0.18 | $ | 0.07 | ||||||
At January 1, 2011, 142,200,000 shares of common stock were reserved under the 2000 Stock Plan, of which 10,722,971 were available for future grants. The weighted average remaining contractual life of
F-27
Table of Contents
Index to Financial Statements
NEWGISTICS, INC. AND SUBSIDIARIES
NOTES TO CONSOLIDATED FINANCIAL STATEMENTS
9. Stockholders’ Equity (continued)
outstanding options was 5.13 years at January 1, 2011. The weighted average remaining contractual life of options currently exercisable was 4.86 years at January 1, 2011.
At January 2, 2010 and January 1, 2011, 107,063,355 and 105,183,030 outstanding options were vested, respectively. The weighted average exercise price of options currently exercisable at January 1, 2011 is $0.06.
10. Employee Benefit Plans
The Company sponsors a defined contribution plan in accordance with Section 401(k) of the Internal Revenue Code. The 401(k) plan is available to all full-time employees of the Company on the first day of the month following employment. The 401(k) plan is funded through employee contributions and a Company matching percentage. The Company matches 100% of employee contributions up to 3% of total employee compensation plus 50% of the next 2% of total employee compensation, for a total of a possible 4% match if the employee contributes 5%. The Company recorded expenses related to the 401(k) plan in the amount of $0.5 million, $0.5 million, and $0.3 million for fiscal years 2010, 2009, and 2008, respectively.
11. Material Unusual Event
In December 2008, the Company reached a settlement agreement with one of its customers regarding theft of that customer’s parcels while in the Company’s possession or in the possession of its contracted third-party carriers. The Company is disclosing this event due to the unusual nature and the scope related to the collusion involved in this theft. The financial effect on the income statement during fiscal 2008 was an increase in cost of service in the amount of $1.1 million and a corresponding increase in accrued liabilities. During fiscal 2009, the Company made efforts to recover all or a portion of this settlement expense, of which a total of $0.6 million was recovered.
12. Fair Value Measurements
In fiscal 2008 the Company adopted an accounting standard that defines fair value, establishes a framework for measuring fair value as well as expands on required disclosures regarding fair value measurements. This standard applies to reported balances that are required or permitted to be measured at fair value under existing accounting pronouncements; accordingly, the standard does not require any new fair value measurements of reported balances. The adoption of this standard did not have a material impact on the consolidated financial statements of the Company. The guidance establishes a fair value hierarchy that requires an entity to maximize the use of observable inputs and minimize the use of unobservable inputs when measuring fair value. A financial statement’s categorization within the fair value hierarchy is based upon the lowest level of input that is significant to the fair value measurement. The guidance establishes three levels of inputs that may be used to measure fair value:
Level 1 – Quoted prices in active markets for identical assets or liabilities.
Level 2 – Observable inputs other than Level 1 prices such as quoted prices for similar assets or liabilities; quoted prices in markets with insufficient volume or infrequent transactions (less active markets); or model-derived valuations in which all significant inputs are observable or can be derived principally from or corroborated by observable market data for substantially the full term of the assets or liabilities.
Level 3 – Unobservable inputs to the valuation methodology that are significant to the measurement of fair value of assets and liabilities.
F-28
Table of Contents
Index to Financial Statements
NEWGISTICS, INC. AND SUBSIDIARIES
NOTES TO CONSOLIDATED FINANCIAL STATEMENTS
The Company measures certain financial instruments at fair value on a recurring basis. As of January 1, 2011, those instruments were comprised of cash equivalents invested in money market mutual funds, interest rate swap, and preferred stock warrant liability. The fair value of the preferred stock warrant liability was estimated using the Black-Scholes valuation model. The fair value of these assets was determined using the following inputs at January 1, 2011 (in thousands).
| Total | Quoted prices in active markets for identical assets (Level 1) |
Significant other observable inputs (Level 2) |
Significant unobservable inputs (Level 3) |
|||||||||||||
| Cash |
$ | 2,132 | $ | 2,132 | $ | - | $ | - | ||||||||
| Interest rate swap |
(21 | ) | - | (21 | ) | - | ||||||||||
| Preferred stock warrant liability |
$ | (17,230 | ) | $ | - | $ | - | $ | 17,230 | |||||||
Changes in Level 3 assets measured at fair value on a recurring basis for fiscal 2010 were as follows:
| January 2, 2010 |
$ | 25,241 | ||
| Effect of warrant exercises |
(749 | ) | ||
| Realized (gains) losses, net |
(7,262 | ) | ||
| January 1, 2011 |
$ | 17,230 | ||
13. Operating Segments
The Company provides its services through two operating segments.
Parcel Solutions
The parcel solutions segment, which comprises 94% of the Company’s total revenue and 81% of its total gross profit, provides return and delivery transportation services for small parcels weighing up to 70 pounds and having maximum combined length and girth of 130 inches.
F-29
Table of Contents
Index to Financial Statements
NEWGISTICS, INC. AND SUBSIDIARIES
NOTES TO CONSOLIDATED FINANCIAL STATEMENTS
Freight Services
The freight services segment offers LTL and truckload brokerage services in all 50 states through a network of carrier partnerships.
Information for the Company’s reportable segments is as follows (in thousands). The accounting policies of the reportable segments are the same as the accounting policies of the Company. The Company allocates resources and evaluates the performance of segments based on sales, gross profit, and operating income.
| Parcel Solutions Segment |
Freight Services Segment |
Corporate | Total | |||||||||||||
| Fiscal 2008 |
||||||||||||||||
| Revenue |
$ | 119,592 | $ | 9,724 | — | $ | 129,316 | |||||||||
| Gross profit |
21,939 | 8,795 | — | 30,734 | ||||||||||||
| Income before income taxes |
3,007 | 859 | (1,662 | ) | 2,204 | |||||||||||
| Capital expenditures |
3,127 | 343 | — | 3,470 | ||||||||||||
| Depreciation and amortization expense |
1,239 | 1,970 | — | 3,209 | ||||||||||||
| Fiscal 2009 |
||||||||||||||||
| Revenue |
$ | 160,375 | $ | 8,339 | — | $ | 168,714 | |||||||||
| Gross profit |
29,555 | 7,115 | — | 36,670 | ||||||||||||
| Income before income taxes |
8,011 | 394 | 689 | 9,094 | ||||||||||||
| Capital expenditures |
2,829 | 54 | — | 2,883 | ||||||||||||
| Depreciation and amortization expense |
2,101 | 2,056 | — | 4,157 | ||||||||||||
| Fiscal 2010 |
||||||||||||||||
| Revenue |
$ | 164,892 | $ | 9,670 | — | $ | 174,562 | |||||||||
| Gross profit |
33,963 | 7,768 | — | 41,731 | ||||||||||||
| Income before income taxes |
12,195 | 1,192 | 6,478 | 19,865 | ||||||||||||
| Capital expenditures |
2,196 | 35 | — | 2,231 | ||||||||||||
| Depreciation and amortization expense |
2,740 | 1,760 | — | 4,500 | ||||||||||||
| Total assets as of January 2, 2010 |
$ | 26,862 | $ | 12,496 | 10,707 | $ | 50,065 | |||||||||
| Total assets as of January 1, 2011 |
24,750 | 10,239 | 13,265 | 48,254 | ||||||||||||
| Goodwill as of January 2, 2010 |
$ | 3,727 | $ | 2,817 | — | $ | 6,544 | |||||||||
| Goodwill as of January 1, 2011 |
3,727 | 2,817 | — | 6,544 | ||||||||||||
14. Subsequent Events
On March 7, 2011, the Company terminated its Prior Credit Facility and established a new senior secured credit facility, the Current Credit Facility, with Comerica Bank. The Current Credit Facility is secured by substantially all of the Company’s assets and consists of an $8.0 million revolving credit facility. Available amounts under the Current Credit Facility are calculated against a borrowing base, which is limited to 80% of the net amount of eligible accounts receivable, as defined in the Current Credit Facility agreement. See note 6 above for more information.
On March 3, 2011, the holders of warrants to purchase 185,873,115 shares of series E preferred stock exercised their warrants by tendering 160,683 shares of series F preferred stock with a fair value equal to $23,126,333, the aggregate exercise price of the warrants.
F-30
Table of Contents
Index to Financial Statements
NEWGISTICS, INC. AND SUBSIDIARIES
CONDENSED CONSOLIDATED BALANCE SHEET
(in thousands, except per share amounts)
(unaudited)
| April 2, 2011 |
Pro
Forma Stockholders’ Equity At April 2, 2011 |
|||||||
| Assets |
||||||||
| Current assets: |
||||||||
| Cash and cash equivalents |
$ | 4,545 | ||||||
| Accounts receivable, net of allowance of $263 |
12,569 | |||||||
| Prepaid expenses and other current assets |
2,765 | |||||||
| Total current assets |
19,879 | |||||||
| Property and equipment, net |
4,521 | |||||||
| Goodwill |
6,544 | |||||||
| Intangible assets, net |
6,579 | |||||||
| Deferred tax assets |
12,149 | |||||||
| Other assets |
1,282 | |||||||
| Total assets |
$ | 50,954 | ||||||
| Liabilities and stockholders’ deficit |
||||||||
| Current liabilities: |
||||||||
| Accounts payable |
$ | 6,345 | ||||||
| Accrued compensation |
1,635 | |||||||
| Accrued transportation costs |
1,955 | |||||||
| Other accrued liabilities |
1,843 | |||||||
| Total current liabilities |
11,778 | |||||||
| Convertible preferred stock warrant liability |
457 | $ | - | |||||
| Deferred rent, long term |
116 | |||||||
| Total liabilities |
12,351 | |||||||
| Redeemable convertible preferred stock (Note 5) |
123,837 | 12,237 | ||||||
| Stockholders’ deficit: |
||||||||
| Common Stock; $.001 par value; 900,000 shares authorized; 77,618 shares issued and outstanding at April 2, 2011 |
78 | 624 | ||||||
| Additional paid-in capital |
9,555 | 121,066 | ||||||
| Accumulated deficit |
(94,867 | ) | (94,867 | ) | ||||
| Total stockholders’ deficit |
(85,234 | ) | $ | 26,823 | ||||
| Total liabilities and stockholders’ deficit |
$ | 50,954 | ||||||
See accompanying notes to condensed consolidated financial statements
F-31
Table of Contents
Index to Financial Statements
NEWGISTICS, INC. AND SUBSIDIARIES
CONDENSED CONSOLIDATED STATEMENTS OF OPERATIONS
(in thousands, except per share amounts)
(unaudited)
| First Fiscal Quarter | ||||||||
| 2010 | 2011 | |||||||
| Revenue |
$ | 42,672 | $ | 50,927 | ||||
| Cost of revenue |
32,632 | 38,810 | ||||||
| Gross profit |
10,040 | 12,117 | ||||||
| Operating expenses: |
||||||||
| Selling, general and administrative |
6,458 | 7,816 | ||||||
| Research and development |
591 | 309 | ||||||
| Total operating expenses |
7,049 | 8,125 | ||||||
| Operating income |
2,991 | 3,992 | ||||||
| Other income (expense): |
||||||||
| Interest and other income |
9 | 1 | ||||||
| Change in fair value of interest rate swap |
34 | 21 | ||||||
| Change in fair value of preferred stock warrant liability |
1,432 | 126 | ||||||
| Interest expense, including amortization of debt discount |
(330 | ) | (25 | ) | ||||
| Other income (expense), net |
1,145 | 123 | ||||||
| Income before income taxes |
4,136 | 4,115 | ||||||
| Income tax benefit (expense) |
523 | (2,051 | ) | |||||
| Net income |
$ | 4,659 | $ | 2,064 | ||||
| Net income attributable to common stockholders: |
||||||||
| Basic |
$ | 687 | $ | 232 | ||||
| Diluted |
$ | 3,227 | $ | 1,938 | ||||
| Net income per share attributable to common stockholders: |
||||||||
| Basic |
$ | 0.01 | $ | 0.00 | ||||
| Diluted |
$ | 0.00 | $ | 0.00 | ||||
| Weighted-average shares used in computing net income per share attributable to common stockholders: |
||||||||
| Basic |
74,351 | 76,803 | ||||||
| Diluted |
892,414 | 759,937 | ||||||
| Pro forma net income attributable to common stockholders: |
||||||||
| Net income |
$ | 4,659 | $ | 2,064 | ||||
| Change in fair value of preferred stock warrant liability |
(1,432 | ) | (126 | ) | ||||
| Pro forma net income attributable to common stockholders |
$ | 3,227 | $ | 1,938 | ||||
| Pro forma net income per share attributable to common stockholders: |
||||||||
| Basic |
$ | 0.01 | $ | 0.00 | ||||
| Diluted |
$ | 0.00 | $ | 0.00 | ||||
| Pro forma weighted-average shares used in computing pro forma net income per share attributable to common stockholders: |
||||||||
| Basic |
626,472 | 628,924 | ||||||
| Diluted |
695,953 | 701,669 | ||||||
See accompanying notes to condensed consolidated financial statements
F-32
Table of Contents
Index to Financial Statements
NEWGISTICS, INC. AND SUBSIDIARIES
CONDENSED CONSOLIDATED STATEMENTS OF STOCKHOLDERS’ DEFICIT
(in thousands)
(unaudited)
| Common Stock | Additional Paid-in Capital |
Accumulated Deficit |
Total Stockholders’ Deficit |
|||||||||||||||||
| Shares | Amount | |||||||||||||||||||
| Balance at January 1, 2011 |
76,086 | $ | 76 | $ | 8,646 | $ | (96,931 | ) | $ | (88,209 | ) | |||||||||
| Exercise of stock options and issuance of common stock |
1,532 | 2 | 80 | - | 82 | |||||||||||||||
| Stock-based compensation expense |
- | - | 89 | - | 89 | |||||||||||||||
| Net effect of exercise of preferred stock warrants |
- | - | 740 | - | 740 | |||||||||||||||
| Net income |
- | - | - | 2,064 | 2,064 | |||||||||||||||
| Balance at April 2, 2011 |
77,618 | $ | 78 | $ | 9,555 | $ | (94,867 | ) | $ | (85,234 | ) | |||||||||
See accompanying notes to condensed consolidated financial statements
F-33
Table of Contents
Index to Financial Statements
NEWGISTICS, INC. AND SUBSIDIARIES
CONDENSED CONSOLIDATED STATEMENTS OF CASH FLOWS
(in thousands) (unaudited)
| First Fiscal Quarter | ||||||||
| 2010 | 2011 | |||||||
| Operating activities: |
||||||||
| Net Income |
$ | 4,659 | $ | 2,064 | ||||
| Adjustments to reconcile net income to net cash provided by operating activities: |
||||||||
| Depreciation and amortization |
1,141 | 1,148 | ||||||
| Provision for bad debt expense |
(14 | ) | 176 | |||||
| Stock-based compensation |
87 | 89 | ||||||
| Change in fair value of interest rate swap |
(34 | ) | (21 | ) | ||||
| Change in fair value of convertible preferred stock warrant liability |
(1,432 | ) | (126 | ) | ||||
| Noncash interest expense |
30 | (1 | ) | |||||
| Noncash deferred tax expense |
1,069 | 1,119 | ||||||
| Changes in operating assets and liabilities: |
||||||||
| Accounts receivable |
2,318 | (541 | ) | |||||
| Prepaid expenses and other current assets |
111 | (212 | ) | |||||
| Deferred IPO costs |
- | (1,243 | ) | |||||
| Other long-term assets |
48 | (38 | ) | |||||
| Accounts payable |
(632 | ) | 1,267 | |||||
| Accrued compensation |
(863 | ) | (1,211 | ) | ||||
| Accrued transportation costs |
(790 | ) | 90 | |||||
| Other accrued liabilities |
(1,545 | ) | 463 | |||||
| Net cash provided by operating activities |
4,153 | 3,023 | ||||||
| Investing activities: |
||||||||
| Proceeds from sales of property and equipment |
2 | - | ||||||
| Capitalization of internal use software |
- | (323 | ) | |||||
| Purchases of property and equipment |
(163 | ) | (369 | ) | ||||
| Net cash used in investing activities |
(161 | ) | (692 | ) | ||||
| Financing activities: |
||||||||
| Borrowings (payments) on Term Note |
(2,121 | ) | - | |||||
| Borrowings (payments) on Prior Credit Facility |
(4,791 | ) | - | |||||
| Proceeds from issuance of shares of common stock |
- | 82 | ||||||
| Net cash (used in) provided by financing activities |
(6,912 | ) | 82 | |||||
| Net change in cash |
(2,920 | ) | 2,413 | |||||
| Cash, beginning of year |
3,193 | 2,132 | ||||||
| Cash, end of year |
$ | 273 | $ | 4,545 | ||||
| Supplemental disclosure of cash flow information: |
||||||||
| Interest payments |
$ | 267 | $ | 26 | ||||
| Income tax payments |
$ | 313 | $ | 380 | ||||
See accompanying notes to condensed consolidated financial statements
F-34
Table of Contents
Index to Financial Statements
NEWGISTICS, INC. AND SUBSIDIARIES
NOTES TO CONDENSED CONSOLIDATED FINANCIAL STATEMENTS
(UNAUDITED)
1. Basis of Presentation and Principles of Consolidation
The accompanying unaudited condensed consolidated financial statements have been prepared by Newgistics, Inc. (the “Company” or “Newgistics”) in accordance with United States generally accepted accounting principles (“GAAP”) for interim financial information and the rules and regulations of the Securities and Exchange Commission (“SEC”). Accordingly, they do not include all of the information and footnotes required by GAAP for complete financial statements. The condensed consolidated financial statements include the accounts of the Company and its wholly-owned subsidiaries. All significant intercompany accounts and transactions have been eliminated in consolidation. In the opinion of management, all adjustments (consisting of normal recurring entries) considered necessary for a fair presentation have been included. Operating results for the three months ended April 2, 2011 are not necessarily indicative of the results that may be expected for the year ending December 31, 2011. These financial statements should be read in conjunction with the audited Consolidated Financial Statements and notes thereto for the year ended January 1, 2011, included in the Company’s Registration Statement on Form S-1.
No material subsequent events have occurred since April 2, 2011 that requires recognition or disclosure in these financial statements.
Unaudited Pro Forma Stockholders’ Equity
The Company has filed a Registration Statement on Form S-1 with the United States Securities and Exchange Commission, or the SEC, for its proposed initial public offering of shares of its common stock, or the IPO. On March 3, 2011, warrants to purchase 185,873,115 shares of series E preferred stock were exercised via the redemption of 160,683 shares of series F preferred stock and accrued dividends thereon for an aggregate price of $23,126,333. In connection with the contemplated IPO, the remaining preferred stock warrants will be converted to common stock warrants. If the IPO contemplated is consummated, all of the series A, AA, B, B-1, BB-1, C, CC, D and E convertible preferred stock outstanding, including shares issued upon exercise of warrants, automatically will convert into 546,674,400 shares of common stock based on the shares of convertible preferred stock outstanding. Although the series F preferred stock is convertible into common stock, such preferred stock must be redeemed in the event of an IPO and, accordingly, such preferred shares have not been included in the pro forma presentation. In addition, the preferred stock warrant liability with respect to outstanding warrants will be reclassified to additional paid-in capital immediately prior to the effectiveness of the registration statement. Unaudited pro forma stockholders’ equity, as adjusted for the conversion of outstanding shares of convertible preferred stock into common stock and the reclassification of the preferred stock warrant liability, is set forth on the condensed consolidated balance sheet. The calculation of the April 2, 2011 pro forma stockholders’ equity is below (in thousands):
F-35
Table of Contents
Index to Financial Statements
NEWGISTICS, INC. AND SUBSIDIARIES
NOTES TO CONDENSED CONSOLIDATED FINANCIAL STATEMENTS
(UNAUDITED)
1. Basis of Presentation and Principles of Consolidation (continued)
| Historical Balance as of April 2, 2011 |
Reclass of Preferred Stock Warrant Liability (a) |
Conversion of Redeemable Preferred Stock (b) |
Pro Forma Balance as of April 2, 2011 |
|||||||||||||
| Convertible preferred stock warrant liability |
$ | 457 | $ | (457 | ) | $ | - | $ | - | |||||||
| Shares of redeemable convertible preferred stock |
123,837 | - | (111,600 | ) | 12,237 | |||||||||||
| Shares of common stock |
78 | - | 546 | 624 | ||||||||||||
| APIC |
$ | 9,555 | $ | 457 | $ | 111,054 | $ | 121,066 | ||||||||
| Accumulated deficit |
(94,867 | ) | - | - | (94,867 | ) | ||||||||||
| Total stockholders’ equity |
(85,234 | ) | 457 | 111,600 | 26,823 | |||||||||||
| (a) | At the time of the IPO, all remaining warrants for the purchase of preferred stock will either convert to warrants for the purchase of our common stock or will expire. Therefore, the Company has reclassed the remaining warrant liability to APIC in the pro forma calculation. |
| (b) | The pro forma calculation assumes the conversion of all preferred stock except for series F preferred stock, which is required to be redeemed upon an IPO. |
2. Fair Value Measurements
In fiscal 2008 the Company adopted an accounting standard that defines fair value, establishes a framework for measuring fair value as well as expands on required disclosures regarding fair value measurements. This standard applies to reported balances that are required or permitted to be measured at fair value under existing accounting pronouncements; accordingly, the standard does not require any new fair value measurements of reported balances. The adoption of this standard did not have a material impact on the consolidated financial statements of the Company. The guidance establishes a fair value hierarchy that requires an entity to maximize the use of observable inputs and minimize the use of unobservable inputs when measuring fair value. A financial statement’s categorization within the fair value hierarchy is based upon the lowest level of input that is significant to the fair value measurement. The guidance establishes three levels of inputs that may be used to measure fair value:
Level 1 – Quoted prices in active markets for identical assets or liabilities.
Level 2 – Observable inputs other than Level 1 prices such as quoted prices for similar assets or liabilities; quoted prices in markets with insufficient volume or infrequent transactions (less active markets); or model-derived valuations in which all significant inputs are observable or can be derived principally from or corroborated by observable market data for substantially the full term of the assets or liabilities.
Level 3 – Unobservable inputs to the valuation methodology that are significant to the measurement of fair value of assets and liabilities.
F-36
Table of Contents
Index to Financial Statements
NEWGISTICS, INC. AND SUBSIDIARIES
NOTES TO CONDENSED CONSOLIDATED FINANCIAL STATEMENTS
(UNAUDITED)
2. Fair Value Measurements (continued)
The Company measures certain financial instruments at fair value on a recurring basis. As of April 2, 2011, those instruments were comprised of cash equivalents invested in money market mutual funds and preferred stock warrant liability. The fair value of the preferred stock warrant liability was estimated using the Black-Scholes valuation model. The fair value of these assets was determined using the following inputs at April 2, 2011 (in thousands).
| Total | Quoted prices in active markets for identical assets (Level 1) |
Significant other observable inputs (Level 2) |
Significant unobservable inputs (Level 3) |
|||||||||||||
| Cash |
$ | 4,545 | $ | 4,545 | $ | - | $ | - | ||||||||
| Preferred stock warrant liability |
$ | 457 | $ | - | $ | - | $ | 457 | ||||||||
Changes in Level 3 assets measured at fair value on a recurring basis for the first quarter of fiscal 2011 were as follows (in thousands):
| January 1, 2011 |
$ | 17,230 | ||
| Effect of warrant exercises |
(16,647 | ) | ||
| Realized (gains) losses, net |
(126 | ) | ||
| April 2, 2011 |
$ | 457 | ||
3. Senior Secured Credit Facility
On March 7, 2011, the Company terminated its Prior Credit Facility and established a new senior secured credit facility, the Current Credit Facility, with Comerica Bank. The Company’s Current Credit Facility is secured by substantially all of its assets and consists of an $8.0 million revolving credit facility. Available amounts under the Current Credit Facility are calculated against a borrowing base, which is limited to 80% of the net amount of eligible accounts receivable, as defined in the Current Credit Facility agreement. At April 2, 2011, the Company had $7.98 million of borrowing availability.
Loans outstanding under the Current Credit Facility bear interest per annum at a rate equal to the greater of (i) the prime rate of Comerica Bank plus 1%, or (ii) LIBOR plus 2.5%. The fee in respect to non-use of available funds is 0.125%, with no utilization-based decrease and is payable monthly.
The Current Credit Facility contains customary affirmative covenants regarding, among other things, the delivery of financial and other information to Comerica Bank, maintenance of records, compliance with law, maintenance of property and insurance and conduct of our existing business. The Current Credit Facility includes covenants regarding events of default (and related remedies, including acceleration of the loans made thereunder) that are customary for a facility of this type, including payment default, covenant default, cross-default to other indebtedness, material inaccuracy of representations and warranties, bankruptcy and involuntary proceedings, change in control and judgment default. Many of the defaults are subject to certain materiality thresholds and grace periods usual for a facility of this type. As of April 2, 2011, the Company had no amounts outstanding under the Current Credit Facility and was in compliance with all applicable covenants.
F-37
Table of Contents
Index to Financial Statements
NEWGISTICS, INC. AND SUBSIDIARIES
NOTES TO CONDENSED CONSOLIDATED FINANCIAL STATEMENTS
(UNAUDITED)
4. Basic and Diluted Net Income Per Common Share
Net income per share is presented in conformity with the two-class method required for participating securities. In the event a dividend is paid on common stock, holders of all outstanding series of convertible preferred stock, including preferred stock warrants, are entitled to a proportionate share of any such dividend as if they were holders of common shares (on an as-if converted basis). For all periods presented, dividends attributable to holders of convertible preferred stock and preferred stock warrants were noncumulative. Under the two-class method, basic net income per share attributable to common stockholders is computed by dividing the net income attributable to common stockholders by the weighted average number of common shares outstanding during the period. Net income attributable to common stockholders is determined by allocating undistributed earnings between the holders of common stock, convertible preferred stock, and preferred stock warrants. Diluted net income per share attributable to common stockholders is computed by using the weighted average number of common shares outstanding, including potential dilutive shares of common stock assuming the dilutive effect of outstanding stock options and warrants using the treasury stock method, the two class method, or the if-converted method, whichever is more dilutive. For the first fiscal quarter of 2010 and 2011, the method that resulted in the most dilutive effect for the common stockholder was the if-converted method.
On March 3, 2011, warrants for the purchase of 185,873,115 shares of series E preferred stock were exercised via the redemption 160,683 shares of series F preferred stock and accrued dividends thereon for an aggregate price of $23,126,333. In connection with the IPO, the remaining warrants for the purchase of preferred stock will expire or be converted to warrants for the purchase of common stock. Then in connection with the IPO, all of the Company’s outstanding preferred stock, except for Series F preferred stock, will be automatically converted into 546,674,400 shares of common stock. The Company must redeem the remaining series F preferred stock in connection with the IPO. In the computation of basic and diluted historical earnings per share in the first fiscal quarter of 2010 and 2011, the Company included the dilutive impact of series F preferred stock of 196,460,750 and 58,268,210 shares, respectively. The Company did not include the dilutive impact of its series F preferred stock in the computation of pro forma basic and diluted earnings per share for the first fiscal quarter of 2010 and 2011 because such preferred stock is required to be redeemed and not converted in connection with the IPO.
Pro forma basic and diluted net income per share attributable to common stockholders represents net income, as adjusted to exclude the change in fair value of preferred stock warrant liability, divided by the pro forma weighted average shares outstanding as though the conversion of the Company’s redeemable convertible preferred stock into common stock occurred on the earlier of the original issuance dates of the warrant or preferred stock. Pro forma diluted weighted average shares outstanding also reflects the effect of any dilutive stock options and warrants.
F-38
Table of Contents
Index to Financial Statements
NEWGISTICS, INC. AND SUBSIDIARIES
NOTES TO CONDENSED CONSOLIDATED FINANCIAL STATEMENTS
(UNAUDITED)
4. Basic and Diluted Net Income Per Common Share (continued)
The following table sets forth the computation of basic and diluted net income per share attributable to common stockholders (in thousands, except per share amounts):
| First Fiscal Quarter | ||||||||
| 2010 | 2011 | |||||||
| Basic: |
||||||||
| Net income |
$ | 4,659 | $ | 2,064 | ||||
| Deemed dividends on participating preferred stock |
2,943 | - | ||||||
| Undistributed earnings allocated to participating preferred stock |
(6,915 | ) | (1,832 | ) | ||||
| Net income attributable to common stockholders |
$ | 687 | $ | 232 | ||||
| Weighted average common shares used in computing basic net income per share |
74,351 | 76,803 | ||||||
| Net income per share attributable to common stockholders |
$ | 0.01 | $ | 0.00 | ||||
| Diluted: |
||||||||
| Net income |
$ | 4,659 | $ | 2,064 | ||||
| Deemed dividends on participating preferred stock |
- | - | ||||||
| Undistributed earnings allocated to participating preferred stock |
- | - | ||||||
| Change in fair value of preferred stock warrant liability |
(1,432 | ) | (126 | ) | ||||
| Net income attributable to common stockholders |
$ | 3,227 | $ | 1,938 | ||||
| Weighted average common shares used in computing basic net income per share |
74,351 | 76,803 | ||||||
| Add weighted average effect of dilutive securities: |
||||||||
| Convertible preferred stock |
748,582 | 610,389 | ||||||
| Stock options |
69,481 | 72,745 | ||||||
| Weighted average common shares used in computing diluted net income per share |
892,414 | 759,937 | ||||||
| Net income per share attributable to common stockholders |
$ | 0.00 | $ | 0.00 | ||||
| Pro Forma net income attributable to common stockholders: |
||||||||
| Net income |
$ | 4,659 | $ | 2,064 | ||||
| Change in fair value of preferred stock warrant liability |
(1,432 | ) | (126 | ) | ||||
| Pro forma net income attributable to common stockholders |
$ | 3,227 | $ | 1,938 | ||||
| Shares used in computing pro forma net income per share attributable to common stockholders |
||||||||
| Basic: |
||||||||
| Basic weighted average common shares from above |
74,351 | 76,803 | ||||||
| Add shares in assumed conversion of convertible preferred stock |
552,121 | 552,121 | ||||||
| Shares used in computing pro forma basic net income per share attributable to common stockholders |
626,472 | 628,924 | ||||||
| Diluted: |
||||||||
| Basic weighted average common shares from above |
626,472 | 628,924 | ||||||
| Add stock options |
69,481 | 72,745 | ||||||
| Shares used in computing pro forma diluted net income per share attributable to common stockholders |
695,953 | 701,669 | ||||||
| Pro forma net income per share attributable to common stockholders: |
||||||||
| Basic |
$ | 0.01 | $ | 0.00 | ||||
| Diluted |
$ | 0.00 | $ | 0.00 | ||||
F-39
Table of Contents
Index to Financial Statements
NEWGISTICS, INC. AND SUBSIDIARIES
NOTES TO CONDENSED CONSOLIDATED FINANCIAL STATEMENTS
(UNAUDITED)
5. Preferred Stock
Redeemable Convertible Preferred Stock
On March 3, 2011, the holders of warrants to purchase 185,873,115 shares of the Company’s series E preferred stock exercised their warrants by tendering 160,683 shares of series F preferred stock with a redemption value equal to $23,126,333, the aggregate exercise price of the warrants.
The following is a summary of redeemable convertible preferred stock issued by the Company.
| Number of Shares Authorized |
Shares Issued and Outstanding | Aggregate Liquidation Preference at April 2, 2011 |
||||||||||||||
| January 1, 2011 |
April 2, 2011 |
|||||||||||||||
| Series A |
10,200,000 | 10,190,000 | 10,190,000 | $ | 5,095 | |||||||||||
| Series AA |
13,000,000 | 13,000,000 | 13,000,000 | 6,500 | ||||||||||||
| Series B |
40,322,580 | 40,322,580 | 40,322,580 | 8,468 | ||||||||||||
| Series B-1 |
13,905,913 | 13,611,895 | 13,611,895 | 2,859 | ||||||||||||
| Series BB-1 |
57,452,573 | 57,452,573 | 57,452,573 | 12,065 | ||||||||||||
| Series C |
9,191,992 | 9,191,992 | 9,191,992 | 1,930 | ||||||||||||
| Series CC |
100,698,118 | 100,698,118 | 100,698,118 | 21,147 | ||||||||||||
| Series D |
33,113,647 | 33,113,647 | 33,113,647 | 6,953 | ||||||||||||
| Series E |
250,000,000 | 35,952,934 | 221,826,049 | 46,584 | ||||||||||||
| Series F |
245,700 | 245,700 | 85,017 | 12,236 | ||||||||||||
| 528,130,523 | 313,779,439 | 499,491,871 | $ | 123,837 | ||||||||||||
Preferred Stock Warrants
The Company has warrants outstanding to purchase shares of preferred stock expiring at various dates through December 2019. The fair value of these warrants is adjusted at each reporting period using the Black-Scholes pricing model using assumptions for expected volatility, risk-free interest rate; expected life; and expected dividend rate. The following table summarizes the weighted average fair value of the warrants and the assumptions utilized to develop their fair value at each measurement date:
| Fiscal Year 2010 |
Quarter Ended April 2, 2011 |
|||||||
| Weighted average fair value of warrants outstanding |
$ | 0.09 | $ | 0.08 | ||||
| Risk-free interest rate |
0.26 | % | 0.26 | % | ||||
| Expected volatility |
29.2 | % | 28.9 | % | ||||
| Weighted average expected life in years |
2.20 | 7.88 | ||||||
| Dividend yield |
0.0 | % | 0.0 | % | ||||
In the first quarter of 2011 the Company recorded income in the amount of $126,000 and in fiscal year 2010 the Company recorded income in the amount of $7.3 million with respect to the revaluation of these warrants.
F-40
Table of Contents
Index to Financial Statements
NEWGISTICS, INC. AND SUBSIDIARIES
NOTES TO CONDENSED CONSOLIDATED FINANCIAL STATEMENTS
(UNAUDITED)
5. Preferred Stock (continued)
As of April 2, 2011, the Company had the following warrants for the purchase of preferred stock outstanding:
| Preferred Stock Series |
Number of Shares |
Exercise Price Per Share |
Issuance Date | Expiration Date | ||||||||
| Series A |
10,000 | $ | 0.50 | July 2000 | May 15, 2017 | |||||||
| Series B-1 |
294,018 | $ | 0.1488 | December 2000 | August 31, 2017 | |||||||
| Series E |
36,299 | $ | 0.12442 | July 2003 | April 11, 2013 | |||||||
| Series E |
18,119 | $ | 0.12442 | February 2004 | February 6, 2014 | |||||||
| Series E |
7,242 | $ | 0.12442 | September 2004 | April 13, 2013 | |||||||
| Series E |
10,817 | $ | 0.12442 | November 2004 | April 11, 2013 | |||||||
| Series E |
112,522 | $ | 0.12442 | April 2004 | April 12, 2016 | |||||||
| Series E |
3,758,621 | $ | 0.12442 | March 2007 | March 9, 2019 | |||||||
| Series E |
1,129,240 | $ | 0.12442 | December 2007 | December 31, 2019 | |||||||
6. Income Taxes
At the end of each interim reporting period, an estimate is made of the effective tax rate expected to be applicable for the full year. The estimated full year’s effective tax rate is used to determine the income tax rate for each applicable interim reporting period. The effect on deferred tax assets and liabilities of a change in tax rates is recognized in the results of operations in the period of the enactment date.
For the three month period ended April 2, 2011, the Company recorded a provision for income taxes of $2.1 million, which represents its expected overall effective income tax rate of 40% for fiscal 2011 plus additional immaterial expense for certain discrete items related to prior years.
In the three months ended April 3, 2010, the Company recorded a benefit for income taxes in the amount of $0.5 million due to the release of the valuation allowance for net operating loss carryforwards and other deferred tax assets based on the Company’s analysis of whether it was more likely than not that such deferred tax assets were realizable.
The Company had no valuation allowance for net deferred tax assets as of January 1, 2011; therefore, unlike the three month period ended April 3, 2010, the income tax provision for the three month period ended April 2, 2011 does not include any income tax benefit for the release of valuation allowance.
The Company and its subsidiaries file income tax returns in the U.S. federal, state, and local jurisdictions. The Company is no longer subject to U.S. federal income tax examinations for years before 2007 and is no longer subject to state and local income tax examinations by tax authorities for years before 2007. The Company is not currently under audit in any jurisdictions. The Company does not expect any material changes to the estimated amount of liability associated with its uncertain tax positions within the next twelve months. For the three months ended April 2, 2011, there were no material changes to the total amount of unrecognized tax benefits. The Company recognizes interest and penalties related to uncertain tax positions in the provision for income taxes.
F-41
Table of Contents
Index to Financial Statements
NEWGISTICS, INC. AND SUBSIDIARIES
NOTES TO CONDENSED CONSOLIDATED FINANCIAL STATEMENTS
(UNAUDITED)
7. Operating Segments
The Company provides its services through two operating segments.
Parcel Solutions
The parcel solutions segment, which comprises 94.9% of the Company’s total revenue and 83% of its total gross profit as of April 2, 2011, provides return and delivery transportation services for small parcels weighing up to 70 pounds and having maximum combined length and girth of 130 inches.
Freight Services
The freight services segment, which comprises 5.1% of the Company’s total revenue and 17% of its total gross profit as of April 2, 2011, offers LTL and brokerage services in all 50 states through a network of carrier partnerships.
Following is selected segment information for and as of the periods indicated (in thousands). The accounting policies of the reportable segments are the same as the accounting policies of the Company. The Company allocates resources and evaluates the performance of segments based on sales, gross profit, and operating income.
| Parcel Solutions |
Freight Services |
Corporate and/or Eliminations |
Total | |||||||||||||
| Three Months Ended April 3, 2010 |
||||||||||||||||
| Revenue |
$ | 40,436 | $ | 2,236 | $ | - | $ | 42,672 | ||||||||
| Gross profit |
8,217 | 1,823 | - | 10,040 | ||||||||||||
| Income before income taxes |
2,810 | 181 | 1,145 | 4,136 | ||||||||||||
| Capital expenditures |
147 | 16 | - | 163 | ||||||||||||
| Depreciation and amortization expense |
648 | 493 | - | 1,141 | ||||||||||||
| Three Months Ended April 2, 2011 |
||||||||||||||||
| Revenue |
$ | 48,397 | $ | 2,624 | $ | (94 | ) | $ | 50,927 | |||||||
| Gross profit |
10,053 | 2,064 | - | 12,117 | ||||||||||||
| Income before income taxes |
3,774 | 218 | 123 | 4,115 | ||||||||||||
| Capital expenditures |
333 | 36 | - | 369 | ||||||||||||
| Depreciation and amortization expense |
751 | 397 | - | 1,148 | ||||||||||||
| Total assets as of January 1, 2011 |
$ | 24,750 | $ | 10,239 | $ | 13,265 | $ | 48,254 | ||||||||
| Total assets as of April 2, 2011 |
28,479 | 10,326 | 12,149 | 50,954 | ||||||||||||
| Goodwill as of January 1, 2011 |
3,727 | 2,817 | - | 6,544 | ||||||||||||
| Goodwill as of April 2, 2011 |
3,727 | 2,817 | - | 6,544 | ||||||||||||
F-42
Table of Contents
Index to Financial Statements
Shares
Common Stock
PROSPECTUS
, 2011
| Stifel Nicolaus Weisel |
Piper Jaffray |
| BB&T Capital Markets |
William Blair & Company |
Neither we nor any of the underwriters have authorized anyone to provide information different from that contained in this prospectus. When you make a decision about whether to invest in our common stock, you should not rely upon any information other than the information in this prospectus. Neither the delivery of this prospectus nor the sale of our common stock means that information contained in this prospectus is correct after the date of this prospectus. This prospectus is not an offer to sell or solicitation of an offer to buy these shares of common stock in any circumstances under which the offer or solicitation is unlawful.
Table of Contents
Index to Financial Statements
PART II
INFORMATION NOT REQUIRED IN PROSPECTUS
Item 13. Other Expenses of Issuance and Distribution*
The following table sets forth the costs and expenses, other than the underwriting discounts and commissions payable by us, in connection with the sale of common stock being registered. All amounts are estimates except the SEC registration fee, the Financial Industry Regulatory Authority, or FINRA, filing fee and the NASDAQ Global Select Market listing fee.
| SEC registration fee |
||||
| FINRA filing fee |
||||
| NASDAQ listing fee |
||||
| Blue sky fees and expenses |
||||
| Transfer agent and registrar fees |
||||
| Accounting fees and expenses |
||||
| Legal fees and expenses |
||||
| Printing and engraving costs |
||||
| Miscellaneous expenses |
||||
| Total |
$ | |||
| * | To be completed by amendment. |
Item 14. Indemnification of Directors and Officers
Section 145 of the Delaware General Corporation Law authorizes a court to award, or a corporation’s board of directors to grant, indemnity to directors and officers in terms sufficiently broad to permit such indemnification under certain circumstances for liabilities (including reimbursement for expenses incurred) arising under the Securities Act.
As permitted by the Delaware General Corporation Law, our restated certificate of incorporation includes a provision that eliminates the personal liability of our directors for monetary damages for breach of fiduciary duty as a director, except for liability:
| • | for any breach of the director’s duty of loyalty; |
| • | for acts or omissions not in good faith or that involve intentional misconduct or a knowing violation of law; |
| • | under section 174 of the Delaware General Corporation law regarding unlawful dividends and stock purchases; or |
| • | for any transaction for which the director derived an improper personal benefit. |
| • | as permitted by the Delaware General Corporation Law, our bylaws provide that: |
| ¡ | we are required to indemnify our directors and officers to the fullest extent permitted by the Delaware General Corporation Law, subject to very limited exceptions; |
| ¡ | we may indemnify our other employees and agents to the fullest extent permitted by the Delaware General Corporation Law, subject to very limited exceptions; |
| ¡ | we are required to advance expenses, as incurred, to our directors and officers in connection with a legal proceeding to the fullest extent permitted by the Delaware General Corporation Law, subject to very limited exceptions; |
| ¡ | we may advance expenses, as incurred, to our employees and agents in connection with a legal proceeding; and |
| ¡ | the rights conferred in the bylaws are not exclusive. |
II-1
Table of Contents
Index to Financial Statements
We intend to enter into indemnity agreements with each of our current directors and officers to give these directors and officers additional contractual assurances regarding the scope of the indemnification set forth in our restated certificate of incorporation and to provide additional procedural protections. At present, there is no pending litigation or proceeding involving our directors, officers or employees regarding which indemnification is sought, nor are we aware of any threatened litigation that may result in claims for indemnification.
The indemnification provisions in our restated certificate of incorporation and amended and restated bylaws and the indemnity agreements entered into between us and each of our directors and officers may be sufficiently broad to permit indemnification of the our directors and officers for liabilities arising under the Securities Act.
Reference is also made to the underwriting agreement, which provides for the indemnification of our officers, directors and controlling persons against certain liabilities.
We are seeking to obtain directors’ and officers’ liability insurance and expect the insurance to include coverage for securities matters.
Item 15. Recent Sales of Unregistered Securities
In the three years preceding the filing of this registration statement, Newgistics, Inc. has sold and issued the following unregistered securities:
| 1. | From February 1, 2008 through December 31, 2008, we granted to certain of our employees options to purchase an aggregate of 7,816,563 shares of our common stock under our 2000 Stock Option/Stock Issuance Plan at a price of $0.09 per share. |
| 2. | From January 1, 2009 through December 31, 2009, we granted to certain of our employees options to purchase an aggregate of 2,500,000 shares of our common stock under our 2000 Stock Option/Stock Issuance Plan at a price of $0.12 per share. |
| 3. | On February 23, 2010, we granted to one of our executive officers an option to purchase 3,500,000 shares of our common stock under our 2000 Stock Option/Stock Issuance Plan at a price of $0.14 per share. |
| 4. | On July 30, 2010, we issued and donated 80,000 shares of our common stock to the Entrepreneurs Foundation of Central Texas in exchange for the opportunity to implement a donor-advised fund to support future community involvement efforts. |
| 5. | On October 20, 2010, we granted to certain of our employees options to purchase an aggregate of 1,250,000 shares of our common stock under our 2000 Stock Option/Stock Issuance Plan at a price of $0.18 per share. |
| 6. | On December 10, 2010, we issued and sold a total of 3,586,642 shares of our series E preferred stock to two of our investors, pursuant to the exercise of warrants which were granted on March 7, 2007, at an exercise price of $0.001 per share for an aggregate consideration of $3,586.64. |
| 7. | From January 1, 2011 through April 7, 2011, employees exercised options to purchase 119,174 shares of our common stock pursuant to options issued under our 2000 Stock Option/Stock Issuance Plan at a price of $0.09 per share for a purchase price of $10,725.66. |
| 8. | From February 1, 2008 through April 28, 2011, our employees and consultants exercised options to purchase 3,649,660 shares of our common stock pursuant to options issued under our 2000 Stock Option/Stock Issuance Plan at a price of $0.05 per share for an aggregate purchase price of $182,483. |
II-2
Table of Contents
Index to Financial Statements
| 9. | On February 9, 2011, we granted to certain of our employees options to purchase an aggregate of 4,500,000 shares of our common stock under our 2000 Stock Option/Stock Issuance Plan at a price of $0.21 per share. |
| 10. | On March 3, 2011, we issued and sold a total of 185,873,115 shares of our series E preferred stock to four of our investors, pursuant to the exercise of warrants which were granted between April 11, 2003 and November 19, 2004 at an exercise price of $0.12442 per share for an aggregate consideration of $23,126,333, paid through the tender of 160,683 shares of series F preferred stock with a fair value equal to the aggregate exercise price of the warrants. |
| 11. | On May 12, 2011, we issued and sold a total of 72,477 shares of our series E preferred stock to two of our investors, pursuant to the exercise of warrants which were granted between July 1, 2003 and November 19, 2004 at an exercise price of $0.12442 per share for an aggregate consideration of $9,017.59, paid through the tender of 63 shares of series F preferred stock with a fair value equal to the aggregate purchase price of the warrants. |
No underwriters were involved in the foregoing sales of securities. The issuances of the securities described above were deemed to be exempt from registration under the Securities Act, with respect to items 4, 6, 10 and 11, in reliance on Section 4(2) of the Securities Act as transactions by an issuer not involving a public offering and with respect to items 1 through 3, 5, and 7 through 9, by virtue of Rule 701 promulgated under Section 3(b) of the Securities Act as transactions pursuant to compensation benefits plans and contracts relating to compensation.
Item 16. Exhibits and Financial Statement Schedules
(a) Exhibits
| Exhibit |
Description | |
| 1.1* | Form of Underwriting Agreement. | |
| 2.1** | Acquisition Agreement by and between the Registrant, Cornerstone Logistic Services, Inc. and the holders of Cornerstone Logistic Services, Inc. capital stock. | |
| 2.2** | Stock Purchase Agreement by and among the Registrant, Newgistics Freight Services, Inc. (f/k/a Logistics Management, Inc.), Elmwood Transportation Services, Inc. and Prime Advantage Corporation. | |
| 3.1** | Amended and Restated Certificate of Incorporation of the Registrant currently in effect. | |
| 3.1.1** | First Amendment to Amended and Restated Certificate of Incorporation of the Registrant currently in effect. | |
| 3.1.2** | Second Amendment to Amended and Restated Certificate of Incorporation of the Registrant currently in effect. | |
| 3.2* | Form of Amended and Restated Certificate of Incorporation of the Registrant to be effective upon the completion of this offering. | |
| 3.3** | Amended and Restated Bylaws of the Registrant currently in effect. | |
| 3.3.1* | Form of Amended and Restated Bylaws of the Registrant to be effective upon the completion of this offering. | |
| 4.1 | Reference is made to 3.1 and 3.2 above. | |
| 4.2** | Restricted Stock Agreement dated July 30, 2010 between the Registrant and the Entrepreneurs Foundation of Central Texas. | |
| 4.3** | Amended and Restated Warrant to Purchase Preferred Stock issued to Comerica Bank dated July 25, 2000. | |
| 4.3.1** | Amendment dated February 14, 2006 to Amended and Restated Warrant to purchase Preferred Stock issued to Comerica Bank dated July 25, 2000. |
II-3
Table of Contents
Index to Financial Statements
| Exhibit |
Description | |
| 4.4** | Warrant to Purchase Preferred Stock issued to Comerica Bank dated December 28, 2000. | |
| 4.4.1** | Amendment dated November 4, 2005 to Warrant to Purchase Preferred Stock issued to Comerica Bank dated December 28, 2000. | |
| 4.4.2** | Amendment dated February 14, 2006 to Warrant to Purchase Preferred Stock issued to Comerica Bank dated December 28, 2000. | |
| 4.5** | Warrant to Purchase Preferred Stock issued to Comerica Bank dated April 12, 2004. | |
| 4.6** | Warrant to Purchase Preferred Stock issued to Comerica Bank dated March 9, 2007. | |
| 4.7** | Warrant to Purchase Preferred Stock issued to Comerica Bank dated December 31, 2007. | |
| 4.8** | Warrant Transfer Agreement between Comerica Bank and Comerica Ventures Incorporated. dated November 18, 2008. | |
| 4.8.1** | Amendment dated March 31, 2009 to Warrants to Purchase Stock issued to Comerica Bank and subsequently assigned to Comerica Ventures Incorporated dated July 25, 2000, December 28, 2000, April 12, 2004, March 9, 2007 and December 31, 2007. | |
| 4.9** | Third Amended and Restated Investor’s Rights Agreement dated September 30, 2002. | |
| 4.10** | Third Amended and Restated Voting Agreement dated September 20, 2002. | |
| 4.11** | Omnibus Amendment No. 1, dated April 11, 2003. | |
| 4.12** | Omnibus Amendment No. 2, dated December 31, 2004. | |
| 4.13** | Letter Agreement between the Registrant and Austin Ventures VII, L.P. regarding management rights, dated July 25, 2000. | |
| 5.1* | Opinion of DLA Piper LLP (US). | |
| 10.1** | Form of Indemnification Agreement for directors and officers. | |
| 10.2** | 2000 Stock Option/Stock Issuance Plan and forms of agreement thereunder. | |
| 10.2.1** | Amendment No. 1 to 2000 Stock Option/Stock Issuance Plan. | |
| 10.2.2** | Amendment No. 2 to 2000 Stock Option/Stock Issuance Plan. | |
| 10.2.3** | Amendment No. 3 to 2000 Stock Option/Stock Issuance Plan. | |
| 10.2.4** | Amendment No. 4 to 2000 Stock Option/Stock Issuance Plan. | |
| 10.2.5** | Amendment No. 5 to 2000 Stock Option/Stock Issuance Plan. | |
| 10.2.6** | Amendment No. 6 to 2000 Stock Option/Stock Issuance Plan. | |
| 10.3** | Fourth Amended and Restated Loan and Security Agreement, dated March 7, 2011, between Comerica Bank and the Registrant. | |
| 10.4** | Third Amended and Restated Intellectual Property Security Agreement, dated March 7, 2011, between Comerica Bank and the Registrant. | |
| 10.5* | 2011 Equity Incentive Plan and forms of agreement thereunder. | |
| 10.6** | Office Lease, dated April 1, 2003, between the Registrant and Desta Two Partnership, Ltd. | |
| 10.6.1** | First Amendment to Office Lease, dated November 7, 2005. | |
| 10.6.2** | Second Amendment to Office Lease, dated March 22, 2007. | |
| 10.7** | Employment Offer Letter, dated December 21, 2010, by and between the Registrant and David T. Marinkovich. | |
| 10.8** | Employment Offer Letter, dated January 2, 2004, by and between the Registrant and Alva J. Phillips. | |
| 10.9** | Employment Offer Letter, dated February 11, 2010, by and between the Registrant and Todd A. Everett. | |
| 10.10** | Employment Offer Letter, dated December 23, 2002, by and between the Registrant and Kenneth W. Johnson. | |
| 10.11** | Employment Offer Letter, dated February 15, 2006, by and between the Registrant and Michael J. Twomey. | |
| 10.12** | Employment Agreement, dated March 31, 2005, by and between the Registrant and William J. Razzouk. | |
| 10.12.1** | Amendment No. 1 to Employment Agreement of William J. Razzouk, dated April 4, 2005. | |
| 10.12.2** | Amendment No. 2 to Employment Agreement of William J. Razzouk, dated November 8, 2006. | |
| 10.12.3** | Amendment No. 3 to Employment Agreement of William J. Razzouk, dated January 2, 2011. | |
| 10.13** | Employment Agreement, dated March 9, 2007, by and between Newgistics Freight Services, Inc. (f/k/a Logistics Management, Inc.) and Michael A. Desmarais. |
II-4
Table of Contents
Index to Financial Statements
| Exhibit |
Description | |
| 10.14** | Employment Agreement, dated March 9, 2007, by and between Newgistics Freight Services, Inc. (f/k/a Logistics Management, Inc.) and Paul R. Forand. | |
| 10.15** | Board Offer Letter, dated March 17, 2011, by and between the Registrant and Stephen M. Mattessich. | |
| 10.16** | 2010 Bonus Plan for William J. Razzouk and Michael J. Twomey. | |
| 10.16.1** | 2010 Bonus Plan for Michael A. Desmarais and Paul R. Forand. | |
| 10.16.2** | 2010 Bonus Plan for Alva J. Phillips and Todd A. Everett. | |
| 10.17** | 2010 Commission Plan for Kenneth W. Johnson. | |
| 10.18**+ | Shipping Services Contract, dated October 18, 2010, between the Registrant and United States Postal Service. | |
| 10.19** | Newgistics, Inc. eVS Manifest Mailing System Authorization. | |
| 21.1** | List of Subsidiaries. | |
| 23.1 | Consent of Ernst & Young LLP, Independent Registered Public Accounting Firm. | |
| 23.2* | Consent of DLA Piper LLP (US) | |
| 24.1** | Power of Attorney (see page II-6 to the original filing of this registration statement on Form S-1 and amendment No. 1 thereto on Form S-1/A) | |
| 99.1** | Consent of Armstrong & Associates, Inc. | |
| 99.2** | Consent of The Colography Group, Inc. |
| * | To be filed by amendment. |
| ** | Previously filed. |
| + | Confidential treatment has been requested for portions of this exhibit. These portions have been omitted from this exhibit and have been filed separately with the Securities and Exchange Commission. |
Item 17. Undertakings
The registrant hereby undertakes to provide to the underwriters, at the closing specified in the underwriting agreement, certificates in such denominations and registered in such names as required by the underwriters to permit prompt delivery to each purchaser.
Insofar as indemnification by the registrant for liabilities arising under the Securities Act may be permitted to directors, officers and controlling persons of the registrant pursuant to the provisions referenced in Item 14 of this registration statement or otherwise, the registrant has been advised that in the opinion of the Securities and Exchange Commission such indemnification is against public policy as expressed in the Securities Act, and is, therefore, unenforceable. In the event that a claim for indemnification against such liabilities (other than the payment by the registrant of expenses incurred or paid by a director, officer, or controlling person of the registrant in the successful defense of any action, suit or proceeding) is asserted by such director, officer or controlling person in connection with the securities being registered hereunder, the registrant will, unless in the opinion of its counsel the matter has been settled by controlling precedent, submit to a court of appropriate jurisdiction the question whether such indemnification by it is against public policy as expressed in the Securities Act and will be governed by the final adjudication of such issue.
The registrant hereby undertakes that:
(1) For purposes of determining any liability under the Securities Act, the information omitted from the form of prospectus filed as part of this registration statement in reliance upon Rule 430A and contained in a form of prospectus filed by the registrant pursuant to Rule 424(b)(1) or (4) or 497(h) under the Securities Act shall be deemed to be part of this registration statement as of the time it was declared effective.
(2) For the purpose of determining any liability under the Securities Act, each post-effective amendment that contains a form of prospectus shall be deemed to be a new registration statement relating to the securities offered therein, and the offering of such securities at that time shall be deemed to be the initial bona fide offering thereof.
II-5
Table of Contents
Index to Financial Statements
SIGNATURES
Pursuant to the requirements of the Securities Act of 1933, as amended, the registrant has duly caused this registration statement to be signed on its behalf by the undersigned, thereunto duly authorized, in Austin, Texas on the 16th day of May, 2011.
NEWGISTICS, INC.
| By: |
/s/ William J. Razzouk | |
| William J. Razzouk Chairman, President, and Chief Executive Officer |
Pursuant to the requirements of the Securities Act of 1933, as amended, this registration statement has been signed by the following persons in the capacities and on the dates indicated:
| Name |
Title |
Date | ||
| /s/ William J. Razzouk William J. Razzouk |
Chairman, President, and Chief Executive Officer (Principal Executive Officer) | May 16, 2011 | ||
| /s/ Michael J. Twomey Michael J. Twomey |
Chief Financial Officer (Principal Financial and Accounting Officer) | May 16, 2011 | ||
| * Kenneth P. DeAngelis |
Director | May 16, 2011 | ||
| * Philip S. Siegel |
Director | May 16, 2011 | ||
| * Laura B. Sachar |
Director | May 16, 2011 | ||
| * Stephen M. Mattessich |
Director | May 16, 2011 | ||
| *By: | /s/ Michael J. Twomey | |
| Michael J. Twomey Attorney-in-Fact | ||
II-6
Table of Contents
Index to Financial Statements
EXHIBIT INDEX
| Exhibit |
Description | |
| 1.1* | Form of Underwriting Agreement. | |
| 2.1** | Acquisition Agreement by and between the Registrant, Cornerstone Logistic Services, Inc. and the holders of Cornerstone Logistic Services, Inc. capital stock. | |
| 2.2** | Stock Purchase Agreement by and among the Registrant, Newgistics Freight Services, Inc. (f/k/a Logistics Management, Inc.), Elmwood Transportation Services, Inc. and Prime Advantage Corporation. | |
| 3.1** | Amended and Restated Certificate of Incorporation of the Registrant currently in effect. | |
| 3.1.1** | First Amendment to Amended and Restated Certificate of Incorporation of the Registrant currently in effect. | |
| 3.1.2** | Second Amendment to Amended and Restated Certificate of Incorporation of the Registrant currently in effect. | |
| 3.2* | Form of Amended and Restated Certificate of Incorporation of the Registrant to be effective upon the completion of this offering. | |
| 3.3** | Amended and Restated Bylaws of the Registrant currently in effect. | |
| 3.3.1* | Form of Amended and Restated Bylaws of the Registrant to be effective upon the completion of this offering. | |
| 4.1** | Reference is made to 3.1 and 3.2 above. | |
| 4.2** | Restricted Stock Agreement dated July 30, 2010 between the Registrant and the Entrepreneurs Foundation of Central Texas. | |
| 4.3** | Amended and Restated Warrant to purchase Preferred Stock issued to Comerica Bank dated July 25, 2000. | |
| 4.3.1** | Amendment dated February 14, 2006 to Amended and Restated Warrant to purchase Preferred Stock issued to Comerica Bank dated July 25, 2000. | |
| 4.4** | Warrant to Purchase Preferred Stock issued to Comerica Bank dated December 28, 2000. | |
| 4.4.1** | Amendment dated November 4, 2005 to Warrant to Purchase Preferred Stock issued to Comerica Bank dated December 28, 2000. | |
| 4.4.2** | Amendment dated February 14, 2006 to Warrant to Purchase Preferred Stock issued to Comerica Bank dated December 28, 2000. | |
| 4.5** | Warrant to purchase Preferred Stock issued to Comerica Bank dated April 12, 2004. | |
| 4.6** | Warrant to purchase Preferred Stock issued to Comerica Bank dated March 9, 2007. | |
| 4.7** | Warrant to purchase Preferred Stock issued to Comerica Bank dated December 31, 2007. | |
| 4.8** | Warrant Transfer Agreement between Comerica Bank and Comerica Ventures Incorporated dated November 18, 2008. | |
| 4.8.1** | Amendment dated March 31, 2009 to Warrants to Purchase Stock issued to Comerica Bank and subsequently assigned to Comerica Ventures Incorporated dated July 25, 2000, December 28, 2000, April 12, 2004. March 9, 2002 and December 31, 2007. | |
| 4.9** | Third Amended and Restated Investor’s Rights Agreement dated September 30, 2002. | |
| 4.10** | Third Amended and Restated Voting Agreement dated September 20, 2002. | |
| 4.11** | Omnibus Amendment No. 1, dated April 11, 2003. | |
| 4.12** | Omnibus Amendment No. 2, dated December 31, 2004. | |
| 4.13** | Letter Agreement between the Registrant and Austin Ventures VII LP regarding management rights, dated July 25, 2000. | |
| 5.1* | Opinion of DLA Piper LLP (US). | |
| 10.1** | Form of Indemnification Agreement for directors and officers. | |
| 10.2** | 2000 Stock Option/Stock Issuance Plan and forms of agreement thereunder. | |
| 10.2.1** | Amendment No. 1 to 2000 Stock Option/Stock Issuance Plan. | |
| 10.2.2** | Amendment No. 2 to 2000 Stock Option/Stock Issuance Plan. | |
| 10.2.3** | Amendment No. 3 to 2000 Stock Option/Stock Issuance Plan. | |
| 10.2.4** | Amendment No. 4 to 2000 Stock Option/Stock Issuance Plan. | |
| 10.2.5** | Amendment No. 5 to 2000 Stock Option/Stock Issuance Plan. | |
| 10.2.6** | Amendment No. 6 to 2000 Stock Option/Stock Issuance Plan. |
II-7
Table of Contents
Index to Financial Statements
| Exhibit |
Description | |
| 10.3** | Fourth Amended and Restated Loan and Security Agreement, dated March 7, 2011, between Comerica Bank and the Registrant. | |
| 10.4** | Third Amended and Restated Intellectual Property Security Agreement, dated March 7, 2011, between Comerica Bank and the Registrant. | |
| 10.5* | 2011 Equity Incentive Plan and forms of agreement thereunder. | |
| 10.6** | Office Lease, dated April 1, 2003, between the Registrant and Desta Two Partnership, Ltd. | |
| 10.6.1** | First Amendment to Office Lease, dated November 7, 2005. | |
| 10.6.2** | Second Amendment to Office Lease, dated March 22, 2007. | |
| 10.7** | Employment Offer Letter, dated December 21, 2010, by and between the Registrant and David T. Marinkovich. | |
| 10.8** | Employment Offer Letter, dated January 2, 2004, by and between the Registrant and Alva J. Phillips. | |
| 10.9** | Employment Offer Letter, dated February 11, 2010, by and between the Registrant and Todd A. Everett. | |
| 10.10** | Employment Offer Letter, dated December 23, 2002, by and between the Registrant and Kenneth W. Johnson. | |
| 10.11** | Employment Offer Letter, dated February 15, 2006, by and between the Registrant and Michael J. Twomey. | |
| 10.12** | Employment Agreement, dated March 31, 2005, by and between the Registrant and William J. Razzouk. | |
| 10.12.1** | Amendment No. 1 to Employment Agreement of William J. Razzouk, dated April 4, 2005. | |
| 10.12.2** | Amendment No. 2 to Employment Agreement of William J. Razzouk, dated November 8, 2006. | |
| 10.12.3** | Amendment No. 3 to Employment Agreement of William J. Razzouk, dated January 2, 2011. | |
| 10.13** | Employment Agreement, dated March 9, 2007, by and between Newgistics Freight Services, Inc. (f/k/a Logistics Management, Inc.) and Michael A. Desmarais. | |
| 10.14** | Employment Agreement, dated March 9, 2007, by and between Newgistics Freight Services, Inc. (f/k/a Logistics Management, Inc.) and Paul R. Forand. | |
| 10.15** | Board Offer Letter, dated March 17, 2011, by and between the Registrant and Stephen M. Mattessich. | |
| 10.16** | 2010 Bonus Plan for William J. Razzouk and Michael J. Twomey. | |
| 10.16.1** | 2010 Bonus Plan for Michael A. Desmarais and Paul R. Forand. | |
| 10.16.2** | 2010 Bonus Plan for Alva J. Phillips and Todd A. Everett. | |
| 10.17** | 2010 Commission Plan for Kenneth W. Johnson. | |
| 10.18**+ | Shipping Services Contract, dated October 18, 2010, between the Registrant and United States Postal Service. | |
| 10.19** | Newgistics, Inc. eVS Manifest Mailing System Authorization. | |
| 21.1** | List of Subsidiaries. | |
| 23.1 | Consent of Ernst & Young LLP, Independent Registered Public Accounting Firm. | |
| 23.2* | Consent of DLA Piper LLP (US) | |
| 24.1** | Power of Attorney (see page II-6 to the original filing of this registration statement on Form S-1 and amendment no. 1 thereto on Form S-1/A) | |
| 99.1** | Consent of Armstrong & Associates, Inc. | |
| 99.2** | Consent of The Colography Group, Inc. |
| * | To be filed by amendment. |
| ** | Previously filed. |
| + | Confidential treatment has been requested for portions of this exhibit. These portions have been omitted from this exhibit and have been filed separately with the Securities and Exchange Commission. |
II-8