Attached files
| file | filename |
|---|---|
| 8-K - FORM 8-K - INTEL CORP | form8k.htm |
INVESTOR MEETING 2011
Santa Clara, California
May 17, 2011
Exhibit 99.1

INVESTOR MEETING 2011
Financial Update
Stacy Smith
Senior Vice President
Chief Financial Officer
Senior Vice President
Chief Financial Officer

INVESTOR MEETING 2011
3
Key Messages
• Design capability and manufacturing advantage enabling
leadership products, resulting in record financial results
leadership products, resulting in record financial results
• Significant and growing businesses across the
compute continuum
compute continuum
• Benefitting from the explosion of devices computing and
connecting to the internet and the growth of emerging markets
connecting to the internet and the growth of emerging markets
• Using record levels of free cash flow to invest in our business and
generate returns for our shareholders
generate returns for our shareholders

INVESTOR MEETING 2011
4
Financial Performance
Segments of our Business
Return of Cash to Shareholders

INVESTOR MEETING 2011
5
We are growing
2008-2011:
35% CAGR
Source: Intel and ThomsonOne
*2009 earnings per share excludes EC fine and AMD settlement of $2.6B. See Non-GAAP recon in Appendix A
** Not an Intel forecast :2011 Consensus EPS of $2.28 and Revenue of $53.2B from ThomsonOne as of 5/11/11
2008-2011:
12% CAGR
Billion

INVESTOR MEETING 2011
6
Revenue vs. Benchmarks
2000-2011*
2000-2011*
Source: Intel , FactSet and ThomsonOne
* Not an Intel forecast :Consensus 2011 revenue forecast of $53.2B from ThomsonOne as of 5/11/11
**Benchmark for the Dow 30 and S&P 100 measured on median revenue CAGRs pulled from FactSet as of 5/11/11

INVESTOR MEETING 2011
7
Intel Gross Margin Model
Forecast
63% in 2011 represents the midpoint of the 2011 full year outlook range
Forecast range is based on current expectations and is subject to change without notice
Source: Intel
55%-65%
Gross Margin Range

INVESTOR MEETING 2011
8
Spending* % of Revenue
* MG&A + R&D spending. 2000 through 2005 adjusted to include stock based
compensation expense. See Non-GAAP recon in Appendix B.
compensation expense. See Non-GAAP recon in Appendix B.
** Not an Intel forecast. Consensus Revenue of $53.2B from 5/11/11 and
$15.7B for R&D + MG&A (the midpoint of Intel Outlook)
$15.7B for R&D + MG&A (the midpoint of Intel Outlook)
Source: Intel
Forecast
INVESTOR MEETING 2011
9
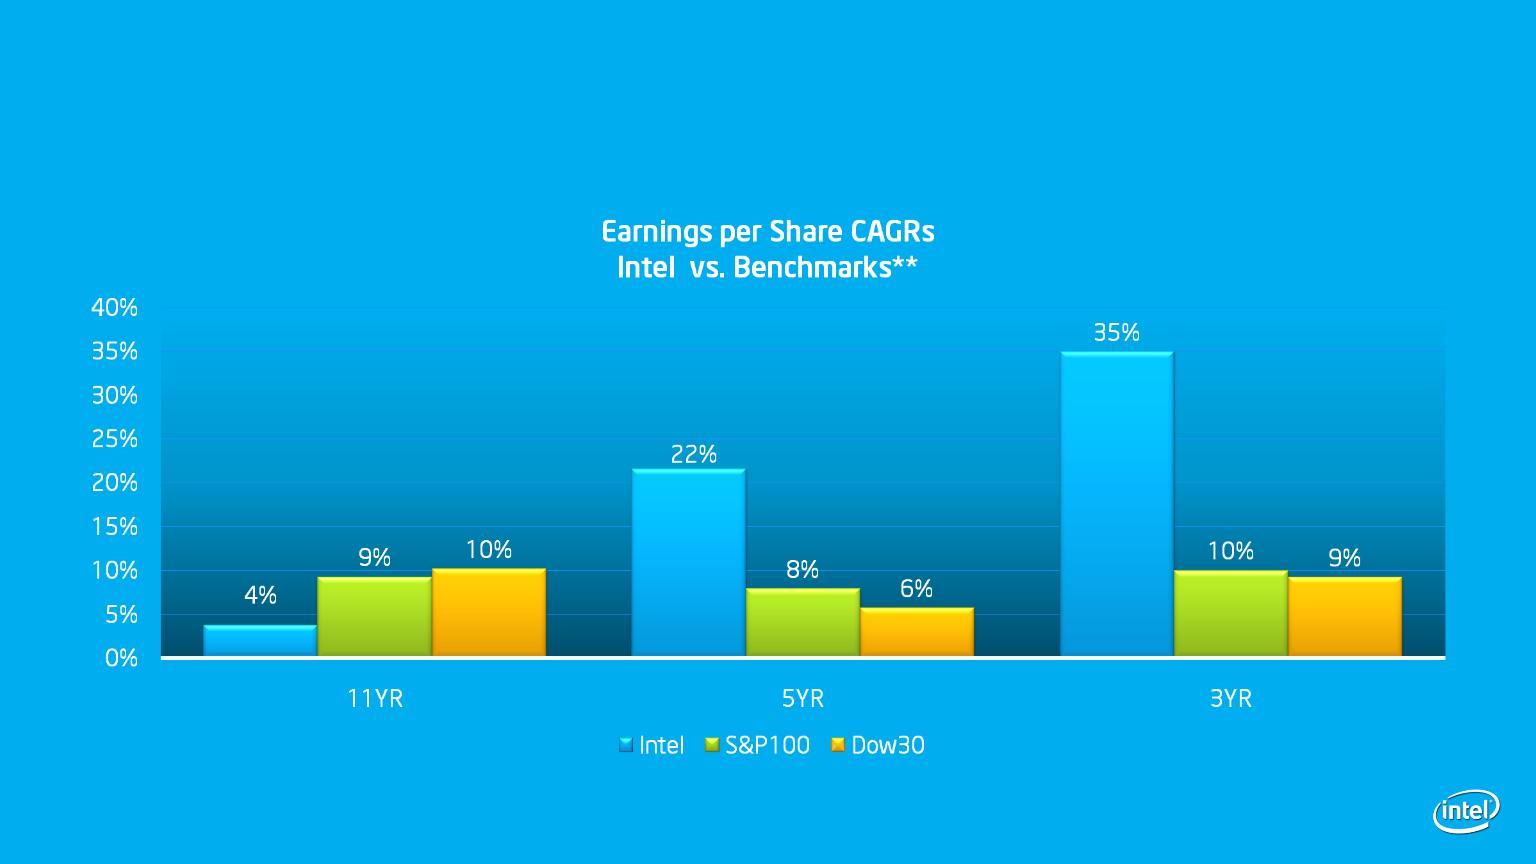
EPS vs. Benchmarks
2000-2011*
2000-2011*
Source: Intel , FactSet and ThomsonOne
* Not an Intel forecast :Consensus 2011 Earnings per share forecast of $2.28 from ThomsonOne as of 5/11/11
**Benchmark for the Dow 30 and S&P 100 measured on median CAGRs pulled from FactSet as of 5/11/11

INVESTOR MEETING 2011
10
ROIC Progress Report
ROIC includes cash and goodwill. 2000-2005 excludes stock-based compensation.
See Appendix B for Intel ROIC reconciliation to GAAP.
* 2011 Annualized figure of ROIC is Q1 2011 ROIC multiplied by four
S&P 500 contains 497 companies; Excludes:
Allegheny Energy Inc & McAfee Inc due to acquisitions
Motorola Inc due to split
Source: Intel
Long-term Goal to Rank Among Top ROIC Performers
Forecast
Intel
Top 20%
S&P 500

INVESTOR MEETING 2011
11
Financial Performance
Segments of our Business
Return of Cash to Shareholders
INVESTOR MEETING 2011
12
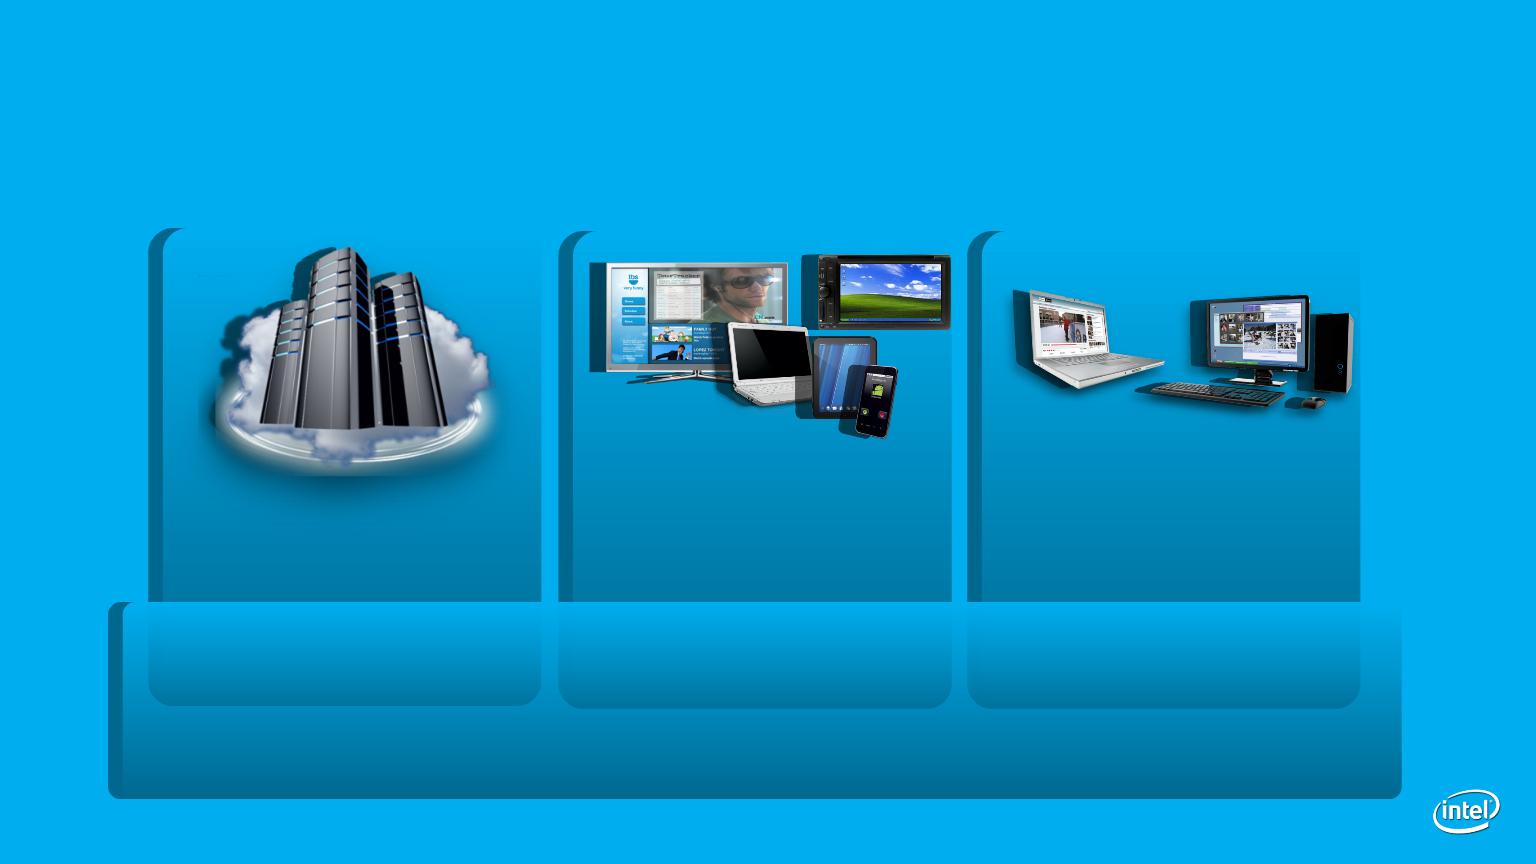
Data Center Group
Strong Businesses Across the Continuum
PC Client Group
Intel Arch. Other
2010 Rev/OM
$8.7B/$4.4B
$8.7B/$4.4B
2010 Rev/OM
$3.1B/$0.3B
$3.1B/$0.3B
2010 Rev/OM
$30.3B/$13.0B
$30.3B/$13.0B
Software and Services Group
2011* Rev/OM
$1.9B/($0.1B)
$1.9B/($0.1B)
*Forecast is based on current expectations and is subject to change without notice
Source: Intel

INVESTOR MEETING 2011
13
Strong Businesses Across the Continuum
2010 Rev/OM
$3.1B/$0.3B
$3.1B/$0.3B
2010 Rev/OM
$30.3B/$13.0B
$30.3B/$13.0B
Software and Services Group
2011* Rev/OM
$1.9B/($0.1B)
$1.9B/($0.1B)
*Forecast is based on current expectations and is subject to change without notice
Source: Intel
Data Center Group
PC Client Group
Intel Arch. Other

INVESTOR MEETING 2011
14
Data Center Group
2008 vs. 2010
2008 vs. 2010
32%
50%
Source: Intel
2008-2010:
43% CAGR
2008-2010:
Billion
Billion

INVESTOR MEETING 2011
15
Mission Critical
Infrastructure
Small Scale
Workstation
Cloud
Network
Storage
Storage
2015
1995
2000
2005
Traditional Server
Forecast is based on current expectations and is subject to change without notice
Source: Intel
Data Center Group
Processor Growth Forecast*
Processor Growth Forecast*
2010

INVESTOR MEETING 2011
16
Data Center Group
Looking Forward
Looking Forward
Benefitting from four trends
1. Build-out of the cloud
2. Expanding into networking and communications infrastructure, and storage
3. Voracious demand for high-performance computing
4. Technology leadership = high ROI for enterprise upgrades
$8.7B of revenue and $4.4B of operating profit in 2010
Expect 15% revenue growth CAGR through 2013 with operating
margins at ~50%
Forward looking statements specified are preliminary based on current expectations, and are subject to
change without notice
change without notice
Source: Intel

INVESTOR MEETING 2011
17
Strong Businesses Across the Continuum
PC Client Group
Intel Arch. Other
2010 Rev/OM
$3.1B/$0.3B
$3.1B/$0.3B
2010 Rev/OM
$30.3B/$13.0B
$30.3B/$13.0B
Software and Services Group
2011* Rev/OM
$1.9B/($0.1B)
$1.9B/($0.1B)
*Forecast is based on current expectations and is subject to change without notice
Source: Intel

INVESTOR MEETING 2011
18
Other Intel Architecture Group
2008 vs. 2010
2008 vs. 2010
2008-2010:
16% CAGR
Million
Billion
Source: Intel

INVESTOR MEETING 2011
19
Embedded iA Business
Momentum and Market Opportunity
Momentum and Market Opportunity
11%
8%
8%
19%
13%
8%
52%
CAGRs
Source: IDC and Intel
Forecast
Forecast
Billion
2010-2013:
11% CAGR

INVESTOR MEETING 2011
20
Other Intel Architecture Group
Looking Forward
Looking Forward
Embedded Intel architecture
• 2010 Revenue of $1.5B and operating profit of ~$450M
•Expect revenues to grow at a 25% CAGR through 2013 and operating
margin to be greater than $1B in 2013
margin to be greater than $1B in 2013
Making significant investments in SOC, tablet, and smartphone R&D
We expect market segment share gains and growing businesses in
tablets, smartphones (application and baseband processors), and
connected CE devices
tablets, smartphones (application and baseband processors), and
connected CE devices
Forward looking statements specified are preliminary based on current expectations, and are
subject to change without notice
subject to change without notice
Source: Intel

INVESTOR MEETING 2011
21
Strong Businesses Across the Continuum
PC Client Group
Intel Arch. Other
2010 Rev/OM
$3.1B/$0.3B
$3.1B/$0.3B
2010 Rev/OM
$30.3B/$13.0B
$30.3B/$13.0B
Software and Services Group
2011* Rev/OM
$1.9B/($0.1B)
$1.9B/($0.1B)
*Forecast is based on current expectations and is subject to change without notice
Source: Intel

INVESTOR MEETING 2011
22
PC Client Group
2008 vs. 2010
2008 vs. 2010
43%
2008-2010:
17% CAGR
Billion
Billion
Source: Intel

INVESTOR MEETING 2011
23
Segmentation Drives ASP Benefit
Source: Intel
*Platform includes both CPU and chipset
$
Up 6pts
Core Mix %
Core Mix %
’09 to ’10
0

INVESTOR MEETING 2011
24
Cost Declining Across Segments
Platform Costs*
Platform Costs*
Performance
Mainstream
Value
Atom™
*Platform includes both CPU and Chipset components
Forecast is based on current expectations and is subject to change without notice
Source: Intel
Forecast
Forecast
Forecast
Forecast

INVESTOR MEETING 2011
25
Market Drivers
Looking Forward
Looking Forward
~2 of every 3 PCs will be sold to emerging markets
~2 of every 3 PCs will be sold into the consumer segment
~2 of every 3 PCs sold will be notebooks
Forward looking statements specified are preliminary based on current expectations, and are
subject to change without notice
subject to change without notice
Source: Intel long range forecast through 2015

INVESTOR MEETING 2011
26
Blue shading notes SPP < 8 weeks of income
Income measured as mean income
Income measured as mean income
Blue shading notes SPP < 8 weeks of income
Income measured as mean income
Income measured as mean income
Emerging Market Affordability
Falling Prices, Rising Incomes
Falling Prices, Rising Incomes
Sources:
WOI to buy NB PC - Intel
Population by GEO - Economist Intelligence Unit (EIU)

INVESTOR MEETING 2011
27
Penetration Accelerates at 4-8 WOI to Buy a PC
Weeks of Income to Purchase a Notebook
Sources:
WOI to buy NB PC - Intel
Installed PCs - IDC PC Tracker
Population by GEO - Economist Intelligence Unit (EIU)

INVESTOR MEETING 2011
28
Penetration Accelerates at 4-8 WOI to Buy a PC
Weeks of Income to Purchase a Notebook
Sources:
WOI to buy NB PC - Intel
Installed PCs - IDC PC Tracker
Population by GEO - Economist Intelligence Unit (EIU)

INVESTOR MEETING 2011
29
Penetration Accelerates at 4-8 WOI to Buy a PC
Weeks of Income to Purchase a Notebook
Sources:
WOI to buy NB PC - Intel
Installed PCs - IDC PC Tracker
Population by GEO - Economist Intelligence Unit (EIU)

INVESTOR MEETING 2011
30
Penetration Accelerates at 4-8 WOI to Buy a PC
Weeks of Income to Purchase a Notebook
Sources:
WOI to buy NB PC - Intel
Installed PCs - IDC PC Tracker
Population by GEO - Economist Intelligence Unit (EIU)

INVESTOR MEETING 2011
31
Penetration Accelerates at 4-8 WOI to Buy a PC
Weeks of Income to Purchase a Notebook
Emerging Markets 2010
Sources:
WOI to buy NB PC - Intel
Installed PCs - IDC PC Tracker
Population by GEO - Economist Intelligence Unit (EIU)

INVESTOR MEETING 2011
32
Penetration Accelerates at 4-8 WOI to Buy a PC
Weeks of Income to Purchase a Notebook
Emerging Markets 2015
Sources:
WOI to buy NB PC - Intel
Installed PCs - IDC PC Tracker
Population by GEO - Economist Intelligence Unit (EIU)
META
India
Brazil
China
E. Europe

INVESTOR MEETING 2011
33
You will see a rapid increase in PC penetration rates in
China, Latin America and Eastern Europe.
China, Latin America and Eastern Europe.
Sources: Population - Economist Intelligence Unit (EIU)
Forward looking statements specified are preliminary based on current expectations, and are subject to change without
notice
notice

INVESTOR MEETING 2011
34
You will see a rapid increase in PC penetration rates in
China, Latin America and Eastern Europe.
China, Latin America and Eastern Europe.
Population: 2.5 billion people.
Sources: Population - Economist Intelligence Unit (EIU)
Forward looking statements specified are preliminary based on current expectations, and are subject to change without
notice
notice

INVESTOR MEETING 2011
35
PC TAM Growth
Over the last decade the PC TAM in emerging markets grew
at a 17% CAGR, and mature markets grew at a 5% CAGR
at a 17% CAGR, and mature markets grew at a 5% CAGR
Those growth rates equate to ~11% TAM CAGR from
2010 to 2013
2010 to 2013
Acceleration of the emerging market CAGR by 5 points drives
PC TAM CAGR of 14% from 2010 to 2013
PC TAM CAGR of 14% from 2010 to 2013
Source: Intel

INVESTOR MEETING 2011
36
Hold on there, Tex!
Won’t they all buy tablets?

INVESTOR MEETING 2011
37
Bear Case
100 million tablets in 2013 @ 33% cannibalization
TAM CAGR = 11% with cannibalization
Source: Intel
Caveat: We don’t believe this case

INVESTOR MEETING 2011
38
PC Client Group
Looking Forward
Looking Forward
Emerging Markets, Consumers, Notebooks will drive solid
revenue growth for several years
revenue growth for several years
Technology leadership, cost improvements, and
segmentation expected to maintain the
operating margin % through 2012
segmentation expected to maintain the
operating margin % through 2012
Forward looking statements specified are preliminary based on current expectations, and are subject to
change without notice
change without notice
Source: Intel

INVESTOR MEETING 2011
39
Intel Gross Margin Model
Forecast
63% in 2011 represents the midpoint of the 2011 full year outlook range
Forecast range is based on current expectations and is subject to change without notice
Source: Intel
55%-65%
Gross Margin Range

INVESTOR MEETING 2011
40
Strong Businesses Across the Continuum
PC Client Group
Intel Arch. Other
2010 Rev/OM
$3.1B/$0.3B
$3.1B/$0.3B
2010 Rev/OM
$30.3B/$13.0B
$30.3B/$13.0B
Software and Services Group
2011* Rev/OM
$1.9B/($0.1B)
$1.9B/($0.1B)
*Forecast is based on current expectations and is subject to change without notice
Source: Intel

INVESTOR MEETING 2011
41
• Rapidly growing software capabilities
• $300M of revenue in 2010 expected to grow to
over $3B in 2013
over $3B in 2013
– McAfee slightly accretive on a non-GAAP basis in
2011, on a GAAP basis in 2012
2011, on a GAAP basis in 2012
• Operating margin improves from ~($200M) in
2010 to ~$700M in 2013
2010 to ~$700M in 2013
• Upside opportunity as we embed additional
security features into hardware and software
security features into hardware and software
Forecast is based on current expectations and is subject to change without notice
Source: Intel
INVESTOR MEETING 2011
42
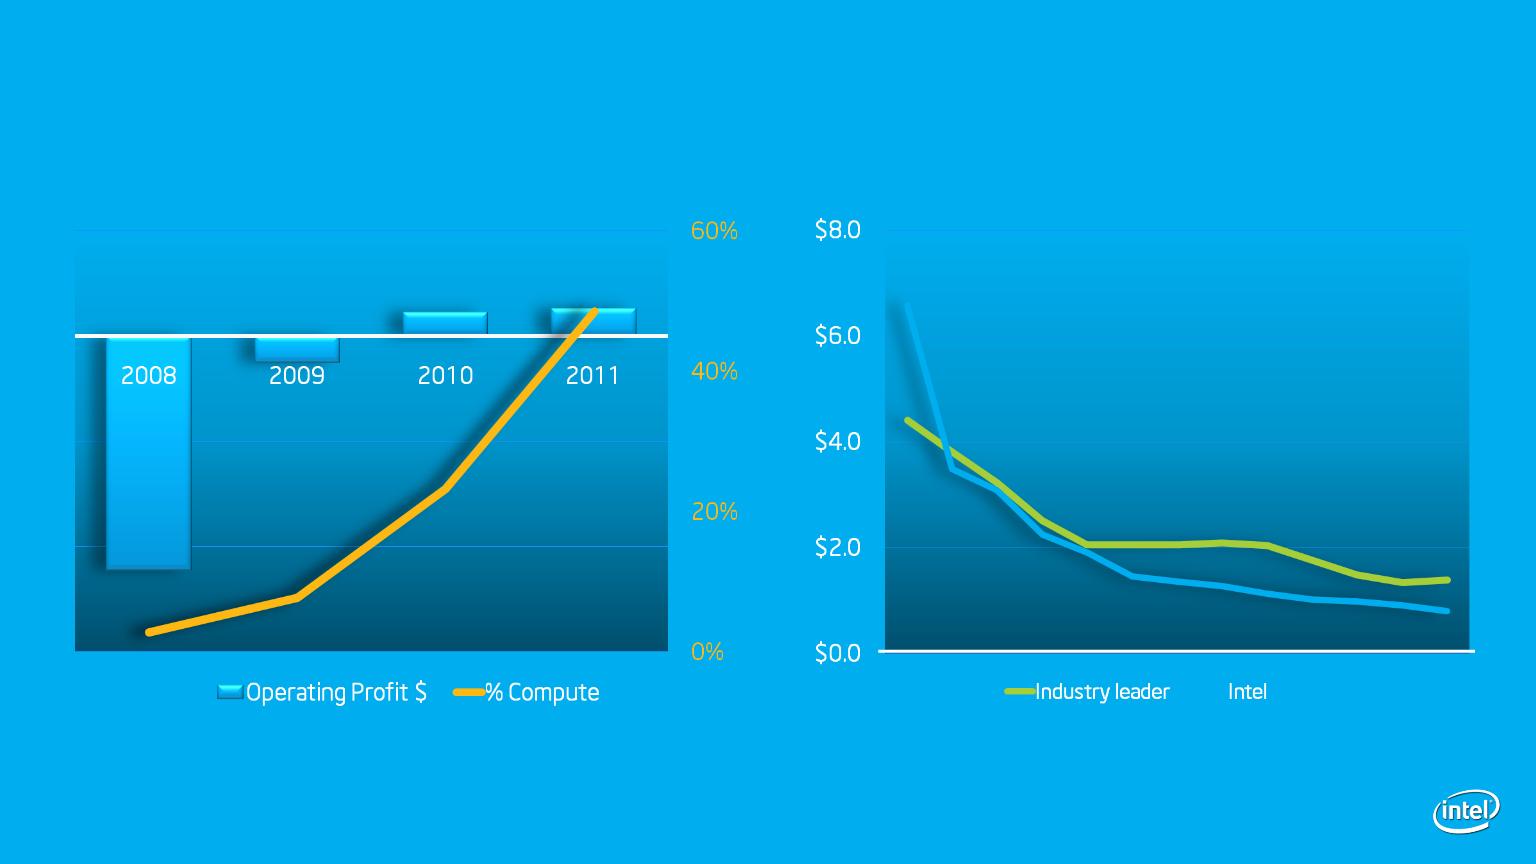
NAND Solutions Group*
Cost/GB
Q4 07
Q4 08
Q4 09
Q4 10
$0
Sources:
Operating Profit $ and Compute % - Intel
Cost/GB - iSuppli - Flash Q1 2011 Market Tracker
Forecast is based on current expectations and is subject to change without notice
*NAND solutions group is the same as Non-Volatile Memory Solutions Group and is part of the “All Other” segment
Forecast

INVESTOR MEETING 2011
43
Financial Performance
Segments of our Business
Return of Cash to Shareholders

INVESTOR MEETING 2011
44
Strong Cash Generation
Cash from Operations
$Billion
Sources:
2001-2010 Cash from Operation - Intel
*Not an Intel forecast - Consensus cash flow from ThomsonOne as of 5/11/11

INVESTOR MEETING 2011
45
Strong Cash Generation
$Billion
Sources:
2001-2010 Cash from Operation - Intel
*Not an Intel forecast - Consensus cash flow from ThomsonOne as of 5/11/11

INVESTOR MEETING 2011
46
Uses of Cash
Capital Spending, Acquisitions, Dividends, and Share Repurchases
Source: Intel
*2010 includes the $8.1B of acquisitions for McAfee and Infineon announced in 2010 but closed in Q1 2011
Capital Allocation Philosophy:
•Invest in our business
•Generate returns for shareholders
via an increasing dividend
via an increasing dividend
•Use share purchases as an additional
way to return cash to shareholders
way to return cash to shareholders
(Net of Cash)

INVESTOR MEETING 2011
47
Steadily Increasing Dividend
•16% increase announced last week
brings dividend up to $.84 annualized
brings dividend up to $.84 annualized
•Target allocation for the dividend is
~40% of free cash flow
~40% of free cash flow
•Plan to increase dividend roughly in line
with EPS growth rate
with EPS growth rate
•Dividend Yield = 3.3%*^
*2011 Annualized figure for dividend is not an Intel forecast but represents the Q1 payment, plus the Q2 declaration,
plus the May 11th announced Q3 dividend , and assuming the fourth quarter is equal to the third quarter
plus the May 11th announced Q3 dividend , and assuming the fourth quarter is equal to the third quarter
^ represents $23.49 Intel stock price close on 5/4/2011
Source: Intel
2003-2011:
33% CAGR
33% CAGR
INVESTOR MEETING 2011
48
Share Repurchases
We have bought back $5.5B from Q4’10 through Q1’11
Have reduced shares outstanding by 1.4B* shares since 2000,
including ~250M shares since November of ‘10
including ~250M shares since November of ‘10
*Repurchased under the common stock repurchase program, net of shares issued through employee equity incentive plans
Source: Intel

INVESTOR MEETING 2011
49
Strong cash generation
Dividend $ now targeting ~40% of FCF
$5.5 B share repurchases from Q4’10 to Q1’11
Source: Intel

INVESTOR MEETING 2011
50
Preview of the Rest of the Day
• Explosion of devices that compute and connect to the internet
driving data center growth
driving data center growth
• Another historic change to the PC roadmap
• Low power and SOC capability
• Software is a competitive advantage
• Combination of software and hardware capabilities enable new
levels of security
levels of security
• Process technology continues to differentiate Intel


INVESTOR MEETING 2011
52
Risk Factors
The above statements and any others in this document that refer to plans and expectations for the second quarter, the year and the future are forward-looking statements that involve
a number of risks and uncertainties. Words such as “anticipates,” “expects,” “intends,” “plans,” “believes,” “seeks,” “estimates,” “may,” “will,” “should,” and their variations identify forward-
looking statements. Statements that refer to or are based on projections, uncertain events or assumptions also identify forward-looking statements. Many factors could affect Intel’s
actual results, and variances from Intel’s current expectations regarding such factors could cause actual results to differ materially from those expressed in these forward-looking
statements. Intel presently considers the following to be the important factors that could cause actual results to differ materially from the company’s expectations. Demand could be
different from Intel's expectations due to factors including changes in business and economic conditions, including supply constraints and other disruptions affecting customers; customer
acceptance of Intel’s and competitors’ products; changes in customer order patterns including order cancellations; and changes in the level of inventory at customers. Potential
disruptions in the high technology supply chain resulting from the recent disaster in Japan could cause customer demand to be different from Intel’s expectations. Intel operates in
intensely competitive industries that are characterized by a high percentage of costs that are fixed or difficult to reduce in the short term and product demand that is highly variable and
difficult to forecast. Revenue and the gross margin percentage are affected by the timing of Intel product introductions and the demand for and market acceptance of Intel's products;
actions taken by Intel's competitors, including product offerings and introductions, marketing programs and pricing pressures and Intel’s response to such actions; and Intel’s ability to
respond quickly to technological developments and to incorporate new features into its products. The gross margin percentage could vary significantly from expectations based on
capacity utilization; variations in inventory valuation, including variations related to the timing of qualifying products for sale; changes in revenue levels; product mix and pricing; the
timing and execution of the manufacturing ramp and associated costs; start-up costs; excess or obsolete inventory; changes in unit costs; defects or disruptions in the supply of materials
or resources; product manufacturing quality/yields; and impairments of long-lived assets, including manufacturing, assembly/test and intangible assets. Expenses, particularly certain
marketing and compensation expenses, as well as restructuring and asset impairment charges, vary depending on the level of demand for Intel's products and the level of revenue and
profits. The tax rate expectation is based on current tax law and current expected income. The tax rate may be affected by the jurisdictions in which profits are determined to be earned
and taxed; changes in the estimates of credits, benefits and deductions; the resolution of issues arising from tax audits with various tax authorities, including payment of interest and
penalties; and the ability to realize deferred tax assets. Gains or losses from equity securities and interest and other could vary from expectations depending on gains or losses on the
sale, exchange, change in the fair value or impairments of debt and equity investments; interest rates; cash balances; and changes in fair value of derivative instruments. The majority of
Intel’s non-marketable equity investment portfolio balance is concentrated in companies in the flash memory market segment, and declines in this market segment or changes in
management’s plans with respect to Intel’s investments in this market segment could result in significant impairment charges, impacting restructuring charges as well as gains/losses on
equity investments and interest and other. Intel's results could be affected by adverse economic, social, political and physical/infrastructure conditions in countries where Intel, its
customers or its suppliers operate, including military conflict and other security risks, natural disasters, infrastructure disruptions, health concerns and fluctuations in currency exchange
rates. Intel’s results could be affected by the timing of closing of acquisitions and divestitures. Intel's results could be affected by adverse effects associated with product defects and
errata (deviations from published specifications), and by litigation or regulatory matters involving intellectual property, stockholder, consumer, antitrust and other issues, such as the
litigation and regulatory matters described in Intel's SEC reports. An unfavorable ruling could include monetary damages or an injunction prohibiting us from manufacturing or selling one
or more products, precluding particular business practices, impacting Intel’s ability to design its products, or requiring other remedies such as compulsory licensing of intellectual property.
A detailed discussion of these and other factors that could affect Intel’s results is included in Intel’s SEC filings, including the report on Form 10-Q for the quarter ended April 2, 2011.

INVESTOR MEETING 2011
53
INTEL CORPORATION
RECONCILIATIONS OF GAAP TO NON-GAAP RESULTS
Appendix A: AMD Settlement/EC Fine
RECONCILIATIONS OF GAAP TO NON-GAAP RESULTS
Appendix A: AMD Settlement/EC Fine
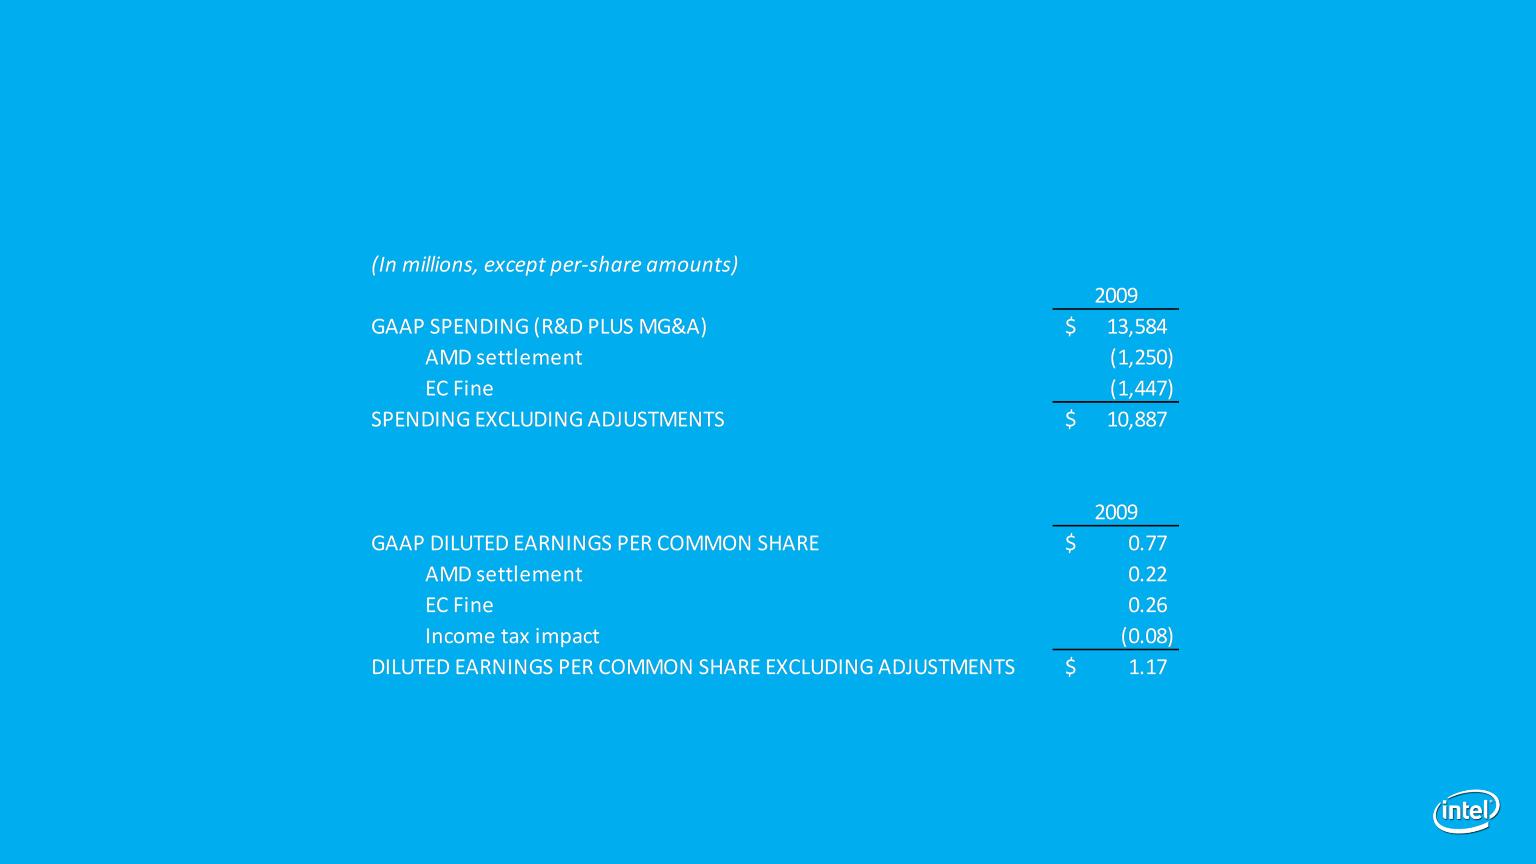
• In addition to disclosing financial results calculated in accordance with United States (U.S.) generally
accepted accounting principles (GAAP), this presentation contains non-GAAP financial measures that
exclude the charge incurred in the fourth quarter of 2009 as a result of the settlement agreement with
Advanced Micro Devices, Inc. (AMD) in the amount of $1.25 billion, and a charge incurred in the second
quarter of 2009 as a result of the European Commission (EC) fine in the amount of €1.06 billion, or about
$1.45 billion. These non-GAAP measures also exclude the associated impacts of the AMD settlement on
our tax provision. The EC fine did not impact the income tax provision because it was not tax deductible.
• The non-GAAP financial measures disclosed by the company should not be considered a substitute for, or
superior to, financial measures calculated in accordance with GAAP, and the financial results calculated in
accordance with GAAP and reconciliations from these results should be carefully evaluated. Management
believes the non-GAAP financial measures are appropriate for both its own assessment of, and to show
the reader, how our performance compares to other periods. Set forth below are reconciliations of the
non-GAAP financial measures to the most directly comparable GAAP financial measures.
Source: Intel
INVESTOR MEETING 2011
54
INTEL CORPORATION
RECONCILIATIONS OF GAAP TO NON-GAAP RESULTS
Appendix A: AMD Settlement/EC Fine (Continued)
RECONCILIATIONS OF GAAP TO NON-GAAP RESULTS
Appendix A: AMD Settlement/EC Fine (Continued)
Source: Intel

INVESTOR MEETING 2011
55
INTEL CORPORATION
RECONCILIATIONS OF GAAP TO NON-GAAP RESULTS
Appendix B: Share-Based Compensation
RECONCILIATIONS OF GAAP TO NON-GAAP RESULTS
Appendix B: Share-Based Compensation
• In addition to disclosing financial results calculated in accordance with United States (U.S.) generally
accepted accounting principles (GAAP), this presentation contains non-GAAP financial measures that
include share-based compensation charges as if we had applied the fair value recognition provisions under
current GAAP to periods prior to fiscal year 2006, for options granted under the company's equity
incentive plans and rights to acquire stock granted under the company's stock purchase plan.
• The non-GAAP financial measures disclosed by the company should not be considered a substitute for, or
superior to, financial measures calculated in accordance with GAAP, and the financial results calculated in
accordance with GAAP and reconciliations from these results should be carefully evaluated. Management
believes the non-GAAP financial measures are appropriate for both its own assessment of, and to show
the reader, how our performance compares to other periods. Set forth below are reconciliations of the
non-GAAP financial measures to the most directly comparable GAAP financial measures.
superior to, financial measures calculated in accordance with GAAP, and the financial results calculated in
accordance with GAAP and reconciliations from these results should be carefully evaluated. Management
believes the non-GAAP financial measures are appropriate for both its own assessment of, and to show
the reader, how our performance compares to other periods. Set forth below are reconciliations of the
non-GAAP financial measures to the most directly comparable GAAP financial measures.
Source: Intel

INVESTOR MEETING 2011
56
INTEL CORPORATION
RECONCILIATIONS OF GAAP TO NON-GAAP RESULTS
Appendix B: Share-Based Compensation (Continued)
RECONCILIATIONS OF GAAP TO NON-GAAP RESULTS
Appendix B: Share-Based Compensation (Continued)
Source: Intel

INVESTOR MEETING 2011
57
INTEL CORPORATION
RECONCILIATIONS OF GAAP TO NON-GAAP RESULTS
Appendix C: Historic ROIC
RECONCILIATIONS OF GAAP TO NON-GAAP RESULTS
Appendix C: Historic ROIC
• We define Return on Invested Capital (ROIC) as adjusted net operating profit
after taxes divided by beginning invested capital. Management believes that
ROIC provides greater visibility into how effectively Intel deploys capital.
Management uses ROIC as a high level target to help ensure that overall
performance is understood and acceptable. ROIC is not a measure of financial
performance under accounting principles generally accepted in the United States
(GAAP), and may not be defined and calculated by other companies in the same
manner as Intel does. ROIC should not be considered in isolation or as an
alternative to net income as an indicator of company performance.

INVESTOR MEETING 2011
58
INTEL CORPORATION
RECONCILIATIONS OF GAAP TO NON-GAAP RESULTS
Appendix C: Historic ROIC (Continued)
RECONCILIATIONS OF GAAP TO NON-GAAP RESULTS
Appendix C: Historic ROIC (Continued)
|
($m)
|
2001
|
2002
|
2003
|
2004
|
2005
|
|
Net income (GAAP)
|
$ 1,291
|
$ 3,117
|
$ 5,641
|
$ 7,516
|
$ 8,664
|
|
Interest expense
|
56
|
84
|
62
|
50
|
19
|
|
Income tax adjustment (1)
|
(23)
|
(22)
|
(15)
|
(14)
|
(6)
|
|
Adjusted net operating profit after taxes
|
$ 1,324
|
$ 3,179
|
$ 5,688
|
$ 7,552
|
$ 8,677
|
|
|
|
|
|
|
|
|
|
2000
|
2001
|
2002
|
2003
|
2004
|
|
Total assets (GAAP) (2)
|
$ 47,945
|
$ 44,395
|
$ 44,224
|
$ 47,143
|
$ 48,143
|
|
Current liabilities
|
(8,650)
|
(6,570)
|
(6,595)
|
(6,879)
|
(8,006)
|
|
Invested capital
|
$ 39,295
|
$ 37,825
|
$ 37,629
|
$ 40,264
|
$ 40,137
|
|
|
|
|
|
|
|
|
|
2001
|
2002
|
2003
|
2004
|
2005
|
|
Return on invested capital (Adjusted net operating profit after
taxes / prior year end invested capital) |
3.4%
|
8.4%
|
15.1%
|
18.8%
|
21.6%
|
|
|
|
|
|
|
|
|
Net income/ prior year end total assets
|
2.7%
|
7.0%
|
12.8%
|
15.9%
|
18.0%
|
|
|
|
|
|
|
|
|
(1) Assumed tax effect of interest expense based on the effective tax
rate |
|
|
|
|
|
|
|
|
|
|
|
|
|
(2) 2005-2008 Total assets has been adjusted due to changes to the
accounting for convertible debt instruments |
|
|
|
|
|

INVESTOR MEETING 2011
59
INTEL CORPORATION
RECONCILIATIONS OF GAAP TO NON-GAAP RESULTS
Appendix C: Historic ROIC (Continued)
RECONCILIATIONS OF GAAP TO NON-GAAP RESULTS
Appendix C: Historic ROIC (Continued)
|
($m)
|
2006
|
2007
|
2008
|
2009
|
2010
|
|
|
Net income (GAAP)
|
$ 5,044
|
$ 6,976
|
$ 5,292
|
$ 4,369
|
$ 11,464
|
|
|
Interest expense
|
24
|
15
|
8
|
1
|
0
|
|
|
Income tax adjustment (1)
|
(7)
|
(4)
|
(2)
|
(0)
|
0
|
|
|
Adjusted net operating profit after taxes
|
$ 5,061
|
$ 6,987
|
$ 5,298
|
$ 4,370
|
$ 11,464
|
|
|
|
|
|
|
|
|
|
|
|
2005
|
2006
|
2007
|
2008
|
2009
|
|
|
Total assets (GAAP) (2)
|
$ 48,309
|
$ 48,372
|
$ 55,664
|
$ 50,472
|
$ 53,095
|
|
|
Current liabilities
|
(9,234)
|
(8,514)
|
(8,571)
|
(7,818)
|
(7,591)
|
|
|
Invested capital
|
$ 39,075
|
$ 39,858
|
$ 47,093
|
$ 42,654
|
$ 45,504
|
|
|
|
|
|
|
|
|
|
|
|
2006
|
2007
|
2008
|
2009
|
2010
|
10 YR AVG
|
|
Return on invested capital (Adjusted net operating profit
after taxes / prior year end invested capital) |
13.0%
|
17.5%
|
11.3%
|
10.2%
|
25.2%
|
14.4%
|
|
|
|
|
|
|
|
|
|
Net income/ prior year end total assets
|
10.4%
|
14.4%
|
9.5%
|
8.7%
|
21.6%
|
12.1%
|
|
|
|
|
|
|
|
|
|
(1) Assumed tax effect of interest expense based on the
effective tax rate |
|
|
|
|
|
|
|
|
|
|
|
|
|
|
|
(2) 2005-2008 Total assets has been adjusted due to changes
to the accounting for convertible debt instruments |
|
|
|
|
|
|
|
|
|
|
|
|
|
|
|
|
|
|
|
|
|
|