Attached files
| file | filename |
|---|---|
| 8-K - COPANO ENERGY, L.L.C. FORM 8-K - Copano Energy, L.L.C. | form8-k.htm |
May 2011 Investor Presentation
NASDAQ: CPNO

Disclaimer
This presentation includes “forward-looking statements,” as defined in the federal securities laws.
Statements that address activities or events that Copano believes will or may occur in the future are
forward-looking statements. These statements include, but are not limited to, statements about future
producer activity and Copano’s total distributable cash flow and distribution coverage. These statements
are based on management’s experience and perception of historical trends, current conditions, expected
future developments and other factors management believes are reasonable.
Important factors that could cause actual results to differ materially from those in the forward-looking
statements include the following risks and uncertainties, many of which are beyond Copano’s control:
the volatility of prices and market demand for natural gas and natural gas liquids; Copano’s ability to
continue to obtain new sources of natural gas supply and retain its key customers; the impact on
volumes and resulting cash flow of technological, economic and other uncertainties inherent in
estimating future production, producers’ ability to drill and successfully complete and attach new natural
gas supplies and the availability of downstream transportation systems and other facilities for natural
gas and NGLs; higher construction costs or project delays due to inflation, limited availability of required
resources, or the effects of environmental, legal or other uncertainties; general economic conditions;
the effects of government regulations and policies; and other financial, operational and legal risks and
uncertainties detailed from time to time in Copano’s quarterly and annual reports filed with the
Securities and Exchange Commission.
Copano undertakes no obligation to update any forward-looking statements, whether as a result of new
information or future events.
information or future events.
2
Introduction to Copano
Independent midstream company founded in 1992
■ Producer focused
■ Entrepreneurial approach
■ Focus on long-term accretive growth
■ Publicly traded LLC
● No general partner or incentive distribution rights
● Tax benefits similar to MLPs, but with corporate governance of a C-corp
Provides midstream services in multiple producing areas through
three operating segments
three operating segments
■ Texas
● Conventional, Eagle Ford Shale and North Barnett Shale Combo play
■ Oklahoma
● Conventional, Hunton dewatering play and Woodford Shale
■ Rocky Mountains
● Powder River Basin
3
Key Metrics
Service throughput volumes approximate 1,500,000 MMBtu/d of
natural gas(1)
natural gas(1)
Approximately 6,700 miles of active pipelines
10 natural gas processing plants with over 1.2 Bcf/d of combined
processing capacity
processing capacity
One NGL fractionation facility with total capacity of 22,000 Bbls/d
■ Expansion underway to increase total capacity to 44,000 Bbls/d in 3Q 2011
Equity market cap: $2.1 billion(2)
Enterprise value: $3.0 billion(3)
4
Based on 1Q 2011 results. Includes unconsolidated affiliates.
As of May 12, 2011.
As of May 12, 2011. Includes $300 million of convertible preferred equity issued July 2010.
Business Strategy
To build a diversified midstream company with scale and
stability of cash flows, above-average returns on invested
capital and “investment-grade quality” distributions
stability of cash flows, above-average returns on invested
capital and “investment-grade quality” distributions
Key tenets of business strategy:
■ Executing on organic growth opportunities and bolt-on acquisitions
■ Reducing sensitivity to commodity prices
■ Expanding through greenfield opportunities and strategic acquisitions
■ Pursuing growth judiciously
■ Developing and exploiting flexibility in our operations
■ Maintaining a strong balance sheet and access to liquidity
■ Maintaining an approach to business founded on a culture of integrity, service
and creativity
and creativity
5

Agenda
6
|
Eagle Ford Shale
Growth Projects |
Business Segment
Outlook |
|
Financing and
Commodity Price Sensitivity |
Conclusions
|
Eagle Ford Shale Landscape
Eagle Ford Shale is currently the best-situated U.S. shale play
■ Regulatory environment familiar with industry
■ Land owners are more industry-friendly
■ Some existing infrastructure
■ Proximity to large consuming market, industrial load and petrochemical
markets
markets
Significant producer activity with large upstream representation
■ Over 160 rigs currently running in the Eagle Ford Shale
■ Significant investment by offshore firms encouraging activity
■ Lack of completion crews and liquids-handling capabilities partially restricting
near-term growth
near-term growth
Many competitors in midstream space, but early-movers and those
with existing infrastructure are advantaged
with existing infrastructure are advantaged
■ Producers fostering competition (i.e. multiple midstream providers desired)
■ Midstream providers with full-service capabilities lead the pack
● Producers require both natural gas and liquids solutions
7

Copano’s Eagle Ford Shale Strategy
Utilize existing assets as a platform to provide additional
midstream solutions for rich Eagle Ford Shale production in
excess of 1 Bcf/d of gas and just under 100,000 Bbls/d of NGLs
midstream solutions for rich Eagle Ford Shale production in
excess of 1 Bcf/d of gas and just under 100,000 Bbls/d of NGLs
Leverage existing assets
■ Gathering
■ Processing
■ Fractionation
■ NGL transportation
Execution of this strategy is well underway
8
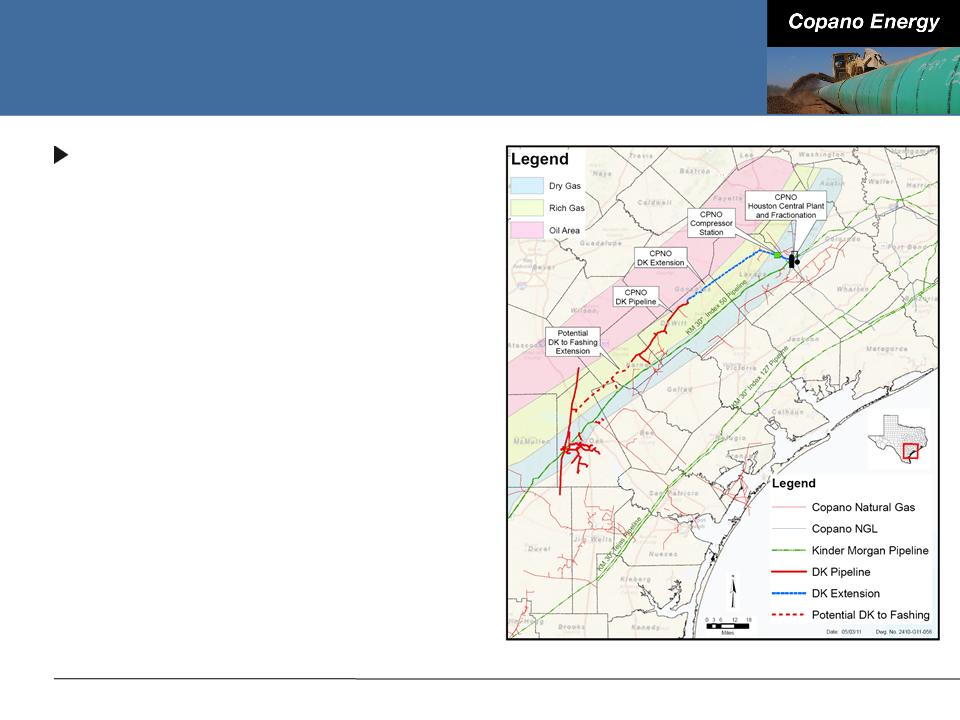
Northern Eagle Ford Shale
DK pipeline
■ Existing pipeline - 38 miles of 24”
pipe placed into full service October
2010
pipe placed into full service October
2010
■ February 2011 - announced
extension of existing pipeline back
to Houston Central complex
extension of existing pipeline back
to Houston Central complex
● Additional 58 miles of 24” pipe
● Expected completion in 4Q 2011
■ Current capacity of 225,000
MMBtu/d; extension to Houston
Central complex will increase
capacity to 350,000 MMBtu/d
MMBtu/d; extension to Houston
Central complex will increase
capacity to 350,000 MMBtu/d
■ Extension south to Live Oak Fashing
under consideration
under consideration
9
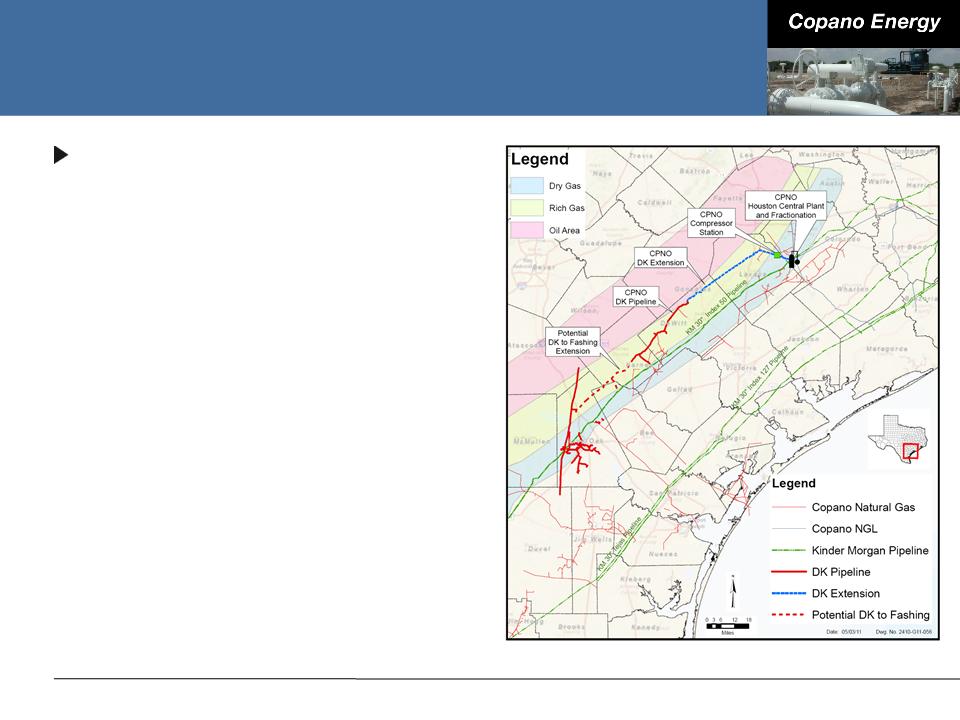
Northern Eagle Ford Shale
DK pipeline
■ Services the most prolific rich gas
window in the Eagle Ford Shale
window in the Eagle Ford Shale
■ Loops Kinder Morgan Index 50
pipeline, effectively boosting
pipeline capacity to Houston Central
pipeline, effectively boosting
pipeline capacity to Houston Central
■ Key producer contracts with
Abraxas, GeoSouthern, Petrohawk,
Pioneer, Riley and others
Abraxas, GeoSouthern, Petrohawk,
Pioneer, Riley and others
■ Existing pipeline capital investment
of $48 million
of $48 million
■ DK extension additional capital
investment of $100 million
investment of $100 million
■ Potential DK to Fashing project
under consideration - estimated
additional capital investment of $50
million
under consideration - estimated
additional capital investment of $50
million
10
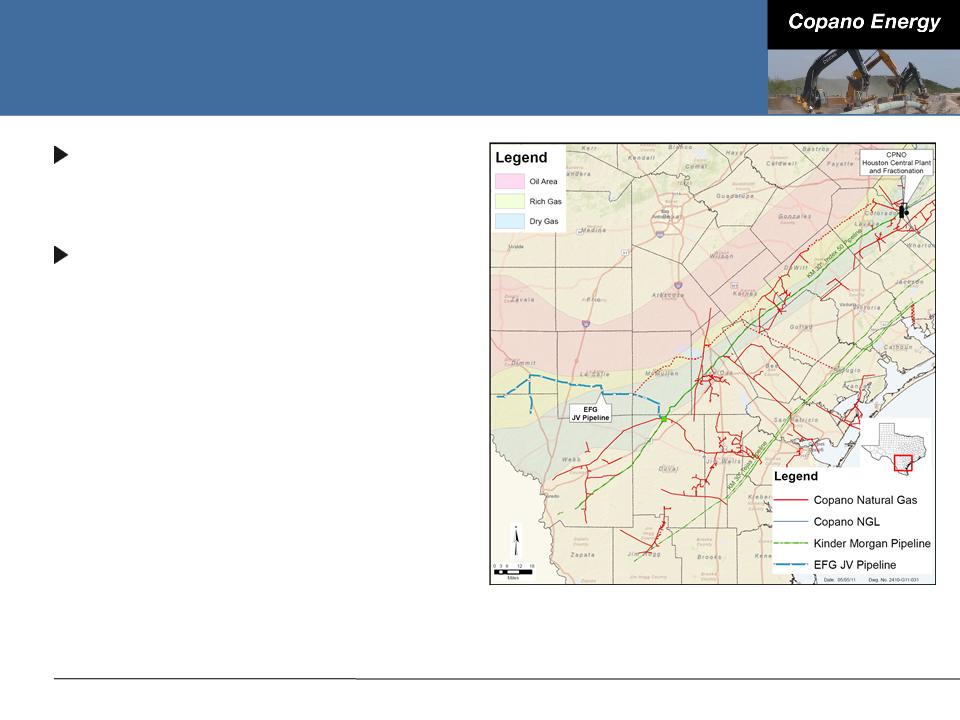
Southern Eagle Ford Shale
Eagle Ford Gathering (EFG)
■ 50/50 JV with Kinder Morgan
EFG pipeline
■ 114 miles of 30” and 24” pipe -
currently under construction
currently under construction
■ Expected completion 3Q 2011
■ Nominal capacity of 600,000
MMBtu/d
MMBtu/d
■ Long-term, fee-based contracts with
aggregate volume commitments
approaching 500,000 MMBtu/d
aggregate volume commitments
approaching 500,000 MMBtu/d
● SM Energy - July 2010
● Chesapeake - November 2010
● Anadarko - February 2011
■ Net capital investment of $87.5
million
million
11
Eagle Ford Gathering Crossover Project
Crossover project
■ 66 miles of 24” and 20” pipe
connecting Kinder Morgan’s Index
50 and Tejas 30” pipelines to
Formosa
connecting Kinder Morgan’s Index
50 and Tejas 30” pipelines to
Formosa
● Nominal pipeline capacity of
400,000 MMBtu/d
400,000 MMBtu/d
● Expected completion 4Q 2011
■ Allows an incremental 210,000
MMBtu/d of gas to flow on Eagle
Ford Gathering 30” pipeline
MMBtu/d of gas to flow on Eagle
Ford Gathering 30” pipeline
■ Processing, fractionation and
product sales at Formosa’s Point
Comfort complex
product sales at Formosa’s Point
Comfort complex
■ Net capital investment of $50
million
million
12
Houston Central Complex
Current capacity of 700 MMcf/d
■ 500 MMcf/d of lean oil processing
■ 200 MMcf/d of cryogenic processing
Multiple residue interconnects
■ Anticipated additional connection - Tres Palacios storage and header system
Cryogenic processing expansion of 400 MMcf/d in process
■ Improves NGL recoveries
■ Allows base loading of cryogenic plants with spillover to lean oil plant
■ Total capital investment of $145 million
13
Houston Central Complex
Fractionation expansion
■ Responding to increased producer demand,
liquids handling capacity will double at
Houston Central complex
liquids handling capacity will double at
Houston Central complex
■ Fractionation expansion from 22,000 Bbls/d
to 44,000 Bbls/d
to 44,000 Bbls/d
● All ethane and propane will move to Dow
through Copano purity pipelines
through Copano purity pipelines
■ Total capital investment of $66 million
● Includes fractionation facilities and related
plant upgrades and product pipeline
expansions
plant upgrades and product pipeline
expansions
● Expected completion 3Q 2011
14
Liberty NGL Pipeline
83-mile, 12” NGL pipeline extending from the Houston Central
complex to Markham NGL storage and Formosa’s Point Comfort
complex
complex to Markham NGL storage and Formosa’s Point Comfort
complex
■ Total capacity of 75,000 Bbls/d
■ Constructed through 50/50 JV with Energy Transfer
■ Expected completion early 3Q 2011
Long-term fractionation and product sales agreement with Formosa
on favorable terms
on favorable terms
■ Initial access to a minimum of 5,000 Bbls/d - 7,000 Bbls/d following Liberty
NGL pipeline completion
NGL pipeline completion
■ Upon completion of Formosa’s fractionation expansion, will have up to 37,500
Bbls/d of firm capacity starting 1Q 2013 for a 15-year term
Bbls/d of firm capacity starting 1Q 2013 for a 15-year term
Net capital investment of $26 million
15
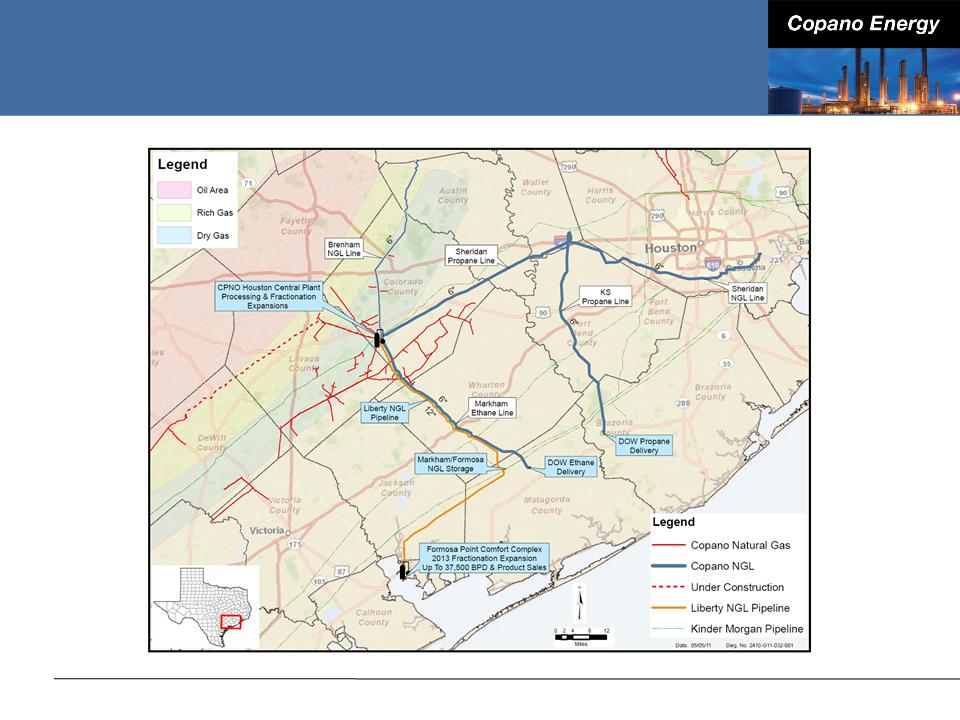
Houston Central NGL Infrastructure
16
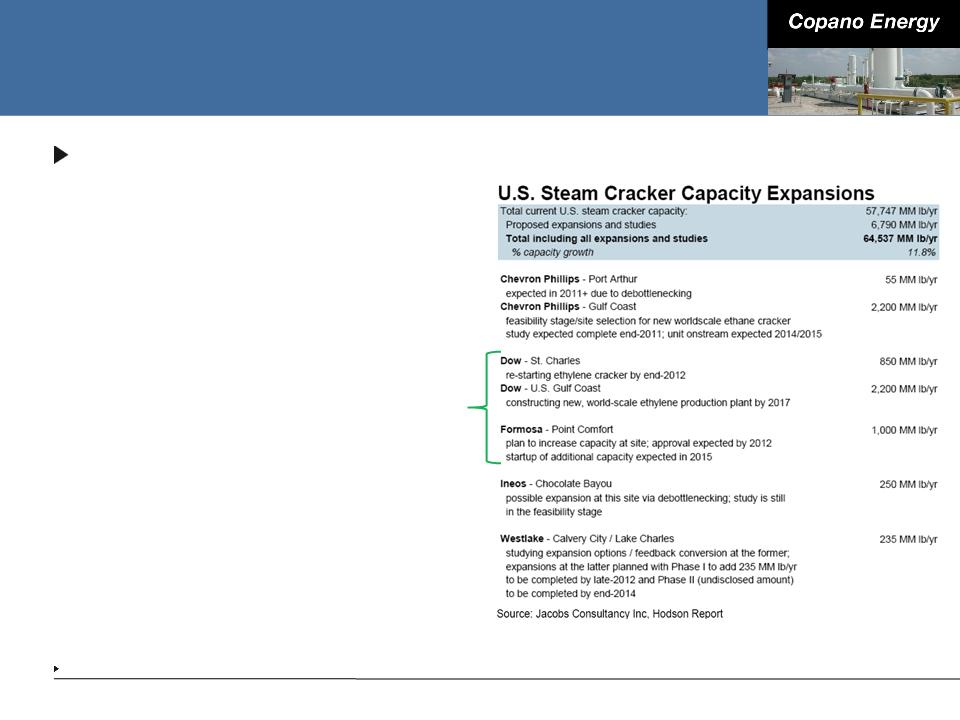
Gulf Coast Petrochemical Market Access
Copano has access to Dow
and, upon completion of
the Liberty NGL pipeline,
Formosa
and, upon completion of
the Liberty NGL pipeline,
Formosa
■ Among the largest end users
of NGLs in the U.S.
of NGLs in the U.S.
■ Taking into account
announced expansions, Dow
and Formosa’s combined
steam cracker capacity is
approximately 19% of total
U.S. capacity(1)
announced expansions, Dow
and Formosa’s combined
steam cracker capacity is
approximately 19% of total
U.S. capacity(1)
17
Source: Hodson Report.
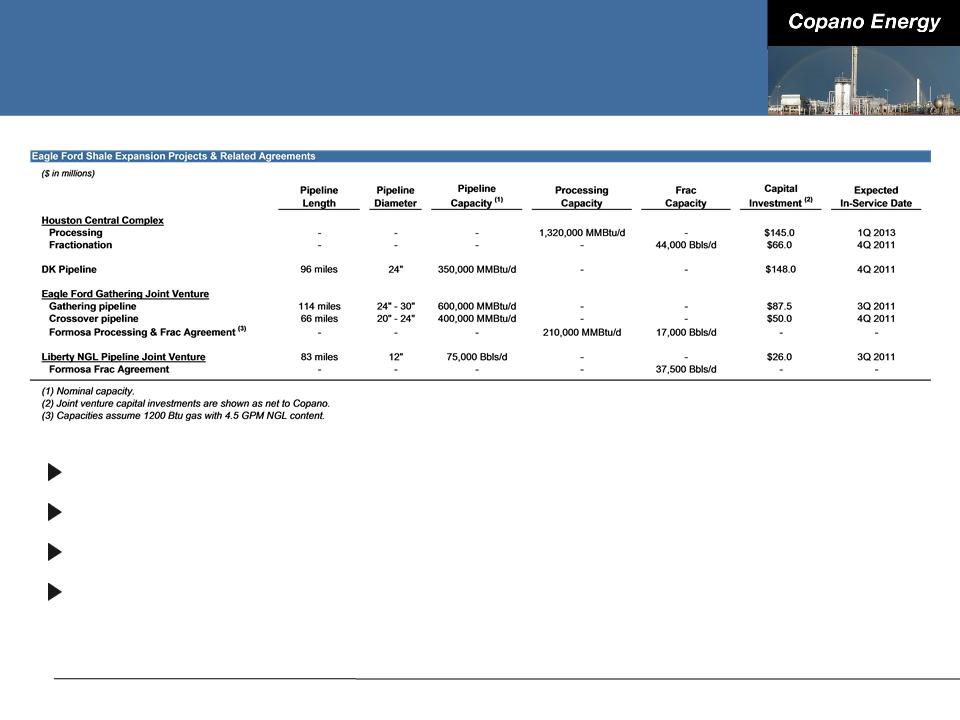
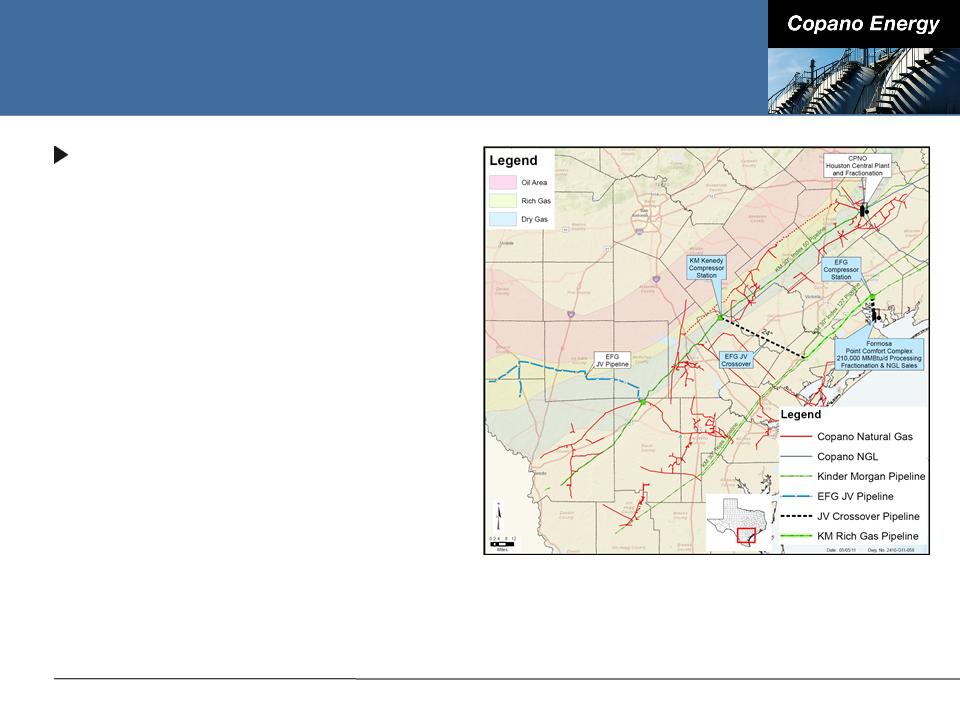
Summary of Eagle Ford Shale
Infrastructure
Infrastructure
18
Total capital investment of over $500 million
In excess of 1 Bcf/d of pipeline and processing capacity
Approaching 100,000 Bbls/d of fractionation capacity
Access to multiple markets for residue gas and NGLs
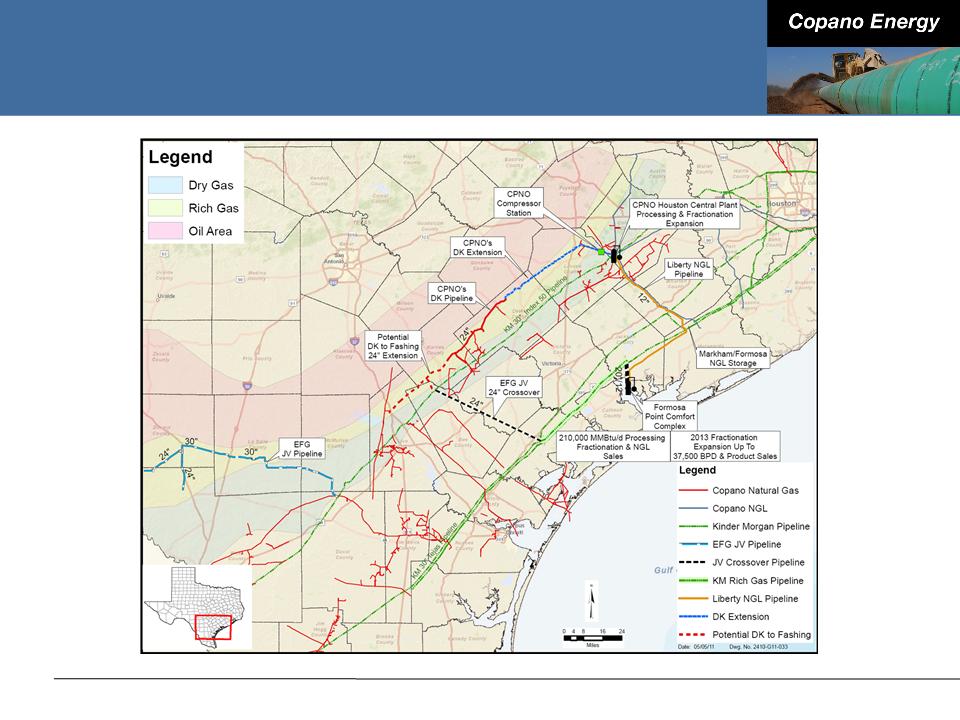
Combined Eagle Ford Shale Map
19

Business Segment Outlook
20
|
Eagle Ford Shale
Growth Projects |
Business Segment
Outlook |
|
Financing and
Commodity Price Sensitivity |
Conclusions
|

Texas Recent Developments
Saint Jo system
■ Primarily long-term gathering, treating and processing fee-for-service
business
business
■ Plant fully committed under contracts
■ System volumes have been averaging approximately 62,000 MMBtu/d
Eagle Ford Shale
■ Houston Central complex processing expansion
● Permitting underway with expected in-service date in 1Q 2013
■ Producers running over 30 rigs in areas served by Copano pipelines
■ Total Eagle Ford Shale volumes have been averaging approximately 115,000
MMBtu/d
MMBtu/d
● DK pipeline volumes - approximately 90,000 MMBtu/d
21

Texas Outlook
Saint Jo system
■ 16 rigs running in the area
● Still on track to connect approximately 150 wells in 2011
● Leasing activity continues
■ Based on producer discussions, expect activity to remain high
Eagle Ford Shale
■ Potential addition of interruptible volumes on Eagle Ford Gathering 30” pipeline
by mid-summer
by mid-summer
■ Expect to see further volume increases on both wholly owned and joint venture
assets in the second half of 2011 and beyond
assets in the second half of 2011 and beyond
Assuming current prices continue and the current outlook on
volumes, expect slightly higher segment gross margin in 2Q 2011
volumes, expect slightly higher segment gross margin in 2Q 2011
22
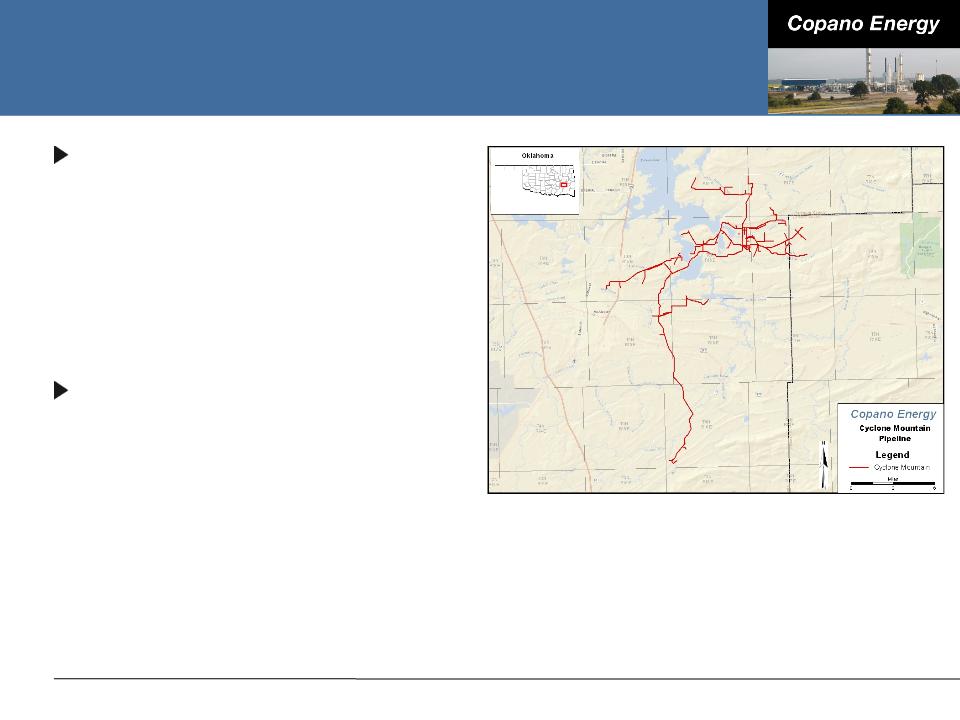
Oklahoma Recent Developments
Significant drilling activity in the
Woodford Shale around the
Cyclone Mountain system
Woodford Shale around the
Cyclone Mountain system
■ Average 1Q 2011 volumes of
approximately 75,000 MMBtu/d vs.
average 4Q 2010 of approximately
59,000 MMBtu/d
approximately 75,000 MMBtu/d vs.
average 4Q 2010 of approximately
59,000 MMBtu/d
Current system capacity
approximately 120 MMcf/d
approximately 120 MMcf/d
■ System expansion likely in 2H 2012
based on producer expectations
based on producer expectations
23
Oklahoma Outlook
Rich gas (primarily Hunton dewatering play)
■ Drilling activity has increased slightly in 2Q 2011 compared to 1Q 2011
■ 3 rigs currently running in the Hunton and 13 rigs in other rich gas areas
■ Attractive processing upgrade and low geologic risk
■ 2Q 2011 volumes expected to be slightly higher vs. 1Q 2011
● Increased volumes resulting from acquisition of Harrah plant
Lean gas (primarily Woodford Shale)
■ Drilling activity remains steady in 2Q 2011 compared to 1Q 2011
■ 3 rigs currently running
■ 2Q 2011 volumes expected to be slightly higher than 1Q 2011
At current commodity prices, expect Oklahoma gross margin to be
slightly higher in 2Q 2011
slightly higher in 2Q 2011
24
Rocky Mountains Outlook
Drilling and dewatering will be driven by commodity prices and
producer economics
producer economics
2Q 2011 volumes for Bighorn expected to be slightly lower vs. 1Q
2011
2011
2Q 2011 volumes for Fort Union expected to be lower vs. 1Q 2011
due to the start-up of Bison pipeline
due to the start-up of Bison pipeline
■ Do not expect material impact to Copano Adjusted EBITDA due to long-term
contractual commitments through 2017
contractual commitments through 2017
2011 Adjusted EBITDA expected to be slightly lower vs. 2010
25

Financing and Commodity Price
Sensitivity
Sensitivity
26
|
Eagle Ford Shale
Growth Projects |
Business Segment
Outlook |
|
Financing and
Commodity Price Sensitivity |
Conclusions
|
Liquidity and Capitalization
At March 31, 2011:
■ $69 million cash
■ $550 million revolving credit facility
● Approximately $310 million available
● Matures October 2012
■ $583 million senior notes
● $332.7 million 8.125% senior notes due 2016 (fully redeemed in 2Q 2011)
● $249.5 million 7.75% senior notes due 2018
■ Total debt to trailing 12-months Consolidated EBITDA(1) ratio of 3.44x
■ Total debt to total capitalization(2) ratio of 38%
On April 5, 2011, issued $360 million of 7.125% senior notes due
2021
2021
■ Proceeds used primarily to tender for existing 2016 notes (2016 notes fully
redeemed on May 6, 2011) - expect annual interest savings of approximately
$1.4 million for the next five years
redeemed on May 6, 2011) - expect annual interest savings of approximately
$1.4 million for the next five years
27
See Appendix for reconciliation of “Consolidated EBITDA” as defined in our credit agreement.
Defined as total debt plus total members’ capital.
Commodity Price Exposure
As Eagle Ford Shale and North Barnett Shale Combo volumes grow,
transition to more fee-based volumes will continue to reduce direct
commodity price exposure
transition to more fee-based volumes will continue to reduce direct
commodity price exposure
Note: Includes Copano’s share of gross margin from unconsolidated affiliates. Approximate percentages based on Copano
internal financial planning models.
internal financial planning models.
28
41%
27%
32%
39%
-12%
-2%
37%
39%
KW: Keep-whole
POP: Percentage of Proceeds

Hedging Strategy
Option-based, product-specific
2011 hedged at or near policy limits
■ Approximately 70% of ethane, propane, butane, natural gasoline and
condensate price exposure is hedged
condensate price exposure is hedged
Will continue adding to 2013 hedging positions during 2011
29

Conclusions
30
|
Eagle Ford Shale
Growth Projects |
Business Segment
Outlook |
|
Financing and
Commodity Price Sensitivity |
Conclusions
|

Conclusions
Focused on execution in the Eagle Ford Shale
Strong producer activity in north Texas continues
Focused on growth opportunities in the Woodford Shale in
Oklahoma
Oklahoma
Continue to evaluate strategic M&A opportunities
Shift to predominately fee-based contract mix underway
Ample liquidity and access to capital to support growth initiatives
31

Appendix
32
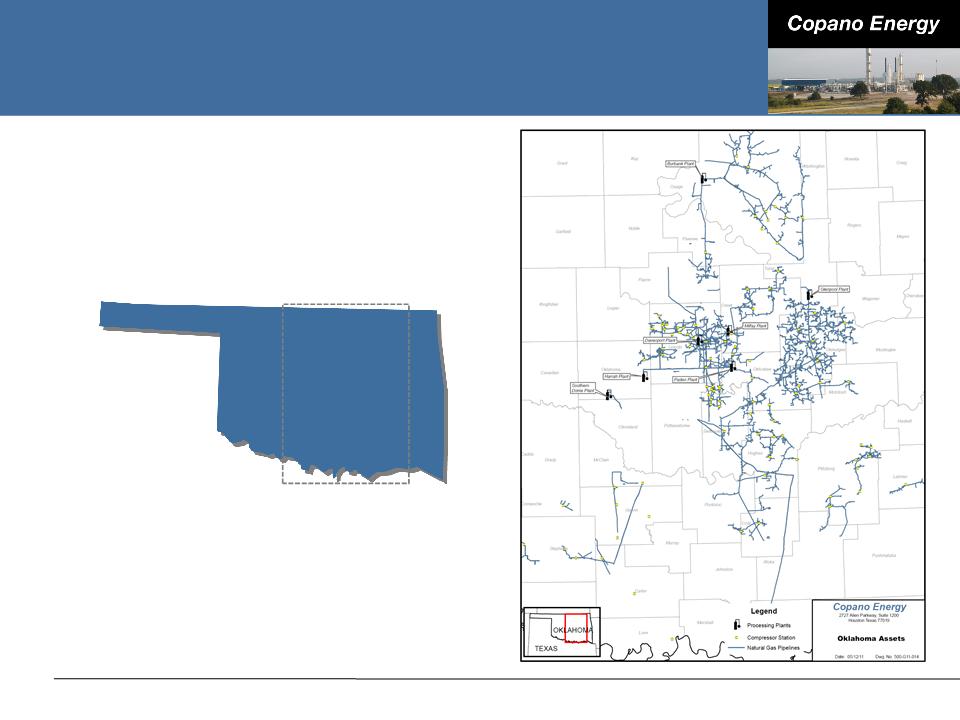
Oklahoma Assets
33
OKLAHOMA
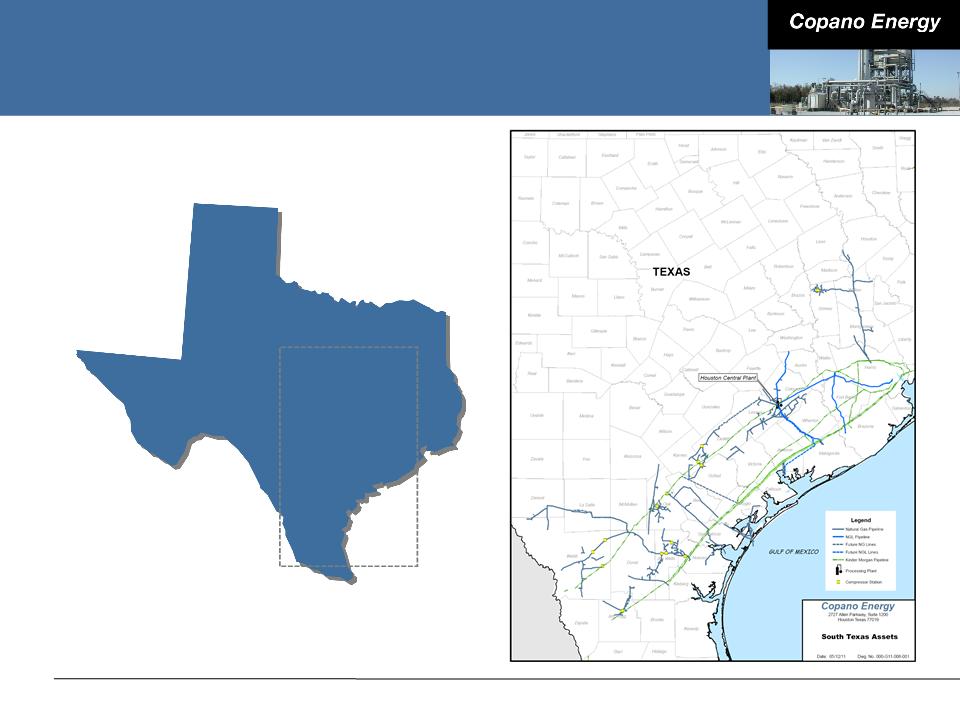
South Texas Assets
34
TEXAS
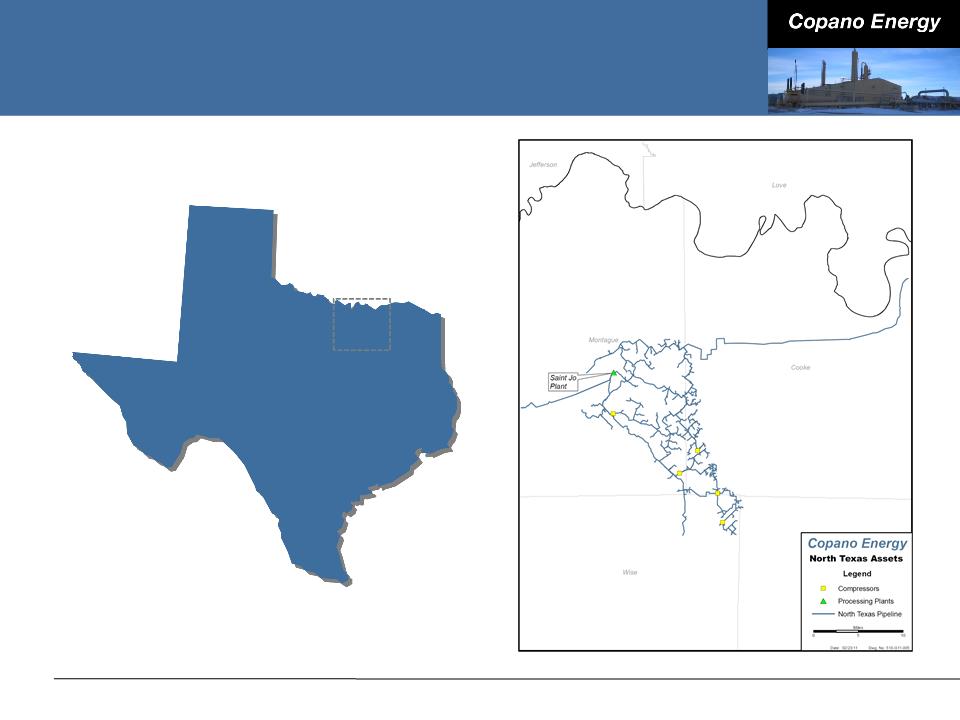
North Texas Assets
35
TEXAS
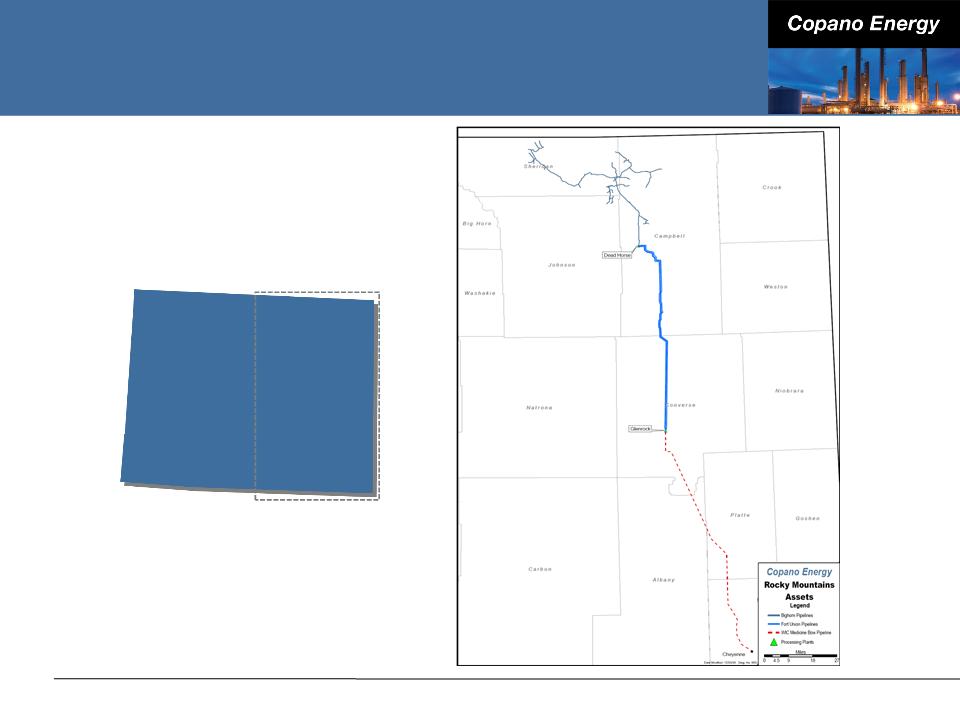
Rocky Mountains Assets
36
WYOMING
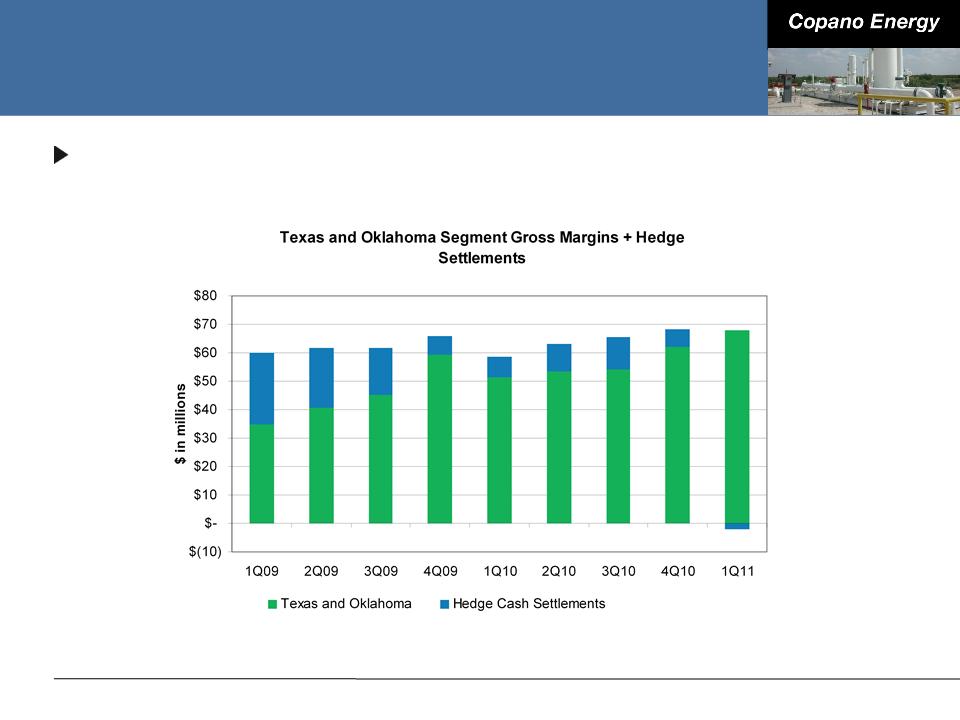
Combined Commodity-Sensitive Segment
Margins and Hedging Settlements
Margins and Hedging Settlements
Copano’s hedge portfolio supports cash flow stability
37
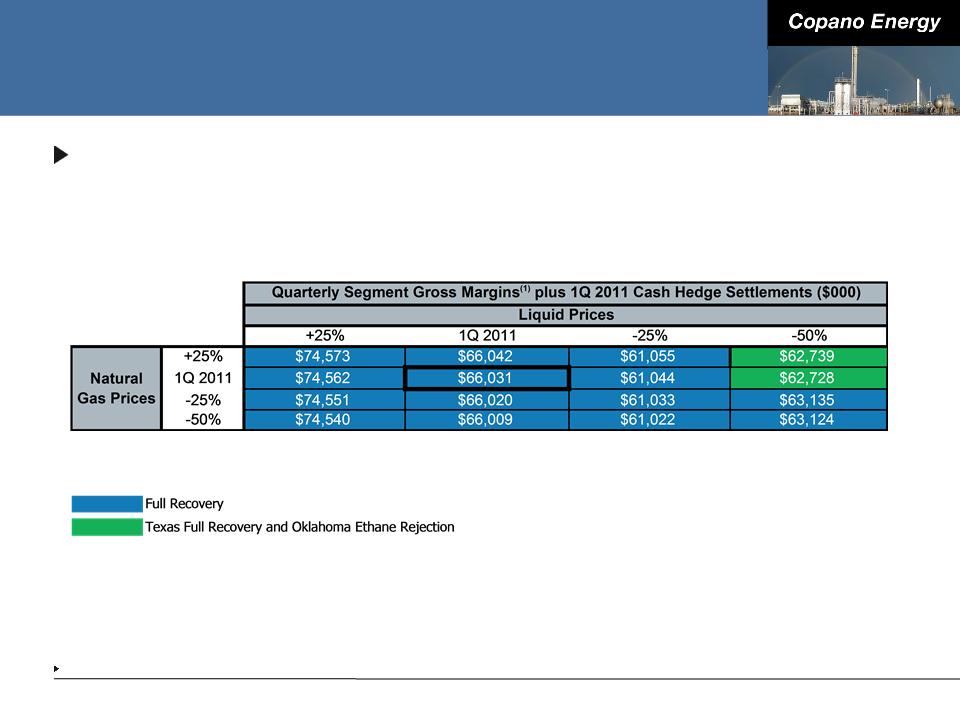
Commodity-Related Margin Sensitivities
Matrix reflects 1Q 2011 wellhead and plant inlet volumes, adjusted
using Copano’s 2011 planning model
using Copano’s 2011 planning model
38
Consists of Texas and Oklahoma Segment gross margins.
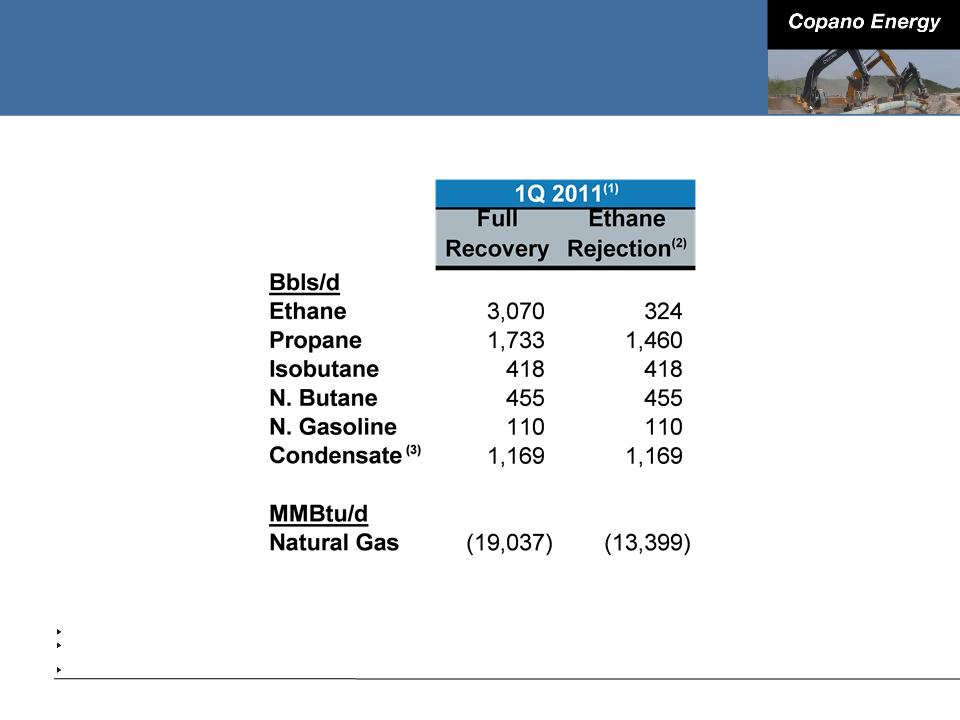
Oklahoma Net Commodity Exposure
39
Note: See explanation of processing modes in this Appendix. Values reflect rounding.
Source: Copano Energy internal financial planning models.
Ethane rejection at Paden plant is limited by nitrogen rejection facilities.
Reflects impact of producer delivery point allocations, offset by field condensate collection and stabilization.
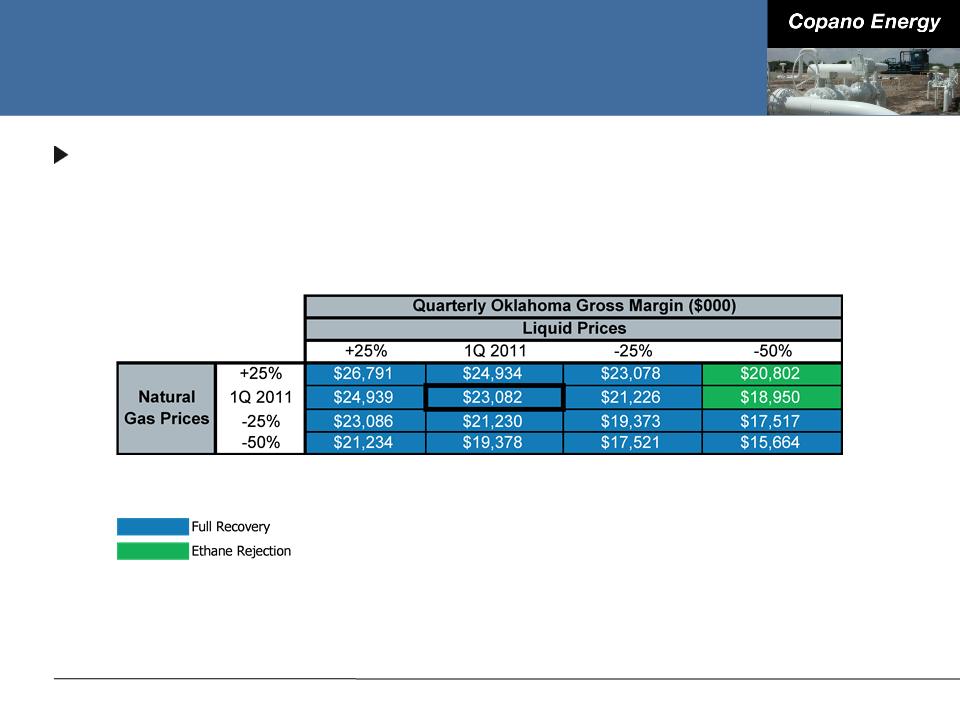
Oklahoma Commodity Price Sensitivities
Oklahoma segment gross margins excluding hedge settlements
■ Matrix reflects 1Q 2011 volumes, adjusted using Copano’s 2011 planning
model
model
40
Note: Please see this Appendix for definitions of processing modes and additional details.
Texas Net Commodity Exposure
41
Note: See explanation of processing modes in this Appendix.
Source: Copano Energy internal financial planning models. Based on 1Q 2011 daily wellhead/plant inlet volumes.
Fractionation at Houston Central complex permits significant reductions in ethane recoveries in ethane rejection mode. To optimize profitability, plant
operations can also be adjusted to partial recovery mode.
operations can also be adjusted to partial recovery mode.
At the Houston Central complex, pentanes+ may be sold as condensate.
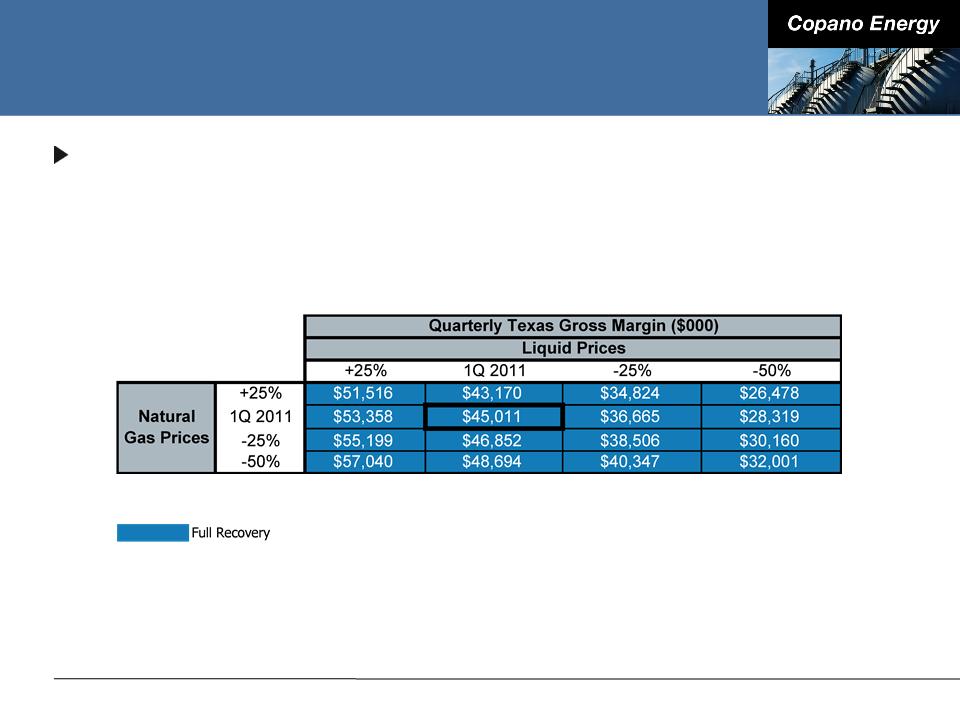
Texas Commodity Price Sensitivities
Texas segment gross margins excluding hedge settlements
■ Matrix reflects 1Q 2011 volumes and operating conditions, adjusted using
Copano’s 2011 planning model
Copano’s 2011 planning model
42
Note: Please see this Appendix for definitions of processing modes and additional details.

Rocky Mountains Sensitivities
1Q 2011 Adjusted EBITDA volume sensitivity (positive or negative
impact)
impact)
■ Bighorn: 10,000 MMBtu/d = $255,000(1)
■ Fort Union: 10,000 MMBtu/d = immaterial impact until physical volumes
exceed long-term contractual volume commitments
exceed long-term contractual volume commitments
● 1Q 2011 pipeline throughput: 434,744 MMBtu/d
● 1Q 2011 revenue based on 723,710 MMBtu/d of volume commitments
43
Note: See this Appendix for reconciliation of Adjusted EBITDA. Values reflect rounding.
Impact on Adjusted EBITDA based on Copano’s interest in the unconsolidated affiliate.
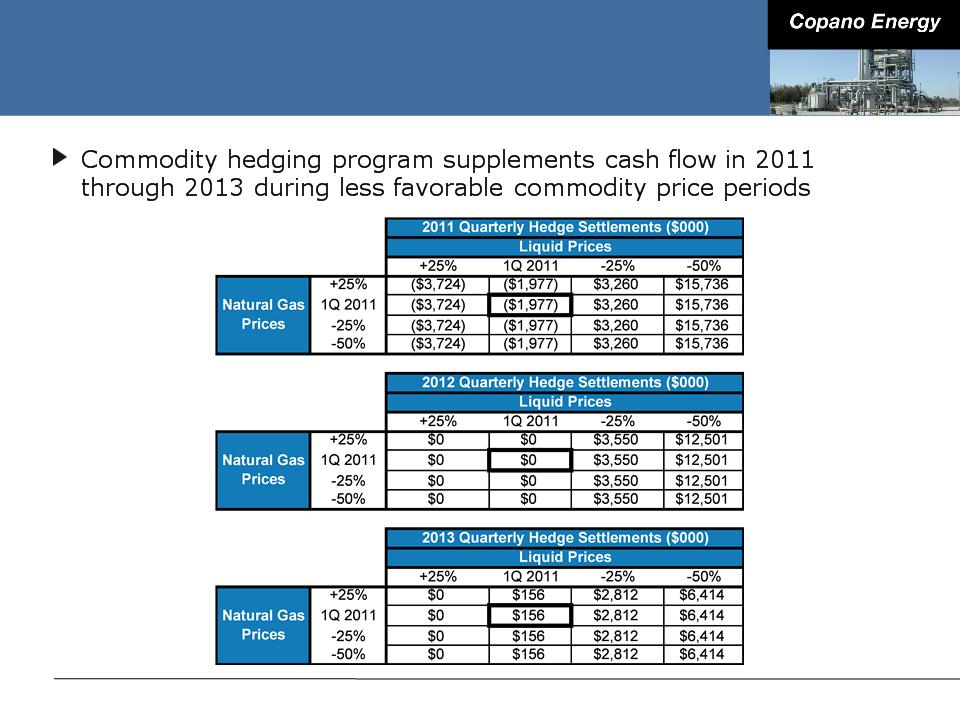
Hedging Impact of Commodity Price
Sensitivities
Sensitivities
44
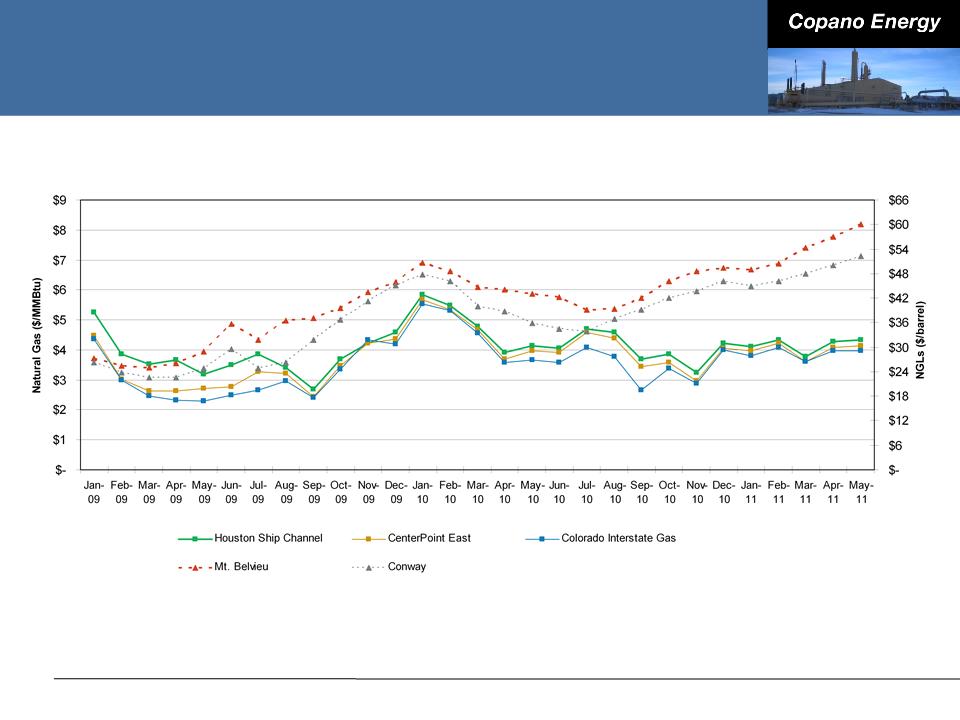
Historical Commodity Prices
45
Note: NGL prices for Jan-09 through Mar-11 are calculated based on the weighted-average product mix for the period indicated.
NGL prices for Apr-11 through May-11 are calculated based on the first quarter 2011 product mix.
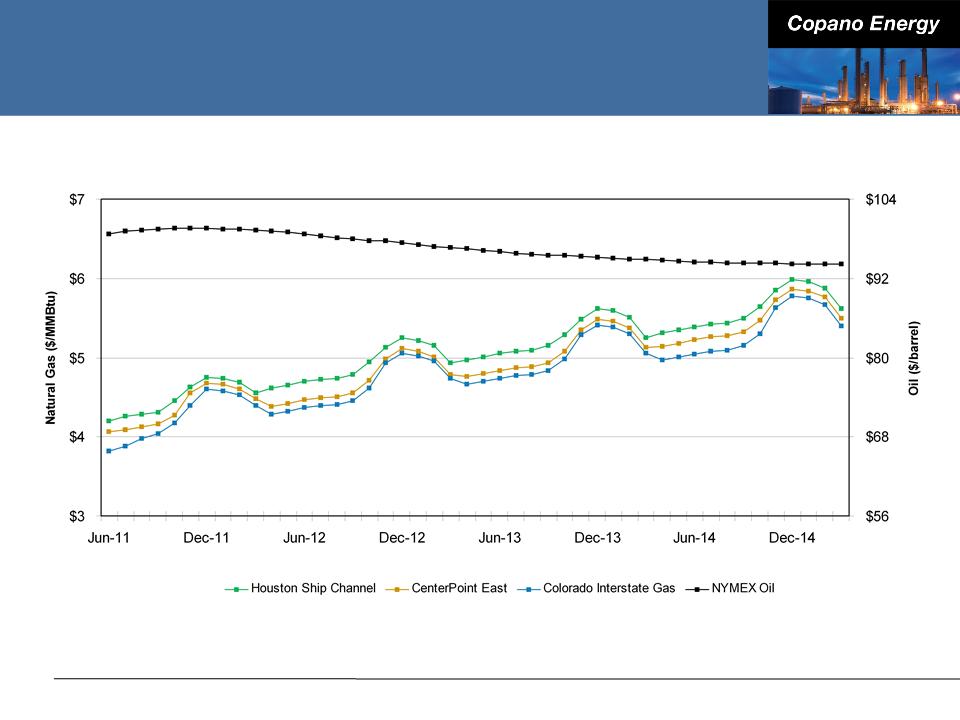
Forward Commodity Prices
46
Note: Forward prices as of May 10, 2011
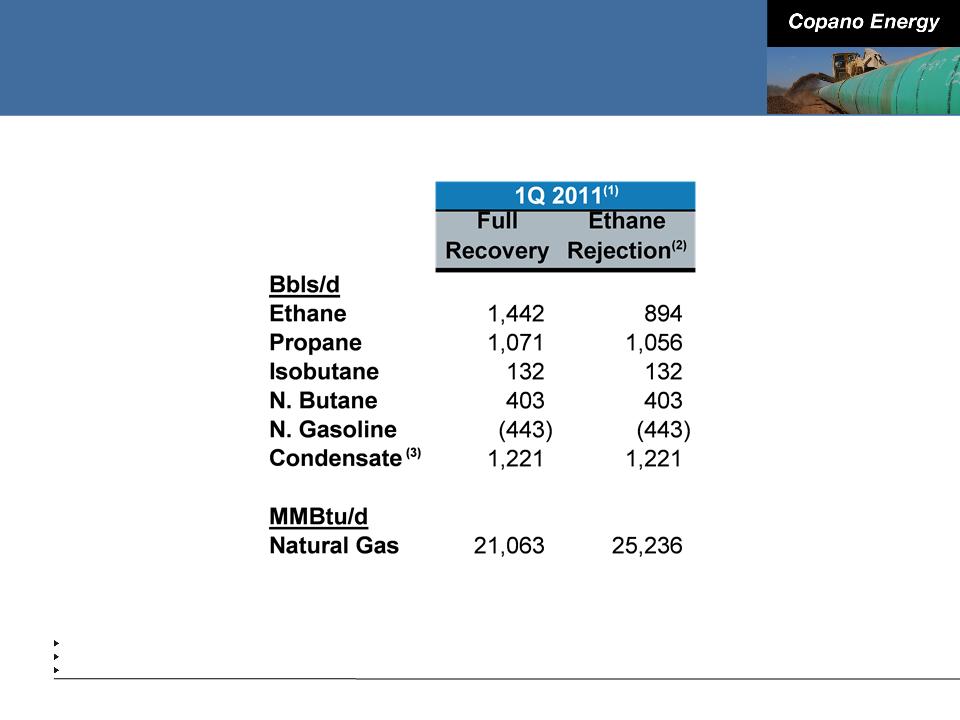
Processing Modes
47
|
Full Recovery
|
|
|
|
Texas and Oklahoma - If the value of
recovered NGLs exceeds the fuel and gas shrinkage costs of recovering NGLs |
|
Ethane Rejection
|
|
|
|
Texas and Oklahoma - If the value of ethane
is less than the fuel and shrinkage costs to recover ethane (in Oklahoma, ethane rejection at Paden plant is limited by nitrogen rejection facilities) |
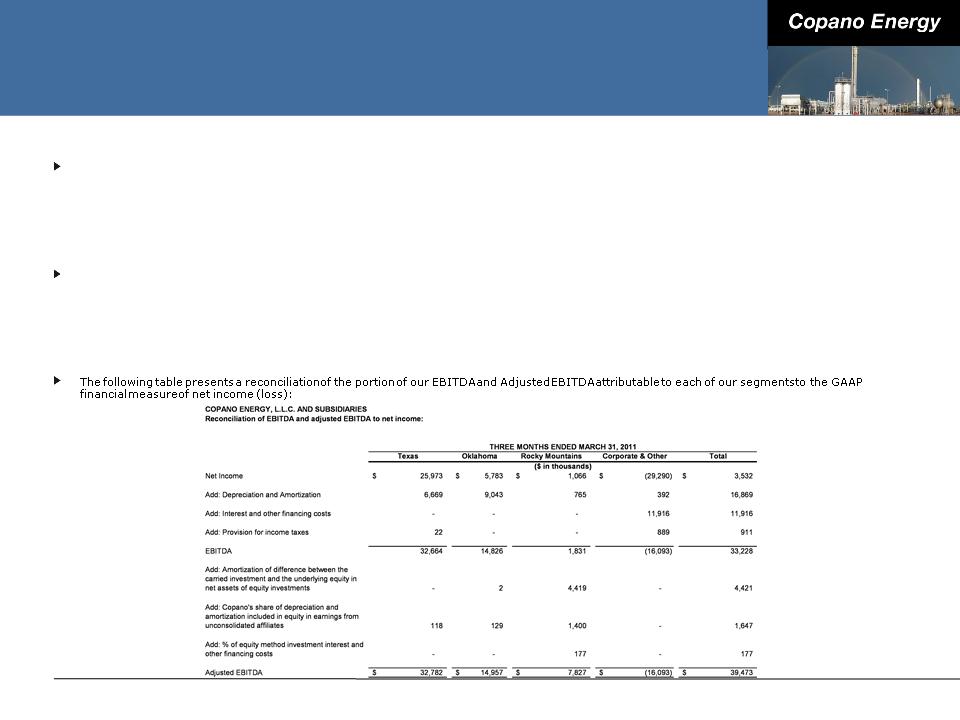
Reconciliation of Non-GAAP Financial
Measures
Measures
Adjusted EBITDA
We define EBITDA as net income (loss) plus interest expense, provision for income taxes and depreciation and amortization expense. Because a portion
of our net income (loss) is attributable to equity in earnings (loss) from our equity investees (which include Bighorn, Fort Union, Webb Duval and
Southern Dome), our management also calculates Adjusted EBITDA to reflect the depreciation and amortization expense embedded in equity in
earnings (loss) from unconsolidated affiliates. Specifically, our management determines Adjusted EBITDA by adding to EBITDA (i) the amortization
expense attributable to the difference between our carried investment in each unconsolidated affiliate and the underlying equity in its net assets, (ii)
the portion of each unconsolidated affiliate’s depreciation and amortization expense, which is proportional to our ownership interest in that
unconsolidated affiliate and (iii) the portion of each unconsolidated affiliate’s interest and other financing costs, which is proportional to our ownership
interest in that unconsolidated affiliate.
External users of our financial statements such as investors, commercial banks and research analysts use EBITDA or Adjusted EBITDA, and our
management uses Adjusted EBITDA, as a supplemental financial measure to assess:
management uses Adjusted EBITDA, as a supplemental financial measure to assess:
■ The financial performance of our assets without regard to financing methods, capital structure or historical cost basis;
■ The ability of our assets to generate cash sufficient to pay interest costs and support our indebtedness;
■ Our operating performance and return on capital as compared to those of other companies in the midstream energy sector, without regard to financing or capital
structure; and
structure; and
■ The viability of acquisitions and capital expenditure projects and the overall rates of return on alternative investment opportunities.
48
Reconciliation of Non-GAAP Financial
Measures
Measures
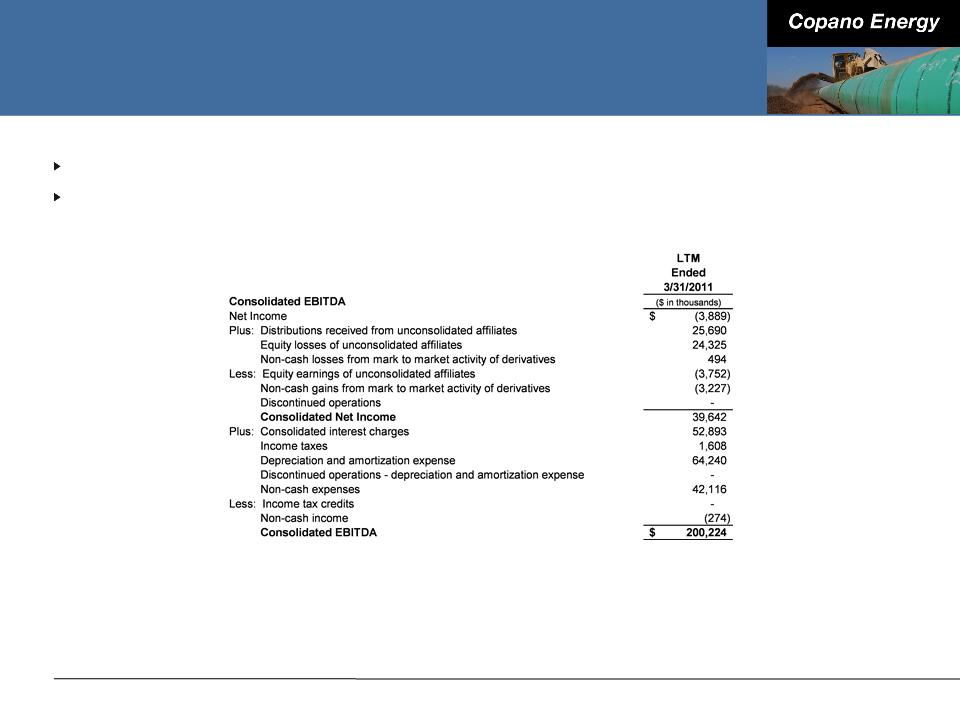
Consolidated EBITDA
EBITDA is also a financial measure that, with negotiated pro forma adjustments relating to acquisitions completed during the period, is reported to our
lenders as Consolidated EBITDA and is used to compute our financial covenants under our senior secured revolving credit facility.
lenders as Consolidated EBITDA and is used to compute our financial covenants under our senior secured revolving credit facility.
The following table presents a reconciliation of the non-GAAP financial measure of Consolidated EBITDA to the GAAP financial measure of net income
(loss):
(loss):
49

Definitions of Non-GAAP Financial
Measures
Measures
Total Distributable Cash Flow
We define total distributable cash flow as net income plus: (i) depreciation, amortization and impairment expense
(including amortization expense relating to the option component of our risk management portfolio); (ii) cash
distributions received from investments in unconsolidated affiliates and equity losses from such unconsolidated affiliates;
(iii) provision for deferred income taxes; (iv) the subtraction of maintenance capital expenditures; (v) the subtraction of
equity in earnings from unconsolidated affiliates and (vi) the addition of losses or subtraction of gains relating to other
miscellaneous non-cash amounts affecting net income for the period, such as equity-based compensation, mark-to-
market changes in derivative instruments, and our line fill contributions to third-party pipelines and gas imbalances.
Maintenance capital expenditures are capital expenditures employed to replace partially or fully depreciated assets to
maintain the existing operating capacity of our assets and to extend their useful lives, or other capital expenditures that
are incurred in maintaining existing system volumes and related cash flows.
Total distributable cash flow is a significant performance metric used by senior management to compare basic cash flows
generated by us (prior to the establishment of any retained cash reserves by our Board of Directors) to the cash
distributions we expect to pay our unitholders, and it also correlates with the metrics of our existing debt covenants.
Using total distributable cash flow, management can quickly compute the coverage ratio of estimated cash flows to
planned cash distributions. Total distributable cash flow is also an important non-GAAP financial measure for our
unitholders because it serves as an indicator of our success in providing a cash return on investment — specifically,
whether or not we are generating cash flow at a level that can sustain or support an increase in our quarterly distribution
rates. Total distributable cash flow is also used by industry analysts with respect to publicly traded partnerships and
limited liability companies because the market value of such entities’ equity securities is significantly influenced by the
amount of cash they can distribute to unitholders.
50