Attached files
| file | filename |
|---|---|
| EX-31.2 - TOP FLIGHT GAMEBIRDS, INC. | v221742_ex31-2.htm |
| EX-10.3 - TOP FLIGHT GAMEBIRDS, INC. | v221742_ex10-3.htm |
| EX-10.1 - TOP FLIGHT GAMEBIRDS, INC. | v221742_ex10-1.htm |
| EX-32.2 - TOP FLIGHT GAMEBIRDS, INC. | v221742_ex32-2.htm |
| EX-31.1 - TOP FLIGHT GAMEBIRDS, INC. | v221742_ex31-1.htm |
| EX-32.1 - TOP FLIGHT GAMEBIRDS, INC. | v221742_ex32-1.htm |
| EX-10.2 - TOP FLIGHT GAMEBIRDS, INC. | v221742_ex10-2.htm |
UNITED STATES
SECURITIES AND EXCHANGE COMMISSION
Washington, D.C. 20-549
FORM 10-Q
(Mark One)
|
x
|
QUARTERLY REPORT PURSUANT TO SECTION 13 OR 15(d) OF THE SECURITIES EXCHANGE ACT OF 1934
|
For the quarterly period ended March 31, 2011
or
|
o
|
TRANSITION REPORT UNDER SECTION 13 OR 15(d) OF THE EXCHANGE ACT
|
For the transition period from ______________ to _____________
Commission file number: 333-152286
GLOBAL PHARM HOLDINGS GROUP, INC.
(Exact name of registrant as specified in its charter)
|
Delaware
(State or other jurisdiction of incorporation or
organization)
|
20-8767223
(I.R.S. Employer Identification No.)
|
|
|
25/F New World Center, No. 6009 Yitian Road, Futian District, Shenzhen,
People’s Republic of China
(Address of principal executive offices)
|
518026
(Zip Code)
|
86-755-83230226
(Registrant’s telephone number, including area ccode)
Indicate by check mark whether the registrant (1) has filed reports required to be filed by Section 13 or 15(d) of the Securities Exchange Act of 1934 during the preceding 12 months (or for such shorter period that the registrant was required to file such reports), and (2) has been subject to such filing requirements for the past 90 days. Yes x No o
Indicate by check mark whether the registrant has submitted electronically and posted on its corporate Web site, if any, every Interactive Data File required to be submitted and posted pursuant to Rule 405 of Regulation S-T (§232.405 of this chapter) during the preceding 12 months (or for such shorter period that the registrant was required to submit and post such files).
Yes o No o
Indicate by check mark whether the registrant is a large accelerated filer, an accelerated filer, a non-accelerated filer or a smaller reporting company. See the definitions of “large accelerated filer,” “accelerated filer” and “smaller reporting company” in Rule 12b-2 of the Exchange Act.
|
Large accelerated filer o
|
Accelerated filer o
|
|
Non-accelerated filer o
|
Smaller reporting company x
|
Indicate by check mark whether the registrant is a shell company (as defined in Rule 12b-2 of the Exchange Act).
Yes o No x
As of May 12, 2011, there are 26,000,000 of $0.001 par value common stock issued and outstanding.
FORM 10-Q
GLOBAL PHARM HOLDINGS GROUP, INC.
INDEX
PART I. Financial Information
|
Page
|
||||||
|
Item 1.
|
Condensed Consolidated Financial Statements (unaudited)
|
1
|
||||
|
Condensed Consolidated Balance Sheets as of March 31, 2011 and December 31, 2010
|
2
|
|||||
|
Condensed Consolidated Statements of Income and Comprehensive Income for the Three Months Ended March 31, 2011 and 2010
|
3
|
|||||
|
Condensed Consolidated Statements of Cash Flows for the Three Months Ended March 31, 2011 and 2010
|
4
|
|||||
|
Notes to Unaudited Condensed Consolidated Financial Statements
|
5 - 12
|
|||||
|
Item 2.
|
Management’s Discussion and Analysis of Financial Condition or Plan of Operation
|
13
|
||||
|
Item 3.
|
Quantitative and Qualitative Disclosures About Market Risk
|
23
|
||||
|
Item 4.
|
Controls and Procedures
|
23
|
||||
|
PART II. Other Information
|
||||||
|
Item 1.
|
Legal Proceedings
|
25
|
||||
|
Item 1A.
|
Risk Factors
|
25
|
||||
|
Item 2.
|
Unregistered Sales of Equity Securities and Use of Proceeds
|
25
|
||||
|
Item 3.
|
Defaults Upon Senior Securities
|
25
|
||||
|
Item 4.
|
Removed and Reserved
|
25
|
||||
|
Item 5.
|
Other Information
|
25
|
||||
|
Item 6.
|
Exhibits
|
25
|
||||
GLOBAL PHARM HOLDINGS GROUP, INC.
CONDENSED CONSOLIDATED FINANCIAL STATEMENTS
TABLE OF CONTENTS
|
Condensed Consolidated Financial Statements (unaudited)
|
|
|
Condensed Consolidated Balance Sheets
|
2
|
|
Condensed Consolidated Statements of Income and Comprehensive Income
|
3
|
|
Condensed Consolidated Statements of Cash Flows
|
4
|
|
Notes to Condensed Consolidated Financial Statements
|
5 - 12
|
1
|
GLOBAL PHARM HOLDINGS GROUP, INC.
|
||
|
CONDENSED CONSOLIDATED BALANCE SHEETS
|
|
ASSETS
|
March 31, 2011
(Unaudited)
|
December 31, 2010
|
||||||
|
Current assets:
|
||||||||
|
Cash and cash equivalents
|
$ | 8,905,768 | $ | 4,271,498 | ||||
|
Accounts receivable
|
23,127,696 | 19,771,619 | ||||||
|
Inventories
|
17,737,211 | 16,058,760 | ||||||
|
Restricted cash
|
369,422 | 1,538,251 | ||||||
|
Other current assets
|
949,813 | 1,326,660 | ||||||
|
Total current assets
|
51,089,910 | 42,966,788 | ||||||
|
Property, plant and equipment, net
|
238,795 | 210,665 | ||||||
|
Total assets
|
$ | 51,328,705 | $ | 43,177,453 | ||||
|
LIABILITIES AND STOCKHOLDERS' EQUITY
|
||||||||
|
Current liabilities:
|
||||||||
|
Short-term loans
|
$ | 610,677 | $ | 1,972,150 | ||||
|
Bank acceptance
|
260,108 | 21,212 | ||||||
|
Accounts payable and accrued expenses
|
24,752,556 | 20,944,923 | ||||||
|
Income and other taxes payable
|
1,447,207 | 1,728,499 | ||||||
|
Due to related party
|
1,189,421 | 882,505 | ||||||
|
Total current liabilities
|
28,259,969 | 25,549,289 | ||||||
|
Stockholders' equity:
|
||||||||
|
Common stock, par value, $0.001 per share, 100,000,000 shares
authorized, 26,000,000 issued and outstanding.
|
26,000 | 26,000 | ||||||
|
Additional paid-in capital
|
9,200,623 | 9,200,623 | ||||||
|
Statutory surplus reserves
|
1,310,701 | 1,310,701 | ||||||
|
Retained earnings
|
11,837,920 | 6,546,406 | ||||||
|
Accumulated other comprehensive income
|
693,492 | 544,434 | ||||||
|
Total stockholders' equity
|
23,068,736 | 17,628,164 | ||||||
|
Total liabilities and stockholders' equity
|
$ | 51,328,705 | $ | 43,177,453 | ||||
See accompanying notes to the unaudited condensed consolidated financial statements.
2
|
GLOBAL PHARM HOLDINGS GROUP, INC.
|
|
CONDENSED CONSOLIDATED STATEMENTS OF INCOME AND COMPREHENSIVE INCOME
|
|
(Unaudited)
|
|
Three Months Ended March 31,
|
||||||||
|
2011
|
2010
|
|||||||
|
Revenues, net
|
$ | 42,120,757 | $ | 28,892,870 | ||||
|
Cost of goods sold
|
34,296,106 | 23,777,194 | ||||||
|
Gross profit
|
7,824,651 | 5,115,676 | ||||||
|
Expenses:
|
||||||||
|
Operating expenses
|
419,050 | 167,570 | ||||||
|
General and administrative
|
733,019 | 302,783 | ||||||
|
Income from operations
|
6,672,582 | 4,645,323 | ||||||
|
Interest (expense) income
|
(4,147 | ) | 5,915 | |||||
|
Miscellaneous expense
|
(1,874 | ) | - | |||||
|
Income before income taxes
|
6,666,561 | 4,651,238 | ||||||
|
Provision for income taxes
|
1,375,047 | 1,161,722 | ||||||
|
Net income
|
5,291,514 | 3,489,516 | ||||||
|
Other comprehensive income
|
||||||||
|
Foreign currency translation adjustment
|
149,058 | (812 | ) | |||||
|
Total comprehensive income
|
$ | 5,440,572 | $ | 3,488,704 | ||||
|
Earnings per share of common stock:
|
||||||||
|
Basic and diluted earnings per share
|
$ | 0.20 | $ | 0.18 | ||||
|
Basic and diluted weighted average shares
|
26,000,000 | 19,094,000 | ||||||
See accompanying notes to the unaudited condensed consolidated financial statements.
3
|
GLOBAL PHARM HOLDINGS GROUP, INC.
|
||||
|
CONDENSED CONSOLIDATED STATEMENTS OF CASH FLOWS
|
||||
|
(Unaudited)
|
|
Three Months Ended March 31,
|
||||||||
|
2011
|
2010
|
|||||||
|
Cash flows from operating activities
|
||||||||
|
Net income
|
$ | 5,291,514 | $ | 3,489,516 | ||||
|
Adjustments to reconcile net income to net cash provided by operating activities:
|
||||||||
|
Depreciation and amortization
|
18,894 | 16,975 | ||||||
|
Changes in operating assets and liabilities:
|
||||||||
|
Accounts receivable
|
(3,215,411 | ) | (2,522,535 | ) | ||||
|
Inventories
|
(1,569,016 | ) | (2,520,577 | ) | ||||
|
Restricted cash
|
1,173,196 | - | ||||||
|
Other current assets
|
383,506 | (1,685,213 | ) | |||||
|
Accounts payable and other accrued liabilities
|
3,657,596 | 4,011,196 | ||||||
|
Other taxes payable
|
(290,947 | ) | 329,736 | |||||
|
Due to related party
|
312,770 | (928,148 | ) | |||||
|
Net cash provided by operating activities
|
5,762,102 | 190,950 | ||||||
|
Cash flows from investing activities
|
||||||||
|
Purchase of property, plant and equipment
|
(45,560 | ) | (9,092 | ) | ||||
|
Cash flows from financing activities:
|
||||||||
|
Short-term loan borrowing
|
- | 219,713 | ||||||
|
Short-term loan repayments
|
(1,367,704 | ) | - | |||||
|
Bank acceptance
|
237,663 | (219,713 | ) | |||||
|
Dividend paid to the former shareholders
|
- | (3,208,521 | ) | |||||
|
Net cash used in financing activities
|
(1,130,041 | ) | (3,208,521 | ) | ||||
|
Net increase (decrease) in cash and cash equivalents
|
4,586,501 | (3,026,663 | ) | |||||
|
Effect of exchange rate changes on cash and cash equivalents
|
47,769 | (3,245 | ) | |||||
|
Cash and cash equivalents - beginning of period
|
4,271,498 | 7,455,147 | ||||||
|
Cash and cash equivalents - end of period
|
$ | 8,905,768 | $ | 4,425,239 | ||||
| - | ||||||||
|
Supplemental disclosure of cash flow information:
|
||||||||
|
Cash paid for interest
|
$ | 10,747 | $ | 829 | ||||
|
Cash paid for income taxes
|
$ | 1,179,482 | $ | 690,986 | ||||
See accompanying notes to the unaudited condensed consolidated financial statements.
4
GLOBAL PHARM HOLDINGS GROUP, INC
NOTES TO THE UNAUDITED CONDENSED CONSOLIDATED FINANCIAL STATEMENTS
MARCH 31, 2011
1. Description of Business and the Merger
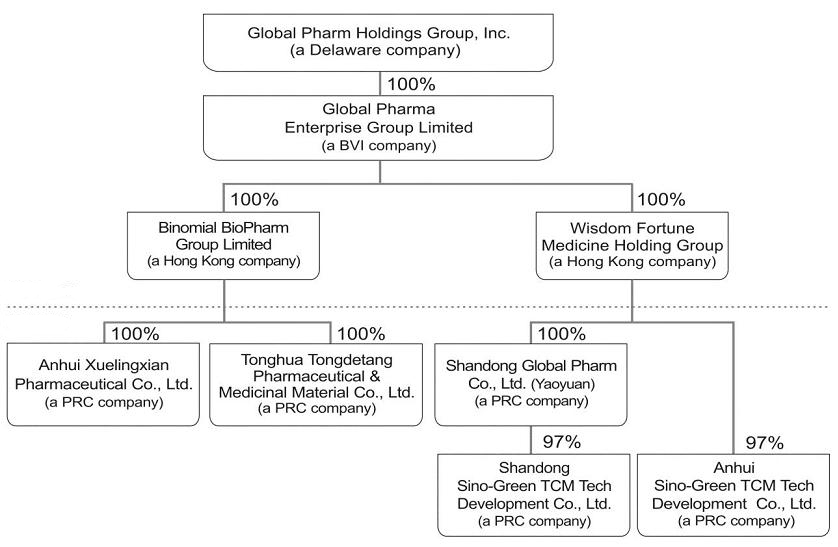
Global Pharm Holdings Group, Inc. (“Global Pharm” or the “Company”) was incorporated in Delaware on February 9, 2007. The Company engages in the wholesale and distribution of pharmaceutical-related products, and herbal cultivation business in China through its indirectly owned Chinese subsidiaries, including Tonghua Tongdetang Pharmaceutical and Medicinal Material Co., Ltd. (“Tongdetang”), Anhui Xuelingxian Pharmaceutical Co., Ltd. (“Xuelingxian”), Shandong Global Pharm Co., Ltd. (“Yaoyuan”), Anhui Sino-Green TCM Tech Development Co., Ltd. (“Anhui Sino-Green TCM Tech”) and Shandong Sino-Green TCM Tech Development Co., Ltd. (“Shandong Sino-Green TCM Tech” and, together with Xuelingxian, Tongdetang, Yaoyuan and Anhui Sino-Green TCM Tech, the “PRC Subsidiaries”).
Accounting Treatment of the Merger; Financial Statement Presentation
The Company was incorporated in Delaware on February 9, 2007 under the name “Top Flight Game Birds, Inc.” Prior to the merger as described below, the Company was a non-operating shell company. On August 12, 2010, the Company entered into a Share Exchange Agreement (the “Share Exchange Agreement”) with Global Pharm BVI Enterprise Group Limited, a British Virgin Island company formed on June 14, 2010 (“Global Pharm BVI”). Pursuant to the Share Exchange Agreement, the Company issued 1,800,000 of its restricted shares to acquire all of the issued and outstanding shares of Global Pharm BVI. Immediately subsequent to the merger, the former stockholders and key management of Global Pharm BVI were given certain call rights to acquire an aggregate of 80.36% of the outstanding common stock of the Company at four different occurrence dates, contingent on the attainment of various targets. In addition, all of the officers and directors of Global Pharm BVI were appointed as officers and directors of the Company immediately following the merger. On September 20, 2010, the Company changed its name to Global Pharm Holdings Group, Inc. Subsequent to the merger, all of the targets were attained and, upon the exercise of the call rights, the former stockholders and key management of Global Pharm BVI currently own an aggregate of 80.36% of the outstanding common stock of the Company.
5
The merger of a private operating company into a non-operating public shell company with nominal net assets is considered to be a capital transaction in substance, rather than a business combination, for accounting purposes. Accordingly, the Company treated this transaction as a reverse merger (the “Reverse Merger”). These transactions are considered to be capital transactions in substance, rather than business combinations. Accordingly, the Share Exchange Agreement has been accounted for as a recapitalization and, for accounting purposes, Global Pharma BVI is considered the acquirer in the Reverse Merger. The historical consolidated financial statements are those of Global Pharma BVI.
2. Basis of Presentation and Summary of Significant Accounting Policies
Basis of Presentation
The accompanying unaudited Condensed Consolidated Financial Statements have been prepared in accordance with generally accepted accounting principles for interim financial information and with the instructions to Form 10-Q adopted under the Securities Exchange Act of 1934, as amended. Accordingly, they do not include all of the information and footnotes required by accounting principles generally accepted in the United States of America (“U.S. GAAP”) for complete financial statements. In the opinion of the Company’s management, the accompanying Unaudited Condensed Consolidated Financial Statements contain all adjustments (consisting of normal recurring accruals and adjustments) necessary to present fairly the financial position, results of operations and cash flows of the Company at the dates and for the periods indicated. The interim results for the period ended March 31, 2011 are not necessarily indicative of results for the full fiscal year ending December 31, 2011 or any other future interim periods. Because the merger was accounted for as a reverse acquisition under generally accepted accounting principles, the financial statements for periods prior to August 12, 2010 reflect only the operations of Global Pharm BVI.
These unaudited Condensed Consolidated Financial Statements have been prepared by management and should be read in conjunction with the Financial Statements and notes thereto included in the Company’s Annual Report on Form 10-K for the year ended December 31, 2010 filed with the Securities and Exchange Commission.
The preparation of financial statements in conformity with generally accepted accounting principles requires that management make estimates and assumptions that affect the reported amounts of assets and liabilities and disclosure of contingent assets and liabilities at the date of the financial statements and the reported amounts of revenues and expenses during the reporting periods. Estimates and assumptions principally relate to services performed by third parties but not yet invoiced, estimates of the fair value and forfeiture rates of stock options issued to employees and consultants, and estimates of the probability and potential magnitude of contingent liabilities. Actual results could differ from those estimates.
6
Principles of Consolidation
The unaudited condensed consolidated financial statements include the accounts of Global Pharm Holdings Group, Inc. and its direct and indirect wholly owned subsidiaries. All significant intercompany accounts and transactions have been eliminated in consolidation.
Foreign Currency Translation
The Company’s functional currency is the Renminbi (“RMB”). The unaudited condensed consolidated financial statements of the Company are translated from RMB into US$. Accordingly, all assets and liabilities are translated at the exchange rates prevailing at the balance sheet dates, all income and expenditure items are translated at the average rates for each of the periods and equity accounts, except for retained earnings, are translated at the rate at the transaction date. Retained earnings reflect the cumulative net income (loss) translated at the average rates for the respective periods since inception less dividends translated at the rate at the transaction date.
RMB is not a fully convertible currency. All foreign exchange transactions involving RMB must take place either through the People's Bank of China (the "PBOC") or other institutions authorized to buy and sell foreign exchange. The exchange rates adopted for the foreign exchange transactions are the rates of exchange quoted by the PBOC, which are determined largely by supply and demand. Translation of amounts from RMB into US$ has been made at the following exchange rates for the respective periods:
|
Three Months Ended March 31,
|
|||
|
2011
|
2010
|
||
|
Assets and liabilities
|
1 US $ : 6.55011 RMB
|
1 US $ : 6.82580 RMB
|
|
|
Statement of income
|
1 US $ : 6.58037 RMB
|
1 US $ : 6.82710 RMB | |
The resulting translation adjustments are recorded as other comprehensive income in the unaudited condensed consolidated statement of income and comprehensive income.
Basic and Diluted Earnings per Share
The Company’s basic earnings per share is computed using the weighted-average number of shares outstanding for the periods presented.
Diluted earnings per share is based on the assumption that any dilutive options, warrants or other instruments were converted or exercised. Dilution is computed by applying the treasury stock method. Under this method, the Company’s outstanding stock options are assumed to be exercised, and funds thus obtained are assumed to be used to purchase common stock at the average market price during the period. For the three months ended March 31, 2011 and 2010, the Company had no dilutive securities.
7
|
3.
|
Short-Term Loans
|
Short-term loans consist of the following:
|
Date obtained
|
Term
|
Interest
|
Loan amount
|
Payment
|
March 31, 2011
|
December 31, 2010
|
|||
|
12/28/10
|
December 28, 2010 - March 27, 2011
|
5.89%
|
$1,365,335
(RMB 9 million)
|
Interest payable monthly, principle due at maturity
|
$ |
-
|
$ |
1,365,335
|
|
|
12/31/10
|
December 31, 2010 - December 31, 2011
|
6.97%
|
$455,111
(RMB 3 million)
|
Interest payable monthly, principle due at maturity
|
458,008
|
455,111
|
|||
|
5/7/10
|
June 1, 2010 - May 31, 2011
|
5.58%
|
$151,704
(RMB 1 million)
|
Interest payable quarterly, principle due at maturity
|
152,669
|
151,704
|
|||
|
Total
|
$ |
610,677
|
$ | 1,972,150 | |||||
On December 28, 2010, the Company entered into a credit agreement with Shandong Qilu Bank for a loan in the amount of $1,365,335, which was secured by a guarantee by the Company to maintain a bank deposit balance of $1,517,039 with Shandong Qilu Bank. The bank deposit was presented as restricted cash on the Company’s balance sheet at December 31, 2010. As of March 31, 2011, the short-term loan balance was paid in full and the cash deposit become unrestricted.
On December 30, 2010, the Company entered into a credit agreement with Shandong Qilu Bank for a loan in the amount of $455,111, which is secured by a pledge of the Company’s inventory, valued at RMB 6 million, or $910,223. Shandong QiluBank has authorized a third party to monitor the pledged inventory.
On May 7, 2010, the Company entered into a credit agreement with Construction Bank of China for a loan in the amount of $151,704, which is secured by a guarantee by two of the Company’s shareholders and the property owned by Bozhou City Herb Research Institute , valued at RMB4 million or $606,815.
Interest expense was $10,747 and $5,237 for the three months ended March 31, 2011 and 2010, respectively.
|
4.
|
Income and Other Taxes Payable
|
Income and other taxes payable consist of the following:
|
|
March 31, 2011
|
December 31, 2010
|
|||||
|
Income tax payable
|
$ | 1,381,400 | $ | 1,177,439 | |||
|
Value-added tax payable
|
43,959 | 445,052 | |||||
|
City construction tax payable
|
15,438 | 31,154 | |||||
|
Stamp duty payable
|
6,183 | 5,054 | |||||
|
Individual tax payable
|
227 | 69,800 | |||||
|
Total other tax payable
|
$ | 1,447,207 | $ | 1,728,499 | |||
8
|
5.
|
Related Party Transactions
|
Parties are considered to be related if one party has the ability, directly or indirectly, to control the other party or exercise significant influence over the other party in making financial and operational decisions. Parties are also considered to be related if they are subject to common control or common significant influence.
The following table sets forth the amounts due with related parties:
|
Related Party
|
Relationship
|
Nature
|
March 31, 2011
|
December 31,2010
|
||||||
|
Yunlu Yin
|
Director, Chairman, CEO
|
Business expenses paid personally
|
$ | 1,151,571 | $ | 851,005 | ||||
|
An Fu
|
Director, CFO
|
Accrued salary
|
14,000 | 19,000 | ||||||
|
Dan Li
|
Board secretary
|
Accrued salary
|
20,000 | 12,500 | ||||||
|
Peitong Yu
|
Shareholder
|
Accrued salary
|
1,925 | - | ||||||
|
Zhixian Long
|
Shareholder
|
Accrued salary
|
1,925 | - | ||||||
|
Total
|
$ | 1,189,421 | $ | 882,505 | ||||||
The amount due to related parties are noninterest bearing and, as of May 13, 2011, $14,000 has been repaid. The Company anticipates paying the remaining balance to Mr. Yin in 2012.
|
6.
|
Statutory Reserve
|
The laws and regulations of the People’s Republic of China (the “PRC”) require that before a foreign invested enterprise can legally distribute profits, it must first satisfy all tax liabilities, provide for losses in previous years, and make allocations, in proportions determined at the discretion of the board of directors, to the statutory reserve. The statutory reserves include the surplus reserve fund.
The Company is required to transfer 10% of its net income, as determined in accordance with PRC accounting rules and regulations, to a statutory surplus reserve fund until such reserve balance reaches 50% of the Company’s PRC subsidiaries’ registered capital. The transfer to this reserve must be made before distribution of any dividends to shareholders. Transfers to the statutory surplus reserve fund were nil for the three months ended March 31, 2011 and 2010. As of March 31, 2011, the Company has fulfilled the reserve requirement.
The surplus reserve fund is non-distributable other than during liquidation and can be used to fund previous years’ losses, if any, and may be utilized for business expansion or converted into share capital by issuing new shares to existing shareholders in proportion to their shareholding or by increasing the par value of the shares currently held by them, provided that the remaining reserve balance after such issue is not less than 50% of the registered capital of the Company’s PRC subsidiaries.
9
|
7.
|
Commitments
|
Capital Commitments
On April 6, 2011, the Company obtained the business license of Anhui Sino-Green TCM Tech (see Note 10, Subsequent Event – Joint Venture, relating to the Anhui Sino-Green TCM Tech). Hong Kong Wisdom Fortune Medicine Holding Group Limited, a subsidiary of the Company (“Wisdom Fortune”), together with Anhui Qianyi Pharmaceutical Co., Ltd. (“Qianyi Pharmaceutical”), a PRC company, established the Joint Venture, Anhui Sino-Green TCM Tech, in Bozhou City, Anhui Province. The registered capital of Anhui Sino-Green TCM Tech is $10 million. Wisdom Fortune will invest $9.7 million and Qianyi Pharmaceutical will invest $0.3 million, which reflect 97 percent and 3 percent of the ownership of Anhui Sino-Green TCM Tech, respectively. The Company is required to pay approximately $1.5 million registered capital by July 6, 2011 and $8.2 million by April 6, 2013. The Company will fund the registered capital from working capital.
On April 21, 2011, the Company obtained the business license of Shandong Sino-Green TCM Tech (see Note 10, Subsequent Event – Joint Venture, relating to the Shandong Sino-Green TCM Tech). Yaoyuan together with Jinan Linong TCM Plantation Co., Ltd. (“Jinan Linong”), a PRC company, established the Joint Venture, Shandong Sino-Green TCM Tech, in Jinan City, Shandong Province. The registered capital of Shandong Sino-Green TCM Tech is RMB 10 million (approximately $1.5 million). Yaoyuan will invest RMB 9.7 million (approximately $1.5 million) and Jinan Linong will invest RMB 0.3 million (approximately $0.1 million), which reflect 97 percent and 3 percent of the ownership of Shandong Sino-Green TCM Tech, respectively. The Company is required to pay $0.2 million registered capital by July 21, 2011 and $1.3 million by April 21, 2013. The Company will fund the registered capital from working capital. On April 20, 2011, Yaoyuan paid RMB 9.7 million (approximately $1.5 million) on registered capital.
Lease Commitments
The Company entered into two land rent agreements on January 1, 2011. The following table sets forth the lessor, term, payment and description of the leased property:
|
No.
|
Lessor
|
Term
|
Rent (RMB)
|
Rent (US$)
|
Description
|
|
1
|
Mengwang Village Committee of Dayang County, Qiaocheng District, Bozhou City, Anhui Province, PRC
|
January 1, 2011-December 31, 2015
|
6,820,000 per year
|
$1,041,204 per year
|
Used for herbal cultivation, totaling 1,021 acres.
|
|
2
|
Limenlou Village Committee of Shijiuli County, Qiaocheng Dictrict, Bozhou City, Anhui Province, PRC
|
January 1, 2011-December 31, 2015
|
5,280,000 per year
|
$806,095 per year
|
Used for herbal cultivation, totaling 791 acres.
|
10
|
8.
|
Concentrations
|
One vendor accounted for approximately 38% of the Company’s purchases for the three months ended March 31, 2011; one vendor accounted for approximately 32% of the Company’s purchases for the three months ended March 31, 2010.
One vendor accounted for approximately 39% of the Company’s outstanding accounts payable at March 31, 2011; one vendor accounted for approximately 37% of the Company’s outstanding accounts payable at March 31, 2010.
There were no customers who accounted for greater than 10% of sales for each of the periods ended March 31, 2011 and 2010.
|
9.
|
Segment Reporting
|
The Company uses the management approach model for segment reporting. The management approach model is based on how management organizes segments within a company for making operating decisions and assessing performance. Reportable segments are based on products and services, geography, legal structure, management structure or any other manner in which management disaggregates a company. Based on this model, the Company has determined that it has reportable four segments. The Company’s principal businesses are pharmaceutical products distribution, TCM processing and distribution, herbal cultivation and sales, and flower tea bags. All sales were sold to the customers in PRC.
Based on the various operation activities, the Company’s reportable segments are as follows:
|
·
|
Pharmaceutical products distribution – the sale of healthcare products to hospitals and pharmacy shops.
|
|
·
|
TCM processing and distribution – rough processing and sale of TCM product.
|
|
·
|
Herbal cultivation and sales – the planting, processing and selling of herbs in China.
|
|
·
|
Flower tea bags – manufacture and sale of flower tea bags.
|
|
For the three months ended March 31, 2011 (unaudited)
|
||||||
|
USD $
|
Pharmaceutical products distribution
|
TCM processing and distribution
|
Herbal cultivation and sales
|
Flower tea bags
|
Corporate
|
Total
|
|
Revenues, net
|
32,473,402
|
4,716,648
|
4,656,951
|
273,756
|
-
|
42,120,757
|
|
Net income
|
3,538,032
|
618,807
|
1,340,579
|
76,287
|
(282,191)
|
5,291,514
|
|
For the three months ended March 31, 2010 (unaudited)
|
||||||
|
USD $
|
Pharmaceutical products distribution
|
TCM processing and distribution
|
Herbal cultivation and sales
|
Flower tea bags
|
Corporate
|
Total
|
|
Revenues, net
|
20,866,986
|
7,033,942
|
-
|
991,942
|
-
|
28,892,870
|
|
Net income
|
2,356,045
|
903,585
|
-
|
229,886
|
-
|
3,489,516
|
11
|
10.
|
Subsequent Event
|
Joint Ventures
On April 6, 2011, the Company obtained the business license of Anhui Sino-Green TCM Tech, a joint venture established by Wisdom Fortune and Qianyi Pharmaceutical, in Bozhou City, Anhui Province. Please see Note 7 (Commitments) with respect to the capital commitments of Wisdom Fortune and Qianyi Pharmaceutical relating to Anhui Sino-Green TCM Tech, ownership interests, registered capital and related matters.
On April 21, 2011, the Company obtained the business license of Shandong Sino-Green TCM Tech, a joint venture established by Yaoyuan and Jinan Linong, in Jinan City, Shandong Province. Please see Note 7 (Commitments) with respect to the capital commitments of Yaoyuan and Jinan Linong relating to Shandong Sino-Green TCM Tech, ownership interests, registered capital and related matters.
Suspension of Flower Tea Bags business
On April 25, 2011, the Company suspended its flower tea bags and sales operations. The Company’s decision was based on the intentions of the local government of Bozhou, in conjunction with another pharmaceutical company, to expand the industry development park in Bozhou, that will utilize the site where Xuelingxian is currently located. The factory buildings and relevant land on which Xuelingxian is situated will be expropriated and Xuelingxian will be required to relocate to a new commercial address. The Company is currently evaluating potential new locations and is conducting market research on the flower tea bags market. The management will decide to either reopen the flower tea bags business in a new location or permanently close it after completing its market research, which is expected to be completed in mid-2011.
Appointment of New Executive Officer
On April 29, 2011, the Board of Directors of the Company appointed Mr. Yanliang Song as Vice President in charge of operations of Global Pharm for a term of three years, effective May 1, 2011, thereby increasing the number of Global Pharm executive officers from three to four. The Company filed a Current Report on Form 8-K with the Securities Exchange Commission on May 4, 2011 relating to this appointment.
12
MANAGEMENT’S DISCUSSION AND ANALYSIS OF FINANCIAL CONDITION AND RESULTS OF OPERATION
Forward-Looking Information
The following discussion should be read in conjunction with our consolidated financial statements and notes to those consolidated financial statements, included elsewhere in this Quarterly Report on Form 10-Q. This discussion contains forward-looking statements that involve risks and uncertainties. We have tried, wherever possible, to identify these forward-looking statements by using words such as “forecast,” “project,” “anticipate,” “plan,” “strategy,” “intend,” “potential,” “outlook,” “target,” “seek,” “continue,” “believe,” “could,” “estimate,” “expect,” “may,” “probable,” “should,” “will” or other words of similar meaning. Our actual results and the timing of selected events could differ materially from those anticipated in these forward-looking statements as a result of various factors, including those set forth under “Risk Factors” contained in our Annual Report on Form 10-K for the year ended December 31, 2010, filed with the SEC on April 13, 2011 and elsewhere in this Report.
Overview
We were incorporated in Delaware on February 9, 2007, under the name “Top Flight Gamebirds, Inc.” Our principal executive offices are located at Room 2503-2505, New World Center, No. 6009 Yitian Road, Futian District, Shenzhen, Guangdong 518026, People’s Republic of China, or the PRC. On September 20, 2010, we changed our name to Global Pharm Holdings Group, Inc. Prior to the merger as described below, we were a non-operating shell company.
On August 12, 2010, we entered into a Share Exchange Agreement (referred to as the Share Exchange Agreement) with Global Pharm BVI Enterprise Group Limited, a British Virgin Island Company formed on June 14, 2010, or Global Pharm BVI. Pursuant to the Share Exchange Agreement, we issued 1,800,000 of our restricted shares to acquire all of the issued and outstanding shares of Global Pharm BVI. Immediately subsequent to the merger, the former stockholders and key management of Global Pharm BVI were given certain call rights to acquire an aggregate of 80.36% of our outstanding common stock at four different occurrence dates, contingent on the attainment of various targets. In addition, all of the officers and directors of Global Pharm BVI were appointed as our officers and directors immediately following the merger. Subsequent to the merger, all of the targets were attained and, upon the exercise of the call rights, the former stockholders and key management of Global Pharm BVI currently own an aggregate of 80.36% of our outstanding common stock.
The merger of a private operating company into a non-operating public shell company with nominal net assets is considered to be a capital transaction in substance, rather than a business combination, for accounting purposes. Accordingly, we treated this transaction as a Reverse Merger. These transactions are considered to be capital transactions in substance, rather than business combinations. Accordingly, the Share Exchange Agreement has been accounted for as a recapitalization, and, for accounting purposes, Global Pharma BVI is considered the acquirer in the Reverse Merger. The historical consolidated financial statements are those of Global Pharma BVI.
We are engaged in the wholesale and distribution of pharmaceutical-related products and herbal cultivation business in China through our indirectly owned Chinese subsidiaries, including Tonghua Tongdetang Pharmaceutical and Medicinal Material Co., Ltd. (referred to as Tongdetang), Anhui Xuelingxian Pharmaceutical Co., Ltd. (referred to as Xuelingxian), Shandong Global Pharm Co., Ltd. (referred to as Yaoyuan), along with the Company’s two newly formed join ventures with no operations as of March 31, 2011, Anhui Sino-Green TCM Tech Development Co., Ltd. (referred to as Anhui Sino-Green TCM Tech), and Shandong Sino-Green TCM Tech Development Co., Ltd. (referred to as Shandong Sino-Green TCM Tech and, together with Xuelingxian, Tongdetang, Yaoyuan and Anhui Sino-Green TCM Tech, referred to as the PRC Subsidiaries).
13
Pharmaceutical Product Distribution Segment
Our products include prescription drugs, over-the-counter, or OTC, drugs and nutritional supplements. For the three months ended March 31, 2011, we sold approximately 9,000 different types of products and had more than 4,000 clients that spanned hospitals, clinics, pharmacies and drugstores, and other healthcare institutions.
For the three months ended March 31, 2011 and 2010, the sales from our pharmaceutical product distribution segment accounted for 77.1% and 72.2% of our total sales, respectively. Yaoyuan and Tongdetang are focused primarily on the distribution business. They purchase pharmaceutical-related products from manufacturers and wholesalers and sell the products to hospitals, other distributors, health clinics, chain and individual drug stores, among others.
In January 2011, we renewed the exclusive distribution agreements with each of Xiuzheng Pharmaceutical Group Marketing Co., Ltd., or Xiuzheng, and Hainan Lingkang Pharmaceutical Co., Ltd., or Lingkang for a term of one year.
TCM Processing and Distribution Segment
We process approximately 500 varieties of Chinese natural herbs that are purchased from the Bozhou TCM raw materials transaction market, and sell these processed herbs to pharmaceutical distributors, hospitals or various types of medical institutions. These treated herbs are often called “prepared slices” and can be immediately used as herbal medicine. The kind of treatment applied to the herbs varies according to the type of herb. Our Xuelingxian subsidiary is focused on the TCM processing and distribution business. For the three months ended March 31, 2011 and 2010, the sales from our TCM processing and distribution segment accounted for 11.2% and 24.2% of our total sales, respectively.
Herbal Cultivation and Sales Segment
We also grow several varieties of Chinese herbs such as Chrysanthemum, Salvia, Saposhnikovia divaricata, angelica dahurica, Cortex and others, and sell them at the Bozhou TCM raw materials transaction market. On January 1, 2011, we leased two parcels of land from Mengwang Village Committee and Limenlou Village Committee of Boxhou City in Anhui province in replacement of two parcels of land we previously leased in 2010 to continue conducting our herbal cultivation business. The aggregate area for both parcels of land was approximately 1,800 acres, with each lease for a term of five years. Both parcels of land have not generated revenue for the three months ended March 31, 2011. For the three months ended March 31, 2011, the sales from our herb cultivation and sales segment, which related to the land leased in 2010, accounted for 11.0% of our total sales. There were no sales for the three months ended March 31, 2010.
According to the statistics report of China Association of Traditional Chinese Medicine released on April 15, 2011, the retail price of 399 most commonly used herbal products increased during the 12-month period from April 2010 to March 2011. The price of 86 herbal products increased in amounts ranging from 5% to 20% and 154 herbal products increased ranging from 21% to 50%. 96 herbal products increased ranging from 50% to 100% and 57 herbal products increased over 101%. In the same period, the price of 100 most commonly used herbal products decreased, ranging from 1% to 100%. The price of all of our herbal products cultivated in 2010 was increased during the last 12 months.
14
Flower Tea Bags Segment
The current production of flower tea bags includes basic processing, screening and bagging. For the three months ended March 31, 2011, the sales from the flower tea bags segment accounted for 0.6% of our total sales, a decrease of $0.7 million or 72.4% as compared to the comparable period in 2010, which accounted for 3.4% of our total sales. The decrease was primarily due to the entry and expansion of competitive products, the geographical limitation of our products, and the rough and plain design and packaging of our products that was less attractive to the consumer compared to competitors’ products, as well as our insufficient marketing. On April 25, 2011, we decided to suspend our flower tea bags and sales operations. Our decision was based on the intentions of the local government of Bozhou, in conjunction with another pharmaceutical company, to expand the industry development park in Bozhou, that will utilize the site where Xuelingxian is currently located. The factory buildings and relevant land on which Xuelingxian is situated will be expropriated and Xuelingxian will be required to relocate to a new commercial address. The Company is currently evaluating potential new locations and is conducting market research on the flower tea bags market. The management will decide to either reopen the flower tea bags business in a new location or permanently close it after completing its market research, which is expected to be completed in mid-2011.
Recent Developments
Joint Ventures
On April 6, 2011, we obtained the business license of Anhui Sino-Green TCM Tech. Hong Kong Wisdom Fortune Medicine Holding Group Limited, one of our subsidiaries (referred to as Wisdom Fortune) together with Anhui Qianyi Pharmaceutical Co., Ltd., or Qianyi Pharmaceutical, a PRC company, established the Joint Venture, Anhui Sino-Green TCM Tech, in Bozhou City, Anhui Province. The registered capital of Anhui Sino-Green TCM Tech is $10 million. Wisdom Fortune will invest $9.7 million and Qianyi Pharmaceutical will invest $0.3 million, which reflect 97 percent and 3 percent of the ownership of Anhui Sino-Green TCM Tech, respectively. We are required to pay approximately $1.5 million registered capital by July 6, 2011 and $8.2 million by April 6, 2013. We will fund the registered capital by using our working capital.
On April 21, 2011, we obtained the business license of Shandong Sino-Green TCM Tech. Yaoyuan together with Jinan Linong TCM Plantation Co., Ltd., or Jinan Linong, a PRC company, established the Joint Venture, Shandong Sino-Green TCM Tech, in Jinan City, Shandong Province. The registered capital of Shandong Sino-Green TCM Tech is RMB 10 million (approximately $1.5 million). Yaoyuan will invest RMB 9.7 million (approximately $1.5 million) and Jinan Linong will invest RMB 0.3 million (approximately $0.1 million), which reflect 97 percent and 3 percent of the ownership of Shandong Sino-Green TCM Tech, respectively. We are required to pay $0.2 million registered capital by July 21, 2011 and $1.3 million by April 21, 2013. We will fund the registered capital by using its working capital.
15
Result of Operations
The following table presents certain information derived from our consolidated financial statements for the three months ended March 31, 2011 and 2010.
|
For the Three Months Ended March 31,
|
||||||||||||||||||||||||
|
in USD except percentage
|
2011
|
2010
|
Change
|
|||||||||||||||||||||
|
|
|
% of revenue
|
|
% of revenue
|
Amount
|
Percentage
|
||||||||||||||||||
|
Revenues, net
|
$ | 42,120,757 | 100.0 | $ | 28,892,870 | 100.0 | $ | 13,227,887 | 45.8 | |||||||||||||||
|
Cost of goods sold
|
34,296,106 | 81.4 | 23,777,194 | 82.3 | 10,518,912 | 44.2 | ||||||||||||||||||
|
Gross profit
|
7,824,651 | 18.6 | 5,115,676 | 17.7 | 2,708,975 | 53.0 | ||||||||||||||||||
|
Operating expenses
|
419,050 | 1.0 | 167,570 | 0.6 | 251,480 | 150.1 | ||||||||||||||||||
|
General and administrative
|
733,019 | 1.7 | 302,783 | 1.0 | 430,236 | 142.1 | ||||||||||||||||||
|
Income from operations
|
6,672,582 | 15.8 | 4,645,323 | 16.1 | 2,027,259 | 43.6 | ||||||||||||||||||
|
Interest income
|
(4,147 | ) | 0.0 | 5,915 | 0.0 | (10,062 | ) | (170.1 | ) | |||||||||||||||
|
Miscellaneous (expense)/income
|
(1,874 | ) | 0.0 | - | 0.0 | (1,874 | ) |
NA
|
||||||||||||||||
|
Income before income taxes
|
6,666,561 | 15.8 | 4,651,238 | 16.1 | 2,015,323 | 43.3 | ||||||||||||||||||
|
Provision for income taxes
|
1,375,047 | 3.3 | 1,161,722 | 4.0 | 213,325 | 18.4 | ||||||||||||||||||
|
Net income
|
$ | 5,291,514 | 12.6 | $ | 3,489,516 | 12.1 | $ | 1,801,998 | 51.6 | |||||||||||||||
The increase (decrease) in net revenue and net income were accounted for by an increase (decrease) in certain of our segments as indicated below:
|
For the Three Months Ended March 31 - Revenue
|
||||||||||||||||||||||||
|
in USD except percentage
|
2011
|
2010
|
Change
|
|||||||||||||||||||||
|
|
|
% of revenue
|
|
% of revenue
|
Amount
|
%
|
||||||||||||||||||
|
Pharmaceutical products distribution
|
$ | 32,473,402 | 77.1 | $ | 20,866,986 | 72.2 | $ | 11,606,416 | 55.6 | |||||||||||||||
|
TCM processing and distribution
|
4,716,648 | 11.2 | 7,033,942 | 24.3 | (2,317,294 | ) | (32.9 | ) | ||||||||||||||||
|
Herbal cultivation and sales
|
4,656,951 | 11.1 | - | - | 4,656,951 |
NA
|
||||||||||||||||||
|
Flower tea bags
|
273,756 | 0.6 | 991,942 | 3.4 | (718,186 | ) | (72.4 | ) | ||||||||||||||||
|
Total
|
$ | 42,120,757 | 100 | $ | 28,892,870 | 100.0 | $ | 13,227,887 | 45.8 | |||||||||||||||
16
|
For the Three Months Ended March 31 - Cost of Goods Sold
|
||||||||||||||||||||||||
|
in USD except percentage
|
2011
|
2010
|
Change
|
|||||||||||||||||||||
|
|
|
% of
COGS
|
|
% of
COGS
|
Amount
|
%
|
||||||||||||||||||
|
Pharmaceutical products distribution
|
$ | 27,090,971 | 79.0 | $ | 17,378,713 | 73.1 | $ | 9,712,258 | 55.9 | |||||||||||||||
|
TCM processing and distribution
|
3,816,333 | 11.1 | 5,666,725 | 23.8 | (1,850,392 | ) | (32.7 | ) | ||||||||||||||||
|
Herbal cultivation and sales
|
3,208,389 | 9.4 | - | - | 3,208,389 |
NA
|
||||||||||||||||||
|
Flower tea bags
|
180,413 | 0.5 | 731,756 | 3.1 | (551,343 | ) | (75.3 | ) | ||||||||||||||||
|
Total
|
$ | 34,296,106 | 100 | $ | 23,777,194 | 100.0 | $ | 10,518,912 | 44.2 | |||||||||||||||
|
|
|
|
|
|
|
|
||||||||||||||||||
|
For the Three Months Ended March 31 - Net Income
|
||||||||||||||||||||||||
|
in USD except percentage
|
2011 | 2010 |
Change
|
|||||||||||||||||||||
|
|
|
% of
income
|
|
% of
income
|
Amount
|
%
|
||||||||||||||||||
|
Pharmaceutical products distribution
|
$ | 3,538,032 | 66.9 | $ | 2,356,045 | 67.5 | $ | 1,181,987 | 50.2 | |||||||||||||||
|
TCM processing and distribution
|
618,807 | 11.7 | 903,585 | 25.9 | (284,778 | ) | (31.5 | ) | ||||||||||||||||
|
Herbal cultivation and sales
|
1,340,579 | 25.3 | - | - | 1,340,579 |
NA
|
||||||||||||||||||
|
Flower tea bags
|
76,287 | 1.4 | 229,886 | 6.6 | (153,599 | ) | (66.8 | ) | ||||||||||||||||
|
Corporate
|
(282,191 | ) | (5.3 | ) | - | - | (282,191 | ) |
NA
|
|||||||||||||||
|
Total
|
$ | 5,291,514 | 100 | $ | 3,489,516 | 100.0 | $ | 1,801,998 | 51.6 | |||||||||||||||
17
Revenue. Our net revenue increased by $13.2 million, or 45.8%, for the three months ended March 31, 2011 compared to the comparable period ended March 31, 2010. The increase in revenue was attributable to our reportable segments as follows:
|
·
|
Pharmaceutical products distribution –The contribution from our pharmaceutical products distribution segment was $32.5 million, or 77.1% of our total sales, for the three months ended March 31, 2011, compared to $20.9 million, or 72.2% of our total sales, for the comparable period in 2010. The revenue increased $11.6 million, or approximately 55.6%, for the three months ended March 31, 2011, as compared to the comparable period in 2010. The increase was primarily due to a series of marketing activities from mid-2010 targeted for high-end customers, such as hospitals, retail drug stores and neighborhood clinics, to promote sales; a broader product portfolio offered to customers expanded from approximately 7,000 products to more than 9,000 products; and improved efficiency in fulfilling sales orders, through staff training, process streamlization and better allocation and utilization of logistic resources, as well as approximately more than $2 million from the sales of OEM products, that were transferred from the TCM processing and distribution segment in early 2011.
|
|
·
|
TCM processing and distribution –Revenue from this segment was $4.7 million for the three months ended March 31, 2011, compared to $7.0 million in the comparable period in 2010, a decrease of $2.3 million, or approximately 32.9%. The decrease was primarily due to the nil sales of OEM products in this segment. In accordance with corporate strategy to streamline the operational segments and product portfolios, we moved the sales of OEM products from the TCM processing and distribution segment to pharmaceutical product distribution segment. The related sales from OEM products for the three months ended March 31, 2011 were $2.1 million and have been recorded in the pharmaceutical product distribution segment in the same period in 2010.
|
|
·
|
Herbal cultivation and sales –Revenue from our herbal cultivation and sales segment was $4.7 million for the three months ended March 31, 2011, compared to nil for the same period in 2010, an increase of $4.7 million. The increase was primarily attributable to the additional sales of herbal products for the first three months ended March 31, 2011. In 2009, we sold all of our herbal products and had no herbal sales for the first three months ended March 31, 2010.
|
|
·
|
Flower tea bags –Revenue from our flower tea bags segment was $0.3 million for the three months ended March 31, 2010, compared to approximately $1.0 million for the comparable period in 2010, a decrease of $0.7 million, or approximately 72.4%. The decrease was primarily due to the entry and expansion of competitive products, the geographical limitation of our products, and the rough and plain design and packaging of our products that was less attractive to the consumer compared to competitors’ products, as well as our insufficient marketing.
|
18
Cost of Goods Sold. Our cost of goods sold increased by $10.5 million, or 44.2%, to $34.3 million for three months ended March 31, 2011 from $23.8 million for the comparable period in 2010, which was consistent with the increase in our revenue. More specifically:
|
|
·
|
Pharmaceutical products distribution –The cost of goods sold for this segment was $27.1 million, or 79.0% of our total cost of goods sold, for the three months ended March 31, 2011, compared to $17.4 million, or 73.1% of our total costs of goods sold, for the comparable period in 2010, an increase of $9.7 million, or approximately 55.9%. The increase was primarily due to our greater sales volume in the first three months of 2011 compared to the comparable period in 2010, consistent with the increase in revenue of this segment.
|
|
|
·
|
TCM processing and distribution – The cost of goods sold for this segment was $3.8 million for the three months ended March 31, 2011, compared to $5.7 million for the comparable period in 2010, a decrease of $1.9 million, or approximately 32.7%. The decrease was primarily due to the transfer of the distribution of OEM products from TCM processing and distribution segment to the pharmaceutical products distribution segment in early 2011.
|
|
|
·
|
Herbal cultivation and sales – The cost of goods sold for our herbal cultivation segment was $3.2 million for the three months ended March 31, 2011, compared to nil for the comparable period in 2010, an increase of $3.2 million. The increase was primarily attributable to the additional herbal products sold for the first three months of 2011 compared to the nil sales in the comparable period in 2010.
|
|
|
·
|
Flower tea bags – The cost of goods sold for our flower tea bags segment was $0.2 million for the three months ended March 31, 2011, compared to $0.7 million for the comparable period in 2010, a decrease of $0.5 million, or approximately 75%. The decrease was primarily due to the fewer products sold for the first three months ended March 31, 2011 compared to the same period in 2010 due to the increased competition related to our products for the first three months ended March 31, 2011.
|
Gross Profit. Our gross profit increased by $2.7 million, or 53.0%, to $7.8 million for the three months ended March 31, 2011 from $5.1 million for the comparable period in 2010. More specifically, our gross profit margins were 16.6%, 19.2%, 31.0%, and 34% for each of our pharmaceutical products distribution segment, TCM processing and distribution segment, herbal cultivation and sales segment, and flower tea bags segment for the three months ended March 31, 2011, respectively. The gross profit margins were 16.7%, 19.4%, nil, and 26.2% for each of above four segments for the comparable period in 2010. Our overall gross profit margin increased to 18.6% for the three months ended March 31, 2011 from 17.7% for the comparable period in 2010. The increase is primarily attributable to a stronger sales volume of our distribution business and the growth of our herbal cultivation and sales business in the first three months of 2011.
Operating Expenses. Our operating expenses increased by $0.25 million, or 150.1%, to $0.42 million for the three months ended March 31, 2011 from $0.17 million for the comparable period in 2010. The increase is primarily due to increased costs of marketing, freight and employment of approximately $0.05 million, $0.1 million and $0.1 million, respectively, consistent with the increase in our sales volume and expansion of our business.
General and Administrative. Our general and administrative expenses increased by $0.4 million, or 142.1%, to $0.7 million for the three months ended March 31, 2011 from $0.3 million for the comparable period in 2010. The increase is consistent with the increase in net revenue and our becoming a public company, resulting in increased professional service fees, such as legal, accounting and investor relations.
19
Income from Operations. As a result of the foregoing, our income from operations increased to $6.7 million for the three months ended March 31, 2011 from $4.6 million for the comparable period in 2010, an increase of $2.0 million, or 43.6%.
Income Taxes. Our income tax expense increased to $1.4 million for the three months ended March 31, 2011 from $1.2 million for the comparable period in 2010, consistent with the increased revenue. Our effective tax rate for our operating subsidiaries was 20.6% and 25.0% for the three months ended March 31, 2011 and 2010, respectively. The reduced effective tax rate was mainly attributed to the increased sales of our herbal cultivation and sales business, which is subject to zero income tax in the PRC.
Net Income. Our net income increased by $1.8 million, to $5.3 million, for the three months ended March 31, 2011 from $3.5 million for the comparable period in 2010. Our net profit margin increased to 12.6% for the three months ended March 31, 2010 from 12.1% for the comparable period in 2011. The slight increase in profit margin was primarily due to our increased sales of herbal products, which had higher profit margins, in the first three months of 2011.
Liquidity and Capital Resources
The following table sets forth a summary of our net cash flow information for the periods indicated:
|
For the Three Months Ended March 31,
|
||||||||||||||||
|
Change
|
||||||||||||||||
|
in USD except percentage
|
2011
|
2010
|
Amount
|
%
|
||||||||||||
|
Net cash provided by operating activities
|
$ | 5,762,102 | $ | 190,950 | $ | 5,571,152 | 2,917.6 | |||||||||
|
Net cash used in investing activities
|
(45,560 | ) | (9,092 | ) | (36,468 | ) | 401.1 | |||||||||
|
Net cash used in financing activities
|
(1,130,041 | ) | (3,208,521 | ) | 2,078,480 | (64.8 | ) | |||||||||
|
Net increase (decrease) in cash
|
4,586,501 | (3,026,663 | ) | 7,613,164 | (251.5 | ) | ||||||||||
|
Cash and cash equivalents at the end of the year
|
$ | 8,905,768 | $ | 4,425,239 | $ | 4,480,529 | 101.2 | |||||||||
Our net working capital was $22.8 million as of March 31, 2011, an increase of $5.4 million, from $17.4 million as of March 31, 2010. Our cash and liquidity needs are funded primarily by cash generated from operations. We believe that the funds and cash generated from operations available to us are adequate to meet our operating needs for the remainder of 2011.
20
For the three months ended March 31, 2011, cash and cash equivalent increased by $4.6 million, as compared to the comparable period in 2010, primarily attributable to various factors, including:
Net cash provided by operating activities
For the three months ended March 31, 2011, we generated $5.8 million from operating activities, as compared to $0.2 million for the comparable period in 2010. The increase of $5.6 million is primarily a result of the additional $1.8 million in net income generated, $1 million in inventory, $2.1 million in other current assets, $0.3 million each in payables to tax authorities and related parties, and the release of $1.2 million in restricted cash, offset by the decrease in accounts receivable of $0.7 million and accounts payable and other accrued liabilities of $0.4 million.
Net cash used in investing activities
We used $45,560 in investing activities for the three months ended March 31, 2011, as compared to $9,092 for the comparable period in 2010, primarily as a result of increased expenditures relating to purchases of equipment in our pharmaceutical products distribution segment.
Net cash used in financing activities
Net cash used in financing activities was $1.1 million for the three months ended March 31, 2011, as compared to $3.2 million for the comparable period in 2010. The cash used in financing activities for the three months ended March 31, 2011 was for repayment of a bank loan to Shandong Qilu Bank. The cash used in financing activities for the three months ended March 31, 2010 was primarily due to the payment of dividends to former stockholders of our operating subsidiaries.
Capital Resources
The outstanding balances of the short-term loans we obtained from Shandong Qilu Bank in 2010 were fully paid in in January 2011. As of March 31, 2011, we had two outstanding short-term loans obtained for our general working capital purposes:
|
|
·
|
Loan obtained on December 31, 2010 with Shandong Qilu Bank. The outstanding amount is RMB3 million, or $455,111, as of March 31, 2011, which is due on December 30, 2011. The loan bears an annual interest of 6.97%, payable on monthly basis. The loan is secured by a pledge on our inventory worth RMB6 million or $910, 223, the term of which is similar to that of the loan. Shandong Qilu Bank has authorized Shandong Woerde Guarantee Company to monitor the pledged inventories;
|
|
|
·
|
Loan obtained with Construction Bank of China for a term commencing from June 1, 2010 to May 31, 2011. The outstanding amount is RMB1 million, or $151,704, as of March 31, 2011, which is due on May 31, 2011. The loan bears an annual interest of 5.58%, payable on a quarterly basis. The loan is secured by a guarantee on a property owned by two of our shareholders and Bozhou City Fengyi Herbal Research and Development Institute, which is worth $4 million, commencing April 6, 2010 to April 6, 2013.
|
21
Working Capital Requirements
Historically, cash generated from operations have been sufficient to meet our general cash needs. We believe that we will be able to continue to generate revenue from our operations, which will provide the necessary cash flow to meet anticipated working capital requirements. However, our actual short- and long-term working capital requirements will depend upon numerous factors, including operating results, competition, the opportunity to acquire or start up new businesses and the availability of credit facilities, none of which can be predicted with certainty. Due to our rapid growth and expansion, our need for additional capital may arise, and our management will seek to raise capital for the maintenance and expansion of our operations through the issuance of debt or equity if necessary.
Critical Accounting Policies
Our management’s discussion and analysis of our financial condition and results of operations are based on our financial statements that have been prepared in accordance with accounting principles generally accepted in the United States of America, or U.S. GAAP. The preparation of these financial statements requires us to make estimates and assumptions that affect the reported amounts of assets and liabilities and the disclosure of contingent assets and liabilities at the date of the financial statements as well as the reported net sales and expenses during the reporting periods. On an ongoing basis, we evaluate our estimates and assumptions. We base our estimates on historical experience and on various other factors that we believe are reasonable under the circumstances, the results of which form the basis for making judgments about the carrying value of assets and liabilities that are not readily apparent from other sources. Actual results may differ from these estimates under different assumptions or conditions.
Revenue Recognition
We recognize revenues in compliance with Staff Accounting Bulletin 104. Sales revenue is recognized when all of the following have occurred: (i) persuasive evidence of an arrangement exists, (ii) delivery has occurred or services have been rendered, (iii) the price is fixed or determinable and (iv) the ability to collect is reasonably assured. These criteria are generally satisfied at the time of shipment when risk of loss and title passes to the customer. Our four segments have the same revenue recognition policy. Revenues are recorded net of value-added taxes.
Accounts Receivable
We record accounts receivable, net of an allowance for doubtful accounts, if any. We maintain allowances for doubtful accounts for estimated losses. We review the accounts receivable on a quarterly basis and make general and specific allowances when there is doubt as to the collectability of individual balances. In evaluating the collectability of individual receivable balances, we consider many factors, including the age of the balance, customer's historical payment history, our current creditworthiness and current economic trends. The amount of the provision, if any, is recognized in the consolidated statement of income within "General and administrative." Accounts are written off after exhaustive efforts at collection. As of March 31, 2011 and 2010, all of the trade receivable balances were aged less than one. Therefore, management concluded that no allowance for uncollectible amounts was required.
22
Income Taxes
We are subject to income taxes, primarily in the PRC. We believe we have adequately provided for all taxes due but amounts asserted by tax authorities could be greater or less than the amounts we have accrued. We have concluded all PRC corporate income tax matters for the three months ended March 31, 2011and do not anticipate adjustments as a result of any tax audits within the next 12 months.
Segments
Segments are defined as components of our business for which separate financial information is available that is evaluated by our chief operating decision-maker (our CEO) in deciding how to allocate resources and assess performance. We presently have four operating segments, consisting of (i) pharmaceutical products distribution, (ii) Traditional Chinese Medicine, or TCM, processing and distribution, (iii) herbal cultivation and sales and (iv) flower tea bags. Currently, we do not have intersegment sales.
Off-Balance Sheet Arrangements
We do not have any off-balance sheet arrangements that have or are reasonably likely to have a current or future effect on our financial condition, changes in financial condition, revenues or expenses, results of operations, liquidity or capital expenditures or capital resources that is material to an investor in our securities.
Item 3. Quantitative and Qualitative Disclosures About Market Risk
Item 4. Controls and Procedures
Disclosure Controls and Procedures
During and subsequent to the reporting period covered by this report, and under the supervision and with the participation of our management, including our principal executive officer and our principal financial officer, we conducted an evaluation of our disclosure controls and procedures that were in effect at the end of the period covered by this report. Disclosure controls and procedures is defined under Rule 13a-15(e) and Rule 15d-15(e) of the Securities Exchange Act of 1934, as amended (the “Exchange Act”), as those controls and other procedures of an issuer that are designed to ensure that information required to be disclosed by an issuer in the reports that it files or submits under the Exchange Act is recorded, processed, summarized and reported within the time periods specified in the rules and forms of the Securities and Exchange Commission (the “SEC”). Disclosure controls and procedures include, without limitation, controls and procedures designed to ensure that information required to be disclosed by an issuer in the reports that it files or submits under the Exchange Act is accumulated and communicated to the issuer's management, including its principal executive officer and principal financial officer, as appropriate, to allow timely decisions regarding required disclosure. Based on their evaluation and as discussed below, our principal executive officer and principal financial officer have concluded that our disclosure controls and procedures that were in effect on March 31, 2011 were effective.
23
Management’s Remediation Initiatives
In our Annual Report on Form 10-K for the year ended December 31, 2010 filed with the SEC on April 13, 2011, the following material weakness in our internal control over financial reporting was identified as of December 31, 2010:
|
●
|
The Company did not have appropriate policies and procedures in place to identify and give disclosures relating to the basis for applying the reverse acquisition accounting to the Company’s acquisitions of three PRC operating subsidiaries pursuant to an Earn-In Agreement, as thereafter amended, and to properly accrue for dividends declared by the PRC operating company prior to the Earn-In Agreement and properly recognize certain transactions. Therefore, the Company was not able to effectively identify all necessary and appropriate disclosures and to effectively capture all financial data for the purposes of preparing its financial statements in accordance with U.S. GAAP.
|
In response to the above-identified material weakness and to strengthen our internal control over financial reporting, we have taken the following remediation initiatives:
We formed an Audit Committee in February 2011, chaired by an accounting expert with adequate knowledge and experience in U.S. GAAP and SEC reporting requirements, to advise the management on matters relating to our internal control over financial reporting. Going forward, in order to address any material weaknesses in our internal controls over financial reporting, we plan to make the following necessary changes and improvements:
● recruit accounting resources to fulfill U.S. GAAP reporting requirements;
● provide training to our finance team and other relevant personnel of the Company on the U.S. GAAP accounting guidance applicable to the Company’s financial statements; and
● engage a third-party financial consulting firm to assist management in evaluating complex accounting issues on an as-needed basis, to ensure proper disclosure and reporting in a timely manner.
As of March 31, 2011, the Company continued to reassess its internal controls and procedures on an ongoing basis.
Changes in Internal Control over Financial Reporting
There was no change in our internal control over financial reporting during the period ended March 31, 2011 that has materially affected, or is reasonably likely to materially affect, our internal control over financial reporting.
24
PART II - OTHER INFORMATION
Item 1. Legal Proceedings
Item 1A. Risk Factors
There have not been any material changes to the Company’s risk factors from our Annual Report on Form 10-K for the year ended December 31, 2010 filed with the SEC on April 13, 2011.
Item 2. Unregistered Sales of Equity Securities and Use of Proceeds
None.
Item 3. Defaults Upon Senior Securities
None.
Item 4. (Removed and Reserved)
Item 5. Other Information
Not applicable.
Item 6. Exhibits
Copies of the following documents are included as exhibits to this report pursuant to Item 601 of Regulation S-K.
|
Exhibit No.
|
Title of Document
|
|
|
10.1
|
Short-term loan contract, entered into between Shandong Global and Shandong Qilu Bank on December 31, 2010
|
|
|
10.2
|
Land lease agreement, entered into between Xuelingxian and Mengwang Village Committee on January 1, 2011
|
|
|
10.3
|
Land lease agreement, entered into between Xuelingxian and Limenlou Village Committee on January 1, 2011
|
|
|
31.1
|
Certification of the Principal Executive Officer pursuant to Section 302 of the Sarbanes-Oxley Act of 2002 *
|
|
|
31.2
|
Certification of the Principal Financial Officer pursuant to Section 302 of the Sarbanes-Oxley Act of 2002 *
|
|
|
32.1
|
Certification of the Principal Executive Officer pursuant to U.S.C. Section 1350 as adopted pursuant to Section 906 of the Sarbanes-Oxley Act of 2002*
|
|
|
32.2
|
Certification of the Principal Financial Officer pursuant to U.S.C. Section 1350 as adopted pursuant to Section 906 of the Sarbanes-Oxley Act of 2002*
|
* The referenced exhibits marked by an “*” attached to this Form 10-Q shall not be deemed "filed" for purposes of Section 18 of the Securities Exchange Act of 1934 (the "Exchange Act") or otherwise subject to liability under that section, nor shall it be deemed incorporated by reference in any filing under the Securities Act of 1933, as amended, or the Exchange Act, except as expressly set forth by specific reference in such filing.
25
SIGNATURES
In accordance with the Exchange Act, the registrant caused this report to be signed on its behalf by the undersigned thereunto duly authorized.
|
GLOBAL PHARM HOLDINGS GROUP, INC.
|
|||
|
Date: May 16, 2011
|
|
/s/ Yunlu Yin
|
|
|
Yunlu Yin
Chief Executive Officer and President
(Principal Executive Officer)
|
|||
|
Date: May 16, 2011
|
/s/ An Fu
|
||
|
An Fu
Chief Financial Officer
(Principal Financial Officer)
|
|||
26