Attached files
| file | filename |
|---|---|
| 8-K - FORM 8-K - Swisher Hygiene Inc. | g27266e8vk.htm |
| EX-99.1 - EX-99.1 - Swisher Hygiene Inc. | g27266exv99w1.htm |
Exhibit 99.2
| Supplemental Data Fiscal quarter ended March 31, 2011 |
| May 16, 2011 |
| Forward-Looking Information |
| This presentation includes financial forecasts, projections and other forward-looking statements regarding Swisher Hygiene Inc., its business and prospects. This forward-looking information is based on management assumptions and expectations which, while considered reasonable by Swisher Hygiene and its management as of the date of this presentation, are subject to risks, uncertainties, and other factors that may cause actual results and performance to materially differ from results or performance expressed or implied by the forward-looking statements. A description of these factors can be found in our Annual Report on Form 10-K for the year ended December 31, 2010, filed with the Securities and Exchange Commission (“SEC”) on March 31, 2011 and in our other filings with the SEC, which are available at www.sec.gov. Swisher Hygiene undertakes no obligation to publicly revise the forward-looking statements presented, except as required by law. |
| First Quarter Highlights |
| 86% increase in revenue |
| 15% excluding acquisition (organic growth) |
| 55% increase over fourth quarter 2010 |
| Current run-rate revenue over $230 million |
| Acquisition of 11 independent service providers, 4 franchisees and Choice Environmental |
| Commenced trading on NASDAQ |
| Launched cross-selling efforts and implemented cost synergies |
| Strengthened capital structure |
| Strategy and Roadmap |
| Strategy |
| 1. Establish a unique, sustainable and defensible competitive advantage |
| 2. Be a full-service provider with a continually evolving product portfolio |
| 3. Optimize distribution to customer |
| Roadmap |
| 1. Expand geographic presence through acquisition |
| 2. Raise revenue-per-customer through route up-sells and interdivisional cross-selling |
| 3. Reduce costs by leveraging infrastructure |
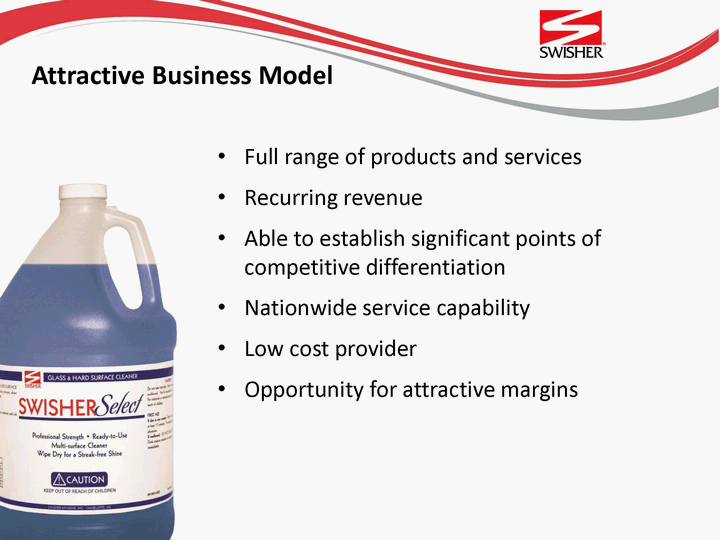
| Attractive Business Model |
| Full range of products and services |
| Recurring revenue |
| Able to establish significant points of competitive differentiation |
| Nationwide service capability |
| Low cost provider |
| Opportunity for attractive margins |
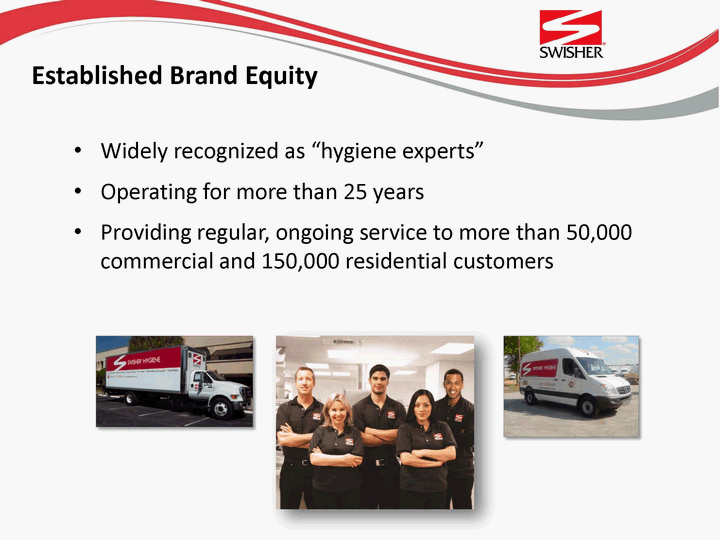
| Established Brand Equity |
| Widely recognized as Operating for more than 25 years |
| Providing regular, ongoing service to more than 50,000 commercial and 150,000 residential customers |
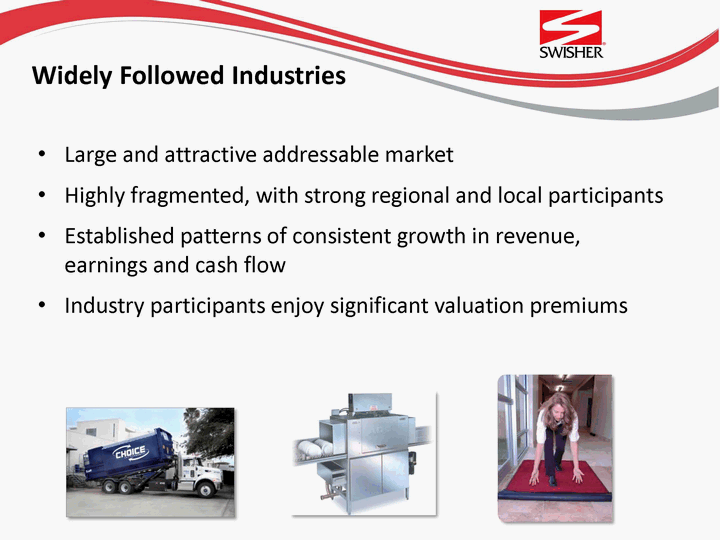
| Widely Followed Industries |
| Large and attractive addressable market |
| Highly fragmented, with strong regional and local participants |
| Established patterns of consistent growth in revenue, earnings and cash flow |
| Industry participants enjoy significant valuation premiums |
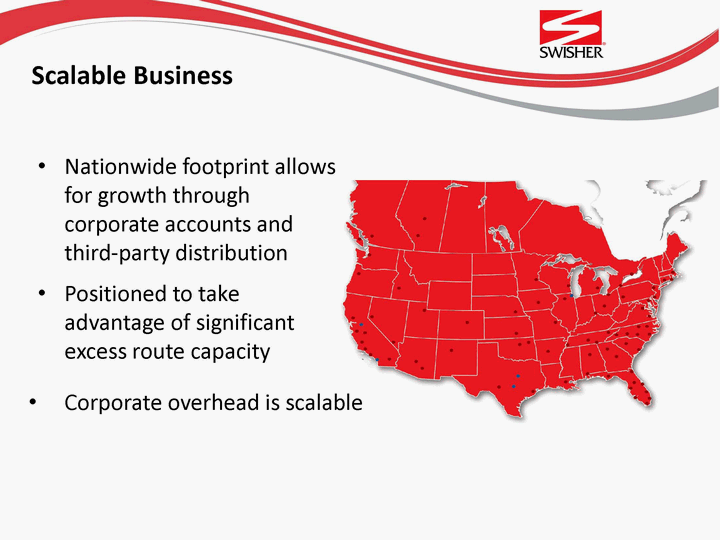
| Scalable Business |
| Nationwide footprint allows for growth through corporate accounts and third-party distribution |
| Positioned to take advantage of significant excess route capacity |
| Corporate overhead is scalable |
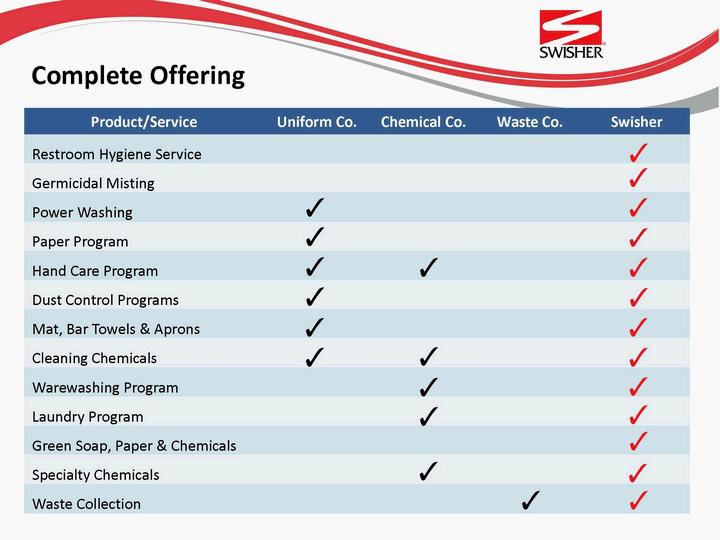
| Complete Offering |
| Product/Service Uniform Co. Chemical Co. Waste Co. Swisher |
| Restroom Hygiene Service |
| Germicidal Misting |
| Power Washing |
| Paper Program |
| Hand Care Program |
| Dust Control Programs |
| Mat, Bar Towels & Aprons |
| Cleaning Chemicals |
| Warewashing Program |
| Laundry Program |
| Green Soap, Paper & Chemicals |
| Specialty Chemicals |
| Waste Collection |
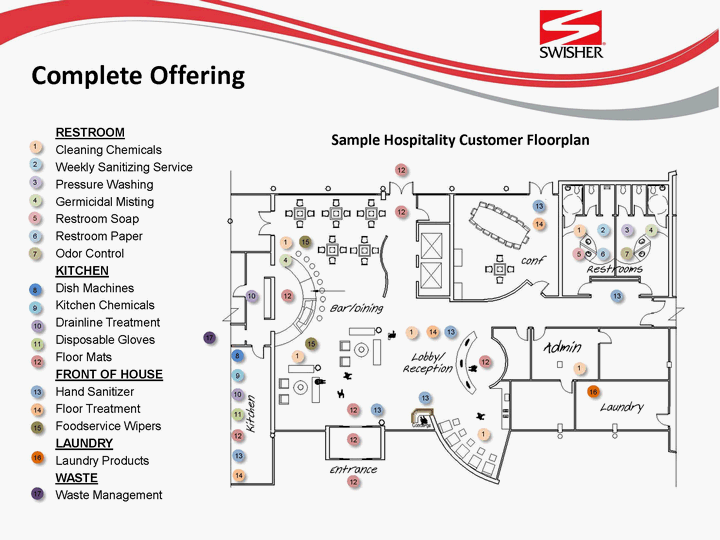
| Complete Offering RESTROOM |
| 1 Cleaning Chemicals 2 Weekly Sanitizing Service 3 Pressure Washing 4 Germicidal Misting 5 Restroom Soap 6 Restroom Paper 7 Odor Control KITCHEN 8 Dish Machines 9 Kitchen Chemicals 10 Drainline Treatment Disposable Gloves 17 11 Floor Mats 8 12 FRONT OF HOUSE 9 13 Hand Sanitizer 10 14 Floor Treatment 11 15 Foodservice Wipers 12 LAUNDRY 16 Laundry Products 13 WASTE 14 17 Waste Management |
| Access to Capital |
| Raised $195 million of equity in private placements from well known and respected Canadian and U.S. institutions |
| Significant liquidity Over $165 million of cash on hand $100 million credit facility in place |
| Weighted average borrowing rate of 4.6% |
| Shareholder equity in excess of $325 million |
| Total debt to capital of less than 12% |
| *As of April 30, 2011 |
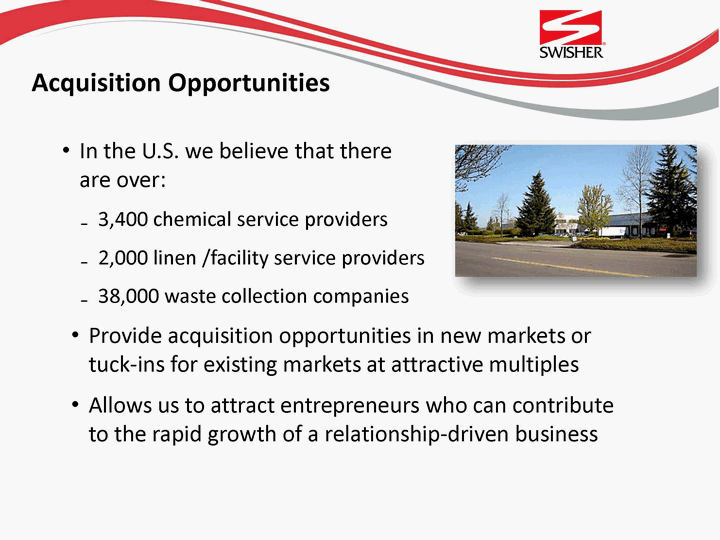
| Acquisition Opportunities |
| In the U.S. we believe that there are over: |
| 3,400 chemical service providers 2,000 linen /facility service providers 38,000 waste collection companies |
| Provide acquisition opportunities in new markets or tuck-ins for existing markets at attractive multiples |
| Allows us to attract entrepreneurs who can contribute to the rapid growth of a relationship-driven business |
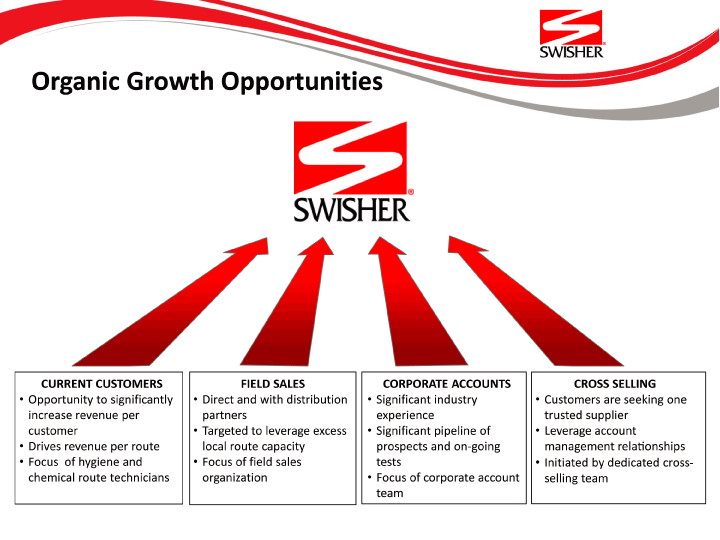
| Organic Growth Opportunities |
| CURRENT CUSTOMERS |
| Opportunity to significantly increase revenue per customer |
| Drives revenue per route |
| Focus of hygiene and chemical route technicians |
| FIELD SALES |
| Direct and with distribution partners |
| Targeted to leverage excess local route capacity |
| Focus of field sales organization |
| CORPORATE ACCOUNTS |
| Significant industry experience |
| Significant pipeline of prospects and on-going tests |
| Focus of corporate account team |
| CROSS SELLING |
| Customers are seeking one trusted supplier |
| Within most industries |
| Initiated by dedicated cross-selling team |
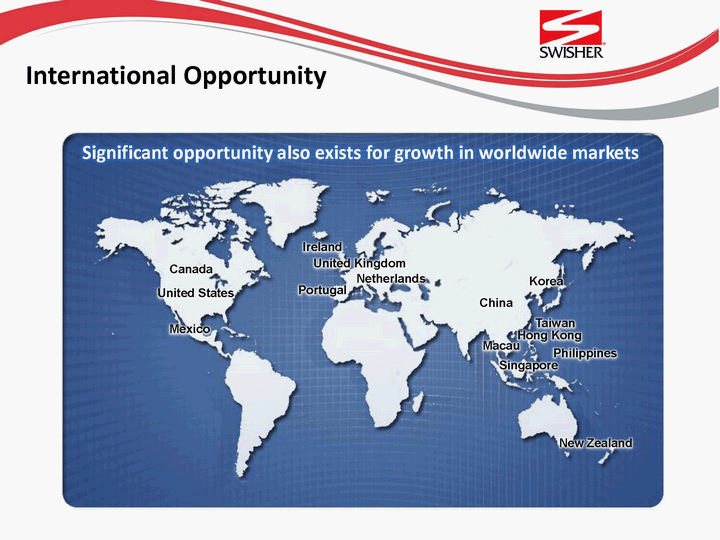
| International Opportunity |
| Significant opportunity also exists for growth in worldwide markets |
| Ireland |
| United Kingdom Canada |
| Netherlands Korea United States Portugal China Taiwan Mexico Hong Kong Macau Philippines Singapore |
| New Zealand |
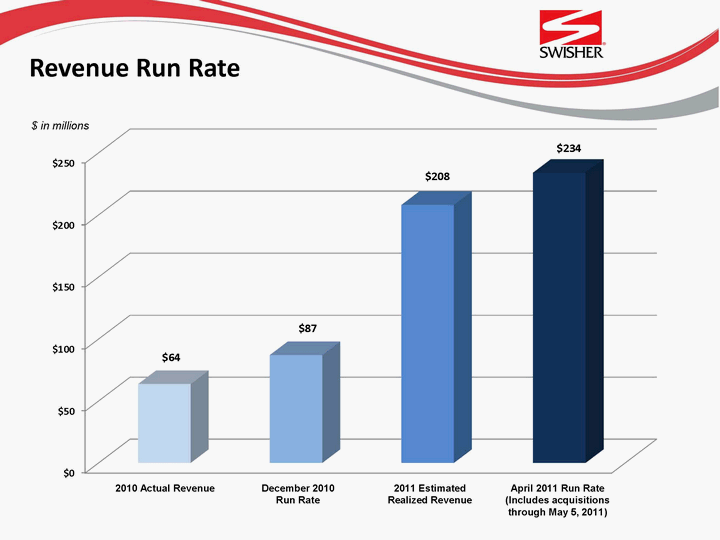
| Revenue Run Rate |
