Attached files
| file | filename |
|---|---|
| EX-32 - APOLLO SOLAR ENERGY, INC. | exhibit32.htm |
| EX-31.1 - APOLLO SOLAR ENERGY, INC. | exhibit311.htm |
| EX-31.2 - APOLLO SOLAR ENERGY, INC. | exhibit312.htm |
UNITED STATES
SECURITIES AND EXCHANGE COMMISSION
Washington, D.C. 20549
FORM 10-Q
|
QUARTERLY REPORT PURSUANT TO SECTION 13 OR 15(d) OF THE SECURITIES EXCHANGE ACT OF 1934.
|
For the quarterly period ended March 31, 2011
|
TRANSITION REPORT PURSUANT TO SECTION 13 OR 15(d) OF THE SECURITIES EXCHANGE ACT OF 1934
|
For the transition period from __________ to ____________
Commission File Number: 000-12122
APOLLO SOLAR ENERGY, INC.
(Exact name of registrant as specified in its charter)
|
(State or other jurisdiction of
incorporation or organization)
|
84-0601802
(I.R.S. Employer
Identification No.)
|
|
No. 485 Tengfei Third,
Shuangliu Southwest Airport Economic Development Zone,
Shuangliu, Chengdu
People’s Republic of China, 610207
|
|
(Address of principal executive offices)
|
Registrant’s Telephone Number, Including Area Code: +86 (28) 8562-3888
Indicate by check mark whether the registrant (1) has filed all reports required to be filed by Section 13 or 15(d) of the Securities Exchange Act of 1934 during the preceding 12 months (or for such shorter period that the registrant was required to file such reports), and (2) has been subject to such filing requirements for the past 90 days. Yes ý No o
Indicate by check mark whether the registrant has submitted electronically and posted on its corporate Web site, if any, every Interactive Data File required to be submitted and posted pursuant to Rule 405 of Regulation S-T (§232.405 of this chapter) during the preceding 12 months (or for such shorter period that the registrant was required to submit and post such files). Yes o No o
Indicate by check mark whether the registrant is a large accelerated filer, an accelerated filer, a non-accelerated filer, or a smaller reporting company. See the definitions of “large accelerated filer,” “accelerated filer” and “smaller reporting company” in Rule 12b-2 of the Exchange Act.
Large accelerated filer o Accelerated filer o
Non-accelerated filer o Smaller reporting company ý
(Do not check if a smaller reporting company)
Indicate by check mark whether the registrant is a shell company (as defined in Rule 12b-2 of the Act). Yes o No ý
There were 51,655,961 shares of common stock issued and 49,237,038 shares outstanding as of May 14, 2011.
APOLLO SOLAR ENERGY, INC.
TABLE OF CONTENTS TO QUARTERLY REPORT ON FORM 10-Q
For the Quarterly Period Ended March 31, 2011
|
ITEM
|
Page
|
|||
|
PART I
|
FINANCIAL INFORMATION
|
3 | ||
|
Item 1.
|
Financial Statements
|
3 | ||
|
Item 2.
|
Management’s Discussion and Analysis of Financial Condition and Results of Operations
|
15 | ||
|
Item 3.
|
Quantitative and Qualitative Disclosures About Market Risk
|
23 | ||
|
Item 4.
|
Controls and Procedures
|
24 | ||
|
PART II
|
|
OTHER INFORMATION
|
25 | |
|
Item 1.
|
Legal Proceedings
|
25 | ||
|
Item 1A.
|
Risk Factors
|
25 | ||
|
Item 6.
|
Exhibits
|
25 | ||
|
Signatures
|
26 |
2
|
APOLLO SOLAR ENERGY, INC.
|
||||||||
|
CONSOLIDATED BALANCE SHEETS
|
||||||||
|
(In US Dollars)
|
||||||||
|
March 31, 2011
|
December 31, 2010
|
|||||||
|
(Unaudited)
|
||||||||
|
ASSETS
|
||||||||
|
Current assets:
|
||||||||
|
Cash and cash equivalents
|
$
|
1,182,327
|
$
|
2,676,176
|
||||
|
Account receivable net of allowance for doubtful accounts
|
2,058,639
|
294,214
|
||||||
|
$2,316 and $3,465, respectively
|
||||||||
|
Inventories
|
5,277,835
|
6,809,700
|
||||||
|
Due from Related parties
|
2,901
|
4,412, 629
|
||||||
|
Deferred taxes asset
|
80,856
|
|||||||
|
Prepaid expenses and other current assets
|
407,130
|
799,359
|
||||||
|
Total current assets
|
9,009,688
|
14,992,078
|
||||||
|
Property, machinery and mining assets, net
|
21,081,575
|
21,081,705
|
||||||
|
Asset held for sale
|
1,107,709
|
1,098,700
|
||||||
|
Non-marketable investment
|
53,447
|
53,012
|
||||||
|
Investment in joint venture
|
463,014
|
587,504
|
||||||
|
22,705,745
|
22,820,921
|
|||||||
|
Total Assets
|
$
|
31,715,433
|
$
|
37,812,999
|
||||
|
LIABILITIES AND SHAREHOLDERS' EQUITY
|
||||||||
|
Current liabilities:
|
||||||||
|
Short-term loan
|
4,662,065
|
5,002,802
|
||||||
|
Account payable - trade
|
190,488
|
375,520
|
||||||
|
- construction vendors
|
2,562,016
|
2,844,102
|
||||||
|
Accrued expenses and other current liabilities
|
2,212,774
|
1,098,178
|
||||||
|
Deferred taxes liability
|
0
|
25,329
|
||||||
|
Due to related parties
|
247,170
|
1,814,260
|
||||||
|
Total current liabilities
|
9,874,513
|
11,160,191
|
||||||
|
Shareholders' equity
|
||||||||
|
Preferred stock, $.001 par value,25,000,000 shares authorized,
|
||||||||
|
0 shares issued and outstanding at March 31, 2011 and December 31, 2010
|
||||||||
|
Common stock, $.001 par value, 100,000,000 shares authorized,
|
51,656
|
51,656
|
||||||
|
51,655,961 shares issued and 49,237,038 shares outstanding at March 31, 2011
and 51,655,961 issued and outstanding at December 31, 2010
|
||||||||
|
Additional paid-in capital
|
31,870,260
|
31,709,395
|
||||||
|
Treasury stock, 2,418,923 shares at cost
|
(5,273,253)
|
|||||||
|
Accumulated deficit
|
(7,049,246
|
)
|
(7,128,838
|
)
|
||||
|
Accumulated other comprehensive income
|
2,241,503
|
2,020,595
|
||||||
|
Total shareholders' equity
|
21,840,920
|
26,652,808
|
||||||
|
Total Liabilities And Shareholders' Equity
|
$
|
31,715,433
|
$
|
37,812,999
|
||||
3
|
CONSOLIDATED STATEMENTS OF OPERATIONS AND OTHER COMPREHENSIVE (LOSS)
|
||||||||
|
(Unaudited)
|
||||||||
|
(In US Dollars)
|
||||||||
|
Three Months Ended March 31,
|
||||||||
|
2011
|
2010
|
|||||||
|
Sales
|
$
|
3,783,220
|
$
|
1,073,774
|
||||
|
Cost of sales
|
(3,430,156
|
)
|
(839,028
|
)
|
||||
|
Gross profit
|
353,064
|
234,746
|
||||||
|
Operating Expenses
|
||||||||
|
General and administrative expenses
|
900,781
|
1,190,137
|
||||||
|
Selling expenses
|
70,273
|
72,101
|
||||||
|
Research and development expenses
|
30,810
|
9,577
|
||||||
|
Total Operating Expenses
|
1,001,864
|
1,271,815
|
||||||
|
Operating Loss
|
(648,800
|
)
|
(1,037,069
|
)
|
||||
|
Other Income (expense)
|
||||||||
|
Interest income (expense)
|
743,170
|
(104,286
|
)
|
|||||
|
Other income
|
55,196
|
|||||||
|
Equity in loss of Joint Venture
|
(111,843)
|
|||||||
|
Loss before Income tax
|
|
(17,473
|
)
|
|
(1,086,159
|
)
|
||
|
Provision for Income tax (credit)
|
(97,066)
|
|||||||
|
Net Income (Loss)
|
79,593
|
(1,086,159
|
)
|
|||||
|
Other Comprehensive Income (Loss)
|
||||||||
|
Foreign Currency Translation Adjustment
|
|
186,139
|
|
3,033
|
)
|
|||
|
Comprehensive income (loss)
|
|
265,732
|
|
|
(1,083,126
|
)
|
||
|
Basic and Diluted Loss per common share
|
||||||||
|
Basic and diluted
|
$
|
(0
|
)
|
$
|
(0.02
|
)
|
||
|
Weighted average common share outstanding
|
||||||||
|
Basic and diluted
|
51,091,546
|
44,555,131
|
||||||
4
|
APOLLO SOLAR ENERGY, INC.
|
||||||||
|
CONSOLIDATED STATEMENTS OF CASH FLOWS
|
||||||||
|
(Unaudited)
|
||||||||
|
(In US Dollars)
|
||||||||
|
Three Months Ended March 31,
|
||||||||
|
2011
|
2010
|
|||||||
|
Cash flows from operating activities
|
||||||||
|
Net inome (loss)
|
$ | 79,593 | $ | (1,086,159 | ||||
|
Adjustments to reconcile net income to
net cash provided by (used in) operating activities:
|
||||||||
|
Stock-based compensation
|
160,865 | 394,436 | ||||||
|
Depreciation
|
241,015 | 226,552 | ||||||
|
Deferred tax assets
|
(106,185 | ) | - | |||||
|
Other interest income
|
(837,359 | ) | ||||||
|
Equity in loss of Joint Venture
|
111,843 | |||||||
|
Changes in assets and liabilities:
|
||||||||
|
(Increase) decrease in -
|
||||||||
|
Account receivable-trade
|
(1,753,928 | ) | (656,213 | |||||
|
Inventories
|
1,580,422 | (319,763 | ||||||
|
Prepaid expenses and other current assets
|
396,750 | (38,591 | ||||||
|
Account payable-trade
|
(187,247 | ) | 226,505 | |||||
|
Accounts payable - construction
|
(304,007 | ) | 19,666 | |||||
|
Accrued expenses and other current liabilities
|
979,789 | (11,126 | ||||||
|
Net cash provided by (used in) operating activities
|
361,551 | (1,244,693 | ||||||
|
Cash flows from investing activities
|
||||||||
|
Purchase of property and equipment
|
(68,805 | ) | (39,416 | |||||
|
Net cash used in investing activities
|
(68,805 | ) | (39,416 | |||||
|
Cash flows from financing activities
|
||||||||
|
Proceeds from (repayment of) short-term loans
|
(380,009 | ) | 1,464,674 | |||||
|
Advance from (payment to) shareholders
|
(1,690,029 | ) | 1,965,276 | |||||
|
Advance from related party
|
237,428 | 15,105 | ||||||
|
Net cash provided by (used in) financing activities
|
(1,832,610 | ) | 3,445,055 | |||||
|
Effect of exchange rate changes on cash and cash equivalents
|
46,015 | 110 | ||||||
|
Net increase (decrease) in cash and cash equivalents
|
(1,493,849 | ) | 2,161,056 | |||||
|
Cash and cash equivalents, beginning of period
|
2,676,176 | 507,776 | ||||||
|
Cash and cash equivalents, end of period
|
$ | 1,182,327 | $ | 2,668,832 | ||||
|
Supplemental disclosures of cash flow information:
|
||||||||
|
Interest paid
|
$ | 67,300 | $ | 55,105 | ||||
|
Income taxes paid
|
$ | 9,134 | $ | 91,042 | ||||
| Supplementary disclosure of non-cash financing activities | ||||||||
| Treasury stock acquired in exchange for loans to related parties | $ | 4,435,894 | $ | - | ||||
5
NOTES TO CONSOLIDATED FINANCIAL STATEMENTS
FOR THE THREE MONTHS ENDED MARCH 31, 2011 AND 2010
(UNAUDITED)
NOTE 1. BASIS OF PRESENTATION
The accompanying unaudited consolidated financial statements of Apollo Solar Energy, Inc. (the “Company) reflect all material adjustments consisting of only normal recurring adjustments which, in the opinion of management, are necessary for a fair presentation of results for the interim periods. Certain information and footnote disclosures required under accounting principles generally accepted in the United States of America have been condensed or omitted pursuant to the rules and regulations of the Securities and Exchange Commission, although the Company believes that the disclosures are adequate to make the information presented not misleading. These consolidated financial statements should be read in conjunction with the consolidated financial statements and notes thereto included in the Company’s Annual report on Form 10-K for the year ended December 31, 2010 as filed with the Securities and Exchange Commission.
The preparation of financial statements in conformity with accounting principles generally accepted in the United States of America requires management to make estimates and assumptions that affect the reported amounts of assets and liabilities and disclosure of contingent assets and liabilities at the date of the financial statements and those estimates. Estimates that are particularly susceptible to change include assumptions used in determining the fair value of securities owned and non-readily marketable securities.
The results of operations for the three months ended March 31, 2011 are not necessarily indicative of the results to be expected for the entire year or for any future period.
The Company’s functional currency is the Chinese Renminbi (“RMB”); however, the accompanying financial statements have been translated and presented in United States Dollars (“USD”).
6
Inventories consist of the following:
|
As of
|
||||||||
|
March 31, 2011
|
December 31, 2010
|
|||||||
|
Raw Materials
|
$
|
608,582
|
$
|
1,646,217
|
||||
|
Work-in-progress
|
1,472,381
|
2,261,022
|
||||||
|
Finished goods
|
3,196,872
|
2,902,461
|
||||||
|
Total
|
$
|
5,277,835
|
$
|
6,809,700
|
||||
A summary of property and equipment and the estimate lives used in the computation of depreciation and amortization is as follows:
|
As of
|
|||||||||
|
March 31, 2011
|
December 31,2010
|
||||||||
|
Buildings
|
$
|
14,315,492
|
$
|
14,199,056
|
|||||
|
Right to use land
|
4,165,766
|
4,131,884
|
|||||||
|
Machinery and equipment
|
3,769,404
|
3,731,260
|
|||||||
|
Office equipments
|
374,418
|
356,429
|
|||||||
|
Vehicle
|
558,420
|
553,878
|
|||||||
|
Mining
|
529,738
|
489,012
|
|||||||
|
Construction in progress (1)
|
945,437
|
928,035
|
|||||||
|
Sub-total
|
24,658,675
|
24,389,554
|
|||||||
|
Less: Accumulated depreciation
|
(3,577,100
|
)
|
(3,307,849
|
)
|
|||||
|
Total
|
$
|
21,081,575
|
$
|
21,081,705
|
|||||
Depreciation expense for the three months ended March 31, 2011 and 2010 was $ 241,015 and $226,552 respectively.
(1) Estimated costs to complete the construction in progress after March 31, 2011 are not anticipated to be material. Construction is expected to be completed in the third quarter of 2011.
7
NOTE 4. RELATED PARTIES TRANSACTIONS AND BALANCES
The breakdown of due from related parties consists of the following:
|
As of
|
||||||||
|
March 31, 2011
|
December 31, 2010
|
|||||||
|
Due from Xinju
|
$
|
0
|
$
|
4,379,411
|
||||
|
Due from Joint Venture
|
0
|
1,064
|
||||||
|
Due from shareholder
|
2,901
|
32,154
|
||||||
|
Total
|
$
|
2,901
|
4,412,629
|
|||||
Xinju is a related party partially owned by a majority shareholder of Apollo, Renyi Hou, our former CEO. On March 10, 2011, Mr. Hou exchanged 2,418,923 shares of the Company’s common stock in full settlement of approximately $5.2 million due from Xinju which includes interest of approximately $830,000. The amount due from Xinju was converted into 2,418,923 shares of the Company’s common stock based on a fair market value of $2.18 per share. The Joint Venture is a newly formed company in which Apollo holds a 35% of the equity interest. All the above loans are non-interest bearing and due on demand.
Due to related parties consists of due to Joint Venture- COE Apollo and due to shareholders which consist of non-interest bearing notes.
8
|
As of
|
||||||||
|
March 31, 2011
|
December 31, 2010
|
|||||||
|
Due to Joint Venture
|
$
|
35,949
|
$
|
-
|
||||
|
Due to shareholders
|
211,221
|
1,814,260
|
||||||
|
Total
|
$
|
247,170
|
$
|
1,814,260
|
||||
NOTE 5. EQUITY METHOD INVESTMENT IN JOINT VENTURE
On November 9, 2009, Sichuan Apollo Solar Science & Technology Co. Ltd. (“Sichuan Apollo”), a wholly-owned foreign enterprise of the Company, entered into a joint venture agreement (the “JV Agreement”) with Bengbu Design & Research Institute for Glass Industry (“Bengbu”) and a local Chinese government agency (the “Agency”). The Joint Venture (“JV”) was formed to conduct research and development related to glass used in the production of thin film solar cells and manufacture thin film solar cells. As of March 31, 2011 the JV had not commenced the production of thin film solar cells. The Company accounts for this investment under the equity method of accounting.
Summarized financial information for our investment in the JV assuming a 100% ownership interest is as follows:
|
March 31, 2011
|
March 31, 2010
|
|||||||
|
Statement of operations
|
||||||||
|
Revenues
|
$ | 2,286.55 | - | |||||
|
Cost of sales
|
1,188.60 | - | ||||||
|
Gross profit
|
1,097.94 | - | ||||||
|
Operating Loss
|
(319,551.50 | ) | - | |||||
|
Loss before income tax
|
(319,551.50 | ) | - | |||||
9
NOTE 6. ACCRUED EXPENSES, TAXES AND OTHER CURRENT LIABILITIES
Accrued expenses, taxes and other current liabilities are listed as below:
|
As of
|
|||||||||
|
March 31, 2011
|
December 31, 2010
|
||||||||
|
Accrued interest
|
$
|
790,131
|
$
|
782,515
|
|||||
|
Salaries and benefits
|
133,462
|
142,180
|
|||||||
|
Value Added Taxes
|
376,489
|
11,402
|
|||||||
|
Customer Deposit
|
704,177
|
0
|
|||||||
|
Other accrued expenses
|
208,515
|
162,081
|
|||||||
|
Total
|
$
|
2,212,774
|
$
|
1,098,178
|
|||||
10
The short-term loan includes the following:
|
Balance at
|
||||||||
|
March 31,
|
December 31,
|
|
||||||
|
2011
|
2010
|
|||||||
|
a) Loan payable to Chengdu Xihang Gang Construction & Investment Co., Ltd
|
||||||||
|
due on August 31, 2011 without interest, collateralized by certain plant equipment of Sichuan Apollo
|
$
|
630,669
|
$
|
625,540
|
||||
|
b) Loan payable to Bank of Communication, Chengdu branch
|
||||||||
|
due on February 8, 2011, with interest at
|
302,924
|
|||||||
|
6.64% per annum, collateralized by the buildings and land use right of Diye
|
||||||||
|
c) Loan payable to Bank of China, Xihanggang Branch, Chengdu
|
||||||||
|
due on August 24, 2011, with interest at
|
671,899
|
757,312
|
||||||
|
5.84% per annum, collateralized by the buildings of Sichuan Apollo
|
||||||||
|
d) Loan payable to Bank of China, Xihanggang Branch, Chengdu
|
||||||||
|
due on September 7, 2011, with interest at
|
||||||||
|
5.84% per annum, collateralized by the buildings of Sichuan Apollo
|
763,522
|
757,312
|
||||||
|
e) Loan payable to Merchant Bank, Wangjiang Road, Chengdu
|
||||||||
|
due on July 16, 2011, with interest at
|
||||||||
|
6.97% per annum, collateralized by the buildings of Sichuan Apollo
|
1,068,931
|
1,060,237
|
||||||
|
f) Loan payable to Bank of China, Xihanggang Branch, Chengdu
|
||||||||
|
due on January 7, 2012 with interest at
|
||||||||
|
6.86% per annum, collateralized by the buildings of Sichuan Apollo
|
1,527,044
|
|||||||
|
g) Loan payable to Bank of China, Xihanggang Branch, Chengdu
due on March 9, 2011,with interest at 15% per annum, collateralized by the buildings of Sichuan Apollo
|
1,499,477
|
|||||||
|
Total
|
$
|
4,662,065
|
$
|
5,002,802
|
||||
11
NOTE 8. TAXES
Corporation income tax
The Company is governed by the Income Tax Law of the PRC concerning the privately run and foreign invested enterprises, which are generally subject to tax at a statutory rate of 25% on income reported in the statutory financial statements after appropriate tax adjustments.
On July 16, 2009, the Company received government approval regarding the High-Tech Enterprise Certificate which allows the Company to enjoy a favorable tax rate of 15% effective January 1, 2009 through December 31, 2011.
Value added tax (“VAT”)
Enterprises or individuals who sell commodities, engage in repair and maintenance or import or export goods in the PRC are subject to a value added tax in accordance with the PRC laws. The value added tax standard rate is 17% of the gross sales price. A credit is available whereby VAT paid on the purchases of semi-finished products or raw materials used in the production of the Company’s finished products can be used to offset the VAT due on the sales of the finished products.
As of March 31, 2011 and 2009, the Company had VAT tax receivable of $43,360 and payable of zero respectively.
The comparison of income tax expense at the U.S. statutory rate of 35% in 2011 and 2010, to the Company’s effective tax is as follows:
|
March 31, 2011
|
March 31,2010
|
|||||||
|
U.S. statutory rate a 35%
|
$ | (6,114 | ) | $ | (380,156 | ) | ||
|
Tax rate difference between China and U.S.
|
130,139 | 108,814 | ||||||
|
Valuation allowance on U.S. Net Operating Loss
|
(221,091) | 271,342 | ||||||
|
Effective tax
|
$ | (97,066 | ) | $ | - | |||
12
The provisions for income taxes are summarized as follows:
|
March 31,2011
|
March 31,2010
|
|||||||
|
Current
|
$ | 9,119 | $ | - | ||||
|
Deferred
|
(106,185 | ) | - | |||||
|
Total
|
$ | (97,066 | ) | $ | - | |||
NOTE 9. PRC STATUTORY RESERVES
In accordance with the PRC Companies Law, the Company was required to transfer 10% of its profit after tax, as determined in accordance with accounting standards and regulations of the PRC, to the statutory surplus reserve. The statutory surplus reserve is non-distributable. As of March 31, 2011 and December 31, 2010, the Company did not accumulate any statutory reserve due to the accumulated deficit.
For the three months ended March 31, 2011,
|
Corporate &
|
Consolidated
|
||||||||||||||||||||
|
Manufacturing
|
Refining
|
Mining
|
Others
|
Total
|
|||||||||||||||||
|
Revenue
|
$
|
-
|
$
|
3,783,220
|
$
|
-
|
$
|
-
|
$
|
3,783,220
|
|||||||||||
|
Operating loss
|
(204,697
|
)
|
(136,741)
|
(101,690
|
)
|
(205,672
|
)
|
(648,800
|
)
|
||||||||||||
|
Depreciation and amortization
|
204,386
|
28,770
|
7,859
|
241,015
|
|||||||||||||||||
|
Capital expenditures
|
10,517
|
18,533
|
39,755
|
68,805
|
|||||||||||||||||
13
For the three months ended March 31, 2010,
|
Corporate &
|
Consolidated
|
||||||||||||||||||||
|
Manufacturing
|
Refining
|
Mining
|
Others
|
Total
|
|||||||||||||||||
|
Revenue
|
$
|
-
|
$
|
1,073,774
|
$
|
-
|
$
|
-
|
$
|
1,073,774
|
|||||||||||
|
Operating loss
|
(272,441
|
)
|
(248,397)
|
(42,769
|
)
|
(473,462
|
)
|
(1,037,069
|
)
|
||||||||||||
|
Depreciation and amortization
|
46,140
|
173,541
|
6,871
|
226,552
|
|||||||||||||||||
|
Capital expenditures
|
19,092
|
1,753
|
18,571
|
39,416
|
|||||||||||||||||
NOTE 11. CONCENTRATIONS
For the three months ended March 31, 2011, four major customers accounted for approximately 80% of total sales. At March 31, 2011, two customers accounted for 81% of total accounts receivable.
For the three months ended March 31, 2010, two major customers accounted for approximately 76% of total sales. At March 31, 2010, one customer accounted for 91% of total accounts receivable.
For the three months ended March 31, 2011, 39% of sales were made to customers in North America and 61% of sales were made to customers in Asia.
For the three months ended March 31, 2010, 18% of sales were made to customers in North America and 82% of sales were made to customers in Asia.
The Company has reviewed its subsequent events through the date these financial statements were issued and has determined that no additional material subsequent events have occurred through such date.
14
The following discussion contains forward-looking statements that involve risks and uncertainties. Forward-looking statements include, but are not limited to, statements regarding future events, our plans and expectations and financial projections. Our actual results could differ materially from those discussed herein. Factors that could cause or contribute to such differences include, but are not limited to, those discussed elsewhere in this Form 10-Q and in our Annual Report on Form 10-K filed on April 8, 2011, as amended by Amendment No. 1 to our Annual Report on Form 10-K, filed on May 2, 2011. Unless the context otherwise requires, the terms “we,” the “Company,” “us,” or “Apollo” refers to Apollo Solar Energy, Inc. and our wholly-owned subsidiaries and variable interest entities.
Overview
We are a China-based vertically integrated refiner of tellurium, or Te, and high-purity tellurium-based metals for specific segments of the electronic materials market. Our main expertise is in the production of Te-based compounds used to produce thin-film solar cells, cell modules and solar electronic products. While no reserves under the SEC’s Industry Guide 7 can currently be delineated at our properties, we believe that the tellurium to be used in our products in the future will be primarily sourced from our Dashuigou project located in Sichuan Province, PRC. In addition, we expect to source tellurium from another property in Shimian, Majiagou, PRC, through variable interest entity agreements, or the VIE Agreements, executed in April, 2009, with Sichuan Xinju Mineral Resources Development Corporation and certain of its shareholders holding 51.6619% of its voting stock, which shareholders are our direct or indirect employees. Under the terms of the VIE Agreements, we have been granted the exclusive exploration and mining rights to these two projects in accordance with a license granted by the Chinese government, which extends through January, 2013 for mining activities at our Dashuigou property, through May 2013 for mining activities at our Majiagou property, and through April 2011 for exploration activities at our Dashuigou property, subject to potential renewal thereafter.
Currently, tellurium is produced as a by-product in the process of processing copper and other metals. As a result, costs are high. We believe that the Dashuigou and Majiagou projects are the only two known deposits in the world in which tellurium, one of the rarest metallic elements on earth, is the primary commodity of economic interest. By the end of 2011, we plan to obtain approximately 50% to 60% of the tellurium necessary for our products from the Dashuigou and Majiagou projects and believe this ability to be a significant competitive advantage because the cost of tellurium sourced from our own properties will be substantially lower than that purchased from an outside third party. We will source the remaining 40% to 50% of our tellurium needs from third-party suppliers with whom we have established good business relationships with over the past few years. By vertically integrating our processes, we believe we are able to achieve significant operating efficiencies and produce high-quality products that offer cost and quality benefits to our customers. Currently, we are able to procure raw materials from the Dashuigou and Majiagou projects at a significant discount to prevailing market price.
Our refining operations are currently based in a 330,000 square foot facility in Chengdu, Sichuan Province, PRC. We expect this facility to eventually have the capacity to produce more than 300 tons of high-purity photovoltaic cell materials and 42 other types of electronic materials. Future expansion of this facility in vacant land leased to the Company will have a capacity to produce up to an additional 350 tons of high-purity photovoltaic cell materials.
15
We are currently in the exploration stage of operations in accordance with the requirements of SEC Industry Guide 7. However, we believe we are unique in that we expect to both mine and refine our tellurium-based products, with primary refining capabilities as provided by Sichuan Xinju Minteral Resources Development Corporation pursuant to the VIE Agreements, and secondary refining capabilities directly through our Company. Our primary refining capabilities are such that we can treat metal concentrates (containing, for example, as little as 50% of the metals of interest), and extract and refine the metals of interest so that they can be fed to our secondary refining operations, where we attain a higher level of purity. Because we expect to mine the raw material in the future, and perform both refining functions, both directly and through our VIE Arrangement, we consider ourselves a supplier that will in the future have uniquely integrated capabilities. Our end-products are tellurium, cadmium, zinc and related compounds of 99.999% (five nines, or 5N) purity or above. Our products are critical precursors in a number of electronic applications, including the rapidly-expanding thin-film photovoltaic, or PV, market.
Thin film technologies, because of their relatively low usage of raw materials when compared with traditional silicon-based photovoltaic technologies, offer a potential cost advantage in the marketplace. Accordingly, we believe these technologies are beginning to gain an ever increasing foothold in the market.
Our Variable Interest Entity Agreements
As illustrated in the diagram below, we entered into various exclusive contractual arrangements on April 10, 2009 with Sichuan Xinju Mineral Resources Development Corporation, or the VIE, and certain of its shareholders who are our direct or indirect employees and who collectively own 51.6619% of the VIE. Among other things, these VIE Agreements granted to our wholly-owned subsidiary a first option to purchase the exploration rights related to the Dashuigou area property and the mining rights related to that certain tellurium and bismuth property in Shimian Majiagou, which rights we collectively referred to as the Exploration Business. Additionally, the VIE and certain of its shareholders who collectively own 51.6619% of the VIE granted to our wholly-owned subsidiary an exclusive right to purchase all of the products produced from the Exploration Business for a specified period of time. As a result, we consolidate the financial results of the VIE related to the Exploration Business pursuant to FASB ASC 810-10, “Consolidation.”
16
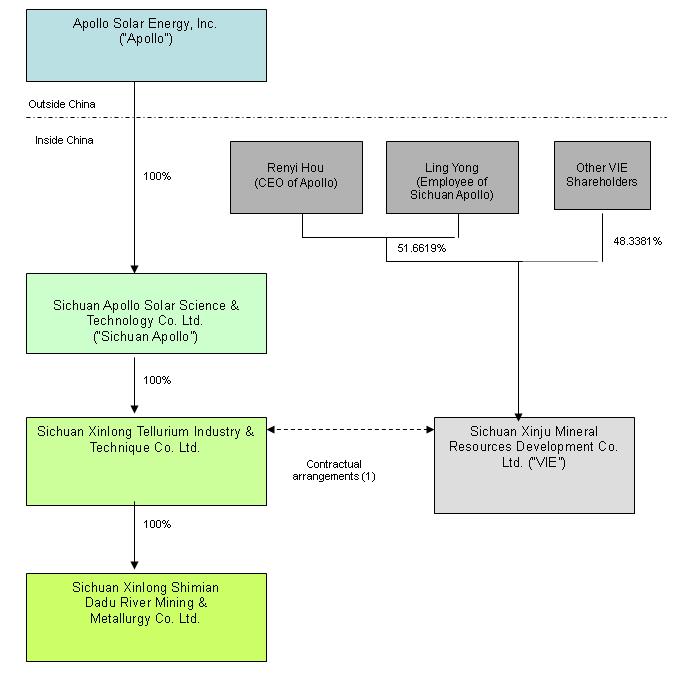
(1) Agreements that provide us with effective control over Sichuan Xinju Mineral Resources Development Co. Ltd., or the VIE, include a purchase option agreement, a business operations agreement and an exclusive technical and consulting agreement.
17
The agreements between the VIE and our other affiliated entities or persons are summarized below:
|
·
|
First Option Exclusive Acquiring Agreement, between Sichuan Xinlong Tellurium Industry & Technique Co., Ltd., Sichuan Xinju Mineral Resources Development Co., Ltd., Renyi Hou, our former CEO and Ling Yong, our former CFO, which grants to our wholly-owned subsidiary a first option to purchase the Exploration Business at such time as the purchase becomes advisable, permissible and in our best interest.
|
|
·
|
Exclusive Sales Agreement , between Sichuan Xinlong Tellurium Industry & Technique Co., Ltd. and Sichuan Xinju Mineral Resources Development Co., Ltd., which grants to our wholly-owned subsidiary the exclusive right to buy all of the output of the Exploration Business.
|
|
·
|
Business Operation Agreement, between Sichuan Xinlong Tellurium Industry & Technique Co., Ltd., Sichuan Xinju Mineral Resources Development Co., Ltd., Renyi Hou and Ling Yong, which imposes certain restrictions and obligations on the VIE and certain of its shareholders to support the VIE arrangement, including refraining from competing with our business and modifying the business operations of the VIE without the prior consent of our wholly-owned subsidiary.
|
|
·
|
Exclusive Technical and Consulting Agreement, between Sichuan Xinlong Tellurium Industry & Technique Co., Ltd. and Sichuan Xinju Mineral Resources Development Co., Ltd., which requires the VIE to provide certain technical and consulting services exclusively to our wholly-owned subsidiary in connection with the Exploration Business. Our wholly-owned subsidiary agrees to provide up to $6.0 million in investing funding to the VIE in connection with its operation of the Exploration Business, on such terms as the parties shall agree from time to time.
|
Critical Accounting Policies, Estimates and Assumptions
During the three months ended March 31, 2011, there were no changes made to our critical accounting policies and the use of estimates. For further information, please refer to “Critical Accounting Policies and Use of Estimates” included in Part II, Item 7 of our Annual Report on form 10-K for the year ended December 31, 2010 filed with the SEC on April 8, 2011, as amended by Amendment No. 1 to our Annual Report on Form 10-K, filed with the SEC on May 2, 2011.
Results of Operations
18
Three Months Ended March 31, 2011 and compared to the month ended March 31, 2010
Sales
Sales for the three months ended March 31, 2011 were $3,783,220, compared to the sales of $1,073,774 in the same period in 2010, an increase of $2,709,446 or approximately 252%. Sales of Tellurium increased by approximately $2,000,000 of which approximately $1,140,000 was attributable to sales to First Solar. Sales of Selenium increased from approximately $20,000 to $800,000 representing an increase of approximately $780,000.
Cost of sales
Cost of sales for the three months ended March 31, 2011 was $3, 430,156, compared to the cost of sales of $839,028 for the three months ended March 31, 2010 representing an increase of $2,591,128 or 309%. This increase results primarily from the increase in sales and higher cost of materials used in our products.
Gross profit
Gross profit for the three months ended March 31, 2011 was $353,064, compared to the gross profit of $234, 746 for the period ended March 31, 2010. The gross profit margin for the three months ended March 31, 2011 was 9.3% compared to 21.9% in the same period of 2010. The decrease in gross profit margin primarily resulted from higher costs of raw materials which the Company was unable to pass along to its customers.
Selling expense
For the three months ended March 31, 2011, selling expenses were $70,273 compared to $72,101 for the same period ended March 31, 2010, representing a decrease of 2.5%. This decrease was primarily due to our continued tighter controls over selling expenses while we attempted to explore and develop new markets.
General and administrative expenses
We incurred general and administrative expenses of $900,781 for the three months ended March 31, 2011, when compared to that of $1,190,137 in the same period of 2010, representing a decrease of 24.3%. For the three months ended March 31, 2011 and 2010, costs for stock based compensation and stock issued for services were $160,865 and $394,436, respectively. Excluding stock based compensation expense, we incurred other general and administrative expenses of $739,916for the year ended March 31, 2011, as compared to expenses of $795,701 for the year ended March 31, 2010, representing a decrease of 9.3% which was primarily due to tighter budget controls.
19
Research and development expenses
For the three months ended March 31, 2011, we incurred research and development expenses of $30,810, compared to $9,577 for the three months ended March 31, 2010. This represents an increase of 221.7%. The increase in spending on research and development expenses was due to higher salaries of research and development employees.
Net income/loss
For the three months ended March 31, 2011 we had a net income of $79,593, compared to net loss of $1,086,159 for the three months ended March 31, 2010. The primary reasons for the increase in net income for the three months ended March 31, 2011was an increase in sales and the reduction of general and administrative expenses plus interest income of loan to related parties.
Other
For the three months ended March 31, 2011 we had an equity in loss of Joint Venture $111,843 interest income from loan to related party $837,359, net of, interest expenses of $94,188, and income tax credit of $97,066. For the three months ended March 31, 2010, we had no equity in loss of Joint Venture and interest expense of $104,286 .
20
Net cash (used in) provided by operating activities.
Net cash provided by operating activities for the three months ended March 31, 2011 was $361,551, compared to net cash used in $1,244,693 in the same period in 2010. Cash provided by operating activities was accounted for by an increase in accounts receivable of $1,753,928, a decrease in inventory of $1,580,422, a decrease in prepaid expenses of $396,750, an increase in the account payable - construction of $304,007, and a decrease in accrued expenses of $979,789.
For the three months ended March 31, 2010, cash used in operating activities caused an increase in accounts receivable of $656,213, an increase in inventory $319,763, an increase in accounts payable $226,505, an increase in accounts payable - construction of $19,666, and a decrease in accrued expenses of $11,126.
Net cash (used in) investing activities.
Net cash used in investing activities for the three months ended March 31, 2011 and 2010 was $68,805 and $39,416, respectively, which primarily resulted from the purchase of property and equipment.
Net cash (used in)/provided by financing activities.
Net cash used in financing activities for the three months ended March 31, 2011 was $1,832,610, representing a repayment to shareholder loan of $1,690,029, payments to a related party of $237,428, and payment with respect to a short-term loan of $380,009.
Net cash provided by financing activities for the three months ended March 31, 2010 was $3,445,054, consisting of $1,464,674 cash inflow from short-term bank loans and $1,965,276 net of cash inflow of advance from related party $237,429.
The Company believes that its cash flows generated internally may not be sufficient to sustain operations and repay short term bank loans for the next twelve months. Therefore, from time to time, the Company may require extra funding through short term borrowing from PRC banks or other financing activities if needed in the near future.
21
Contractual obligations
The following table describes our contractual commitments and obligations as of March 31, 2011:
|
Payments due by Period (in $)
|
||||||||||||||||||
|
Contractual Obligations
|
Total
|
Less Than 1 Year
|
1 – 3
Years
|
3 – 5
Years
|
More Than
5 Years
|
|||||||||||||
|
Short term debt
|
$
|
4,662,065
|
$
|
4,662,065
|
$
|
—
|
$ |
—
|
$ |
—
|
||||||||
|
|
$
|
4,662,065
|
$
|
4,662,065
|
$
|
—
|
$
|
—
|
$
|
—
|
||||||||
Seasonality
Our business is not cyclical and does not have a clear pattern of seasonality.
Off-Balance Sheet Transactions
We have no material off-balance sheet transactions.
Impact of Recent Currency Exchange Rate Increase
We use the U.S. dollar as the reporting currency for our financial statements. Our operations are conducted through our PRC operating subsidiary, Sichuan Apollo, and our functional currency is the RMB. On July 21, 2005, the PRC government changed its policy of pegging the value of the RMB to the U.S. dollar and, as a result, the RMB has appreciated against the U.S. dollar by approximately 8.26% from 1:8.27 on July 21, 2005 to 1:6.8270 on December 31, 2009 and 1:6.6023 on December 31, 2010. In converting our RMB income statement amounts into U.S. dollars we used the following RMB/$ exchange rates: 6.5788 and 6.8275 for the three months ended March 31, 2011 and 2010 respectively. There is no guarantee that we will benefit from the exchange rate in the future and our operations may suffer if a less favorable exchange rate develops.
Future Capital Expenditures
On April 10, 2009, we signed the VIE Agreements to acquire the exploration rights of the Dashuigou area and the mining rights of the Majiahou mine. We expect to invest in exploration, mining equipment, and refinery facility in the future so that we can source tellurium internally. Additional capital for this objective may be required that is in excess of our current resources, requiring us to raise additional capital through additional equity offerings or secured or unsecured debt financing. The availability of additional capital resources will depend on prevailing market conditions, interest rates, and our existing material financial position and results of operations.
22
ITEM 3. QUANTITATIVE AND QUALITATIVE DISCLOSURES ABOUT MARKET RISK
Foreign Exchange Risk
We use the U.S. dollar as the reporting and functional currency for our financial statements. As we conduct our operations through our PRC subsidiary, the functional currency of our PRC subsidiary is RMB. Substantially all our revenue and related expenses, including cost of revenues and advertising expenses, are denominated and paid in RMB. Transactions in other currencies are recorded in RMB at the rates of exchange prevailing when the transactions occur. Monetary assets and liabilities denominated in other currencies are remeasured into RMB at rates of exchange in effect at the balance sheet dates. Exchange gains and losses are recorded in our statements of operations as other comprehensive income.
The value of RMB is subject to changes in China’s governmental policies and to international economic and political developments. In January, 1994, the PRC government implemented a unitary managed floating rate system. Under this system, the People’s Bank of China, or PBOC, began publishing a daily base exchange rate with reference primarily to the supply and demand of RMB against the U.S. dollar and other foreign currencies in the market during the previous day. Authorized banks and financial institutions are allowed to quote buy and sell rates for RMB within a specified band around the central bank’s daily exchange rate. On July 21, 2005, PBOC announced an adjustment of the exchange rate of the U.S. dollar to RMB from 1:8.27 to 1:8.11 and modified the system by which the exchange rates are determined. This modification has resulted in an approximate 21% appreciation of the RMB against the U.S. dollar from July 21, 2005 to March 31, 2011. While the international reaction to the RMB revaluation has generally been positive, there remains significant international pressure on the PRC government to adopt an even more flexible currency policy, which could result in further fluctuation of the exchange rate of RMB against the U.S. dollar. As all of our net revenues are recorded in RMB, any future devaluation of RMB against the dollar could negatively impact our results of operations.
Commodity Price Sensitivity
We are exposed to market risk in connection with our inventory balances, which are comprised primarily tellurium, cadmium, selenium, indium and metal powder made from rare base metals. Our inventories are stated at the lower of cost or market using the weighted average method. If there is a downward change in the market price of base metals, we are required to mark-down the value of our inventory and record a loss in our statement of income. We cannot predict the extent to which high raw material price levels will continue in the future. We do not have any long-term raw material purchase contracts.
23
ITEM 4. CONTROLS AND PROCEDURES
(a) Evaluation of Disclosure Controls and Procedures
Under the supervision and with the participation of our management, including our Chief Executive Officer and Chief Financial Officer, we evaluated the effectiveness of the design and operation of our disclosure controls and procedures pursuant to Rule 13a-15 under the Securities Exchange Act of 1934, as amended, or the Exchange Act, as of the end of the period covered by this report. Based on that evaluation, our Chief Executive Officer and Chief Financial Officer have concluded that our disclosure controls and procedures are effective.
(b) Changes in Internal Controls
There were no changes in our internal control over financial reporting during the three months ended March 31, 2011 that have materially affected, or are reasonably likely to materially affect our internal control over financial reporting.
24
PART II. OTHER INFORMATION
None.
In addition to other information set forth in this report, you should carefully consider the “Risk Factors” discussed in our Annual Report on Form 10-K filed on April 8, 2011, as amended by Amendment No. 1 to our Annual Report on Form 10-K, filed on May 2, 2011, for our 2010 fiscal year. There have been no material changes to the “Risk Factors” previously disclosed in our Annual Report on Form 10-K.
The following exhibits are filed as a part of this Report.
|
Incorporated by Reference
|
||||||||||||||||
|
Exhibit
|
Filed
|
Exhibit
|
File
|
Filing
|
||||||||||||
|
No
|
Exhibit Title
|
Herewith
|
Form
|
No.
|
No.
|
Date
|
||||||||||
|
31.1
|
Certification of Chief Executive Officer pursuant to Rules 13a-14 and 15d-14, as adopted pursuant to Section 302 of the Sarbanes-Oxley Act of 2002
|
X
|
||||||||||||||
|
31.2
|
Certification of Chief Financial Officer pursuant to Rules 13a-14 and 15d-14, as adopted pursuant to Section 302 of the Sarbanes-Oxley Act of 2002
|
X
|
||||||||||||||
|
32.1
|
Certification of Chief Executive Officer and Chief Financial Officer Pursuant to 18 U.S.C. Section 1350 as Adopted Pursuant to Section 906 of the Sarbanes-Oxley Act of 2002
|
X
|
||||||||||||||
|
*
|
Management contract, or compensatory plan or arrangement.
|
25
In accordance with the requirements of the Exchange Act, the registrant has duly caused this report to be signed on its behalf by the undersigned, thereunto duly authorized.
|
Apollo Solar Energy, Inc.
|
|||||
| Date: May 16, 2011 | By: /s/ Jingong Pan | ||||
| Jingong Pan | |||||
| Chief Executive Officer | |||||
| Date: May 16, 2011 | By: /s/ Wilson W. Liu | ||||
| Wilson W. Liu | |||||
| Chief Financial Officer | |||||
26