Attached files
| file | filename |
|---|---|
| 8-K - VVC VUHI 8K - VECTREN CORP | vvc_vuhi8k.htm |
| EX-99.2 - EXHIBIT 99.2 - VECTREN CORP | ex99_2.htm |
Exhibit 99.1

AGA Financial Forum
Investor Presentation
May 15-17, 2011

2
Forward-Looking Statements
All statements other than statements of historical fact are forward-looking statements made
in good faith by the company and are intended to qualify for the safe harbor from liability
established by the Private Securities Litigation Reform Act of 1995. Such statements are
based on management’s beliefs, as well as assumptions made by and information currently
available to management and include such words as “believe”, “anticipate”, ”endeavor”,
“estimate”, “expect”, “objective”, “projection”, “forecast”, “goal”, “likely”, and similar
expressions intended to identify forward-looking statements.
Vectren cautions readers that the assumptions forming the basis for forward-looking
statements include many factors that are beyond Vectren’s ability to control or estimate
precisely and actual results could differ materially from those contained in this document.
Forward-looking statements speak only as of the date on which our statement is made, and
we assume no duty to update them. More detailed information about these factors is set
forth in Vectren’s filings with the Securities and Exchange Commission, including Vectren’s
2010 annual report on Form 10-K filed on February 17, 2011.
Robert L. Goocher, Treasurer and VP - Investor Relations
rgoocher@vectren.com
812-491-4080

3
Management Representatives at AGA
Ø Carl Chapman - Chairman, President and CEO
Ø Jerry Benkert - Executive Vice President and CFO
Ø Robert Goocher - Treasurer & Vice President - Investor Relations
Ø Aaron Musgrave - Manager - Investor Relations

Ø NYSE Symbol: VVC
Ø 8-10% target annual total
shareholder return
shareholder return
• Annual dividends paid increased
51st consecutive year in Dec. 2010
to annualized rate of $1.38 per
share
51st consecutive year in Dec. 2010
to annualized rate of $1.38 per
share
Ø Over 1.1 million utility customers
in Indiana and Ohio
in Indiana and Ohio
• Operate in constructive regulatory
environments with revenue
stabilization mechanisms
environments with revenue
stabilization mechanisms
Ø Well diversified nonutility portfolio
linked to core utility
linked to core utility
Ø ~$4.8 billion in assets
Ø ~$2.1 billion in revenues
Ø ~$2.3 billion market cap
Ø S&P: A-, Moody’s: A3
Stable outlook for both
Stable outlook for both
Utility Net Income
Consolidated Net Income*
Three Year Average (’08-’10)
Utility
84%
Nonutility
16%
Electric
50%
Gas
50%
4
* Excludes the 2009 Liberty charge of $11.9 million.
Vectren Corporation Overview

5
Vectren at a Glance
Vectren
Utility
Vectren
Nonutility
Vectren North
Indiana Gas
Vectren South
SIGECO -
Electric
Electric
Vectren South
SIGECO - Gas
Vectren Ohio
VEDO
Infrastructure
Services
Services
Energy
Services
Services
Coal Mining
Energy
Marketing
Marketing
Miller Pipeline
Energy
Systems Group
Prosperity Mine
Oaktown Mine 1
Oaktown Mine 2
(under development)
ProLiance
Energy **
Vectren
Source
Minnesota
Limited *
** Jointly owned with a
subsidiary of Citizens Energy
Group
subsidiary of Citizens Energy
Group
* Acquired on 3/31/2011

6
Looking Ahead - Strategies for 2011 and Beyond
Utility
Ø Execute strategies to consistently achieve annual utility earnings growth target of 3%
• Earn allowed returns in gas and electric utilities
– Implement new electric rates from 4/27/11 base rate Order
– Aggressively manage costs through performance management and strategic sourcing
– Seek continued support for alternative regulatory solutions that encourage customer
conservation and also reduce the size and frequency of traditional base rate cases
conservation and also reduce the size and frequency of traditional base rate cases
• Disciplined allocation of capital to operate at cash flow neutral
– Reinvest earnings to support necessary rate base growth
– Reduce external financing requirements
Nonutility
Ø Continued growth and profitability of existing portfolio of nonutility businesses
• Increase investments in Infrastructure and Energy Services businesses to drive longer term
earnings growth
earnings growth
– Including Infrastructure Services’ acquisition of Minnesota Limited on March 31, 2011
• As demand continues to recover, open Oaktown #2 coal mine in 2012 and ramp up to full
production
production
• Focus on dramatically improving ProLiance’s profitability prospects through customer growth and
significant reductions in fixed cost structure
significant reductions in fixed cost structure

7
Early 2011 Highlights
Ø 1st Quarter 2011 earnings of $44.6 million, or $0.55 per share, compared to $63.2 million,
or $0.78 per share in 2010
or $0.78 per share in 2010
• Consolidated results on plan for the quarter; Consolidated 2011 guidance affirmed
• Utility results were as expected with solid large customer margins tempered by higher operating
expenses from planned maintenance of electric generating units
expenses from planned maintenance of electric generating units
• Lower nonutility earnings reflecting lower contributions from ProLiance as expected
– All nonutility businesses remain on track to meet 2011 expectations
Ø Order for $28.6 million annualized base rate increase received in electric rate case on April
27, 2011
27, 2011
Ø Successfully priced $150 million of utility related long-term debt in March 2011 at weighted
average interest rate of 5.12%
average interest rate of 5.12%
• Eliminates refinancing risk for 6.625% December 2011 $250 million maturity
• Remainder to be retired with short-term debt
• Delayed draw feature matches timing of retirement
Ø Acquisition of Minnesota Limited on 3/31/2011 enhances growth opportunities for
Infrastructure Services segment
Infrastructure Services segment
• Expected to add $0.02-$0.04 to 2011 EPS
Ø Indiana Senate Bill 251 signed by the Governor on 5/10/11; allows for cost recovery outside
a base rate proceeding for federally mandated projects and provides for a voluntary clean
energy portfolio standard
a base rate proceeding for federally mandated projects and provides for a voluntary clean
energy portfolio standard
• Applies to the integrity, safety, and reliable operation of natural gas pipelines and facilities as well as
environmental costs incurred due to EPA rules for both our gas and electric utilities
environmental costs incurred due to EPA rules for both our gas and electric utilities

8
Electric Base Rate Case - Order on April 27, 2011
Ø Annualized rate increase of $28.6 million based on 10.4% ROE; new rates effective 5/2/11
• Consistent with 2011 guidance expectation of ~$15-20 million of rate relief, which assumed a partial-
year impact
year impact
Ø Decoupling rate design denied
• However, separate settlement in place provides opportunity for subsequent filing for lost margin
recovery from implementation of energy efficiency programs
recovery from implementation of energy efficiency programs
Ø Coal contracts remain effective
• Going forward a Commission review process for future coal procurement will be initiated
Ø Continuation of 50/50 Wholesale Power Marketing sharing above & below the annual base
rate level of $7.5 million
rate level of $7.5 million
• Previous base level was $10.5 million
Ø Approved deferred depreciation and continued AFUDC accrual on Dense Pack projects (~$35
million investment thru 2013)
million investment thru 2013)

9
Transaction Highlights - Minnesota Limited Acquisition
Ø Consistent with plan to target infrastructure services growth through geographic
and market expansion opportunities
and market expansion opportunities
• Net purchase price of $83 million; Closed 3/31/2011
• Expected to add $0.02-$0.04 to Vectren’s EPS in 2011
• Provides underground transmission pipeline construction and repair services for natural gas
and petroleum companies
and petroleum companies
– Complements Miller’s other existing market segments for natural gas, water and wastewater
construction, primarily focused on distribution; limited overlap of customers and geography
construction, primarily focused on distribution; limited overlap of customers and geography
– Positions combined company to take advantage of the pipeline construction impacts from shale
– Brings expanded construction capabilities to Miller’s existing customer base in the
Marcellus shale basin
Marcellus shale basin
– Minnesota’s location positions them for growth in the Bakken shale basin in North
Dakota
Dakota
• Synergies from the combination expected to result in revenue growth opportunities and
efficiencies
efficiencies
– Combined resources provides ability to compete for larger projects; sharing of equipment and
facilities
facilities
• Minnesota’s experienced and well respected management team remains in place (Big Lake,
MN)
MN)
• See Appendix for additional information on the transaction

10
2011 EPS Guidance Affirmed
Consolidated: $1.60 to $1.85 per share
Utility: $1.45 to $1.55 per share
Nonutility, excl. ProLiance: $0.32 to $0.42 per share
ProLiance: $(0.20) to $(0.10) per share
Ø Consolidated 2011 EPS guidance midpoint remains at $1.87, excluding ProLiance

11
Generation Portfolio
Ø 5 Coal-fired base units - 1,000 MW
• 100% scrubbed for SO2
• 90% controlled for NOx
• Combination of pollution controls,
including fabric filter technology, have the
co-benefit of removing substantial levels
of mercury and particulate matter
including fabric filter technology, have the
co-benefit of removing substantial levels
of mercury and particulate matter
• Vectren’s generation fleet investments
over the past decade have positioned the
company well to comply with the new EPA
rules without significant additional
investment; Indiana SB251 is supportive if
future investments are necessary
over the past decade have positioned the
company well to comply with the new EPA
rules without significant additional
investment; Indiana SB251 is supportive if
future investments are necessary
Ø 6 Gas-fired peak-use turbines - 295 MW
Ø Purchased capacity - 100 MW thru 2012
Ø Renewable energy ~ 5%
• Land-fill gas generation facility - 3 MW
• Wind energy - up to 80 MW via purchased
power agreements of ~20 years
power agreements of ~20 years
The Utility Group
Utility Service Territories
OH
IN
Vectren Utility Holdings, Inc.
Vectren Energy Delivery of Indiana - North
570,000 Gas Customers
Vectren Energy Delivery of Indiana - South
142,000 Electric Customers
111,000 Gas Customers
Vectren Energy Delivery of Ohio
314,000 Gas Customers

12
Constructive Utility Regulation - Mitigating Risk
Ø Gas Utilities’ Rate Base: ~$1.2 billion
• ~$0.9 billion Indiana
• ~$0.3 billion Ohio
• ~10.2% Total Gas Allowed ROE
(1) Settlement pending which provides for a mechanism to recover margins lost from the company's large
commercial and industrial customers associated with implementation of energy efficiency programs. The settlement
also provides that margins lost from residential and commercial customers due to energy efficiency programs may
be deferred for future recovery under a rate mechanism to be proposed by the company.
Ø Electric Utility Rate Base: ~$1.3 billion
• All Indiana; Excludes FERC Transmission
• 10.4% Allowed ROE
Ø FERC Electric Transmission Rate Base: ~$0.1 billion
• 12.38% Allowed ROE

13
Utility Investments and Cash Flow
Ø Targeting free cash flow neutral in 2011-2013, similar to 2010
• Depreciation & amortization expense of $190 to $200 million expected through 2013
Ø Favorable regulatory support in recovering capital spend on significant utility expenditures
• Annual incremental margins expected each year from regulatory mechanisms for current recovery of Ohio bare
steel/cast iron (BS/CI) expenditures, and favorable BS/CI accounting treatment in IN
steel/cast iron (BS/CI) expenditures, and favorable BS/CI accounting treatment in IN
• Total investment of ~$90 million in high voltage electric transmission line, timely recovered at FERC-approved
equity return of 12.38%, with completion in 2012; 2011 earnings to reflect a return on ~$75 million of the total
equity return of 12.38%, with completion in 2012; 2011 earnings to reflect a return on ~$75 million of the total
Ø Utilize cash generated from bonus depreciation to reduce external financing requirements and
accelerate funding of pension plans in 2011 ($25 million)
accelerate funding of pension plans in 2011 ($25 million)
• Estimate will generate ~$100 million of incremental cash in 2011-2013

Infrastructure Services - Miller Pipeline and Minnesota
Limited
Limited
Ø Provides underground pipeline construction and
repair services for natural gas, water and
wastewater companies
repair services for natural gas, water and
wastewater companies
Ø 2010 gross revenues of ~$235 million
($30 million from transmission construction)
Ø Over 1,700 employees
Ø Over 55 years in construction business
Ø Headquartered in Indianapolis, IN
Ø Operates primarily in Midwest, Mid-Atlantic and
Southern regions
Southern regions
Ø Major customers are regional utilities, such as
Vectren, NiSource, Duke, LG&E, Alagasco and
Citizens
Vectren, NiSource, Duke, LG&E, Alagasco and
Citizens
Ø Acquired 5 small regional pipeline construction
companies over past 4 years, expanding location
and scope of operation
companies over past 4 years, expanding location
and scope of operation
Ø Provides underground pipeline construction
and repair services for natural gas and
petroleum transmission companies
and repair services for natural gas and
petroleum transmission companies
Ø 2010 gross revenues of ~$110 million
Ø Nearly 500 employees
Ø Over 45 years in construction business
Ø Headquartered in Big Lake, MN
Ø Operates primarily in Minnesota and
surrounding states
surrounding states
Ø Major customers include Northern Natural,
Consumers Energy, Enbridge Energy and
Minnesota Pipe Line
Consumers Energy, Enbridge Energy and
Minnesota Pipe Line
Ø Management team will remain in place
• Strong, multi-year retention incentive in
place for Minnesota’s President
place for Minnesota’s President
14

15
Infrastructure Services - cont.
Ø Significant drivers for future growth include:
• New and existing customers - more projects as economy continues rebound; availability of bonus
depreciation
depreciation
– Bare steel/cast iron replacement programs, along with waste water and sewer rehabilitation
projects
projects
– Increased emphasis on growing gas transmission construction business, building off successful
2010 projects
2010 projects
– Competing for growing number of new shale gas pipeline infrastructure projects
– Significant work expected related to gas pipeline infrastructure integrity assessments resulting
from San Bruno and other recent incidents
from San Bruno and other recent incidents
• Utilization of technology and other workforce improvement measures to drive improved
productivity, efficiency and control costs
productivity, efficiency and control costs
• Infrastructure is a focused growth area for Vectren

16
Energy Services - Energy Systems Group (ESG)
Ø Performance contracting and renewable
energy project group
energy project group
• 2010 revenues of $147 million
• Record backlog of $122 million at 3/31/11
• Approx. 235 employees at 3/31/11 and currently
ramping up hiring to set the stage for future
growth
ramping up hiring to set the stage for future
growth
Ø Operates primarily in the Midwest, Mid-
Atlantic and Southern regions, recently
expanding its territorial reach including Texas,
Colorado, New Mexico and U.S. Virgin Islands
Atlantic and Southern regions, recently
expanding its territorial reach including Texas,
Colorado, New Mexico and U.S. Virgin Islands
• Major customers include hospitals, universities,
governments and schools (HUGS)
governments and schools (HUGS)
Ø Provides energy-saving performance
contracting
contracting
• Design facility improvements that pay for
themselves from energy savings and
operational improvements
themselves from energy savings and
operational improvements
Ø Designs, constructs, manages and owns
renewable energy projects
renewable energy projects
• Successfully completed three landfill gas projects
• Near-term opportunities include landfill and
anaerobic digester projects
anaerobic digester projects
Ø ESG is partnering with eight gas/electric
utilities as conservation and renewable
energy contractor
utilities as conservation and renewable
energy contractor
• Subcontractor under the federal “area
wide” contractor mechanism to develop
energy efficiency conservation projects to
federal installations
wide” contractor mechanism to develop
energy efficiency conservation projects to
federal installations
Ø Energy Efficient Commercial Building
federal income tax deductions (Revenue
Code 179D) available through 2013
federal income tax deductions (Revenue
Code 179D) available through 2013

17
Coal Mining
Ø Mines and sells Indiana coal to Vectren’s utility
operations and other third parties
operations and other third parties
• 2010 revenues of $210 million
• 750 contract mining jobs with completion of Oaktown
mines
mines
Ø Competitive location - 13 power plants within 50
mile radius of underground mines
mile radius of underground mines
Ø 2011 sales estimated at 5.1 million tons compared
to 3.7 million in 2010
to 3.7 million in 2010
• 90% contracted and priced
• Reduced costs at Oaktown 1 due to additional volumes
• ~1.9 million tons to Vectren, incl. 200k deferred
Ø Approximately 40% and 15%, respectively, of
2012 and 2013 expected production already
contracted and priced
2012 and 2013 expected production already
contracted and priced
Ø As 2nd Oaktown mine comes online in 2012,
production costs per ton expected to decline
production costs per ton expected to decline
• Will enable cost sharing of investments already
made in wash plant, rail spur, etc., plus other
operating efficiencies
made in wash plant, rail spur, etc., plus other
operating efficiencies
Ø Long-term Illinois Basin coal demand expected to
continue increasing as economy improves,
inventory levels reduced, scrubbers are installed,
and as Appalachian production declines
continue increasing as economy improves,
inventory levels reduced, scrubbers are installed,
and as Appalachian production declines
Ø Prosperity Mine
• 32 million tons of reserves
• 4.0 lbs SO2 - 11,300 BTU
• Est. max annual production up to 3 million
tons
tons
• Mine reconfiguration was completed 1st
quarter 2011, driving cost reductions
quarter 2011, driving cost reductions
Ø Oaktown Mines 1 & 2
• 104 million tons of reserves
• Less than 6.0 lbs SO2 - 11,200 BTU
• Est. max annual production
– Oaktown #1 up to 3 million tons
– Oaktown #2 up to 2 million tons
– Ramp up in production dependent on
contracts, negotiations continue
contracts, negotiations continue
• Through December 2010, $185 million in
development costs already incurred of
expected $205 million total for both mines
development costs already incurred of
expected $205 million total for both mines

18
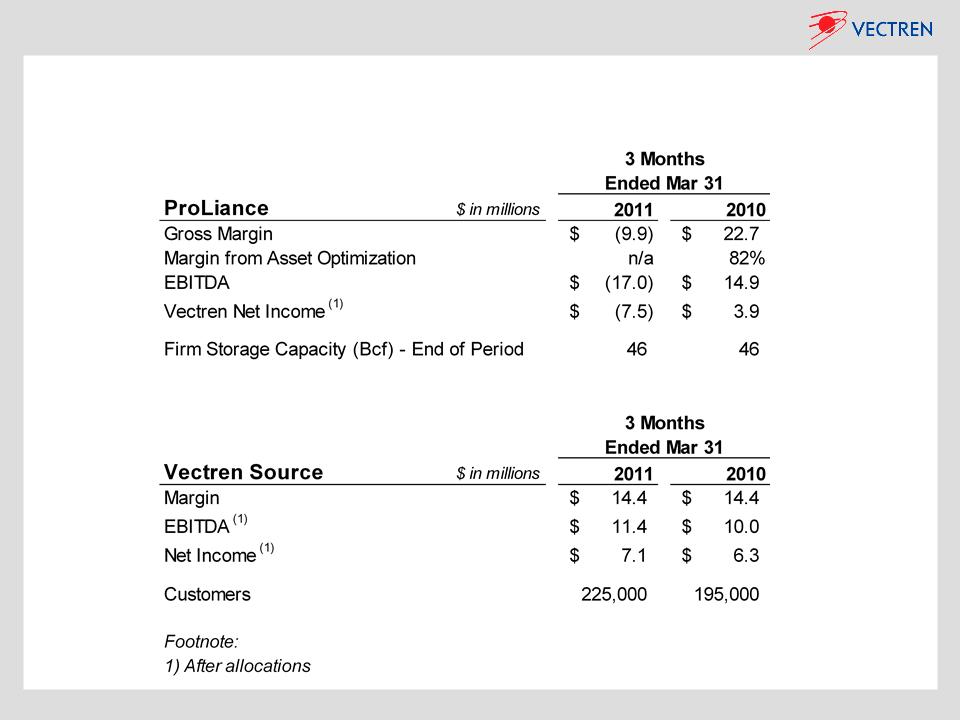
Energy Marketing - ProLiance
Ø Energy marketing affiliate with Vectren (61%)
and Citizens Energy Group (39%) - equity
accounting
and Citizens Energy Group (39%) - equity
accounting
• 2010 revenues of $1.5 billion
• ~100 employees
• Operates throughout the Midwest & Southeast
• 46 Bcf of natural gas storage and diverse
pipeline transportation network under contract
pipeline transportation network under contract
• Balanced book approach - VaR capped at $2.5
million
million
Ø Provides bundled gas services, including base
load, peaking sales, risk management, and
other ancillary services
load, peaking sales, risk management, and
other ancillary services
• Retail services to over 1,700 Commercial and
industrial customers
industrial customers
• Wholesale services to utilities, municipals,
power generators
power generators
• Ranked #2 out of 32 gas marketers in 2010
Mastio customer satisfaction survey; in top 4
each of the past 5 years
Mastio customer satisfaction survey; in top 4
each of the past 5 years
Ø Indiana regulatory approval received in March 2011 for ProLiance’s continued provision of gas supply
services to Vectren’s & Citizens’ utilities for an additional five years, through March 2016
services to Vectren’s & Citizens’ utilities for an additional five years, through March 2016
Ø Restructuring of transportation and storage contracts
• $7 million of annualized fixed demand costs will be dropped in 2011 starting in the second quarter
• $25 million or one-third of contracts expire over next 3 years, $40 million or half over next 5 years
Ø Growth in commercial and industrial (C&I) customers
• C&I customer count is up 15% in Q1 2011 vs. Q1 2010
• C&I and power generation customers’ volumes up 40% in Q1 2011 vs. Q1 2010
Ø Reductions in G&A costs - reductions of over 10% realized in Q1 2011 vs. 2010 (annualized)

19
Energy Marketing - Vectren Source
Ø Source provides natural gas and other
related products and services to retail
customers in the Midwest and Northeast
related products and services to retail
customers in the Midwest and Northeast
• 2010 revenues of $143 million
• Current staffing of over 50 employees
• Operates in 7 LDC territories in 3 states -
Ohio, Indiana and New York, with highest
customer concentration in Ohio
Ohio, Indiana and New York, with highest
customer concentration in Ohio
• Considering expanding footprint to markets
in additional states
in additional states
Ø 4/1/11 customer count of ~255,000, an
increase of 60,000 year over year
increase of 60,000 year over year
Ø Focus on customer retention with a
contract renewal rate above 90%
contract renewal rate above 90%
Ø Conservative risk management practices
• Good mix of fixed and variable price
customers
customers
Ø Ohio is transitioning to a fully deregulated
market, providing growth opportunities as
energy delivery companies exit the
merchant function of buying natural gas for
its customers
market, providing growth opportunities as
energy delivery companies exit the
merchant function of buying natural gas for
its customers
Ø Developing a residential energy efficiency
service with a pilot offering available in
Cleveland under GreenStreet Solutions SM
service with a pilot offering available in
Cleveland under GreenStreet Solutions SM
• General contractor role in home energy audits
and complete service to implement
recommendations
and complete service to implement
recommendations
• Positioned to take advantage of Home Star
program if approved by Congress
program if approved by Congress
• Will be expanding into Cincinnati/Dayton
market in 2011
market in 2011

20
Summary - Investment Fundamentals
Ø Attractive total shareholder return targeted at 8-10% annually
Ø Over 1.1 million utility customers in Indiana and Ohio
• Operate in constructive regulatory environments with numerous revenue stabilization mechanisms
• Utility growth driven by reinvestment of earnings in recoverable infrastructure improvements, increasing large
customer demand and implementation of new electric base rates
customer demand and implementation of new electric base rates
• Disciplined management of cap ex and operating expenses
• Resulting in more predictable earnings growth opportunities and strong cash flow
Ø Well diversified nonutility portfolio linked to core utility
• Upside earnings opportunity on top of solid utility earnings prospects
• Long-term growth primarily focused on significant growth in infrastructure and energy services businesses, along
with ramp up of coal mines to full production
with ramp up of coal mines to full production
• Executing on strategies to grow the Source customer base and return ProLiance to profitability
Ø Stable ‘A’ rated company (both Moody’s & S&P) with strong balance sheet, liquidity, and cash flows
Ø Experienced management team
Ø Attractive dividend
• 51 consecutive years of increasing annual dividends paid
• Attractive dividend yield

21
Appendix

Appendix
22
Consolidated 1st Quarter Results

Appendix
23
Nonutility Metrics - Infrastructure Services

Appendix
24
Nonutility Metrics - Energy Services

Appendix
25
Nonutility Metrics - Coal Mining
Appendix
26
Nonutility Metrics - Energy Marketing

27
Appendix
Vectren’s Acquisition of Minnesota Limited, Inc.
Ø Transaction Highlights
• On March 31, 2011, Vectren announced that it had acquired Minnesota Limited, Inc. a large
diameter natural gas and petroleum transmission pipeline construction contracting business
diameter natural gas and petroleum transmission pipeline construction contracting business
– Expected to add $.02 - $.04 to Vectren’s EPS in 2011, net of incremental interest costs
– Provides additional support for EPS within previously issued range for
2011 earnings guidance
2011 earnings guidance
– Synergies from the combination expected to result in efficiencies, cost savings and revenue
growth opportunities
growth opportunities
– Sharing of equipment and facilities; combined resources provides ability
to compete for larger projects; potential consolidation of “back office”
functions
to compete for larger projects; potential consolidation of “back office”
functions
– Combined companies expected to generate ~$345 million in revenues and have ~2200
employees
employees
Ø Management
• Combined Vectren Infrastructure Services organization led by Miller’s Doug Banning as CEO
• Minnesota’s management team remains in place, headquartered in Big Lake, MN
• Both management teams have extensive experience and are respected leaders in the industry
– Chris Leines of Minnesota Limited is incoming president of Pipe Line Contractors Association
– Kevin Miller of Miller Pipeline is outgoing president of Distribution Contractors Association

28
Appendix
Vectren’s Acquisition of Minnesota Limited, Inc. (Cont.)
Ø Strategic Rationale for the Acquisition
• Consistent with Vectren’s plans to target infrastructure services growth through geographic and
market expansion opportunities
market expansion opportunities
– Complements Miller’s other existing market segments for natural gas, water and wastewater
construction
construction
– Provides access to new customer base and geographic territories for both Miller and
Minnesota Limited
Minnesota Limited
– Significantly enhances market opportunities for installation of large diameter gas and
petroleum pipes and related infrastructure
petroleum pipes and related infrastructure
– Capitalizes on Minnesota Limited’s strong brand equity, proven management team and great
reputation in the transmission pipeline construction industry
reputation in the transmission pipeline construction industry
• Anticipated growth in demand for gas transmission construction
– Driven by increasing onshore drilling and gathering of natural gas and oil as shale basins are
developed, with a particular focus on the Marcellus and Bakken basins
developed, with a particular focus on the Marcellus and Bakken basins
– Expected additional natural gas pipeline regulations creating increased demand for pipeline
infrastructure assessment and system upgrades
infrastructure assessment and system upgrades
• Capture synergies and leverage operational excellence to accelerate performance throughout the
combined business units
combined business units
– Minnesota’s equipment resources can be more effectively utilized as part of a larger
combined entity
combined entity
– Will facilitate standardization and capture of synergies for key functional areas across all
business units (Accounting, IT, Human Resources, Purchasing, etc.)
business units (Accounting, IT, Human Resources, Purchasing, etc.)

Miller Pipeline
current
transmission
territory
current
transmission
territory
Minnesota
Limited current
transmission
territory
Limited current
transmission
territory
29
Appendix
Jointly Capitalizing on Development of Natural Gas and Oil in Shale Basins
Ø Limited overlap of territories
Ø Positioned well to take advantage of the pipeline construction impacts from shale

Per share earnings contributions of the Utility Group, Nonutility Group, and Corporate and Other
are presented herein and are non-GAAP measures. Such per share amounts are based on the
earnings contribution of each group included in Vectren’s consolidated results divided by
Vectren’s basic average shares outstanding during the period. The earnings per share of the
groups do not represent a direct legal interest in the assets and liabilities allocated to the
groups, but rather represent a direct equity interest in Vectren Corporation's assets and
liabilities as a whole. These non-GAAP measures are used by management to evaluate the
performance of individual businesses. In addition, other items giving rise to period over period
variances, such as weather, are presented on an after tax and per share basis. These amounts
are calculated at a statutory tax rate divided by Vectren’s basic average shares outstanding
during the period. Accordingly, management believes these measures are useful to investors in
understanding each business’ contribution to consolidated earnings per share and in analyzing
consolidated period to period changes and the potential for earnings per share contributions in
future periods. Reconciliations of the non-GAAP measures to their most closely related GAAP
measure of consolidated earnings per share are included throughout the presentation
presented. The non-GAAP financial measures disclosed by the Company should not be
considered a substitute for, or superior to, financial measures calculated in accordance with
GAAP, and the financial results calculated in accordance with GAAP.
Appendix
30
Use of Non-GAAP Performance Measures and Per Share Measures