Attached files
| file | filename |
|---|---|
| 8-K - UIL FORM 8-K DATED MAY 13 2011 - UIL HOLDINGS CORP | uil_form8kdated05132011.htm |
AGA - May 2011
1
American Gas Association
Financial Forum
May 2011
Exhibit 99

AGA - May 2011
2
Safe Harbor Provision
Certain statements contained herein, regarding matters that are not historical facts, are forward-looking statements (as defined in the
Private Securities Litigation Reform Act of 1995). These include statements regarding management’s intentions, plans, beliefs,
expectations or forecasts for the future. Such forward-looking statements are based on UIL Holdings’ expectations and involve risks and
uncertainties; consequently, actual results may differ materially from those expressed or implied in the statements. Such risks and
uncertainties include, but are not limited to, general economic conditions, legislative and regulatory changes, changes in demand for
electricity, gas and other products and services, unanticipated weather conditions, changes in accounting principles, policies or guidelines,
and other economic, competitive, governmental, and technological factors affecting the operations, markets, products and services of UIL
Holdings’ subsidiaries, The United Illuminating Company, The Southern Connecticut Gas Company, Connecticut Natural Gas
Corporation and The Berkshire Gas Company. Such risks and uncertainties with respect to UIL Holdings’ recent acquisition of The
Southern Connecticut Gas Company, Connecticut Natural Gas Corporation and The Berkshire Gas Company include, but are not limited
to, the possibility that the expected benefits will not be realized, or will not be realized within the expected time period. The foregoing and
other factors are discussed and should be reviewed in UIL Holdings’ most recent Annual Report on Form 10-K and other subsequent
periodic filings with the Securities and Exchange Commission. Forward-looking statements included herein speak only as of the date hereof
and UIL Holdings undertakes no obligation to revise or update such statements to reflect events or circumstances after the date hereof or to
reflect the occurrence of unanticipated events or circumstances.
James P. Torgerson
President and Chief Executive Officer
Note to Investors
AGA - May 2011
3
3
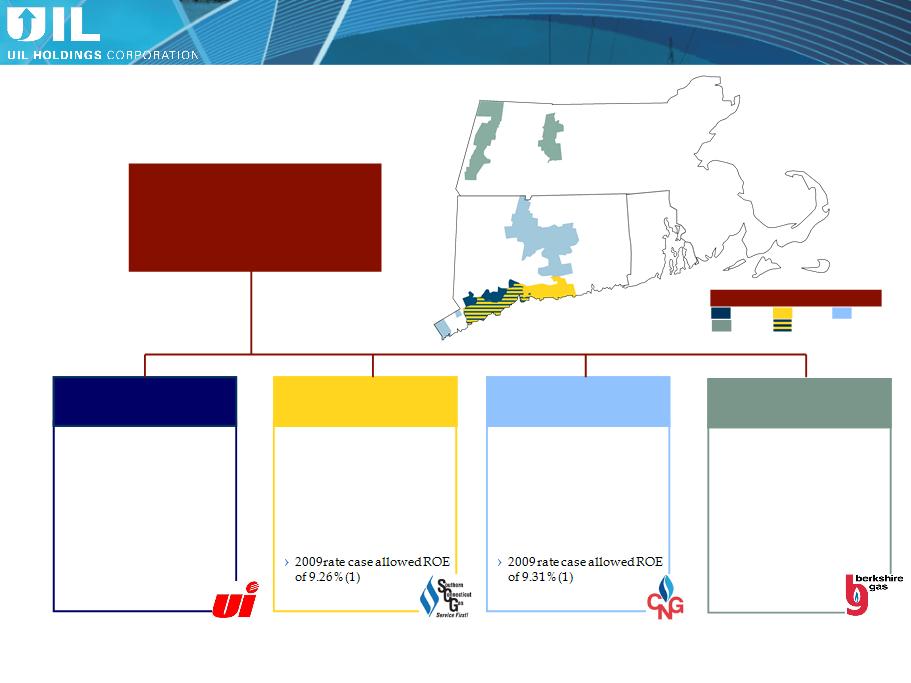
UIL - Corporate Structure, Service Areas
› Service territory: 335 sq
miles
miles
› ~325,000 customers
› 1,095 employees
› Allowed Distribution ROE
of 8.75%
of 8.75%
› Earned ’10 Transmission
ROE (composite) of 12.5%
ROE (composite) of 12.5%
› 50% interest in GenConn
Energy LLC
Energy LLC
The United Illuminating
Company (UI)
Company (UI)
Note: (1) Includes 10 basis point penalty reduction. Previously authorized 10.0% & 10.1% at SCG & CNG respectively, in effect pending approval of settlement agreement.
UIL Holdings
Corporation
Corporation
Service Area Key
SCG
CNG
UI
Berkshire
Overlapping Territory
› Service territory: 716 sq
miles - Greater Hartford-
New Britain & Greenwich
miles - Greater Hartford-
New Britain & Greenwich
› ~160,000 customers
› 319 employees
› 2,011 miles of mains with
~124,000 services
~124,000 services
Connecticut Natural Gas
(CNG)
(CNG)
› Service territory: 738 sq
miles in Western MA
including Pittsfield and
North Adams
miles in Western MA
including Pittsfield and
North Adams
› ~36,000 customers
› 120 employees
› 738 miles of mains
› Allowed ROE of 10.50%
Berkshire Gas Company
(Berkshire)
(Berkshire)
› Service territory: 512 sq
miles from Westport, CT to
Old Saybrook, CT
miles from Westport, CT to
Old Saybrook, CT
› ~178,000 customers
› 290 employees
› 2,269 miles of mains with
~131,000 services
~131,000 services
Southern Connecticut Gas
(SCG)
(SCG)
AGA - May 2011
4
Investment Highlights
Attractive Dividend
(5.1% Yield)(2)
› Current annual dividend of $1.728 per share
› Core regulated earnings combined with the enhanced cash flow and expected earnings per
share accretion from the acquisition provide continued support for UIL’s dividend
share accretion from the acquisition provide continued support for UIL’s dividend
Visible Regulated
Growth
Opportunities
Growth
Opportunities
› Approximately $2.1B of regulated electric capital investment in The United Illuminating
Company (UI) 10-year plan (2010-2019)(1)
» Includes $0.6B of highly attractive transmission projects
Strong Balance Sheet
› Maintenance of investment grade credit ratings is an important objective
› Based on current plans, expect no need for external equity for at least the next 3 years
FERC-Regulated
Electric
Transmission
Electric
Transmission
› 2010 earned composite return on equity of 12.5%
› Proven ability to partner reaching beyond service territory
› New England renewable portfolio standards driving need for major transmission build
Attractive Regulated
Electric and Gas
Utility
Electric and Gas
Utility
› Proven ability to earn allowed electric returns
› Highly experienced with Connecticut regulatory proceedings
› Constructive long-term rate plan for Berkshire in Massachusetts
Notes: (1) As of November 2010. The annual long-term capital spending will be updated in the Fall of 2011.
(2) As of 5/11/11.

AGA - May 2011
5
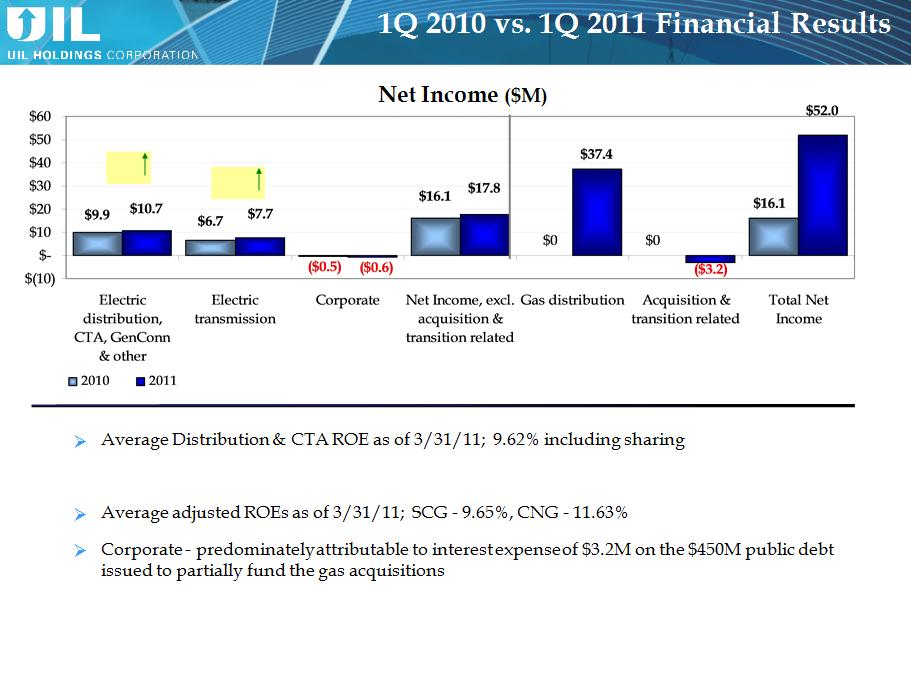
YTD 2011 Highlights
üSolid 1Q ’11 Net Income
Ø Growth in Electric Operations, including GenConn
Ø First full quarter of Gas Operations
üProjected savings from the gas acquisitions are identified
üExit from transition services agreement on schedule
üImplementing plans for growth in gas conversions (heating customers)
üExecuting on capital expenditure plan - realizing rate base growth
üGenConn Middletown expected to be operational in June 2011

AGA - May 2011
6
UIL Becomes A Stronger, More Diverse Energy Company
Gas Operations Integration
Closed on the acquisitions of Southern Connecticut Gas, Connecticut
Natural Gas and Berkshire Gas Company on November 16, 2010
Natural Gas and Berkshire Gas Company on November 16, 2010
Working diligently internalizing the Transition Services Agreement (TSA)
ØSupport services such as IT, Finance and Human Resources provided by
Iberdrola, USA (IUSA) with the ability to terminate any service given 90 days
notice
Iberdrola, USA (IUSA) with the ability to terminate any service given 90 days
notice
Integration activities are well underway
ØImplementation of these initiatives is expected to continue through this year
with most completed before 2012
with most completed before 2012
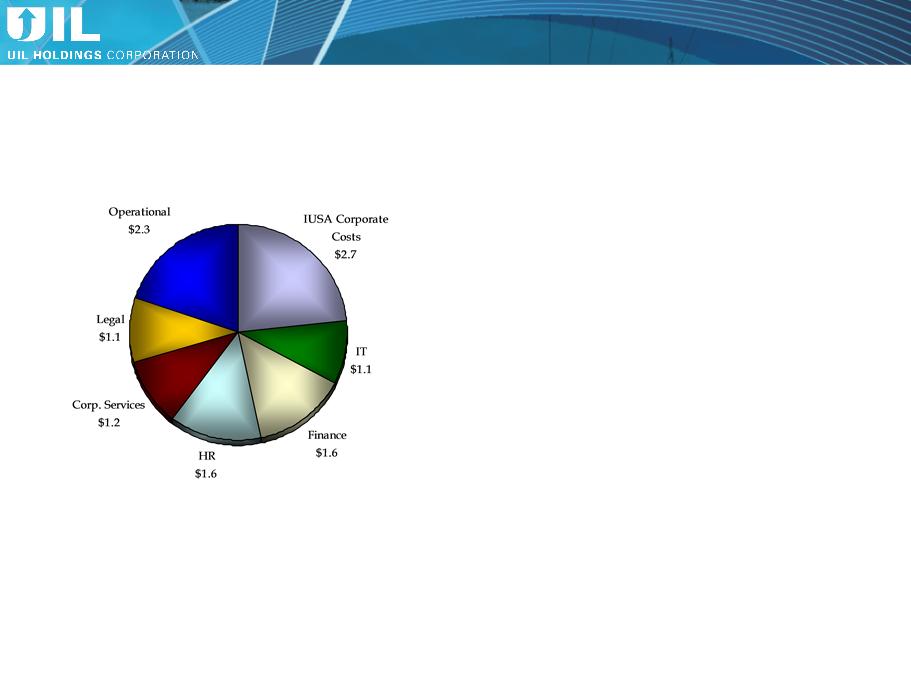
2012 savings opportunities - identified & quantified
ØIUSA 2009 allocated corporate overheads, support costs and shared services
totaled $23M
totaled $23M
› $11.6M of expected savings to be in place in 2012
AGA - May 2011
7
Expected $11.6M of Identified Savings*
Ø Incurring one-time O&M
implementation costs of $3.5M (pre-tax)
implementation costs of $3.5M (pre-tax)
Ø Approximately $18M IT-related
capital costs associated with
implementation
capital costs associated with
implementation
($M)
* To be realized in 2012
Gas Operations
AGA - May 2011
8
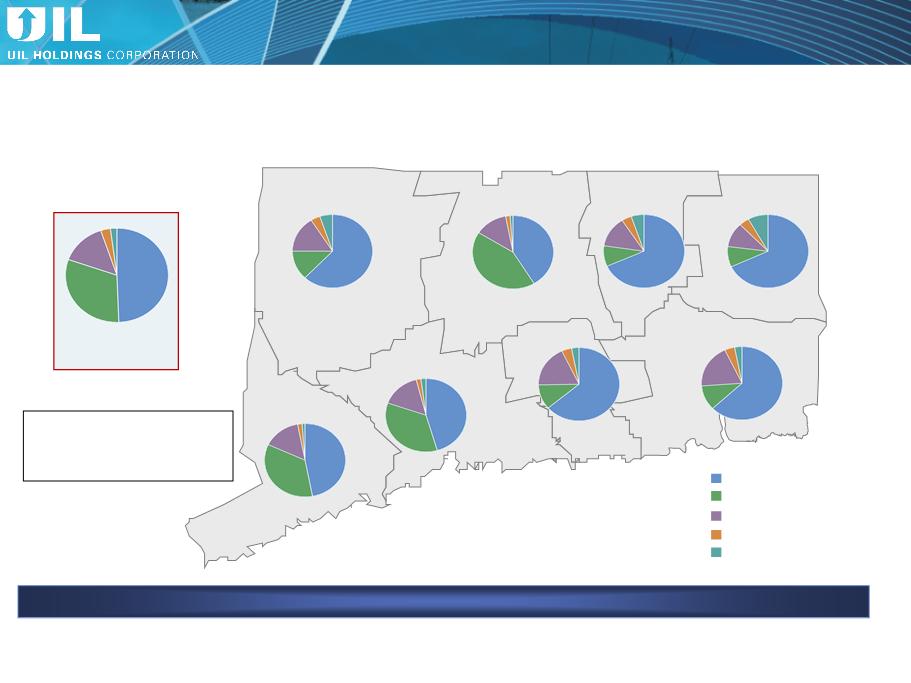
American Community Survey’s selected housing characteristics estimates show a large percentage of
households in Connecticut do not use natural gas for heating
households in Connecticut do not use natural gas for heating
Potential for Gas Heating in CT
Litchfield
62%
13%
16%
4%
5%
Fairfield
47%
35%
15%
2%
1%
Connecticut
50%
31%
15%
2%
1%
New Haven
46%
35%
16%
2%
2%
Middlesex
63%
11%
18%
4%
3%
New London
63%
11%
19%
3%
4%
Windham
68%
9%
11%
8%
4%
Tolland
67%
9%
13%
5%
4%
Hartford
41%
42%
13%
1%
2%
Fuel oil, kerosene
Electricity
Utility gas
Bottled, tank or LP gas
Other¹
Source: U.S. Census Bureau; Average data for 2005-2009
1 Other includes coal or coke, wood, solar, no fuel used and other
# Occupied
housing units:
1,327,482
housing units:
1,327,482
73,704
339,516
52,993
42,653
104,468
65,476
322,752
325,920
(0)
(20)
(6)
(13)
(0)
(3)
(11)
(9)
The # in parentheses represents
the number of cities or towns in
that county that are served by a
UIL Gas Company.
UIL Gas Company.
Approximately 37% of businesses & households on UIL gas mains are not currently natural gas customers

AGA - May 2011
9
Gas Operations
Ø Capitalize on the competitive advantage of natural gas as the economical,
abundant and environmentally friendly fuel of choice for customers
abundant and environmentally friendly fuel of choice for customers
Ø Aggressively pursue new gas heating customers
Ø Generate incremental revenue sufficient to support expanding
infrastructure
infrastructure
Ø 2011 multi-media campaign - launched in April
› Cost savings associated with natural gas use compared to other energy sources

AGA - May 2011
10
(1) Businesses & households
Gas Operations Near-term Growth
Ø Historical customer additions(1) 2009 2010
Heating conversions 5,535 5,728
New construction 901 1,071
Total 6,436 6,799
Ø Targeting 30,000-35,000 additional gas heating customers over the next
3 years
3 years
› ’11 - 25% increase over ‘10 levels
› ’12 - 50% increase over ’10 levels
Ø New customers are anticipated to generate approximately $280-$315
dollars of distribution net operating income per customer
dollars of distribution net operating income per customer
Ø Approx. capital spending (2012-2015) associated with customer additions
› Base - $54M
› Incremental - $52M

AGA - May 2011
11
Electric Operations
Ø On course with aggressive $2.1B UI base capital expenditure plan for 2010-2019
› Distribution - $1.4B
› Transmission - $0.6B
› GenConn equity investment - $0.1B
Ø Investing in Connecticut portion of New England East West Solution projects,
with an investment floor of $60M
with an investment floor of $60M
Ø Continue to seek out other Transmission opportunities in our service territory
and beyond
and beyond
AGA - May 2011
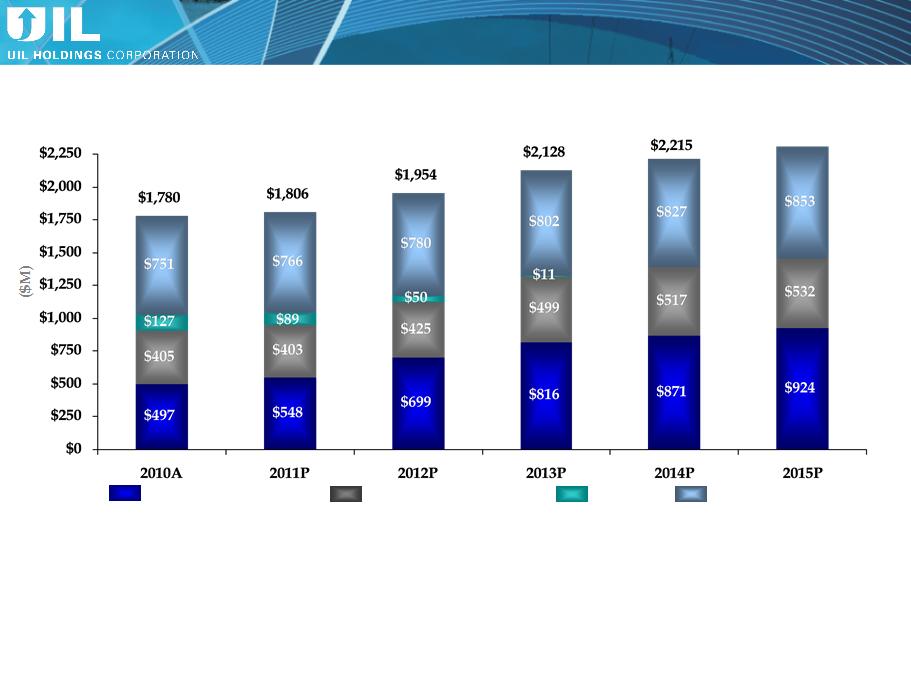
12
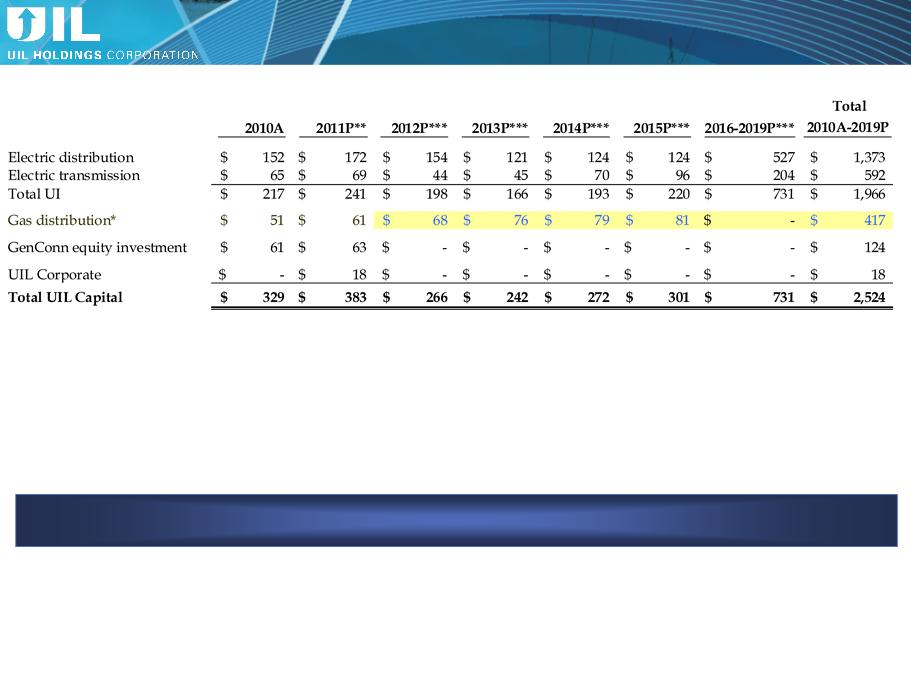
*2010 Gas distribution capex reflects the full year amount; UIL ownership was for 6 weeks effective with the closing on the acquisition.
** Updated - February 23, 2011
*** Information as of November 2010, except for Gas distribution
Amounts may not add due to rounding.
The annual long-term capital spending will be updated in the Fall of 2011.
$M
UIL CapEx Profile - Gas Distribution Update
AGA - May 2011
13
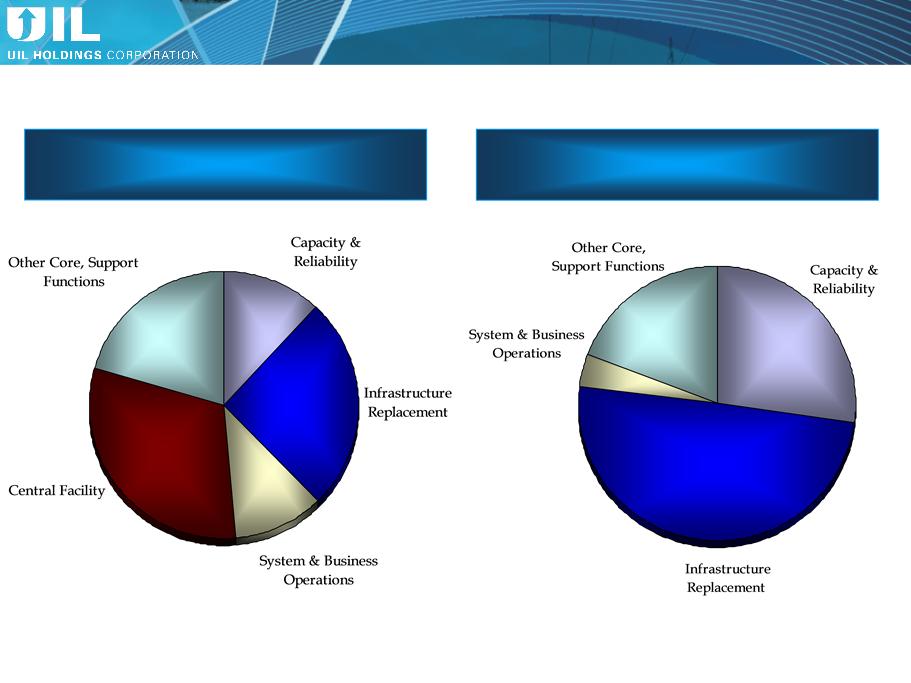
Electric transmission investments
Electric distribution investments
31%
12%
26%
11%
50%
19%
27%
4%
20%
2011 Electric Distribution & Transmission Capex Detail
AGA - May 2011
14
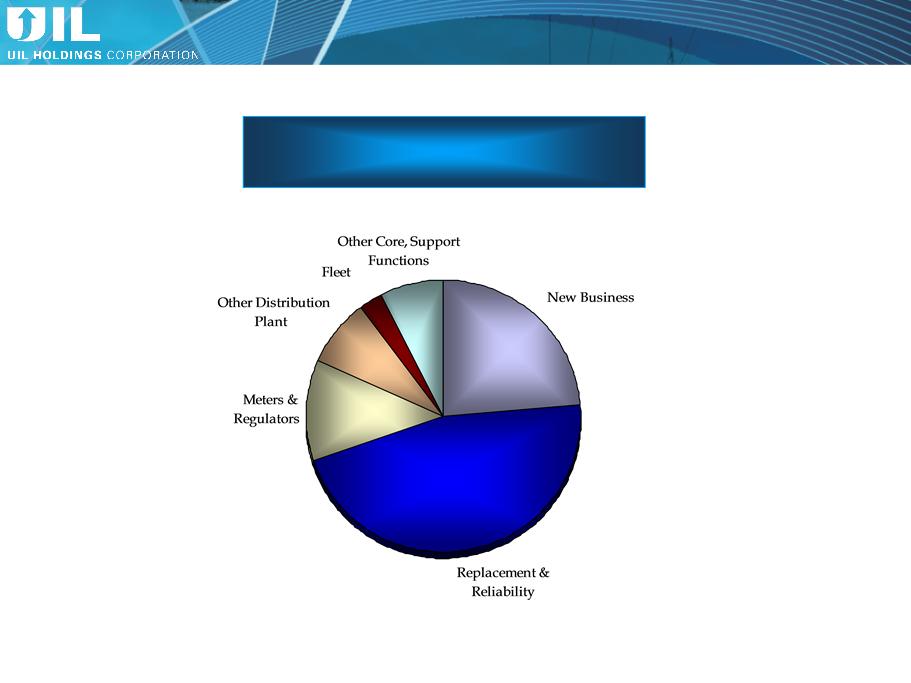
Gas distribution investments
47%
22%
12%
8%
8%
3%
2011 Gas Distribution Capex Detail
AGA - May 2011
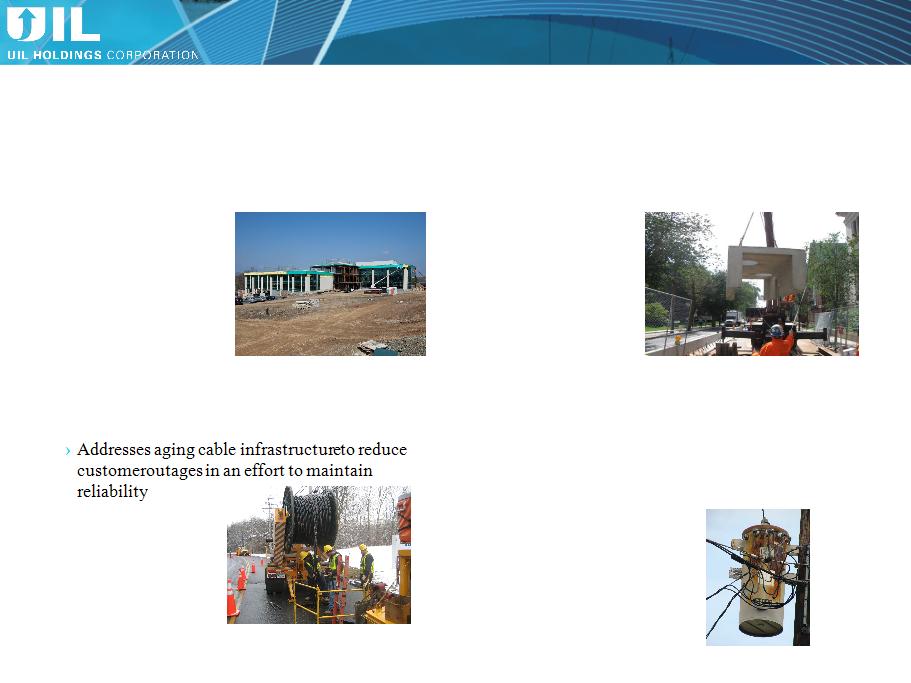
15
Central Facility - UI Office &
Operations Building
Operations Building
Splice Chamber Remediation
Paper Insulated Lead Cable (PILC)
Replacement
Replacement
Distribution Transformer Replacement
Program
Program
› Consolidate all UI “Work Centers” onto a single
site referred to as the Central Facility
site referred to as the Central Facility
› Under construction
› Planned in-service
2012
2012
~ $115M*
› Rebuild deteriorated underground splicing chambers
› Under construction
› Annual program
over 10 years
over 10 years
~ $7M per year
› Under construction
› Annual program
over 10 years
over 10 years
~ $3M per year
› Infrastructure program to replace transformers due
to poor physical condition, inadequate capacity,
and/or contain unacceptable levels of PCB's
to poor physical condition, inadequate capacity,
and/or contain unacceptable levels of PCB's
› Under construction
› Annual program over
10 years
10 years
~ $7M per year
* Dollars shown are rounded/approximate expected total project CapEx (generally including both spend to date and future expected spend).
Examples of Current Distribution Projects
AGA - May 2011
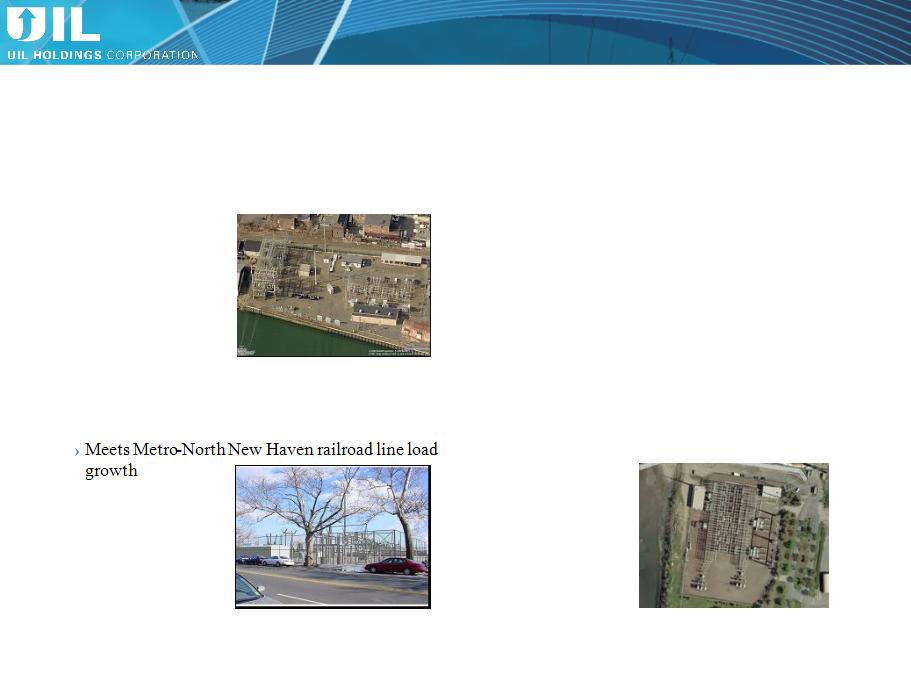
16
Grand Avenue 115 kV Switching
Station Rebuild
Station Rebuild
New Shelton 115/ 13.8 kV
Substation
Substation
New Union Avenue 115/ 26.4 kV
Substation
Substation
East Shore 115 kV Substation Upgrades
› Addresses short circuit capability issues and
aged/obsolete infrastructure
aged/obsolete infrastructure
› Under construction
› Planned in-service
2012
2012
~ $60M*
› Meets Greater Shelton area load growth
› In Planning
› Planned in-service
2015
2015
~ $20M*
› In engineering
› Planned in-service
2012
2012
~ $15M*
› Addresses infrastructure condition, maintenance
short circuit capability concerns
short circuit capability concerns
› Phased upgrades,
in engineering and
construction
in engineering and
construction
› Planned in-service
2011-2013
2011-2013
~ $25M*
* Dollars shown are rounded/approximate expected total project CapEx (generally including both spend to date and future expected spend); excluding AFUDC.
Near-term Electric Transmission Reliability Upgrades
AGA - May 2011
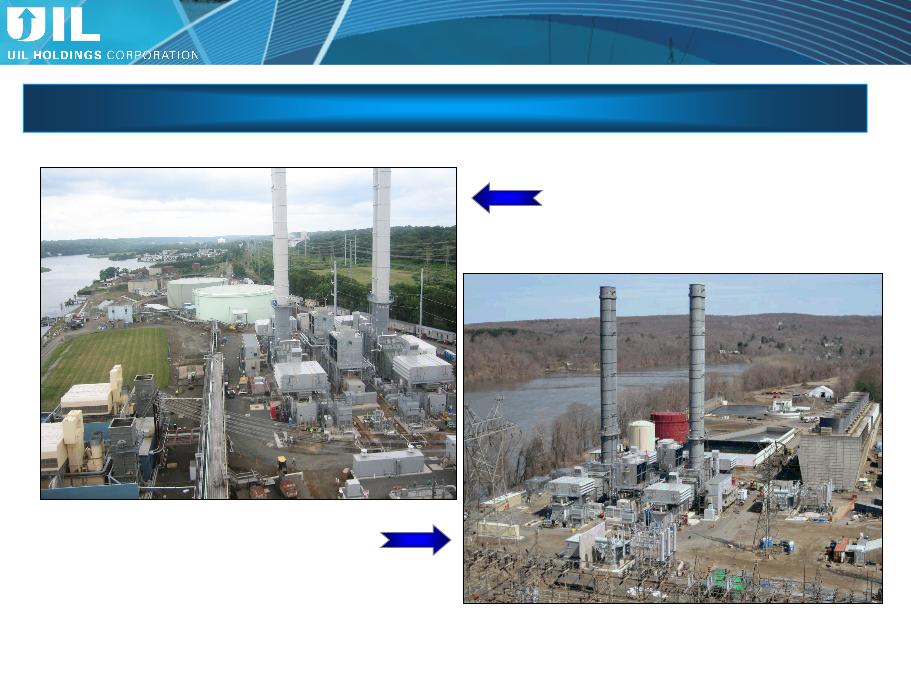
17
Devon Facility
Ø Operating
Ø Contractual requirements met in
September 2010
September 2010
Middletown Facility
Ø 98% complete as of the end of April
Ø Expected to be operational in June 2011
50/50 Joint Venture between UI and NRG
Picture as of 3/31/11
GenConn Energy
AGA - May 2011
18
18
Near-Term Average Rate Base Profile -
Gas Distribution Update
Gas Distribution Update
28%
23%
7%
30%
22%
5%
36%
2%
40%
1%
23%
38%
38%
39%
43%
22%
38%
23%
37%
40%
23%
Electric distribution
CTA
Gas distribution*
Electric transmission
UI’s 50% Share ($M): 2010A 2011P 2012P 2013P 2014P 2015P
Avg. GenConn RB Equivalent: $ 51 $ 143 $ 174 $ 166 $ 158 $ 150
Avg. Gen Conn Equity “Rate Base” $ 25 $ 72 $ 87 $ 83 $ 79 $ 75
Rate Base (Excluding GenConn Equity Investments):
GenConn Equity Investments:
* 2010 Gas distribution average rate base reflects the full year; UIL ownership was for 6 weeks effective with the closing on the acquisition. For comparability purposes, Gas distribution
excludes the impacts of 338(h)(10) election.
excludes the impacts of 338(h)(10) election.
Amounts may not add due to rounding.
42%
$2,309
AGA - May 2011
19
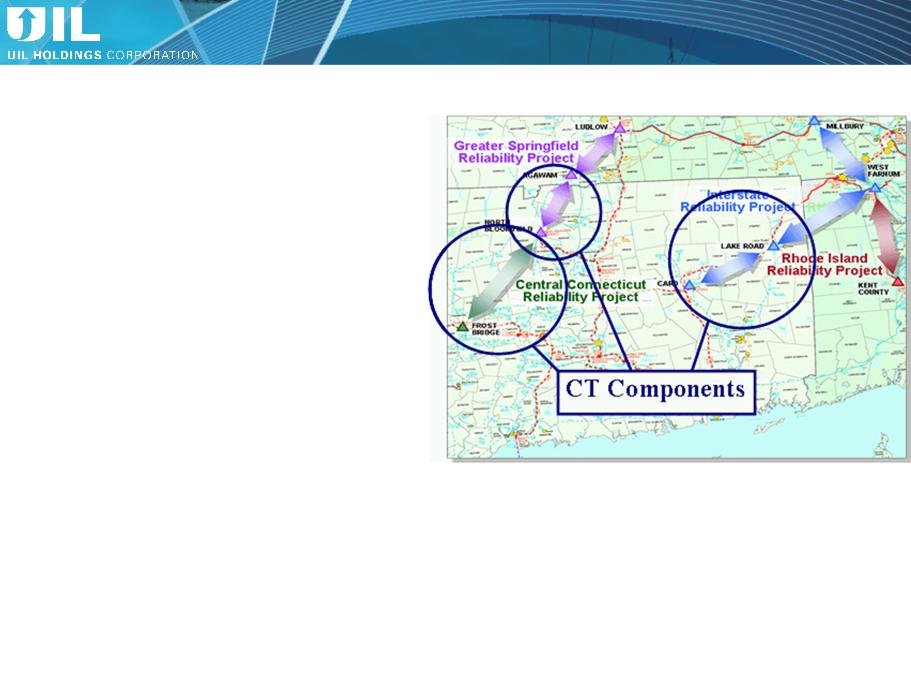
UI Transmission - NEEWS Investment
UI Participation in CL&P Project:
Ø UI’s portion of investment: greater of
$60M* or 8.4% of CL&P’s costs for the
CT portions …
$60M* or 8.4% of CL&P’s costs for the
CT portions …
› Greater Springfield Reliability
Project
Project
› Interstate Reliability Project
› Central CT Reliability Project
Ø UI deposits through May 5, 2011 -
$7.9M
$7.9M
› Remaining investments expected
to be made over a period of 3 to 5
years
to be made over a period of 3 to 5
years
* NU recently informed UI that it will be revising its costs estimate for the CT portion of theses projects. UI will update it projected investment once the
revised estimate is provided by NU.
revised estimate is provided by NU.
AGA - May 2011
20
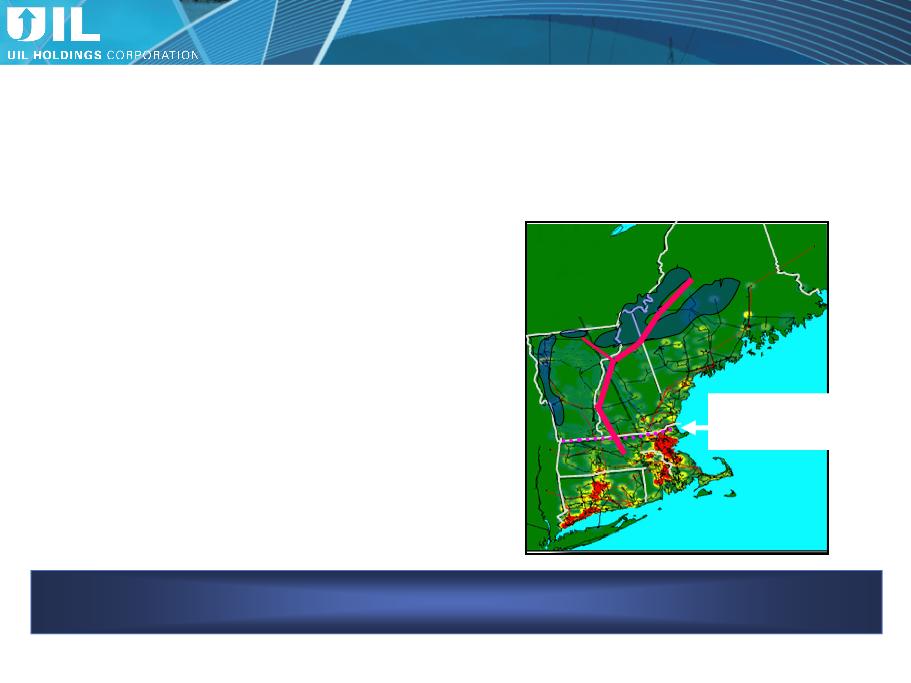
Renewable-Enabling Transmission
20
Collaborative effort: UI, NU, NSTAR and NGrid …
to research / identify the most economical means of satisfying future RPS obligations
Significant Region-Wide Need:
› RPS requirement > 3x current
available renewables*
available renewables*
› CT requirement is > UI’s entire load
› Gap will be filled by renewables
remote from load
remote from load
N.E. Governors’ Blueprint:
› Significant transmission build-out
indicated
indicated
› Potential $7 to $10B range - could be
higher or lower to satisfy a 4,000 to
12,000 MW need
higher or lower to satisfy a 4,000 to
12,000 MW need
› Cost to New England likely much less
than Midwestern wind
than Midwestern wind
Potential Solutions Under Study
› Need will likely be satisfied by a portfolio
of projects
of projects
› One promising example is shown below
* From ISO-NE presentation dated 5/15/09 - driven by 2008 data.
Vast majority of
potential onshore
renewables (wind)
potential onshore
renewables (wind)
are in northern NE
North-South Interface:
80% of NE electric
load is below this line
load is below this line
AGA - May 2011
21
Ø On 3/24/11, CNG, SCG & the OCC filed a motion with
the DPUC to reopen the CNG & SCG rate cases for the
purposes of reviewing and approving a settlement
agreement
the DPUC to reopen the CNG & SCG rate cases for the
purposes of reviewing and approving a settlement
agreement
Ø On 4/13/11, the DPUC reopened the rate cases
Ø If approved by DPUC, the settlement would, among
other things
other things
› resolve all pending issues related to the rate case
appeals
appeals
› terminate the SCG potential overearnings
investigation
investigation
Ø DPUC schedule as of 4/27/11
› Hearings 5/26/11 & 6/9/11
› Draft decision expected 7/20/11, final 8/3/11
|
|
|
|
|
|
SCG Potential Overearnings
Generic ROE Proceeding
UI Electric Decoupling
SCG/CNG Rate Case Appeals
DPUC schedule has not been updated
Ø Filed results of decoupling rider for 2010-2011 on 4/5/11
› Resulted in an over-collection of allowed revenues of
$1.3M
$1.3M
› Company requested continuation of decoupling
mechanism until next rate case decision
mechanism until next rate case decision
Ø On 5/11/11, the DPUC reopened the docket for the limited
purpose of examining UI’s decoupling proposal and
decoupling pilot (DN 08‑07‑04RE03)
purpose of examining UI’s decoupling proposal and
decoupling pilot (DN 08‑07‑04RE03)
Ø Potential for UI to file distribution rate case for rates in effect in 2012 to reflect significant investments
in distribution infrastructure
in distribution infrastructure
Regulatory Update

AGA - May 2011
22
AGA - May 2011
23
Ø GenConn ROE - 9.75%
8%
15%
AGA - May 2011
24
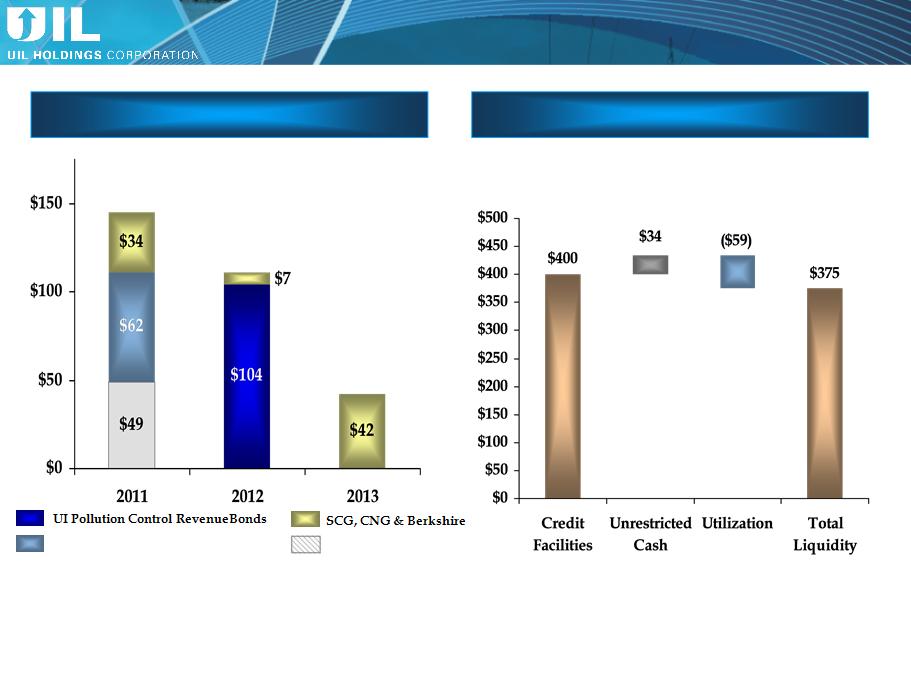
UI Equity Bridge Loan
UIL Debt retired 2/15/11
Liquidity Overview (3/31/11)
Near-Term Debt Maturities
($M)
*
* To be remarketed
Amounts may not add due to rounding.
Based on current plans - expect no need for external equity for at least the next 3 years
($M)
Debt Maturity & Liquidity Profile
AGA - May 2011
25
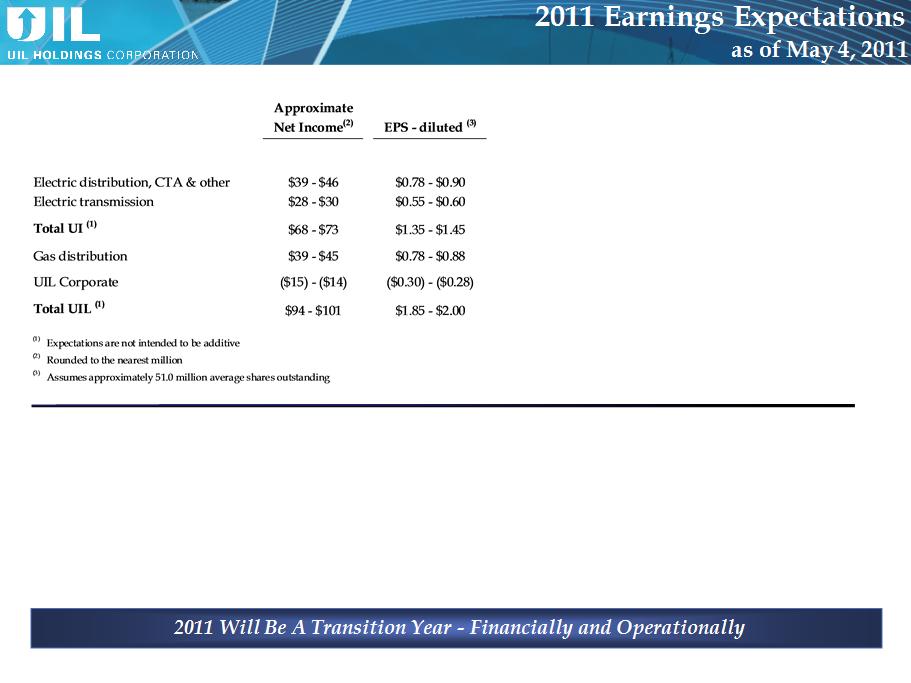
Assumptions
› Regulated businesses are expected to earn the allowed return
on an aggregate basis
on an aggregate basis
› GenConn expected to be fully operational by 6/11 and earn
$0.12-$0.14 per share
$0.12-$0.14 per share
› CTA earnings are expected to decline by $0.07-$0.09 per share
from 2010 as rate base continues to be amortized
from 2010 as rate base continues to be amortized
› Incorporates full year of gas distribution earnings
› Bonus depreciation is expected to have a net impact of ($0.03)-
($0.05) per share
($0.05) per share
› Includes one-time costs for the transition of the gas
distribution business support services from IUSA, as well as
the on-going integration costs
distribution business support services from IUSA, as well as
the on-going integration costs
,
2011
› Integration of all of the regulated businesses with an emphasis on process integration initiatives and best practices
› Exiting the TSA by year-end for vast majority of services
› Positioned to realize half of IUSA’s ‘09 allocated corporate charges of $23M à expected savings of $11.6M in 2012
› Implementing plans for growth in gas conversions
› Execution of capital expenditure plan at each of our regulated businesses
› Continued focus on management of O&M expenses at each of our regulated businesses

AGA - May 2011
26
26
Credit Ratings
Maintenance of investment grade credit ratings is an important objective
|
Issuer
|
S&P
|
Moody’s
|
|
UIL Holdings
|
BBB
(Stable) |
Baa3
(Stable) |
|
United
Illuminating |
BBB
(Stable) |
Baa2
(Stable) |
|
SCG
|
BBB
(Stable) |
Baa2
(Stable) |
|
CNG
|
BBB
(Stable) |
Baa1
(Stable) |
|
Berkshire
|
BBB
(Stable) |
Baa2
(Stable) |

AGA - May 2011
27
Investment Highlights
Attractive Dividend
(5.1% Yield)(2)
› Current annual dividend of $1.728 per share
› Core regulated earnings combined with the enhanced cash flow and expected earnings per
share accretion from the acquisition provide continued support for UIL’s dividend
share accretion from the acquisition provide continued support for UIL’s dividend
Visible Regulated
Growth
Opportunities
Growth
Opportunities
› Approximately $2.1B of regulated electric capital investment in The United Illuminating
Company (UI) 10-year plan (2010-2019)(1)
Company (UI) 10-year plan (2010-2019)(1)
» Includes $0.6B of highly attractive transmission projects
Strong Balance Sheet
› Maintenance of investment grade credit ratings is an important objective
› Based on current plans, expect no need for external equity for at least the next 3 years
FERC-Regulated
Electric
Transmission
Electric
Transmission
› 2010 earned composite return on equity of 12.5%
› Proven ability to partner reaching beyond service territory
› New England renewable portfolio standards driving need for major transmission build
Attractive Regulated
Electric and Gas
Utility
Electric and Gas
Utility
› Proven ability to earn allowed electric returns
› Highly experienced with Connecticut regulatory proceedings
› Constructive long-term rate plan for Berkshire in Massachusetts
Notes: (1) As of November 2010. The annual long-term capital spending will be updated in the Fall of 2011.
(2) As of 5/11/11.

AGA - May 2011
28
Q&A
AGA - May 2011
29
Appendix
AGA - May 2011
30
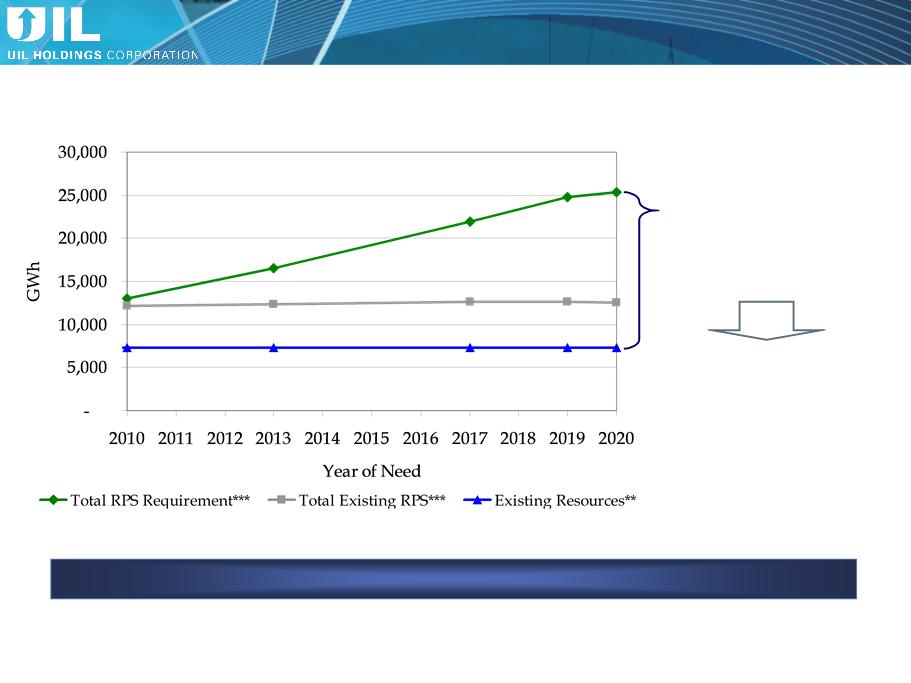
* RPS = Renewable Portfolio Standard.
** From ISO-NE Presentation dated 5/15/09 - driven by 2008 data.
*** From ISO-NE Presentation dated 5/25/10 - “existing” includes RPS obligations through 2009. Total RPS Requirement excludes Vermont renewables, combined heat & power, and energy
efficiency obligations.
efficiency obligations.
Region-Wide
Compliance Gap
Compliance Gap
(v. “existing” renewable resources**)
forecasted/estimated at
~ 18,000GWh
Region-Wide RPS Obligation thru 2020:
› Unlikely to be
satisfied by
renewables currently
in the ISO-NE queue
satisfied by
renewables currently
in the ISO-NE queue
› Will require
significant additional
transmission
significant additional
transmission
Satisfaction will likely require significant new transmission in the region.
Region-Wide RPS* Obligations
AGA - May 2011
31
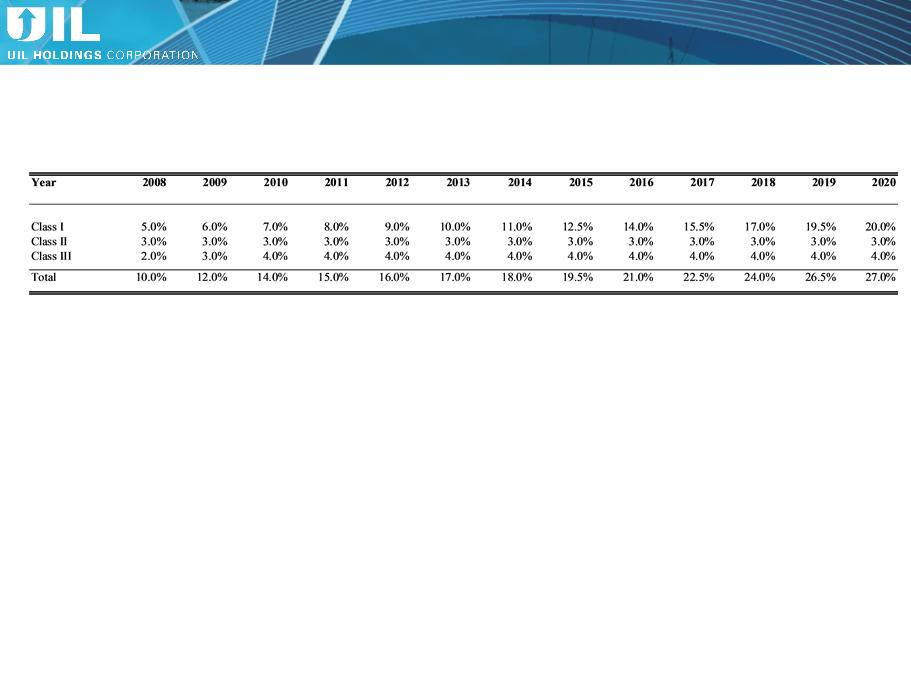
Connecticut RPS Requirements
(Percentage of Retail Load)
Class I resources include energy derived from solar, wind, fuel cell, methane gas from landfills, ocean thermal, wave,
tidal, run-of-river hydropower (<5MW, began operation after July 1, 2003), sustainable biomass (NOx emission <0.075
lbs/MMBtu of heat input)
tidal, run-of-river hydropower (<5MW, began operation after July 1, 2003), sustainable biomass (NOx emission <0.075
lbs/MMBtu of heat input)
Class II resources include other biomass (NOx emission <0.2 lbs/MMBtu of heat input, began operation before July 1,
1998), small run-of-river hydroelectric (<5MW, began operation before July 1, 2003) and municipal solid waste trash-to-
energy facilities
1998), small run-of-river hydroelectric (<5MW, began operation before July 1, 2003) and municipal solid waste trash-to-
energy facilities
Class III include customer-sited combined heat and power (with operating efficiency >50% of facilities installed after
January 1, 2006), waste heat recovery systems (installed on or after April 1, 2007), electricity savings from conservation
and load management programs (began on or after January 1, 2006)
January 1, 2006), waste heat recovery systems (installed on or after April 1, 2007), electricity savings from conservation
and load management programs (began on or after January 1, 2006)
CT RPS Requirements
AGA - May 2011
32
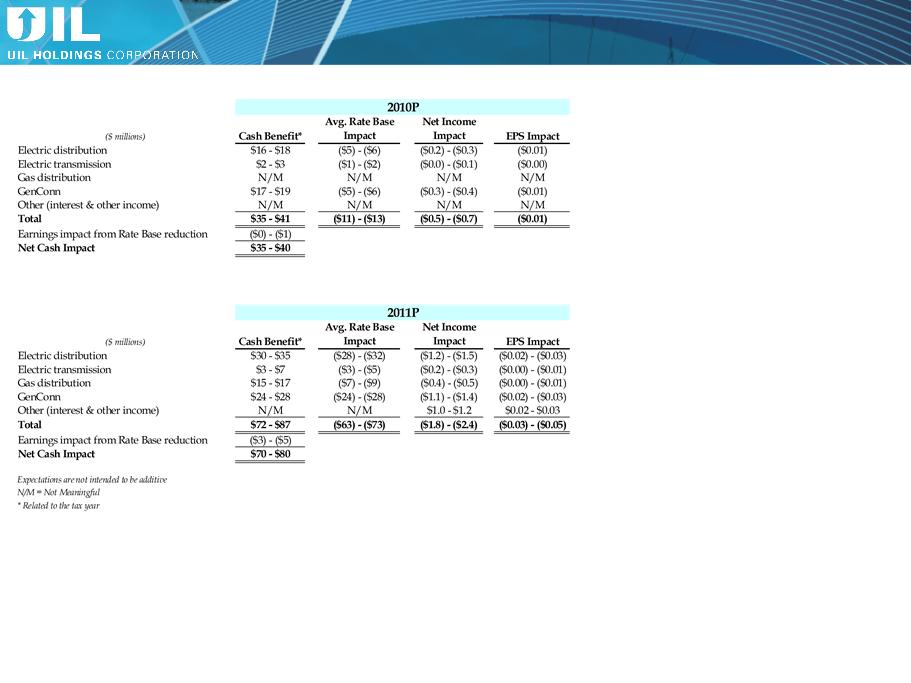
Efficient use of cash benefits from
bonus depreciation
bonus depreciation
Ø Expected pension contributions of
approximately $73M to the electric &
gas pension plans in 2011
approximately $73M to the electric &
gas pension plans in 2011
› $52.2M already contributed during
1Q ‘11
1Q ‘11
Ø Reduces pension costs and increases
rate base
rate base
Based on current plans, expect no
need for external equity for at least
the next 3 years
need for external equity for at least
the next 3 years
Expected Impacts of Bonus Depreciation - ‘10 & ‘11
Based on Current Expectations
Based on Current Expectations
AGA - May 2011
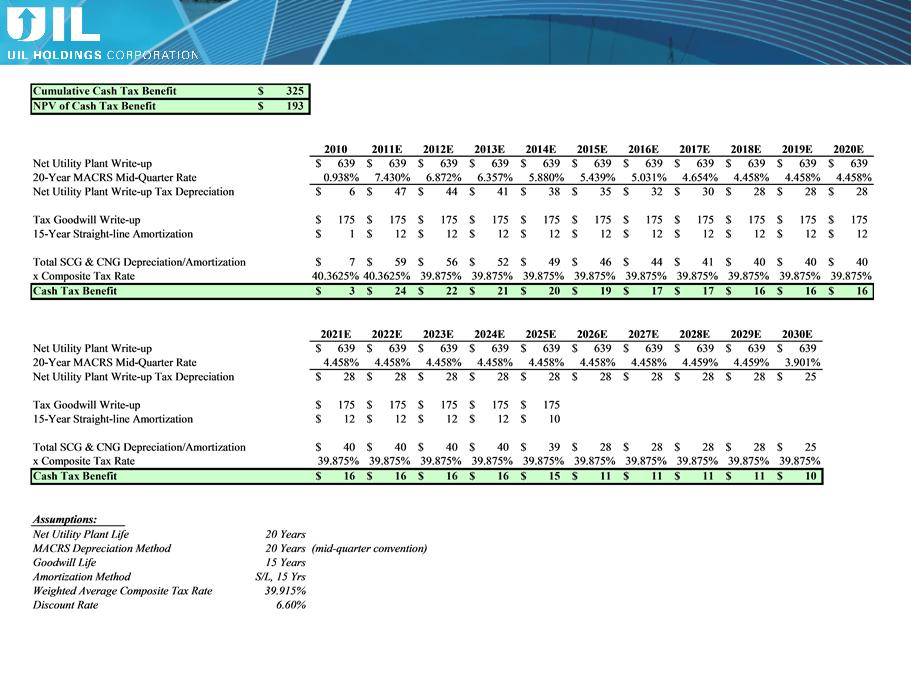
33
Final 338(h)(10) Cash Value ($M)