Attached files
| file | filename |
|---|---|
| 8-K/A - FORM 8-K/A - FLAGSTAR BANCORP INC | k50404e8vkza.htm |
Exhibit
99.1
| Earnings Presentation First Quarter 2011 April 27, 2011 Presenters: Joseph P. Campanelli Chief Executive Officer Paul D. Borja Chief Financial Officer |
| 2 The information contained in this presentation is not intended as a solicitation to buy Flagstar Bancorp, Inc. stock and is provided for general information. This presentation may include forward-looking statements and include comments with respect to our objectives and strategies, and the results of our operations and our business. Forward-looking statements can be identified by the fact that they do not relate strictly to historical or current facts. They often include words such as "expects," "assumes," "anticipates," "intends," "plans," "believes," "seeks," "estimates" or words of similar meaning, or future or conditional words such as "assuming," "will," "would," "possible," "proposed," "projected," "positioned," "vision," "opportunity," "should," "could," "indicative," "target" or "may." Forward-looking statements provide our expectations or predictions of future conditions, events or results. They are not guarantees of future performance. By their nature, these forward-looking statements involve numerous assumptions, uncertainties and opportunities, both general and specific. These statements speak only as of the date they are made. We do not undertake to update forward-looking statements to reflect the impact of circumstances or events that arise after the date the forward-looking statements were made. There a number of factors, many of which are beyond our control that could cause actual conditions, events or results to differ significantly from those described in the forward looking statements. Some of these are: Volatile interest rates that impact, amongst other things, (i) the mortgage banking business, (ii) our ability to originate loans and sell assets at a profit, (iii) prepayment speeds and (iv) our cost of funds, could adversely affect earnings, growth opportunities and our ability to pay dividends to shareholders. Our ability to maintain capital levels. Competitive factors for loans could negatively impact gain on loan sale margins. Competition from banking and non-banking companies for deposits and loans can affect our growth opportunities, earnings, gain on sale margins, market share and ability to transform business model. Changes in the regulation of financial services companies and government-sponsored housing enterprises, and in particular, declines in the liquidity of the mortgage loan secondary market, could adversely affect business. Changes in regulatory capital requirements or an inability to achieve desired capital ratios could adversely affect our growth and earnings opportunities and our ability to originate certain types of loans, as well as our ability to sell certain types of assets for fair market value or to transform business model. - General business and economic conditions, including unemployment rates, further movements in interest rates, the slope of the yield curve, any increase in fraud and other criminal activity and the further decline of asset values in certain geographic markets, may significantly affect the company's business activities, loan losses, reserves, earnings and business prospects. - Factors concerning the implementation of proposed enhancements and transformation of business model could result in slower implementation times than we anticipate and negate any competitive advantage that we may enjoy. When relying on forward-looking statements to make decisions, investors should carefully consider the aforementioned factors as well as other uncertainties and events. Legal Disclaimer |
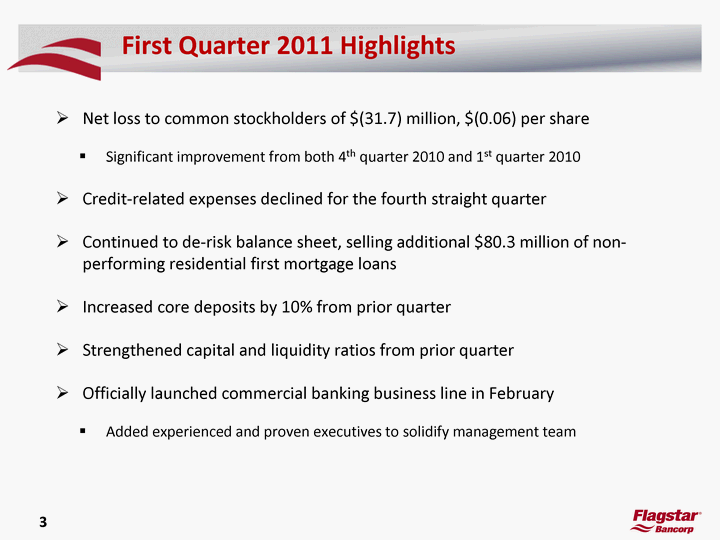
| 3 First Quarter 2011 Highlights Net loss to common stockholders of $(31.7) million, $(0.06) per share Significant improvement from both 4th quarter 2010 and 1st quarter 2010 Credit-related expenses declined for the fourth straight quarter Continued to de-risk balance sheet, selling additional $80.3 million of non- performing residential first mortgage loans Increased core deposits by 10% from prior quarter Strengthened capital and liquidity ratios from prior quarter Officially launched commercial banking business line in February Added experienced and proven executives to solidify management team |
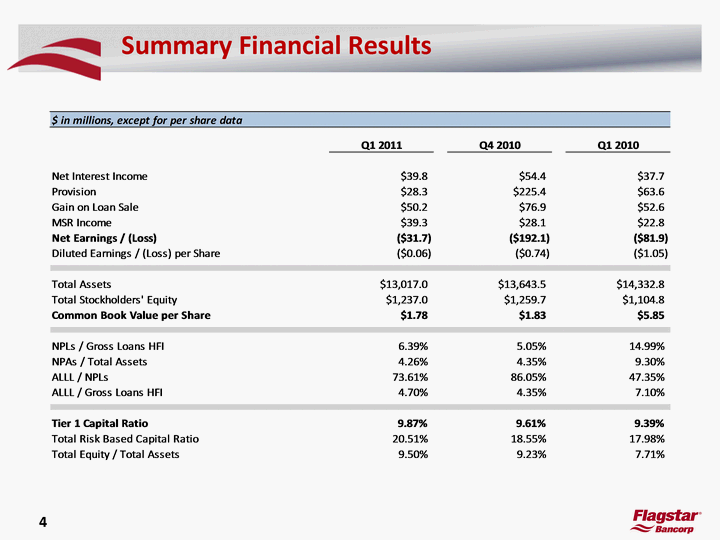
| 4 Summary Financial Results |
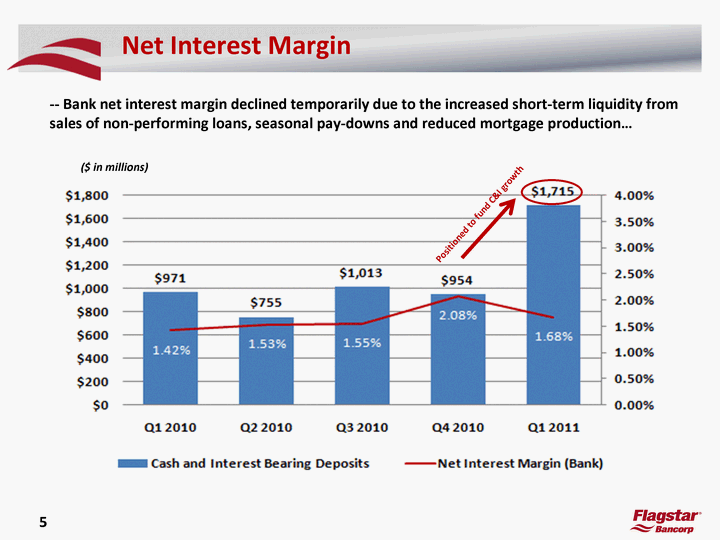
| 5 Net Interest Margin ($ in millions) -- Bank net interest margin declined temporarily due to the increased short-term liquidity from sales of non-performing loans, seasonal pay-downs and reduced mortgage production... Positioned to fund C&I growth |
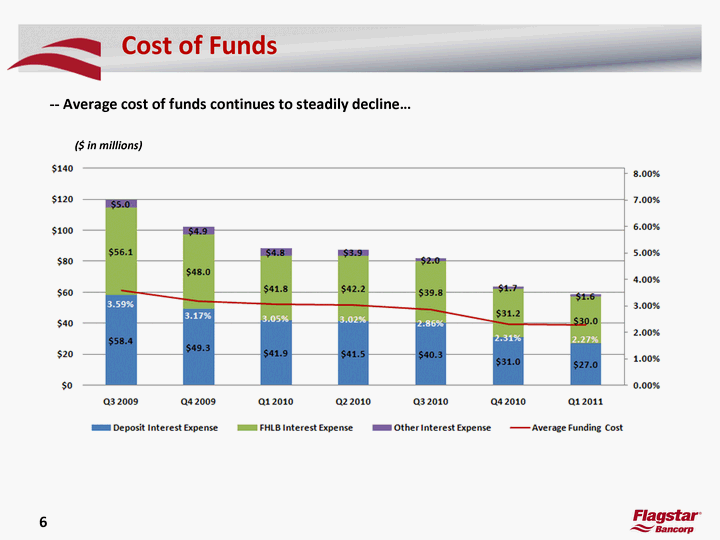
| 6 Cost of Funds ($ in millions) -- Average cost of funds continues to steadily decline... |
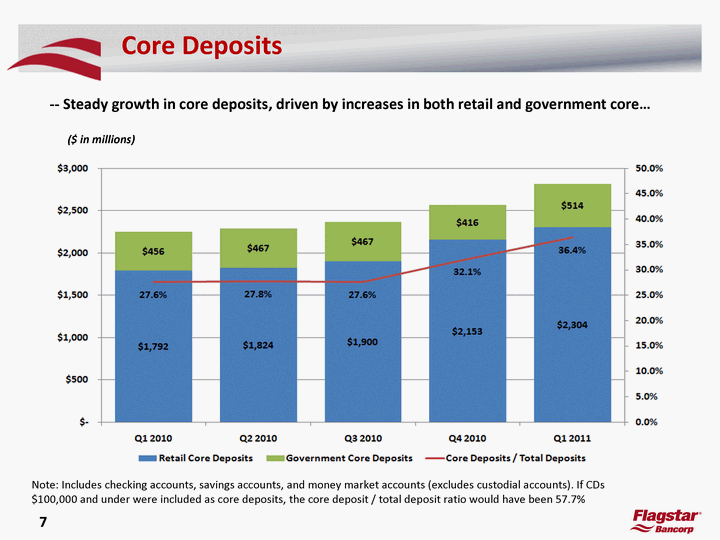
| 7 Core Deposits -- Steady growth in core deposits, driven by increases in both retail and government core... Note: Includes checking accounts, savings accounts, and money market accounts (excludes custodial accounts). If CDs $100,000 and under were included as core deposits, the core deposit / total deposit ratio would have been 57.7% ($ in millions) |
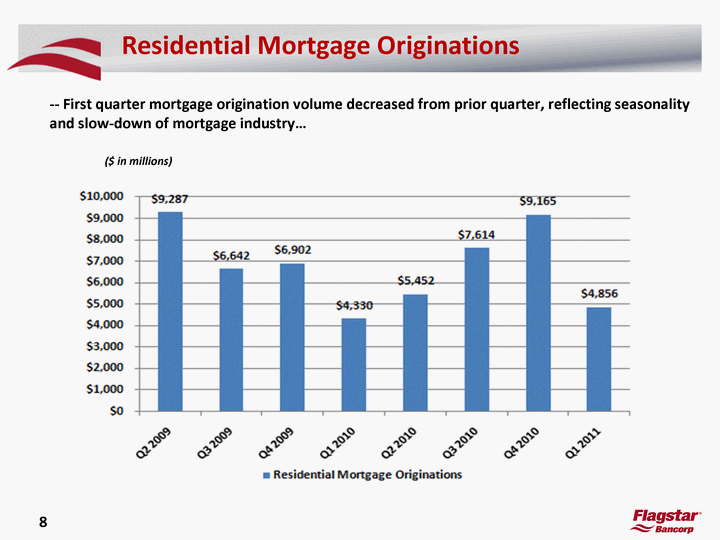
| 8 Residential Mortgage Originations ($ in millions) -- First quarter mortgage origination volume decreased from prior quarter, reflecting seasonality and slow-down of mortgage industry... |
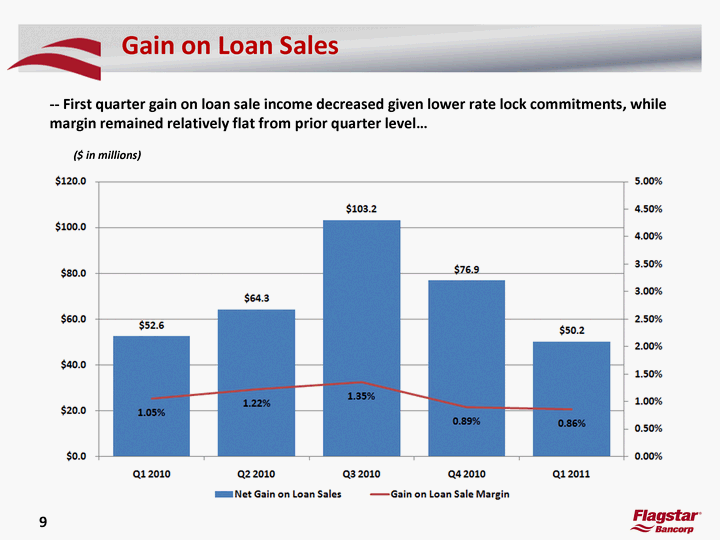
| 9 Gain on Loan Sales -- First quarter gain on loan sale income decreased given lower rate lock commitments, while margin remained relatively flat from prior quarter level... ($ in millions) |
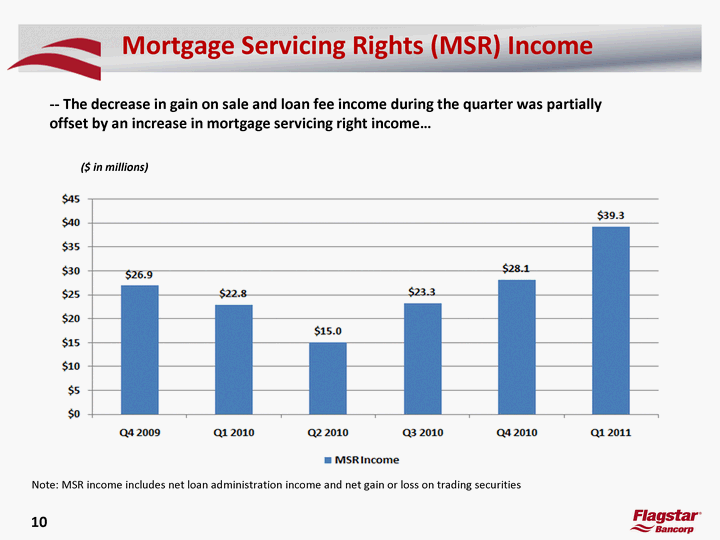
| 10 Mortgage Servicing Rights (MSR) Income -- The decrease in gain on sale and loan fee income during the quarter was partially offset by an increase in mortgage servicing right income... ($ in millions) Note: MSR income includes net loan administration income and net gain or loss on trading securities |
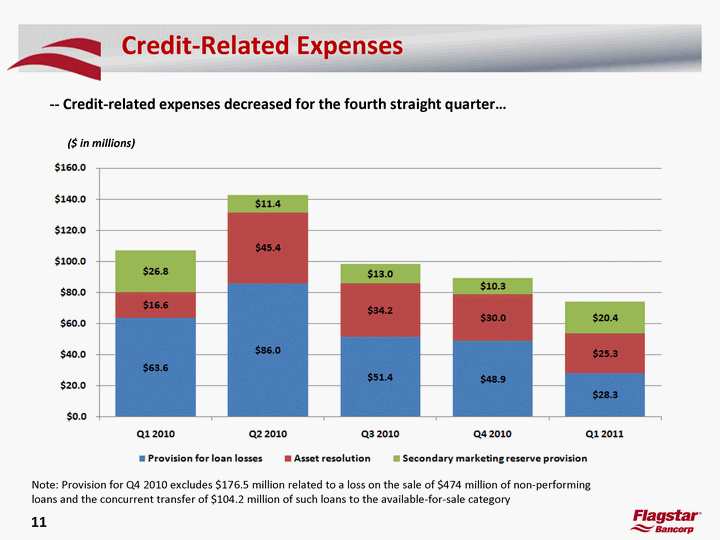
| 11 Credit-Related Expenses -- Credit-related expenses decreased for the fourth straight quarter... ($ in millions) Note: Provision for Q4 2010 excludes $176.5 million related to a loss on the sale of $474 million of non-performing loans and the concurrent transfer of $104.2 million of such loans to the available-for-sale category |
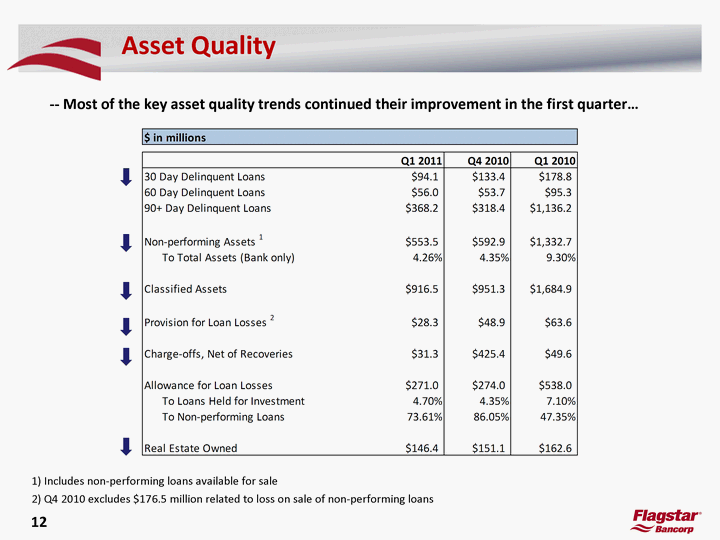
| 12 Asset Quality -- Most of the key asset quality trends continued their improvement in the first quarter... 1) Includes non-performing loans available for sale 2) Q4 2010 excludes $176.5 million related to loss on sale of non-performing loans |
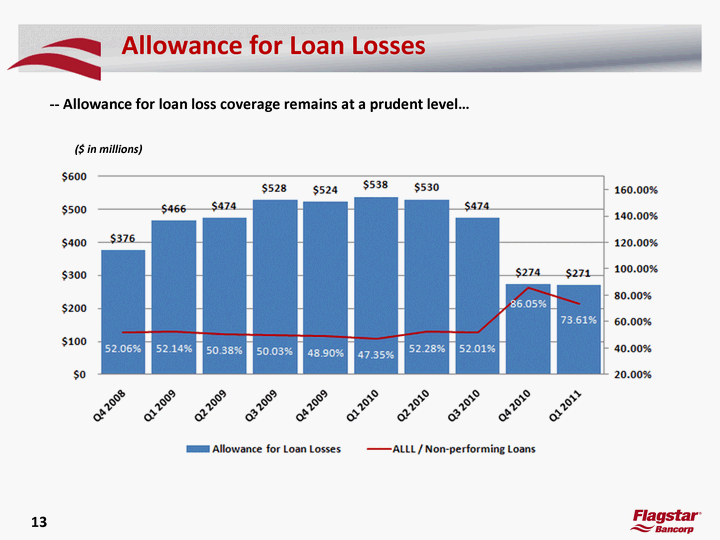
| 13 Allowance for Loan Losses ($ in millions) -- Allowance for loan loss coverage remains at a prudent level... |
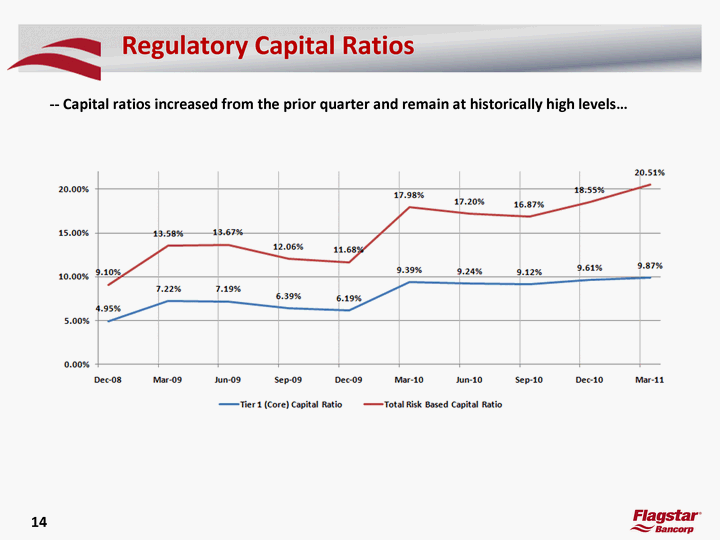
| 14 Regulatory Capital Ratios -- Capital ratios increased from the prior quarter and remain at historically high levels... |
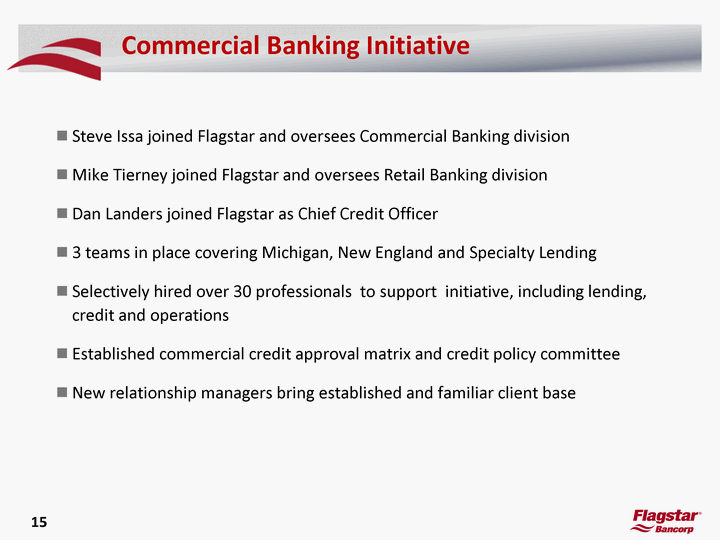
| 15 Commercial Banking Initiative Steve Issa joined Flagstar and oversees Commercial Banking division Mike Tierney joined Flagstar and oversees Retail Banking division Dan Landers joined Flagstar as Chief Credit Officer 3 teams in place covering Michigan, New England and Specialty Lending Selectively hired over 30 professionals to support initiative, including lending, credit and operations Established commercial credit approval matrix and credit policy committee New relationship managers bring established and familiar client base |
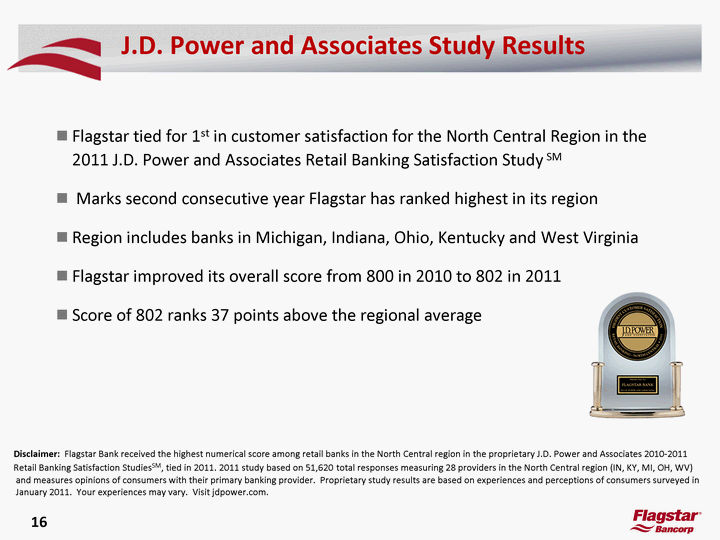
| 16 J.D. Power and Associates Study Results Flagstar tied for 1st in customer satisfaction for the North Central Region in the 2011 J.D. Power and Associates Retail Banking Satisfaction Study SM Marks second consecutive year Flagstar has ranked highest in its region Region includes banks in Michigan, Indiana, Ohio, Kentucky and West Virginia Flagstar improved its overall score from 800 in 2010 to 802 in 2011 Score of 802 ranks 37 points above the regional average Disclaimer: Flagstar Bank received the highest numerical score among retail banks in the North Central region in the proprietary J.D. Power and Associates 2010-2011 Retail Banking Satisfaction StudiesSM, tied in 2011. 2011 study based on 51,620 total responses measuring 28 providers in the North Central region (IN, KY, MI, OH, WV) and measures opinions of consumers with their primary banking provider. Proprietary study results are based on experiences and perceptions of consumers surveyed in January 2011. Your experiences may vary. Visit jdpower.com. |
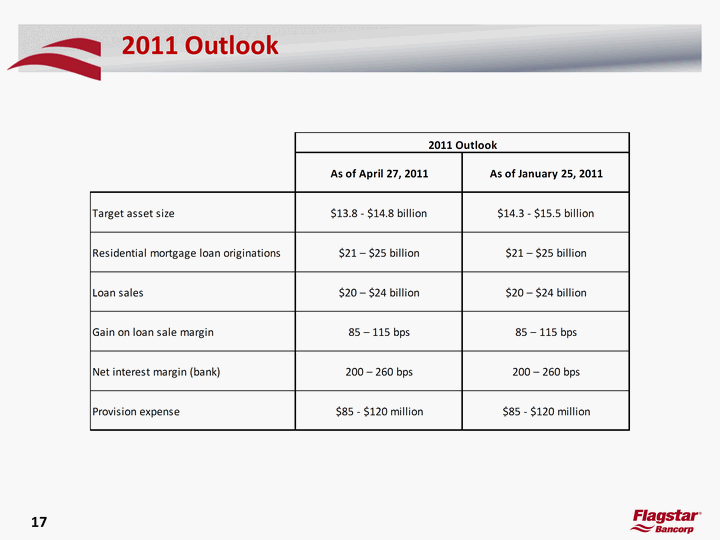
| 17 2011 Outlook |
| Appendix |
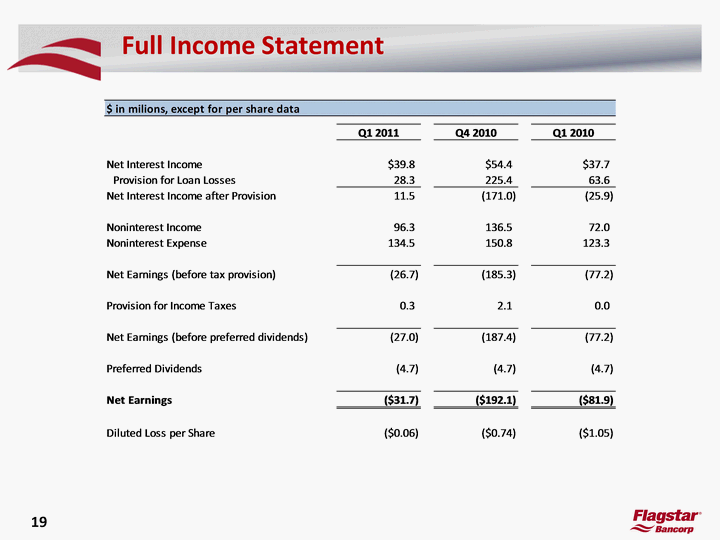
| 19 Full Income Statement |
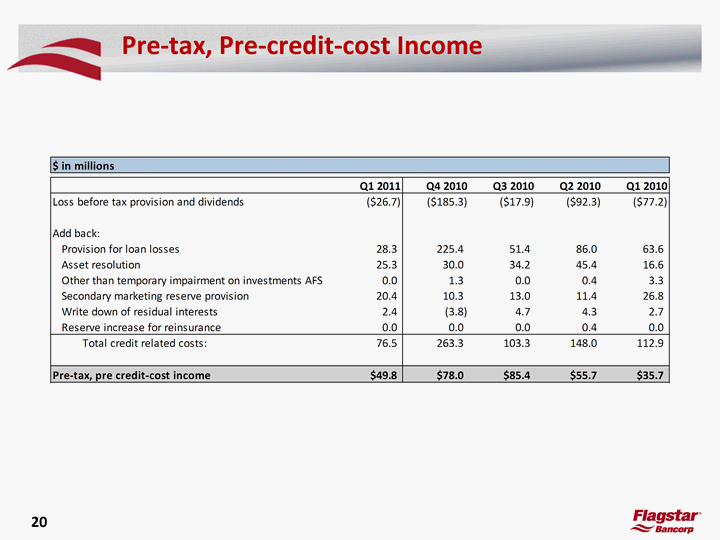
| 20 Pre-tax, Pre-credit-cost Income |
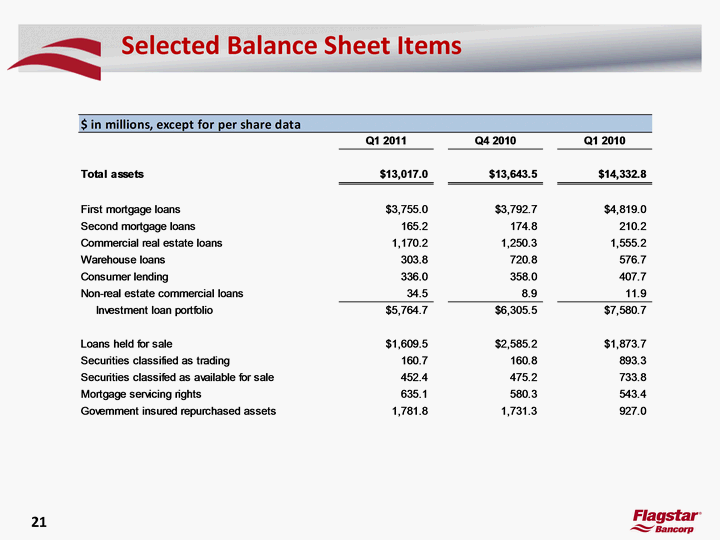
| 21 Selected Balance Sheet Items |
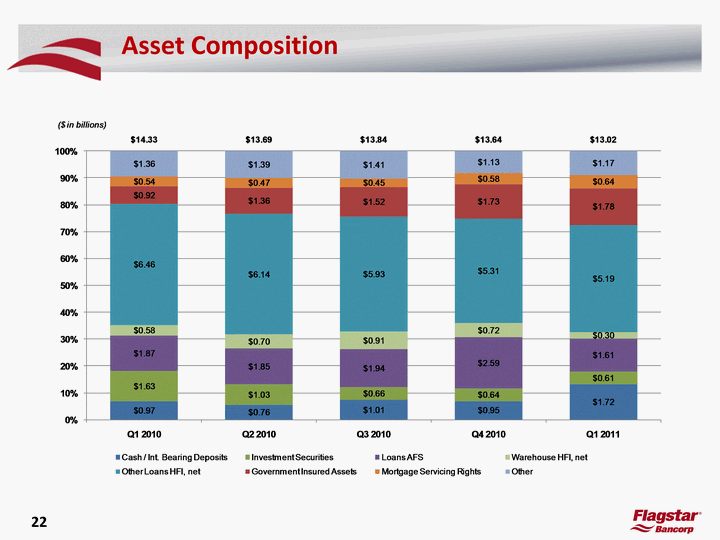
| 22 Asset Composition |
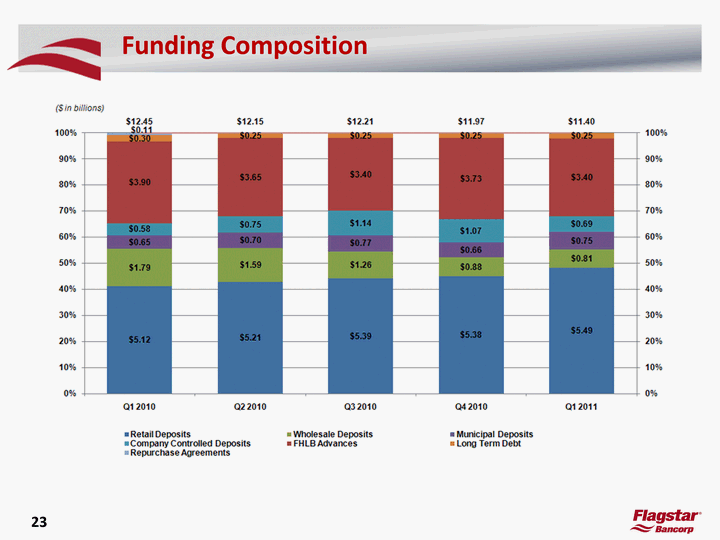
| 23 Funding Composition ($ in billions) |
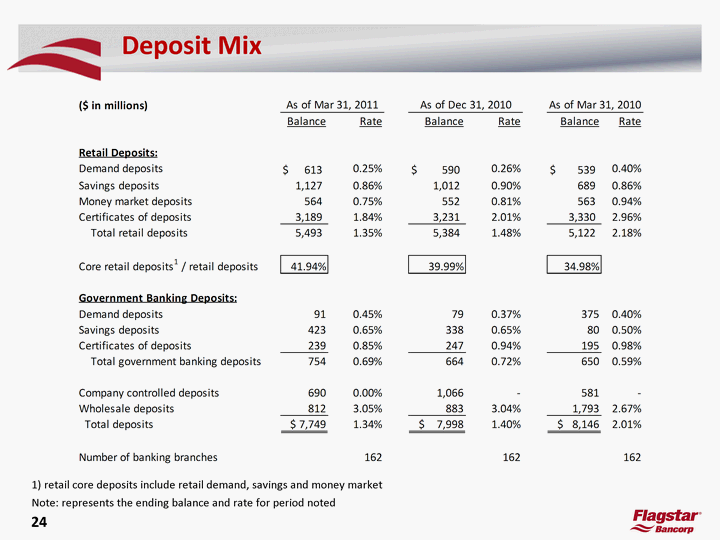
| 24 Deposit Mix Note: represents the ending balance and rate for period noted 1) retail core deposits include retail demand, savings and money market |
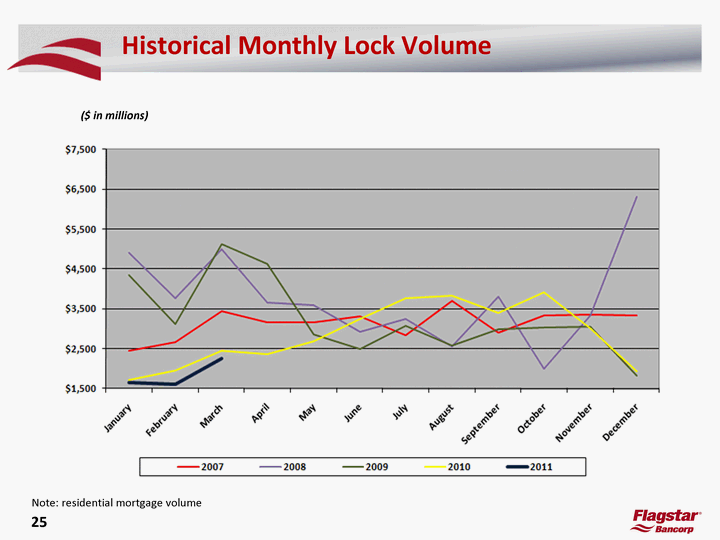
| 25 Historical Monthly Lock Volume ($ in millions) Note: residential mortgage volume |
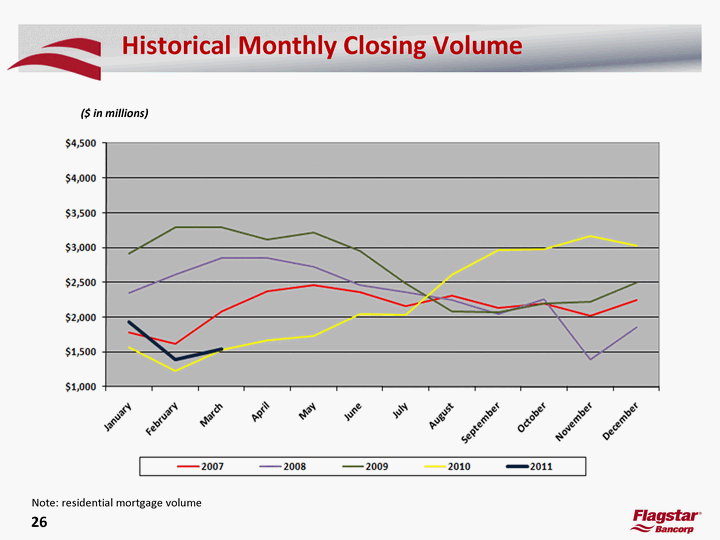
| 26 Historical Monthly Closing Volume ($ in millions) Note: residential mortgage volume |
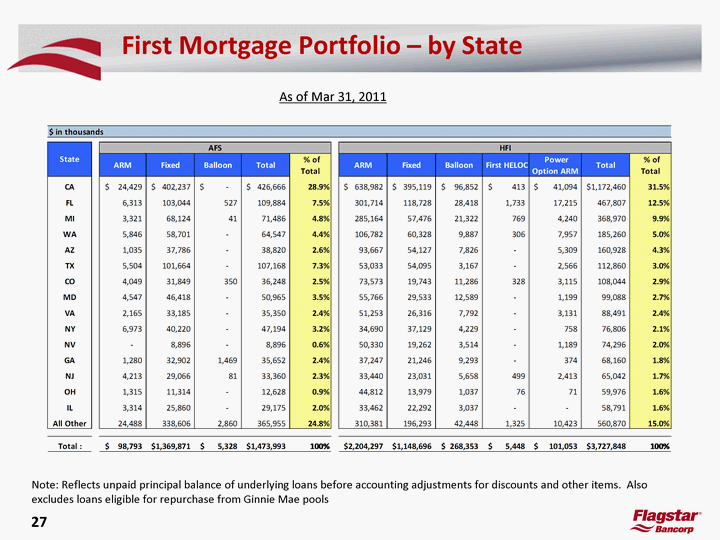
| 27 First Mortgage Portfolio - by State Note: Reflects unpaid principal balance of underlying loans before accounting adjustments for discounts and other items. Also excludes loans eligible for repurchase from Ginnie Mae pools As of Mar 31, 2011 |
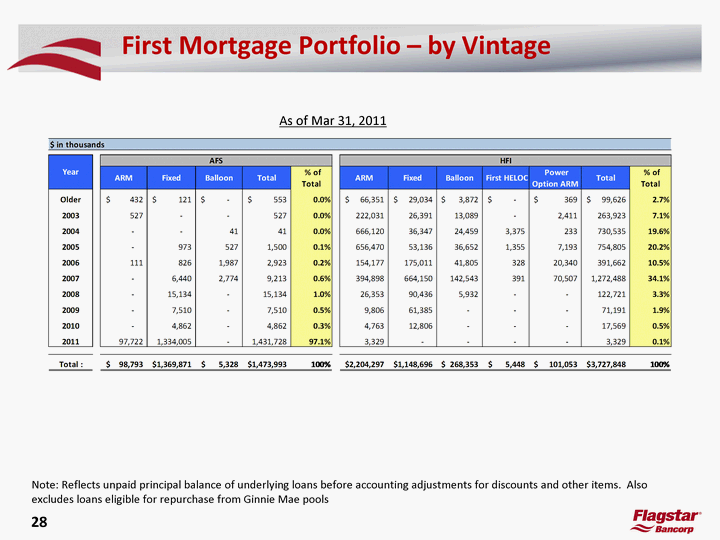
| 28 First Mortgage Portfolio - by Vintage Note: Reflects unpaid principal balance of underlying loans before accounting adjustments for discounts and other items. Also excludes loans eligible for repurchase from Ginnie Mae pools As of Mar 31, 2011 |
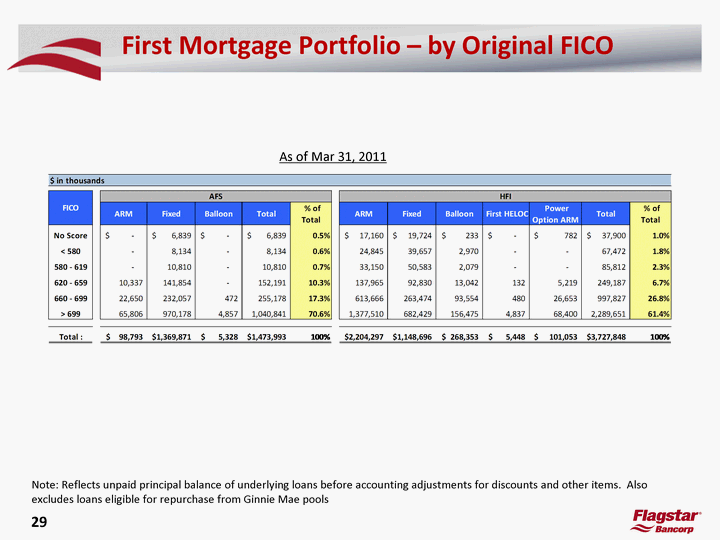
| 29 First Mortgage Portfolio - by Original FICO Note: Reflects unpaid principal balance of underlying loans before accounting adjustments for discounts and other items. Also excludes loans eligible for repurchase from Ginnie Mae pools As of Mar 31, 2011 |
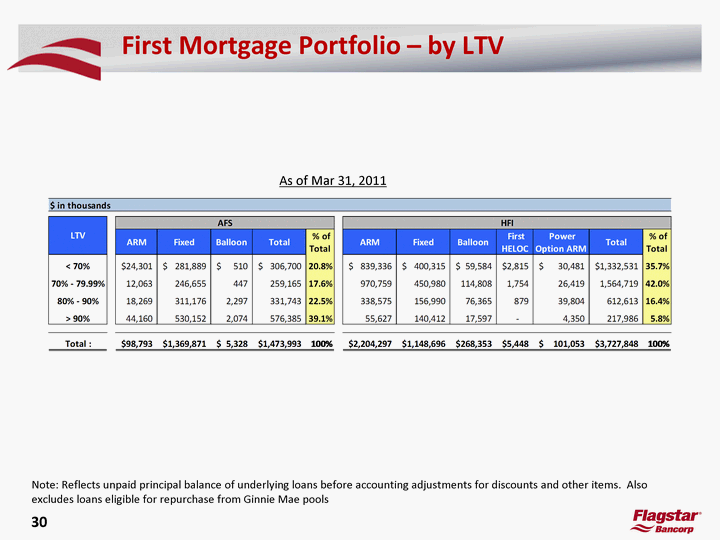
| 30 First Mortgage Portfolio - by LTV Note: Reflects unpaid principal balance of underlying loans before accounting adjustments for discounts and other items. Also excludes loans eligible for repurchase from Ginnie Mae pools As of Mar 31, 2011 |
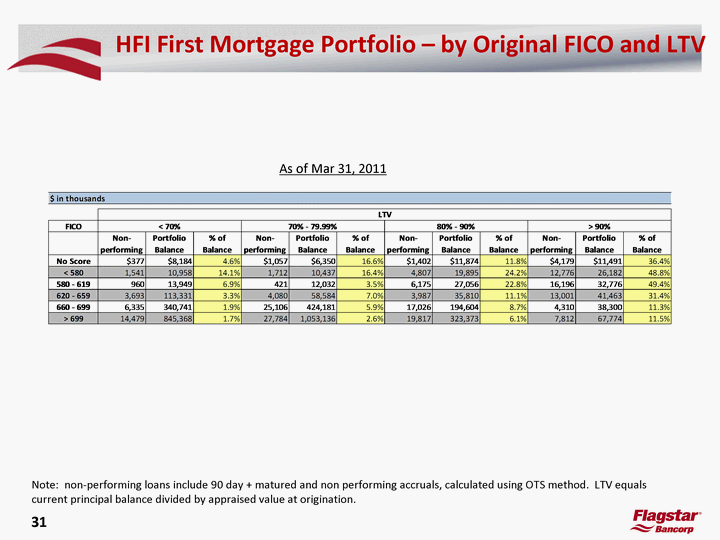
| 31 HFI First Mortgage Portfolio - by Original FICO and LTV Note: non-performing loans include 90 day + matured and non performing accruals, calculated using OTS method. LTV equals current principal balance divided by appraised value at origination. As of Mar 31, 2011 |
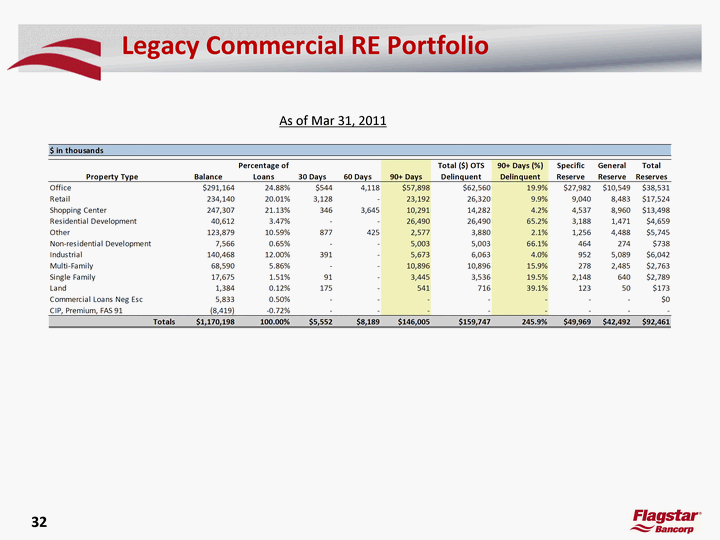
| 32 Legacy Commercial RE Portfolio As of Mar 31, 2011 |
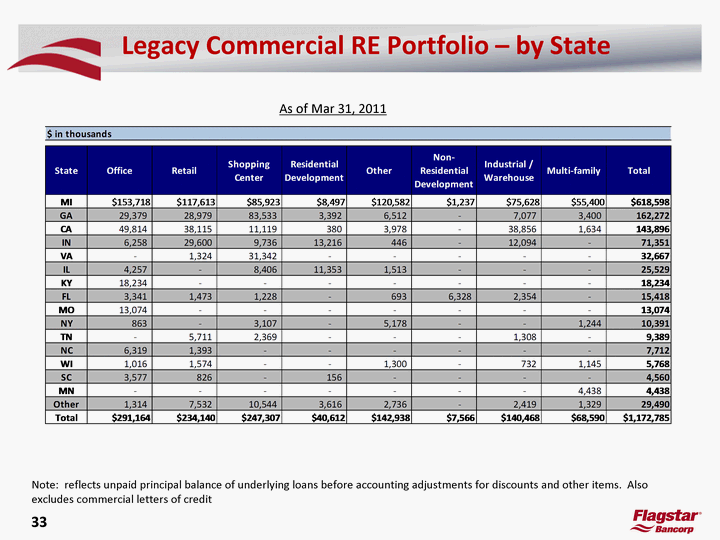
| 33 Legacy Commercial RE Portfolio - by State As of Mar 31, 2011 Note: reflects unpaid principal balance of underlying loans before accounting adjustments for discounts and other items. Also excludes commercial letters of credit |
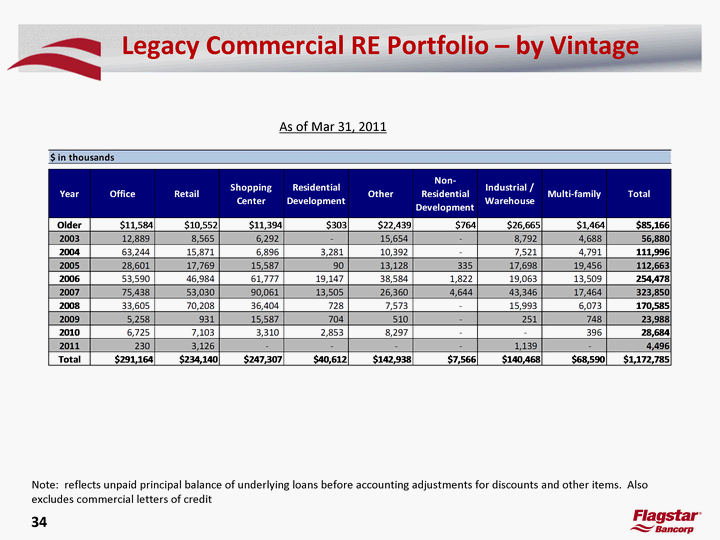
| 34 Legacy Commercial RE Portfolio - by Vintage As of Mar 31, 2011 Note: reflects unpaid principal balance of underlying loans before accounting adjustments for discounts and other items. Also excludes commercial letters of credit |
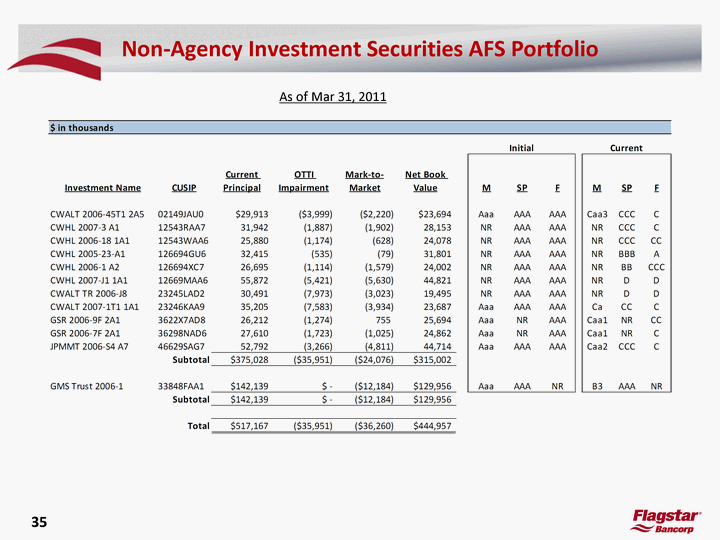
| 35 Non-Agency Investment Securities AFS Portfolio As of Mar 31, 2011 |
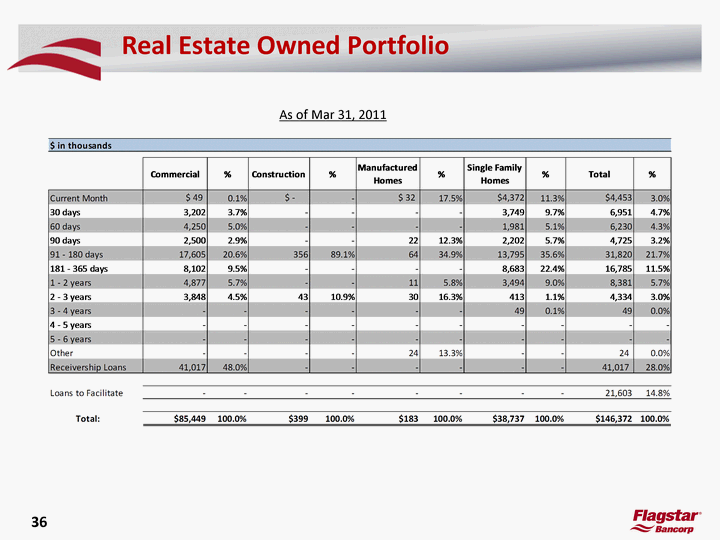
| 36 Real Estate Owned Portfolio As of Mar 31, 2011 |
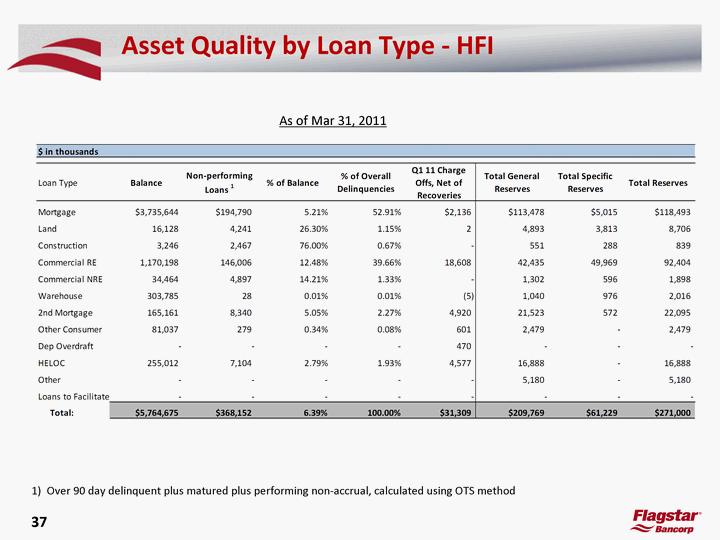
| 37 Asset Quality by Loan Type - HFI 1) Over 90 day delinquent plus matured plus performing non-accrual, calculated using OTS method As of Mar 31, 2011 |
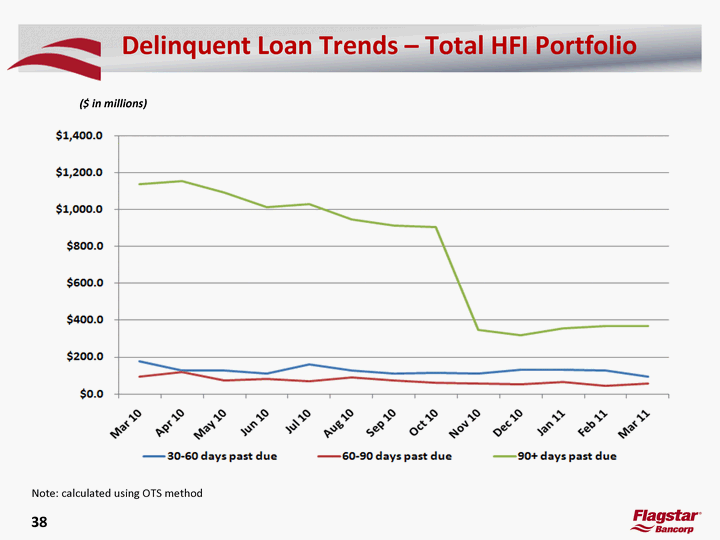
| 38 Delinquent Loan Trends - Total HFI Portfolio Note: calculated using OTS method ($ in millions) |
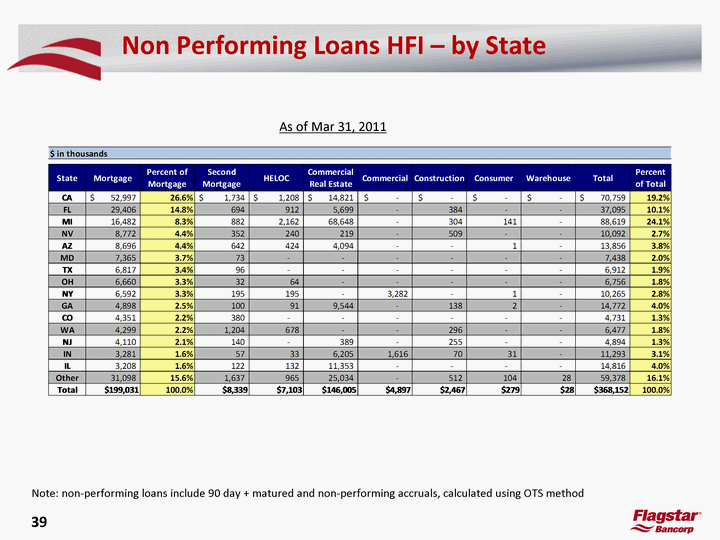
| 39 Non Performing Loans HFI - by State As of Mar 31, 2011 Note: non-performing loans include 90 day + matured and non-performing accruals, calculated using OTS method |
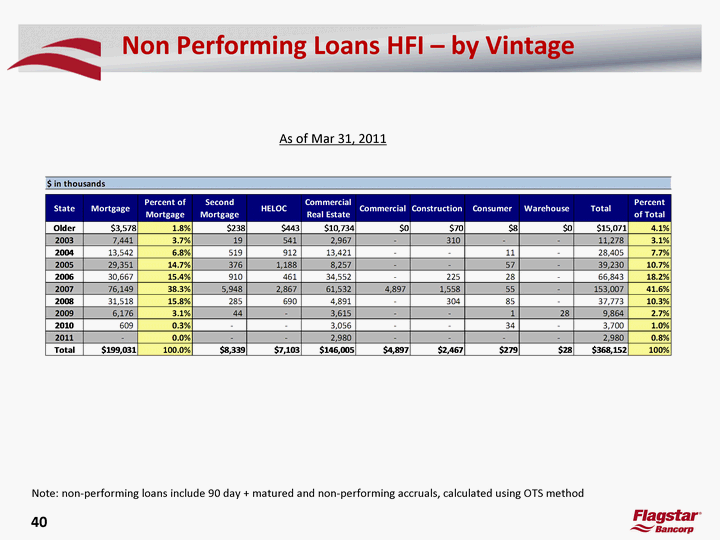
| 40 Non Performing Loans HFI - by Vintage As of Mar 31, 2011 Note: non-performing loans include 90 day + matured and non-performing accruals, calculated using OTS method |

