Attached files
| file | filename |
|---|---|
| 8-K - FORM 8-K - AMERICAN RIVER BANKSHARES | arb_8k.htm |
Exhibit 99.1
David T. Taber, President & CEO
Page
4 of Page 21
Forward-Looking Statements
Wunderlich Securities
World Championship Bank Tour
May 12, 2011
Certain statements contained herein are forward-looking statements within the meaning of Section 27A of the Securities Act of 1933 and Section 21E of the Securities Exchange Act of 1934 and subject to the safe harbor provisions of the Private Securities Litigation Reform Act of 1995, that involve risks and uncertainties. Actual results may differ materially from the results in these forward-looking statements. Factors that might cause such a difference include, among other matters, changes in interest rates, economic conditions, governmental regulation and legislation, credit quality, and competition affecting the Company’s businesses generally; the risk of natural disasters and future catastrophic events including terrorist related incidents; and other factors discussed in the Company’s Annual Report on Form 10-K for the year ended December 31, 2010, and in subsequent reports filed on Form 10-Q and Form 8-K. The Company does not undertake any obligation to publicly update or revise any of these forward-looking statements, whether to reflect new information, future events or otherwise, except as required by law.
Page
5 of Page 21
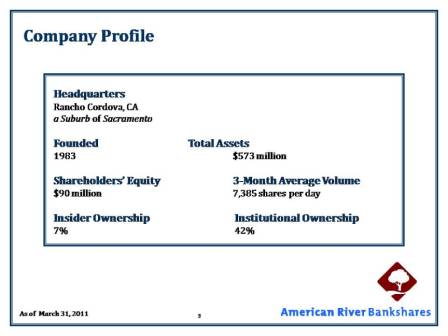
Company Profile
Headquarters
Rancho Cordova, CA
a Suburb of Sacramento
Founded Total Assets
1983 $573 million
Shareholders’ Equity 3-Month Average Volume
$90 million 7,385 shares per day
Insider Ownership Institutional Ownership
7% 42%
As of March 31, 2011
Page
6 of Page 21
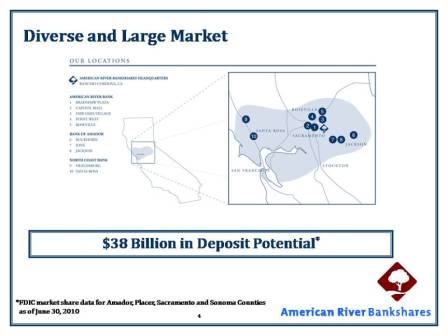
Diverse and Large Market
$38 Billion in Deposit Potential*
*FDIC market share data for Amador, Placer, Sacramento and Sonoma Counties as of June 30, 2010
Page
7 of Page 21
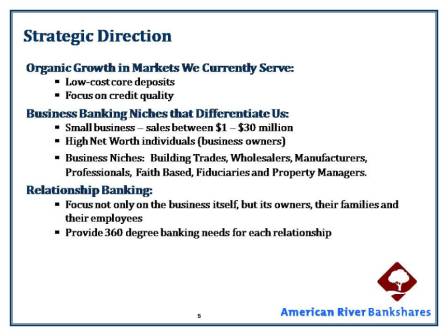
Strategic Direction
Organic Growth in Markets We Currently Serve:
Low-cost core deposits
Focus on credit quality
Business Banking Niches that Differentiate Us:
Small business – sales between $1 – $30 million
High Net Worth individuals (business owners)
Business Niches: Building Trades, Wholesalers, Manufacturers, Professionals, Faith Based, Fiduciaries and Property Managers.
Relationship Banking:
Focus not only on the business itself, but its owners, their families and their employees
Provide 360 degree banking needs for each relationship
Page
8 of Page 21
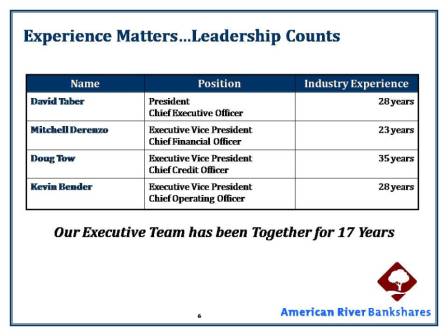
Experience Matters…Leadership Counts
|
Name
|
Position
|
Industry Experience
|
|
David Taber
|
President
Chief Executive Officer
|
28 years
|
|
Mitchell Derenzo
|
Executive Vice President
Chief Financial Officer
|
23 years
|
|
Doug Tow
|
Executive Vice President
Chief Credit Officer
|
35 years
|
|
Kevin Bender
|
Executive Vice President
Chief Operating Officer
|
28 years
|
Our Executive Team has been Together for 17 Years
Page
9 of Page 21
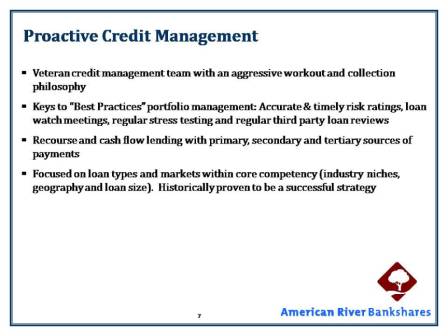
Proactive Credit Management
Veteran credit management team with an aggressive workout and collection philosophy
Keys to “Best Practices” portfolio management: Accurate & timely risk ratings, loan watch meetings, regular stress testing and regular third party loan reviews
Recourse and cash flow lending with primary, secondary and tertiary sources of payments
Focused on loan types and markets within core competency (industry niches, geography and loan size). Historically proven to be a successful strategy
Page
10 of Page 21
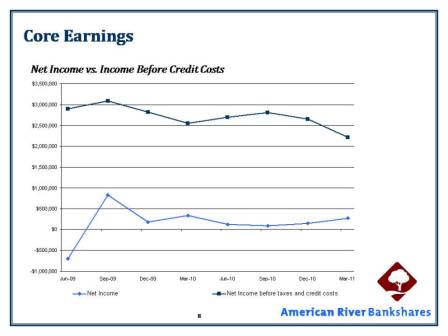
Core Earnings
Page 11 of Page 21
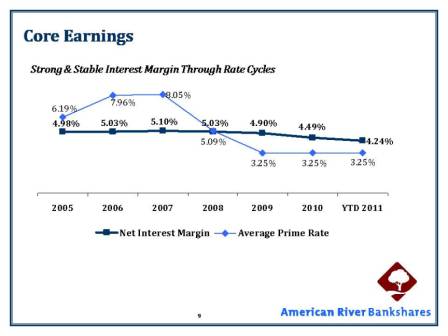
Core Earnings
Strong & Stable Interest Margin Through Rate Cycles
Page 12 of Page 21
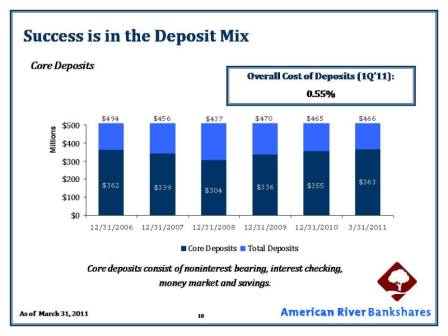
Success is in the Deposit Mix
Core Deposits
Overall Cost of Deposits (1Q’11):
0.55%
Core deposits consist of noninterest bearing, interest checking, money market and savings.
As of March 31, 2011
Page 13 of Page 21
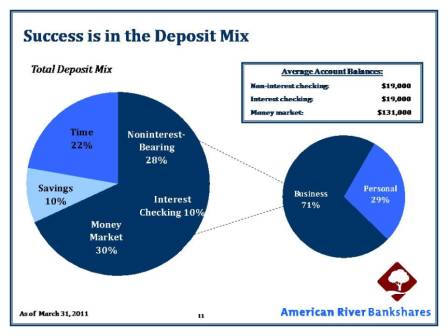
Success is in the Deposit Mix
Total Deposit Mix
Average Account Balances:
Non-interest checking: $19,000
Interest checking: $19,000
Money market: $131,000
As of March 31, 2011
Page 14 of Page 21
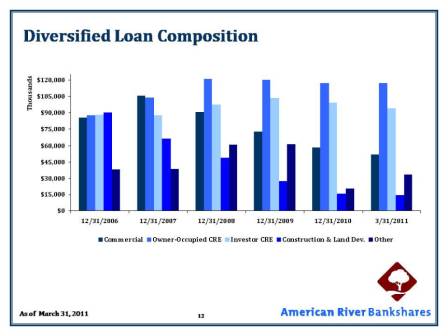
Diversified Loan Composition
As of March 31, 2011
Page 15 of Page 21
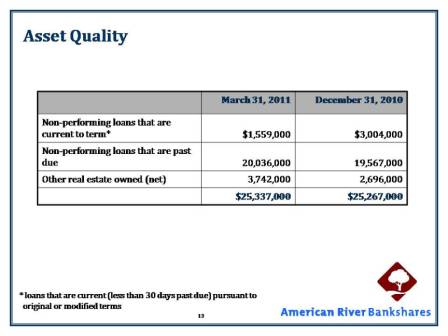
Asset Quality
|
March 31, 2011
|
December 31, 2010
|
|
|
Non-performing loans that are current to term*
|
$1,559,000
|
$3,004,000
|
|
Non-performing loans that are past due
|
20,036,000
|
19,567,000
|
|
Other real estate owned (net)
|
3,742,000
|
2,696,000
|
|
$25,337,000
|
$25,267,000
|
* loans that are current (less than 30 days past due) pursuant to
original or modified terms
Page 16 of Page 21
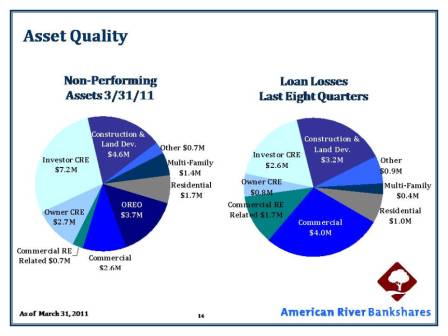
Asset Quality
Non-Performing Assets 3/31/11
Loan Losses
Last Eight Quarters
As of March 31, 2011
Page 17 of Page 21
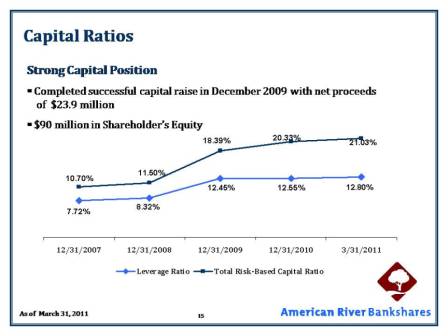
Capital Ratios
Strong Capital Position
Completed successful capital raise in December 2009 with net proceeds of $23.9 million
$90 million in Shareholder’s Equity
As of March 31, 2011
Page 18 of Page 21
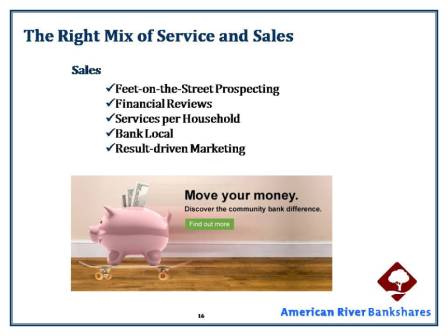
The Right Mix of Service and Sales
Sales
Feet-on-the-Street Prospecting
Financial Reviews
Services per Household
Bank Local
Result-driven Marketing
Page 19 of Page 21
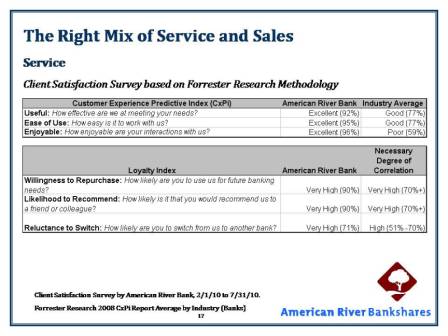
The Right Mix of Service and Sales
Service
Client Satisfaction Survey based on Forrester Research Methodology
Client Satisfaction Survey by American River Bank, 2/1/10 to 7/31/10.
Forrester Research 2008 CxPi Report Average by Industry (Banks)
Page
20 of Page 21
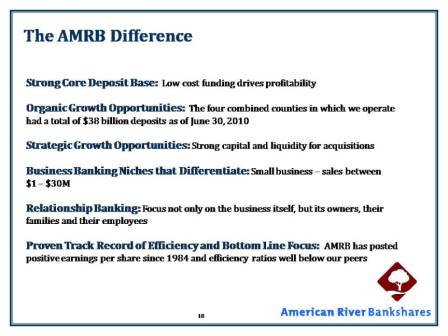
The AMRB Difference
Strong Core Deposit Base: Low cost funding drives profitability
Organic Growth Opportunities: The four combined counties in which we operate had a total of $38 billion deposits as of June 30, 2010
Strategic Growth Opportunities: Strong capital and liquidity for acquisitions
Business Banking Niches that Differentiate: Small business – sales between
$1 – $30M
Relationship Banking: Focus not only on the business itself, but its owners, their families and their employees
Proven Track Record of Efficiency and Bottom Line Focus: AMRB has posted positive earnings per share since 1984 and efficiency ratios well below our peers
Page 21 of Page 21