Attached files
| file | filename |
|---|---|
| EX-23.2 - CONSENT OF PRICEWATERHOUSE COOPERS LLP - SRAM International Corp | dex232.htm |
Table of Contents
As filed with the Securities and Exchange Commission on May 12, 2011
Registration No. 333-
UNITED STATES
SECURITIES AND EXCHANGE COMMISSION
WASHINGTON, D.C. 20549
FORM S-1
REGISTRATION STATEMENT
UNDER
THE SECURITIES ACT OF 1933
SRAM International Corporation
(Exact name of registrant as specified in its charter)
| Delaware | 3751 | 80-0712932 | ||
| (State or other jurisdiction of incorporation or organization) |
(Primary Standard Industrial Classification Code Number) |
(I.R.S. Employer Identification Number) |
1333 N. Kingsbury Street, 4th Floor
Chicago, Illinois 60642
(312) 664-8800
(Address, including zip code, and telephone number, including
area code, of registrant’s principal executive offices)
Stanley R. Day, Jr.
President and Chief Executive Officer
SRAM International Corporation
1333 N. Kingsbury Street, 4th Floor
Chicago, Illinois 60642
(312) 664-8800
(Name, address, including zip code, and telephone number, including area code, of agent for service)
Copies To:
| Christopher D. Lueking Mark D. Gerstein Latham & Watkins LLP 233 South Wacker Drive, Suite 5800 Chicago, Illinois 60606 (312) 876-7700 |
Leland E. Hutchinson Winston & Strawn LLP 35 West Wacker Drive Chicago, Illinois 60601 (312) 558-5600 |
Approximate date of commencement of the proposed sale to the public:
As soon as practicable after this registration statement becomes effective.
If any of the securities being registered on this form are to be offered on a delayed or continuous basis pursuant to Rule 415 under the Securities Act of 1933, check the following box. ¨
If this Form is filed to register additional securities for an offering pursuant to Rule 462(b) under the Securities Act, check the following box and list the Securities Act registration statement number of the earlier effective registration statement for the same offering. ¨
If this Form is a post-effective amendment filed pursuant to Rule 462(c) under the Securities Act, check the following box and list the Securities Act registration statement number of the earlier effective registration statement for the same offering. ¨
If this Form is a post-effective amendment filed pursuant to Rule 462(d) under the Securities Act, check the following box and list the Securities Act registration statement number of the earlier effective registration statement for the same offering. ¨
Indicate by check mark whether the registrant is a large accelerated filer, an accelerated filer, a non-accelerated filer, or a smaller reporting company. See the definitions of “large accelerated filer,” “accelerated filer” and “smaller reporting company” in Rule 12b-2 of the Exchange Act.
| Large accelerated filer | ¨ | Accelerated filer | ¨ | |||
| Non-accelerated filer | x | Smaller reporting company | ¨ | |||
CALCULATION OF REGISTRATION FEE
| Title of Each Class of Securities to be Registered |
Proposed Maximum Aggregate Offering Price(1)(2) |
Amount of Registration Fee | ||
| Class A common stock, par value $0.01 per share |
$300,000,000 | $34,830.00 | ||
| (1) | Estimated solely for the purpose of calculating the registration fee pursuant to Rule 457(o) under the Securities Act of 1933, as amended. |
| (2) | Includes additional shares that the underwriters have the option to purchase. See “Underwriting.” |
The Registrant hereby amends this registration statement on such date or dates as may be necessary to delay its effective date until the Registrant shall file a further amendment which specifically states that this registration statement shall thereafter become effective in accordance with Section 8(a) of the Securities Act of 1933 or until the registration statement shall become effective on such date as the Commission acting pursuant to said Section 8(a), may determine.
Table of Contents
The information in this preliminary prospectus is not complete and may be changed. These securities may not be sold until the registration statement filed with the Securities and Exchange Commission is effective. This preliminary prospectus is not an offer to sell these securities, and we are not soliciting an offer to buy these securities in any state where the offer or sale is not permitted.
Subject to completion, dated May 12, 2011.
shares

Class A common stock
This is an initial public offering of shares of Class A common stock of SRAM International Corporation.
We are offering shares of our Class A common stock, and the selling stockholders identified in this prospectus are offering an additional shares of our Class A common stock. We will not retain any of the net proceeds from the sale of the shares of Class A common stock by the selling stockholders. The estimated initial public offering price per share is expected to be between $ and $ .
We intend to list our Class A common stock on the New York Stock Exchange or Nasdaq Stock Market under the symbol “SRAM.”
We will be a holding company, and our only business will be the operation and control of the business and affairs of SRAM, LLC and its subsidiaries.
Following this offering, we will have two classes of authorized common stock, Class A common stock and Class B common stock. The rights of the holders of Class A common stock and Class B common stock are identical, except with respect to voting. The Class A common stock is entitled to one vote per share and the Class B common stock is entitled to ten votes per share. Therefore, immediately following this offering, the holders of Class A common stock will hold % of our total voting power, assuming no exercise of the underwriters’ option to purchase additional shares. Each share of Class B common stock is convertible at any time into one share of Class A common stock.
| Per Share | Total | |||
| Initial public offering price |
$ | $ | ||
| Underwriting discounts and commissions |
$ | $ | ||
| Proceeds to SRAM International Corporation, before expenses |
$ | $ | ||
| Proceeds to the selling stockholders, before expenses |
$ | $ | ||
The selling stockholders have granted the underwriters an option for a period of 30 days to purchase additional shares of Class A common stock. We will not receive any proceeds from the sale of these shares by the selling stockholders.
Investing in our Class A common stock involves a high degree of risk. See “Risk factors” beginning on page 10.
Neither the Securities and Exchange Commission nor any state securities commission nor any other regulatory body has approved or disapproved of these securities or determined if this prospectus is truthful or complete. Any representation to the contrary is a criminal offense.
| J.P. Morgan | BofA Merrill Lynch | Morgan Stanley | ||
| Baird | Lazard Capital Markets | |||
| Piper Jaffray | Stifel Nicolaus Weisel | |||
, 2011.
Table of Contents
[INSIDE FRONT COVER GRAPHICS]
Table of Contents
| Page | ||||
| 1 | ||||
| 6 | ||||
| 8 | ||||
| 10 | ||||
| 26 | ||||
| 27 | ||||
| 31 | ||||
| 32 | ||||
| 33 | ||||
| 35 | ||||
| 37 | ||||
| 45 | ||||
| Management’s discussion and analysis of financial condition and results of operations |
47 | |||
| 67 | ||||
| 82 | ||||
| 87 | ||||
| 93 | ||||
| 97 | ||||
| 99 | ||||
| 104 | ||||
| Material U.S. federal income tax consequences to non-U.S. holders of our Class A common stock |
106 | |||
| 110 | ||||
| 115 | ||||
| 116 | ||||
| 117 | ||||
You should rely only on the information contained in this prospectus or contained in any free writing prospectus filed with the Securities and Exchange Commission. Neither we nor the underwriters have authorized anyone to provide you with additional information or information different from that contained in this prospectus or in any free writing prospectus filed with the Securities and Exchange Commission. We are offering to sell, and seeking offers to buy, our Class A common stock only in jurisdictions where offers and sales are permitted. The information contained in this prospectus is accurate only as of the date of this prospectus, regardless of the time of delivery of this prospectus or of any sale of our Class A common stock.
Neither we nor any of the underwriters have done anything that would permit this offering or possession or distribution of this prospectus in any jurisdiction where action for that purpose is required, other than in the United States. You are required to inform yourselves about and to observe any restrictions relating to this offering and the distribution of this prospectus.
i
Table of Contents
This summary highlights information contained elsewhere in this prospectus and does not contain all of the information that you should consider in making your investment decision. Before investing in our Class A common stock, you should carefully read this entire prospectus, including our financial statements and the related notes included in this prospectus and the information set forth under the headings “Risk factors,” “Unaudited pro forma condensed consolidated financial data” and “Management’s discussion and analysis of financial condition and results of operations.” Unless the context requires otherwise, the words “SRAM International Corporation,” “SRAM,” “we,” “company,” “us” and “our” refer to SRAM International Corporation, a newly formed Delaware corporation, and its subsidiaries, including SRAM Holdings, LLC and SRAM, LLC.
Overview
We are a leading global designer, manufacturer and marketer of premium bicycle components. Consumers recognize our brands for differentiated design and innovation. Our portfolio of premium brands includes SRAM, RockShox, Zipp, Avid and Truvativ. Our products include drivetrain systems, suspension, brakes, internal gear hubs and wheelsets, all of which are essential components used on road bikes, mountain bikes and pavement bikes. Many of the world’s elite cyclists use our components, including the last two Tour de France winners, the 2010 Ironman World Championship winner and the winners of all six 2010 World Cup mountain bike races. We believe the success of elite cyclists using our products at the highest levels of competition creates aspirational demand for our components and drives demand from a broad consumer base of cyclists across all skill levels.
We are the second largest supplier of bicycle components in the world. We focus primarily on the independent bicycle retailer market, which sells mid to high-end bikes, ranging in price from $300 to over $10,000 in the United States, Europe and other developed markets. We believe this is the highest margin segment of the bicycle component market. The consumer in this market is generally the cycling enthusiast, who seeks higher performance premium branded bikes and components. Our products, which prominently display our brands, are used on all of the major premium brands produced by our bicycle company customers, including Trek, Specialized, Cannondale, Giant, Raleigh and Schwinn.
To reach the independent bicycle retailer market, we operate through two distribution channels: the OEM channel and the aftermarket channel. In the OEM channel, we market our products to bicycle companies as original equipment components for new bikes that they sell to consumers through independent bicycle retailers. In the aftermarket channel, we sell products through distributors to independent bicycle retailers and sell a limited number of premium aftermarket products directly to independent bicycle retailers in the United States, who in turn sell them to consumers for replacements, upgrades or custom bike builds. For the year ended December 31, 2010, we generated 67% of our net sales from the sale of components in the OEM channel and 33% of our net sales from the sale of components in the aftermarket channel.
We believe our premium brands, technological innovation, product development and leading market positions have been key drivers of our strong financial performance. We grew our net sales from $283.8 million in 2006 to $524.2 million in 2010, representing a compound annual growth rate, or CAGR, of 16.6%. Over the same period, our operating income increased from $23.7 million to $99.6 million, representing a CAGR of 43.2% and an increase in operating margin from 8.3% to 19.0%. Our net earnings also increased from $11.6 million in 2006 to $50.0 million in 2010, representing a CAGR of 44.1%.
1
Table of Contents
Market overview and opportunity
Bicycle industry overview
The National Bicycle Dealers Association estimates annual worldwide bike production in 2009 was 108 million units, of which approximately 46 million were sold in developed markets. There are two primary retail channels for the sale of bikes in developed markets: the independent bicycle retailer market (primarily independent bicycle retailers and to a lesser extent sporting good chains) and mass market retailers (e.g., Wal-Mart and Target). We estimate that in 2010 there were 18 million new bikes sold in the independent bicycle retailer market globally, representing $9.2 billion in retail sales, with an average retail price of approximately $500 per bike. Of these 18 million new bikes sold, we believe approximately 90% were sold in the United States, Europe and Japan.
Bicycle component market
Branded bicycle components are key to the performance of mid to high-end bikes and strongly influence the buying decisions of cycling enthusiasts. Strong demand for branded components enables component suppliers to realize premium price positioning and gross margins that we believe are higher than other participants in the bicycle industry supply chain. We estimate the size of the independent bicycle retailer market for bicycle components to be approximately $3.5 billion, as measured in component suppliers’ sales.
Outlook
We expect the bicycle component market to continue to grow due to a variety of factors that impact the cycling industry, including:
| • | continuing growth in the number of cycling enthusiasts; |
| • | increasing average retail selling prices driven by better-performing product designs and technologies; |
| • | growing participation in road racing, mountain bike racing, organized weekend rides and charity cycling events, as well as cycling related sports, such as triathlons and cyclo-cross; |
| • | improving cycling infrastructure, such as cycling lanes in urban areas; |
| • | increasing consumer focus on healthier lifestyle trends; |
| • | growing focus on the environment; and |
| • | increasing adoption of mid to high-end bikes in emerging markets. |
Our strengths
We attribute our success to the following competitive strengths:
Premium brand portfolio. We have five premium brands under the SRAM umbrella: SRAM (drivetrain systems), RockShox (suspension), Zipp (wheelsets), Avid (brakes) and Truvativ (cranks). Our brands are prominently displayed on all of our products and are associated with innovation and performance by our customers, consumers and elite athletes.
Relentless innovation and product development. Our ability to develop innovative products has been a key driver of our success and growth as a company. We generated over 50% of our 2010 model year (July 1
2
Table of Contents
through June 30) net sales from products that were less than three years old. We currently have more than 280 employees dedicated to product development, and we also have an intellectual property portfolio of over 550 patents. We currently have approximately 70 ongoing product development projects and to date have launched over 40 new products for our 2011 model year.
Leader in growing independent bicycle retailer market. We are the second largest supplier of bicycle components in the world. We believe we have a 15% share of the approximately $3.5 billion of annual sales in the independent bicycle retailer market for bicycle components, as measured in component suppliers’ sales.
Highly defensible business model. Over the past 24 years, we have developed global design, production and distribution capabilities and established longstanding customer relationships that we believe are difficult to replicate. We are one of only two suppliers offering a full-line of mid to high-end components to bicycle companies for use on their bikes. We differentiate our company by offering leading customer service and warranty support to independent bicycle retailers.
Committed management team with deep-rooted corporate culture. Our senior management team has an average tenure with SRAM of approximately 18 years and has transformed SRAM from a single product company in 1987 to a full-line bicycle component supplier with approximately 2,200 employees in nine countries around the world today.
Our strategy
Key elements of our growth strategy are:
Extend our technological and product leadership. We intend to continue to develop and market products that incorporate innovative design, advanced features and improved performance that differentiate us in the bicycle component market. These efforts will include enhancing our existing products, introducing next generation technologies and developing new product offerings that leverage our existing product platforms in order to maintain our position as an industry leader.
Continue to increase our share of components on new bikes. We are favorably positioned to increase our share of components on new bikes by building on the strength of our brands, the diversity of our product portfolio and our innovation pipeline. We will focus on key decision-makers who influence component specifications for new bikes, including the bike brand product managers at bicycle companies, independent bicycle retailers, cycling industry media and competitive cyclists, including amateur racers and triathletes.
Increase aftermarket penetration. We intend to increase our sales of aftermarket components by strengthening our relationships with independent bicycle retailers and increasing brand awareness at the consumer level. We also intend to enhance our aftermarket product offerings by increasing differentiation of our aftermarket channel components from our OEM channel components and, where appropriate, expanding into product areas adjacent to our current product lines.
Grow the industry while strengthening our leadership profile. We will continue to focus on a number of initiatives aimed at growing our industry and reinforcing our leadership position within it by continuing product innovation, strengthening our independent retailer network through training and marketing programs and promoting cycling advocacy.
History
SRAM International Corporation was incorporated on April 29, 2011 for the purpose of becoming the holding company of SRAM Holdings, LLC and SRAM, LLC immediately prior to the consummation of this offering. SRAM was originally founded in 1987 as SRAM Corporation, an Illinois corporation, to design, manufacture and market bicycle shifters. In 1995, after becoming a market leader in shifters, we began our transformation into a
3
Table of Contents
full-line, mid to high-end component supplier. We have grown through internal product development and a series of strategic acquisitions, including the acquisition of the bicycle division of Mannesman Sachs AG (1997), RockShox, Inc. (2002), the bicycle business of Avid, LLC (2004), Truvativ International Co., Ltd. (2004) and Compositech, Inc. (Zipp) (2007). One of our founders, Stanley R. Day, Jr., is our President, Chief Executive Officer and Chairman of the Board. On September 30, 2008, we completed a recapitalization in which Trilantic Capital Partners and certain affiliates and co-investors purchased a $234.8 million equity interest in SRAM. We refer to this investment and recapitalization as the 2008 recapitalization. See “Certain relationships and related person transactions—Trilantic 2008 investment and recapitalization” for information on the 2008 recapitalization.
The refinancing and reorganization
Refinancing
Prior to the reorganization described below and this offering, SRAM, LLC intends to enter into new credit facilities consisting of a first-lien term facility, a second-lien term facility and a revolving facility. The aggregate proceeds from the new credit facilities will be approximately $ million. The proceeds from the new credit facilities will be used to repay all outstanding amounts under our existing credit facilities, which as of , 2011 was $ million, to directly or indirectly acquire all of the equity interests in SRAM Holdings, LLC held by Trilantic and its co-investors for $ million and to pay fees and expenses related to the refinancing. In connection with these transactions, SRAM Holdings, LLC will amend and restate its operating agreement to create a single class of common units and eliminate the corporate governance and liquidity rights of Trilantic and its co-investors. We refer to the entering into of our new credit facilities, the use of proceeds therefrom and the related amendment to the SRAM Holdings, LLC operating agreement as the refinancing. Following the refinancing, Trilantic and its co-investors will have no remaining ownership of SRAM Holdings, LLC. See “The refinancing and reorganization” for additional information.
Reorganization
Immediately prior to the consummation of this offering, the remaining equity holders of SRAM Holdings, LLC, after giving effect to the refinancing described above, will enter into a reorganization pursuant to which SRAM International Corporation, will acquire 100% of the equity interests of SRAM Holdings, LLC, either directly or through one or more wholly-owned subsidiaries, and the equity holders of SRAM Holdings, LLC will exchange their direct or indirect equity interests in SRAM Holdings, LLC for shares of common stock of SRAM International Corporation. The remaining equity holders will include the Day family, SRAM management and current and former directors and employees. A portion of the shares of common stock issued to the remaining equity holders will be sold in the secondary portion of this offering. SRAM Holdings, LLC will continue to hold 100% of the equity interests of our operating company, SRAM, LLC. Immediately prior to this offering, SRAM Holdings, LLC will make $ million of distributions to its remaining equity holders with respect to the estimated federal and state income taxes on their allocable shares of SRAM Holdings, LLC’s estimated taxable income from January 1, 2011 through the closing date of this offering. We refer to the series of transactions described in this paragraph as the reorganization. See “The refinancing and reorganization” for additional information.
Corporate information
Our principal executive offices are located at 1333 North Kingsbury Street, 4th Floor, Chicago, Illinois 60642. Our telephone number is (312) 664-8800. Our website address is www.sram.com. Information contained on our website is not a part of this prospectus and the inclusion of our website address in this prospectus is an inactive textual reference only.
4
Table of Contents
SRAM®, RockShox®, Zipp®, Avid®, TRUVATIV®, Grip Shift®, DoubleTap®, ZeroLoss™ and other trademarks or service marks of SRAM appearing in this prospectus are the property of SRAM. Trade names, trademarks and service marks of other companies appearing in this prospectus are the property of the respective holders.
Risk factors
Our business is subject to numerous risks and uncertainties, including those highlighted in the section entitled “Risk factors” immediately following this prospectus summary, that primarily represent challenges we face in connection with the successful implementation of our strategy and the growth of our business. We expect a number of factors may cause our operating results to fluctuate on a quarterly and annual basis, which may make it difficult to predict our future performance. Such factors include our ability to introduce new products into the market, changes in the competitive landscape for bicycle components, unfavorable economic conditions, a weakening of our brand image, a disruption in the operations of our manufacturing facilities, loss of our senior management, changes in the popularity of cycling or the number of cycling enthusiasts and other risks described under “Risk factors.”
Industry and market data
Market data and industry statistics and forecasts used throughout this prospectus are based on independent industry publications, reports by market research firms and other published independent sources. Some data and other information are also based on our good faith estimates, which are derived from our review of internal surveys and data and independent sources. Although we believe these sources are credible, we have not independently verified the data or information obtained from external sources.
Presentation of financial information
SRAM International Corporation was incorporated in Delaware on April 29, 2011. The historical financial information presented in this prospectus is that of SRAM Holdings, LLC, which will become a subsidiary of SRAM International Corporation prior to the consummation of this offering, for the period from October 1, 2008 through December 31, 2010 and SRAM Corporation, the predecessor to SRAM Holdings, LLC, for periods prior to October 1, 2008. For the purposes of the financial statements and information presented in this prospectus, we refer to SRAM Holdings, LLC and SRAM Corporation as our predecessor companies for these respective periods.
Terms used in this prospectus
As used in this prospectus, the term “Day family” means (1) Stanley R. Day, Jr. and Frederick K. W. Day and their spouses, parents, children, siblings, cousins, mothers and fathers-in-law, sons and daughters-in-law and brothers and sisters-in-law and (2) various trusts for the benefit of the individuals described in clause (1) and the trustees thereof.
As used in this prospectus, the term “Trilantic and its co-investors ” refers to Trilantic Capital Partners (f/k/a Lehman Brothers Merchant Banking) and certain of its affiliates (Trilantic) and GE Capital Equity Holdings Inc., Gleacher Mezzanine Fund II, L.P., GMF SRAM Holdings Corp., Southern Farm Bureau Life Insurance Company and JPM Mezzanine Capital, LLC (its co-investors), which prior to the refinancing collectively own 100% of the Class A units of SRAM Holdings, LLC.
References in this prospectus to our “stock” or our “common stock” mean shares of SRAM International Corporation’s Class A common stock, shares of SRAM International Corporation’s Class B common stock, or both, as the context requires.
5
Table of Contents
Common stock offered
| Class A common stock being offered by SRAM International Corporation |
shares. |
| Class A common stock being offered by the selling stockholders |
shares (or shares if the underwriters exercise in full their option to purchase additional shares). |
| Class A common stock to be outstanding after this offering |
shares (or shares if the underwriters exercise in full their option to purchase additional shares). |
| Class B common stock to be outstanding after this offering |
shares (or shares if the underwriters exercise in full their option to purchase additional shares). |
| Voting rights |
Each share of our Class A common stock will entitle its holder to one vote per share on all matters to be voted on by stockholders generally. Each share of our Class B common stock will entitle its holder to ten votes per share on all matters to be voted on by stockholders generally. Immediately following this offering, the holders of Class A common Stock will hold % of our total voting power. |
| Use of proceeds |
We estimate that the net proceeds to us from the sale of shares of our Class A common stock by us in this offering will be approximately $ million after deducting assumed underwriting discounts and commissions payable by us, based on an offering price of $ per share, the midpoint of the range set forth on the cover page of this prospectus. We intend to use $ million of the proceeds to us to repay $ million of indebtedness under the new credit facilities, which we intend to enter into prior to this offering, and $ million to pay fees and expenses related to this offering. |
| We will not receive any proceeds from the sale of shares by the selling stockholders. See “Use of proceeds.” |
| Risk factors |
See “Risk factors” beginning on page 10 and the other information included in this prospectus for a discussion of factors you should carefully consider before deciding to invest in our Class A common stock. |
| Directed share program |
The underwriters have reserved for sale, at the initial public offering price, up to shares of our Class A common stock being offered for sale to certain parties. The number of shares available for sale to the general public in this offering will be reduced to the extent these persons purchase reserved shares. Any reserved shares not purchased will be offered by the underwriters to the general public on the same terms as the other shares. |
6
Table of Contents
| Proposed NYSE or Nasdaq symbol |
“SRAM” |
The number of shares of our common stock outstanding after this offering excludes:
| • | an aggregate of shares of Class A common stock reserved for issuance under the SRAM International Corporation 2011 Incentive Award Plan that we will adopt prior to the consummation of this offering. |
Except as otherwise indicated, information in this prospectus reflects or assumes the following:
| • | the refinancing has been consummated; |
| • | the reorganization has been consummated, including the filing of our amended and restated certificate of incorporation, which provides for, among other things, the authorization of shares of Class A common stock and shares of Class B common stock; and |
| • | no exercise of the underwriters’ option to purchase up to additional shares of our Class A common stock. |
7
Table of Contents
Summary consolidated and pro forma financial data
The following summary consolidated and pro forma financial data of our predecessor companies should be read together with “The refinancing and reorganization,” “Use of proceeds,” “Unaudited pro forma condensed consolidated financial data,” “Selected consolidated financial data,” “Management’s discussion and analysis of financial condition and results of operations” and the historical financial statements and related notes included elsewhere in this prospectus. The consolidated financial statements of our predecessor companies, SRAM Holdings, LLC and SRAM Corporation, will be our historical financial statements following this offering.
We derived the summary consolidated statement of operations data for our predecessor companies for each of the years ended December 31, 2008, 2009 and 2010 and the summary consolidated balance sheet data for our predecessor companies as of December 31, 2010 from the audited consolidated financial statements of SRAM Holdings, LLC, which are included elsewhere in this prospectus.
The unaudited pro forma condensed consolidated statement of operations data for the year ended December 31, 2010 presents our consolidated results of operations, and the unaudited pro forma condensed consolidated balance sheet data as of December 31, 2010 presents our consolidated financial position, after giving effect to the refinancing and reorganization described under “The refinancing and reorganization,” this offering and the use of the estimated net proceeds from this offering described under “Use of proceeds,” as if such transactions occurred on January 1, 2010, for the unaudited pro forma condensed consolidated statement of operations, and, as if such transactions occurred on December 31, 2010, for the unaudited pro forma condensed consolidated balance sheet.
| Predecessor(1) | Successor(1) | |||||||||||||||||||||||
| Actual | Pro forma as 2010 |
|||||||||||||||||||||||
| Year ended December 31, (in thousands, except per share/unit data) |
2008 | 2009 | 2010 | |||||||||||||||||||||
| Statement of operations data: |
||||||||||||||||||||||||
| Net sales |
$ | 478,354 | $ | 399,581 | $ | 524,187 | $ | |||||||||||||||||
| Cost of sales |
310,725 | 239,448 | 312,954 | |||||||||||||||||||||
| Gross profit |
167,629 | 160,133 | 211,233 | |||||||||||||||||||||
| Operating expenses |
||||||||||||||||||||||||
| General and administrative expense |
77,846 | 29,042 | 33,913 | |||||||||||||||||||||
| Sales and marketing expense |
49,480 | 27,934 | 40,579 | |||||||||||||||||||||
| Product development expense |
46,506 | 27,799 | 37,179 | |||||||||||||||||||||
| Recapitalization costs(2) |
8,952 | — | — | |||||||||||||||||||||
| 182,784 | 84,775 | 111,671 | ||||||||||||||||||||||
| Income (loss) from operations |
(15,155 | ) | 75,358 | 99,562 | ||||||||||||||||||||
| Other income (expense) |
||||||||||||||||||||||||
| Interest expense, net |
(21,703 | ) | (36,245 | ) | (32,634 | ) | ||||||||||||||||||
| Foreign currency exchange gain (loss) |
4,072 | (3,221 | ) | 237 | ||||||||||||||||||||
| Other expense, net |
(17,631 | ) | (39,466 | ) | (32,397 | ) | ||||||||||||||||||
| Income (loss) before income taxes |
(32,786 | ) | 35,892 | 67,165 | ||||||||||||||||||||
| Income tax expense |
15,838 | 14,373 | 17,193 | |||||||||||||||||||||
| Net income (loss)(3) |
$ | (48,624 | ) | $ | 21,519 | $ | 49,972 | $ | ||||||||||||||||
8
Table of Contents
| Predecessor(1) | Successor(1) | |||||||||||||||||||||||
| Actual | Pro forma as 2010 |
|||||||||||||||||||||||
| Year ended December 31, (in thousands, except per share/unit data) |
2008 | 2009 | 2010 | |||||||||||||||||||||
| Net income (loss) attributable to members, after Class A preferred return and tax distributions to Class A and Class B members |
$ | (54,494 | ) | $ | (6,228 | ) | $ | 15,432 | $ | |||||||||||||||
| Class B members |
||||||||||||||||||||||||
| Net income (loss) attributable to Class B members |
$ | (54,494 | ) | $ | (5,979 | ) | $ | 13,231 | ||||||||||||||||
| Weighted average units outstanding—basic and diluted(4) |
5,460,000 | 5,460,000 | 5,460,000 | |||||||||||||||||||||
| Earnings (loss) per unit—basic and diluted(4) |
$ | (9.98 | ) | $ | (1.10 | ) | $ | 2.42 | ||||||||||||||||
| Pro forma as adjusted weighted average common shares outstanding—basic and diluted |
||||||||||||||||||||||||
| Pro forma as adjusted earnings per common share—basic and diluted |
$ | |||||||||||||||||||||||
| Predecessor(1) | Successor(1) | |||||||||||
| As of December 31, 2010 (in thousands) |
Actual | Pro forma as adjusted |
||||||||||
| Balance sheet data: |
||||||||||||
| Cash and cash equivalents |
$ | 19,409 | $ | |||||||||
| Total assets |
249,275 | |||||||||||
| Loans and borrowings (including short-term borrowings)(5) |
227,103 | |||||||||||
| Total liabilities |
373,185 | |||||||||||
| Total members’ (deficit) equity |
(123,910 | ) | ||||||||||
| Total stockholders’ (deficit) equity |
— | |||||||||||
| (1) | Prior to this offering, the proceeds from the refinancing will be used to directly or indirectly acquire all of the equity interests in SRAM Holdings, LLC held by Trilantic and its co-investors. This transaction will be accounted for under the purchase method of accounting, which will require our net assets to be recognized at fair value upon acquisition. Our historical financial statements for periods prior to the date of this offering (our predecessor periods) were prepared on the historical cost basis of accounting, which was utilized prior to the refinancing. Our historical financial statements for periods subsequent to the date of this offering (our successor periods) and our unaudited pro forma condensed consolidated financial statements will be prepared on a new basis of accounting, that is, fair value. As a result, our results for the successor periods are not necessarily comparable to the predecessor periods. |
| (2) | Recapitalization costs relate to the 2008 recapitalization in which Trilantic and its co-investors purchased a $234.8 million equity interest in SRAM. See “Certain relationships and related person transactions–Trilantic 2008 investment and recapitalization” for a description of the 2008 recapitalization. |
| (3) | Net loss for 2008 includes expenses related to our 2008 recapitalization, including share-based compensation expense of $88.5 million in accordance with Accounting Standards Codification, or ASC, 718, Compensation—Stock Compensation. This expense was primarily due to the immediate vesting, exercise and repurchase of awards, triggered by the 2008 recapitalization, which was allocated across our cost of sales, general and administrative expense, sales and marketing expense and product development expense for the year. Net income for 2009 and 2010 includes share-based compensation expense of $3.7 million and $12.4 million, respectively, similarly allocated. |
| (4) | For purposes of determining the weighted average units outstanding used in the earnings per unit calculation, we have retroactively reflected the impact of the 2008 recapitalization on our capital structure as if it had occurred on January 1, 2008. |
| (5) | Loans and borrowings (including short-term borrowings) are defined as (i) the current portion of long-term debt plus (ii) long-term borrowings. |
9
Table of Contents
An investment in our Class A common stock involves a high degree of risk. You should consider carefully the risks described below together with the financial and other information contained in this prospectus, before you decide to buy our Class A common stock. If any of the events contemplated by the following risks should occur, our business, financial condition and results of operations could be negatively affected. As a result, the market price of our Class A common stock could decline and you could lose all or part of your investment in our Class A common stock.
Risks related to our business
Successfully managing the frequent introduction of new products that satisfy changing consumer preferences is key to our success.
In order to meet the demands of the marketplace, we are focused on product innovation and continual product evolution. We introduce numerous new products each model year. Over 50% of our 2010 model year (July 1 through June 30) net sales were generated from products that were less than three years old. In order for us to continue to successfully introduce new products, we must properly anticipate the preferences of bicycle companies, independent bicycle retailers and consumers and invest in product development to design innovative products that meet those preferences. If we are unable to meet these demands, our products may not win specifications on new bike models or have success in the aftermarket, in which case our sales, margins and brand image could suffer. Furthermore, in order for new products to generate equivalent or greater revenues than their predecessors, they must either maintain the same or higher sales levels with the same or higher pricing, or exceed the performance of their predecessors in one or both of those areas. If our new products are unable to achieve sufficient pricing levels or we are unable to increase our sales volume to compensate, our profitability could decrease.
The bicycle component industry is highly competitive and we are subject to risks relating to competition that may adversely affect our performance.
The bicycle component industry is highly competitive. We compete with a number of other manufacturers that produce and sell bicycle components. We believe our products primarily compete on the basis of product design, innovation, customer service, manufacturing and distribution capabilities, product quality and price. Our continued success depends on our ability to continue to compete effectively against our numerous competitors, at least one of which has significantly greater financial, marketing and other resources than we have. In the future, our competitors may be able to maintain and grow brand strength and market share more effectively or quickly than we do by anticipating the course of market developments more accurately than we do, developing products that are superior to our products, creating manufacturing or distribution capabilities that are superior to ours, producing similar products at a lower cost than we can, or adapting more quickly than we do to new technologies or evolving regulatory, industry or customer requirements, among other things. As a result, our products may not be able to compete successfully with our competitors’ products, which could negatively affect our business, financial condition or results of operations. For example, one of our competitors has developed and offers an electronic drivetrain system. We currently do not offer an electronic drivetrain system to our customers. If the electronic drivetrain system gains industry acceptance among cycling enthusiasts, our business, financial condition or results of operations could be negatively affected.
In addition, we may encounter increased competition if our current competitors broaden their product offerings by beginning to produce additional types of components or through consolidation. Currently, we are one of only
10
Table of Contents
two suppliers offering bicycle companies a full-line of mid to high-end components used on their bikes, which we believe provides us an advantage with these customers. Our primary competitors generally compete with us in one or two of our product types. Our business, financial condition or results of operations may suffer if additional competitors are able to offer a full-line of components.
Unfavorable economic conditions could have a negative effect on our business, financial condition or results of operations.
Our business depends substantially on global economic and market conditions. For the year ended December 31, 2010, 67% of our net sales was generated from the OEM channel. A high percentage of these sales are recreational in nature and are discretionary purchases for consumers. Consumers are generally more willing to make discretionary purchases during periods of favorable general economic conditions and high consumer confidence. Discretionary spending may also be affected by many other factors, including interest rates, the availability of consumer credit, taxes and consumer confidence in future economic conditions. During periods of unfavorable economic conditions, or periods when other of these factors exist, consumer discretionary spending could be reduced, which in turn could reduce our product sales and have a negative effect on our business, financial condition or results of operations.
In addition, there could also be a number of secondary effects resulting from an economic downturn, such as: insolvency of our suppliers resulting in product delays, an inability of our customers to obtain credit to finance purchases of our products or a desire of our customers to delay payment to us for the purchase of our products. Any of these effects could negatively affect our business, financial condition or results of operations.
If we are unable to maintain our strong brand image, our business may suffer.
Our bicycle components are selected by brands at bicycle companies and by consumers in large part because of our brand reputation. Therefore, our success depends on our ability to maintain and build our brand image. We have focused on building our brands through strong relationships with the major bicycle companies and independent bicycle retailers and through marketing programs aimed at cycling enthusiasts in various media and other channels. For example, we invest significant amounts in sponsorships of elite cyclists in order to reach cycling enthusiasts. We currently sponsor over 15 professional teams and over 40 individuals in competitive cycling. In order to continue to enhance our brand image, we will need to continue to invest in sponsorships, marketing and public relations. In addition, maintaining and enhancing our brand image will depend largely on our ability to be a leader in the bicycle component industry and to continue to provide high quality products and services, which may require us to make substantial investments in areas such as product development and employee training.
There can be no assurance, however, that we will be able to maintain or enhance the strength of our brands in the future. Our brands could be adversely impacted by, among other things:
| • | internal product quality control issues with our components; |
| • | product quality issues on the bikes on which our components are installed; |
| • | product recalls; |
| • | high profile component failures (such as a component failure during a race on a bike ridden by an athlete that we sponsor); and |
| • | negative publicity regarding our sponsored athletes. |
Any adverse impact on our brands could in turn negatively affect our business, financial condition or results of operations.
11
Table of Contents
A significant disruption in the operations of our manufacturing facilities could have a negative effect on our business, financial condition or results of operations.
We have manufacturing facilities located in the United States, Europe and Asia. Equipment failures, delays in deliveries or catastrophic loss at any of our facilities could lead to production or service disruptions, curtailments or shutdowns. In the event of a stoppage in production, or a slow down in production due to high employee turn-over or a labor dispute at any of our facilities, even if only temporary, or if we experience delays as a result of events that are beyond our control, delivery times to our customers could be severely affected. For example, the products manufactured at our Shen Kang, Taiwan facility accounted for 64% of our net sales in 2010. If there was a manufacturing disruption in our Shen Kang facility, we may be unable to meet product delivery requirements and our business, financial condition or results of operations could be negatively affected, even if the disruption was covered in whole or in part by our business interruption insurance. Any significant delay in deliveries to our customers could lead to increased returns or cancellations, expose us to damage claims from our customers or damage our brand and, in turn, negatively affect our business, financial condition or results of operations.
Our business depends substantially on the continuing efforts of our senior management, and our business may be severely disrupted if we lose their services.
We are heavily dependent upon the contributions, talent and leadership of our senior management team, particularly our President and Chief Executive Officer, Mr. Stanley R. Day, Jr. Our senior management team, which has an average tenure with us of approximately 18 years, is key to establishing our focus and executing our corporate strategies and has extensive experience in our industry and knowledge of our systems and processes.
All of our senior management are at-will employees. Given our senior management team’s extensive knowledge of the bicycle component industry and the limited number of direct competitors in the industry, we believe that it could be difficult to find replacements should any of our senior management team leave. Our inability to find suitable replacements for any of the members of our senior management team, even if the loss of service is covered in whole or in part by our key person insurance, could negatively affect our business, financial condition or results of operations.
If we cannot maintain our corporate culture, we could lose the innovation, teamwork and focus that we believe are important to our success.
We believe that an important component of our success is our corporate culture, which we believe fosters innovation, encourages teamwork, cultivates creativity and innovation and promotes focus on execution. We have invested substantial time, energy and resources in building a highly collaborative team that works together effectively in an environment designed to promote openness, honesty, mutual respect and the pursuit of common goals. As we develop the infrastructure of a public company and continue to grow, we may find it difficult to maintain these valuable aspects of our corporate culture. Any failure to preserve our culture could negatively impact our future success, including our ability to attract and retain employees, encourage innovation and teamwork and effectively focus on and pursue our corporate strategy.
We may not be able to sustain our past growth or successfully implement our growth strategy, which may have a negative effect on our business, financial condition or results of operations.
We have experienced rapid growth since our founding over 24 years ago. We grew our net sales from $283.8 million in 2006 to $524.2 million in 2010, and we believe that we are well positioned to grow our business in the future. However, our future growth will depend upon various factors, including the strength of our brand image, our ability to continue to produce innovative, state-of-the art bicycle components, consumer acceptance of our
12
Table of Contents
current and future bicycle components, competitive conditions in the marketplace and the continued growth of the bicycle industry as a whole. If we are unable to sustain our past growth or successfully implement our growth strategy, our business, financial condition or results of operations could be negatively affected.
We are and may become subject to intellectual property suits that could cause us to incur significant costs or pay significant damages or that could prohibit us from selling our products.
As we develop new products, we seek to avoid infringing the valid patents and other intellectual property rights of our competitors. However, from time to time, third parties have claimed, or may claim in the future, that our products infringe upon their proprietary rights. We will evaluate any such claim and, where appropriate, may obtain or seek to obtain licenses or other business arrangements. To date, there have been no significant interruptions in our business as a result of any claims of infringement. We do not currently hold patent infringement insurance. Any claim, regardless of its merit, could be expensive and time consuming to defend. Moreover, if our products are found to infringe third-party intellectual property rights, we may be unable to obtain a license to use such technology, and we could incur substantial costs to redesign our products or to defend legal actions, and such costs could negatively affect our business, financial condition or results of operations.
If we are unable to enforce our intellectual property rights, our reputation and sales could be adversely affected.
Intellectual property is an important component of our business. We currently hold over 550 patents and have obtained an average of over 50 new patents per year since 2002. When appropriate, we assert our rights against those who infringe on our patents, trademarks and trade dress. However, these legal efforts may not be successful in reducing sales of bicycle components by those infringing. Additionally, intellectual property protection may be unavailable or limited in some foreign countries where laws or law enforcement practices may not protect our proprietary rights as fully as in the United States, and it may be more difficult for us to successfully challenge the use of our proprietary rights by other parties in these countries. Furthermore, other bicycle component manufacturers may be able to successfully produce bicycle components which imitate our designs without infringing upon any of our patents, trademarks or trade dress. The failure to prevent or limit infringements and imitations could have a permanent negative impact on the pricing of our products or reduce our product sales, even if we are ultimately successful in limiting the distribution of a product that infringes on us, which in turn may affect our business, financial condition or results of operations.
A reduction or lack of continued growth in the popularity of cycling or the number of cycling enthusiasts could adversely affect our product sales and profits.
We generate all of our revenues from the sale of bicycle components. We attribute our historic growth in part to an increase in the number of cycling enthusiasts purchasing bikes with mid to high-end components. We expect the bicycle component market to continue to grow due to a variety of factors that impact the cycling industry, including continued growth in the number of cycling enthusiasts, increasing average retail selling prices driven by better-performing product designs and technologies, growing participation in cycling events and cycling related sports, improving cycling infrastructure, increasing consumer focus on healthier lifestyle trends, growing focus on the environment and increasing adoption of mid to high-end bicycles in emerging markets. However, if the popularity of cycling or the number of cycling enthusiasts does not increase, or declines, we may fail to achieve future growth and our business, financial condition or results of operations could be negatively affected.
13
Table of Contents
We have significant international operations, and are therefore exposed to currency exchange rate fluctuations.
We maintain fifteen facilities located in the United States, Australia and seven other European and Asian countries and conduct business in U.S. dollars, Euros, Renminbi (RMB), Australian dollars and New Taiwan dollars. Manufacturing and conducting business in the currencies of foreign countries exposes us to fluctuations in foreign currency exchange rates relative to the U.S. dollar.
Foreign currency fluctuations can also affect the prices at which our products are sold in our international markets. Significant unanticipated changes in foreign currency exchange rates make it more difficult for us to manage pricing in our international markets. If we are unable to adjust our pricing in a timely manner to counteract the effects of foreign currency fluctuations, our pricing may not be competitive in the marketplace.
Our financial results are reported in U.S. dollars. As a result, transactions conducted in foreign currencies must be translated into U.S. dollars for reporting purposes based upon the applicable foreign currency exchange rates. Fluctuations in these foreign currency exchange rates can therefore significantly affect period-over-period comparisons.
Our international operations are exposed to risks associated with doing business globally.
As a result of our international presence, we are exposed to increased risks inherent in conducting business outside of the United States. In addition to foreign currency risks, these risks include:
| • | increased difficulty in protecting our intellectual property rights and trade secrets; |
| • | changes in tax laws and the interpretation of those laws; |
| • | exposure to local economic conditions; |
| • | unexpected government action or changes in legal or regulatory requirements; |
| • | geopolitical regional conflicts, terrorist activity, political unrest, civil strife, acts of war, and other political uncertainty; |
| • | changes in tariffs, quotas, trade barriers and other similar restrictions on sales; |
| • | the effects of any anti-American sentiments on our brands or sales of our products; |
| • | increased difficulty in ensuring compliance by employees, agents and contractors with our policies as well as with the laws of multiple jurisdictions, including but not limited to the U.S. Foreign Corrupt Practices Act, local international environmental, health and safety laws, and increasingly complex regulations relating to the conduct of international commerce; |
| • | increased difficulty in controlling and monitoring foreign operations from the United States, including increased difficulty in identifying and recruiting qualified personnel for our foreign operations; and |
| • | increased difficulty in staffing and managing foreign operations or international sales. |
An adverse change in any of these conditions could have a negative effect upon our business, financial condition or results of operations.
If we inaccurately forecast demand for our products, we may manufacture either insufficient or excess quantities, which, in either case, could adversely affect our business.
We plan our manufacturing capacity based upon the forecasted demand for our products. In the OEM channel, our forecasts are based in large part on the number of our component specifications on new bikes and on
14
Table of Contents
projections from the bicycle companies. In the aftermarket channel, our forecasts are based on discussions with our distributors. If actual demand for our products exceeds forecasted demand, we may not be able to produce sufficient quantities of new products in time to fulfill actual demand, which could limit our sales. While we generally manufacture our products upon receipt of customer orders, if actual demand is less than the forecasted demand for our products and we have already manufactured the products, which could result in excess inventories. Either excess or insufficient production could have a negative effect on our business, financial condition or results of operations.
Our new credit facilities will place operating restrictions on us and our subsidiaries, reducing operational flexibility and creating default risks.
Prior to this offering, we intend to enter into our new credit facilities, consisting of a $ million first-lien term credit facility, a $ million second-lien term credit facility and a $ million revolving credit facility, which we expect will be undrawn at the time of the refinancing. The new credit facilities will contain covenants that place restrictions on us and our subsidiaries’ operating activities. We expect that these covenants, among other things, would limit our ability and the ability of our subsidiaries to:
| • | incur additional debt; |
| • | pay dividends and make distributions; |
| • | issue equity interests of subsidiaries; |
| • | make certain investments; |
| • | repurchase stock; |
| • | create liens; |
| • | enter into affiliate transactions; |
| • | merge or consolidate; and |
| • | transfer and sell assets. |
We expect our new revolving credit facility may also require us to maintain compliance with specified financial covenants. Our ability to comply with these financial covenants may be affected by events beyond our control.
If we are unable to comply with the covenants contained in our new credit facilities, it could constitute an event of default under our new credit facilities and our lenders could declare all borrowings outstanding, together with accrued and unpaid interest, to be immediately due and payable. If we are unable to repay or otherwise refinance these borrowings when due, our lenders could sell the collateral securing our credit facilities, which constitutes substantially all of our and our subsidiaries’ assets.
We have substantial leverage, and despite our substantial leverage, we and our subsidiaries may incur additional indebtedness.
As of December 31, 2010, as adjusted for the refinancing and the use of proceeds from this offering, our total indebtedness would have been approximately $ million. Our substantial level of indebtedness could have material negative consequences to us, including:
| • | making it difficult to satisfy our obligations with respect to our indebtedness, which could ultimately cause our lenders to accelerate all amounts under our new credit facilities; |
| • | making it difficult to obtain financing in the future for working capital, capital expenditures, acquisitions or other purposes on commercially reasonable terms or at all; |
15
Table of Contents
| • | increasing our vulnerability to general economic downturns and adverse industry conditions; |
| • | reducing our ability to further access the credit markets; |
| • | placing us at a competitive disadvantage compared to our competitors that have less indebtedness; and |
| • | limiting our flexibility in planning for, or reacting to, changes in our business and industry, including our ability to invest in product development. |
As of December 31, 2010, as adjusted for the refinancing, our new revolving credit facility would have provided for additional borrowings of $ million. In addition, although our new credit facilities will contain restrictions on the incurrence of other additional indebtedness, such restrictions are subject to a number of qualifications and exceptions, and under certain circumstances indebtedness incurred in compliance with such restrictions could be substantial. To the extent new indebtedness is added to our current debt levels, the risks described in the paragraph above would increase.
An increase in interest rates would increase the interest costs on our new credit facilities and any additional variable rate indebtedness we may incur and could adversely impact our ability to refinance our indebtedness.
Borrowings under our new credit facilities will be based on floating rates. An increase in interest rates would increase our debt service obligations and therefore reduce cash flow available for other corporate purposes. Further, rising interest rates could limit our ability to refinance our existing indebtedness when it matures and increase interest costs on any indebtedness that is refinanced. We may from time to time enter into agreements such as interest rate swaps or other interest rate hedging contracts. While these agreements may lessen the impact of rising interest rates, there can be no assurance that any hedging transactions will fully protect us from interest rate risk.
We are subject to certain safety and labor risks in our manufacturing facilities.
We employ approximately 2,200 employees worldwide, a large percentage of which work at our manufacturing facilities. Our business involves complex manufacturing processes that can be dangerous to our employees. Although we employ safety procedures in the design and operation of our facilities, there is a risk that an accident or death could occur in one of our facilities. Any accident could result in manufacturing delays, which could negatively affect our business, financial condition or results of operations. Also, the costs to defend any action or the potential liability resulting from any such accident or death, to the extent not covered by insurance, and any negative publicity associated therewith, could have a negative effect on our business, financial condition or results of operations. In addition, we have unionized workers in some of our European locations. Any strike, prolonged work stoppage or failure by us to reach a new agreement upon expiration of other union contracts could also have a negative effect on our business, financial condition or results of operations.
We are and may in the future be subject to product liability claims, recalls or warranty claims, which could be expensive or damage our reputation and result in a diversion of management resources.
We are and in the future may be subject to product liability claims and other claims relating to bodily injury, property damage or other losses that result, or allegedly result, from the failure of our products to perform as expected. We may incur losses resulting from these claims or the defense of these claims. Currently we maintain product liability coverage, but there is a risk that any claims or liabilities will exceed our insurance coverage or otherwise be limited. We also cannot guarantee that we will be able to maintain product liability coverage in the future.
In the past, some of our products have been subject to recalls and in the future we may be required to or voluntarily participate in recalls involving our bicycle components if any prove to be defective. In addition to the
16
Table of Contents
direct costs of any claim or product recall, any such claim or recall could adversely affect our brand image and have a negative effect on our business, financial condition or results of operations.
We are involved from time to time in various legal and regulatory proceedings and claims, which may have a negative effect on business or financial condition or results of operations.
We are involved in various legal and regulatory proceedings and claims that, from time to time, may be significant. These are typically claims that arise in the normal course of business including, without limitation, commercial or contractual disputes, including disputes with our customers, suppliers or competitors, intellectual property matters, personal injury claims, environmental matters, tax matters and employment matters. These proceedings and claims could negatively affect our business, financial condition or results of operations.
We rely on increasingly complex information systems for management of our manufacturing, distribution, sales and other functions. If our information systems fail to perform these functions adequately or if we experience an interruption in our operations, our business could suffer.
All of our major operations, including manufacturing, distribution, sales and accounting, are dependent upon our complex information systems. Our information systems are vulnerable to damage or interruption from, among other things:
| • | earthquake, fire, flood, hurricane and other natural disasters; |
| • | power loss, computer systems failure, internet and telecommunications or data network failure; and |
| • | hackers, computer viruses, software bugs or glitches. |
Any damage or significant disruption in the operation of such systems or the failure of our information systems to perform as expected could disrupt our operations, reduce our efficiency, delay our fulfillment of customer orders or require significant unanticipated expenditures to correct, and thereby have a negative effect on our business, financial condition or results of operations.
We depend on a limited number of suppliers for some of our products, and the loss of any of these suppliers or an increase in cost of raw materials could harm our business.
Because we dual or multi source most materials required for our products, we do not believe we are dependent on any single supplier. If, however, our current suppliers, in particular the minority of those which are single-source suppliers, are unable to fulfill orders, or if we are required to transition to other suppliers, we could experience significant production delays or disruption to our business.
In addition, we purchase various raw materials and component parts in order to manufacture our products. The main commodity items purchased for production include steel, aluminum, carbon fiber and plastic. Historically, price fluctuations for these raw materials and component parts have not had a material impact on our business. In the future, however, if we experience material increases in the price of raw materials or component parts and are unable to pass on those increases to our customers, or there are shortages in the availability of such raw materials or component parts, it could negatively affect our business, financial condition or results of operations. In addition, some of our raw materials are sourced from Japan, including a significant portion of our carbon fiber. Although the recent earthquake and tsunami in Japan have not had a negative impact on our business or supply of raw materials, we continue to monitor this matter.
17
Table of Contents
Changes in equipment standards promulgated by major cycling associations could negatively affect us.
We believe that we have products that conform to all equipment standards promulgated by major cycling associations, such as the Union Cycliste Internationale or the USA Triathlon. However, our future products may not satisfy these standards, or existing standards may be altered in ways that adversely affect the sales of our current or future products. If a change in rule were adopted and we did not have, or were unable to manufacture, a conforming product, we may be unable to sponsor athletes in various competitions, and our business, financial condition or results of operations could be negatively affected.
New laws, regulations or rules or changes in existing laws, regulations or rules could negatively affect our business.
We are subject to a variety of federal, state, local and foreign laws and regulations. Governmental regulations also affect taxes and levies, capital markets, healthcare costs, energy usage, international trade, immigration and other labor issues, all of which may have a direct or indirect negative effect on our business and our customers’ and suppliers’ businesses. We cannot predict the substance or impact of pending or future legislation, regulations or rules, or the application thereof. Changes in these laws, regulations or rules, the interpretation thereof or the introduction of new laws, regulations and rules could increase the costs of doing business for us or our customers or suppliers or restrict our actions, and therefore negatively affect our business, financial condition or results of operations.
We are subject to environmental laws and regulation and potential exposure for environmental costs and liabilities.
Our operations, facilities and properties are subject to a variety of foreign, federal, state and local laws and regulations relating to health, safety and the protection of the environment. These environmental laws and regulations include those relating to the use, generation, storage, handling, transportation, treatment and disposal of solid and hazardous materials and wastes, emissions to air, discharges to waters and the investigation and remediation of contamination. Failure to comply with such laws and regulations can result in significant fines, penalties, costs, liabilities or restrictions on operations that could negatively affect our business, financial condition or results of operations.
Our manufacturing operations involve the handling of materials and wastes, some of which are or may be regulated as hazardous substances. We could be subject to requirements related to the remediation of, or the liability for, substances that have been or are released to the environment at properties currently or formerly owned or operated by us, at or from adjacent properties, or at properties to which we send substances for treatment or disposal. Such remediation requirements and liability may be imposed without regard to fault and damage from releases can be substantial.
We believe that our operations are in substantial compliance with applicable environmental laws and regulations. Our compliance with such laws and regulations has not had, nor is it expected to have, a material impact on our capital expenditures, earnings or competitive position. However, additional environmental issues relating to presently known or unknown matters could give rise to currently unanticipated investigation, assessment or expenditures. Furthermore, through acquisitions over the years, we have acquired a number of facilities, and we could incur material costs and liabilities relating to activities that predate our ownership. In addition, future events, such as changes in existing laws and regulations or their interpretation could give rise to additional compliance costs, capital expenditures or liabilities. Compliance with more stringent laws or regulations as well as different interpretations of existing laws, more vigorous enforcement by regulators or unanticipated events could require additional expenditures that may materially affect our business, financial condition or results of operations.
18
Table of Contents
We may not be able to effectively integrate businesses we acquire or we may not be able to identify or consummate any future acquisitions on favorable terms, or at all.
Since 1995, we have achieved growth due in part to our ability to successfully acquire and integrate complementary businesses. Our acquisitions include the bicycle division of Mannesman Sachs AG (1997), RockShox, Inc. (2002), the bicycle business of Avid, LLC (2004), Truvativ International Co., Ltd. (2004) and Compositech, Inc. (Zipp) (2007). Acquisitions may continue to play a role in our future growth. Any future acquisitions that we might make, however, are subject to various risks and uncertainties, including:
| • | the inability to integrate effectively the operations, products, technologies and personnel of the acquired companies (some of which may be spread out in different geographic regions); |
| • | the potential disruption of existing business and diversion of management’s attention from day-to-day operations; |
| • | the inability to maintain uniform standards, controls, procedures and policies or correct deficient standards, controls, procedures and policies, including internal controls and procedures, sufficient to satisfy regulatory requirements of a public company in the United States; |
| • | the incurrence of contingent obligations that were not anticipated at the time of the acquisitions; |
| • | the need or obligation to divest portions of the acquired companies; and |
| • | the potential impairment of relationships with customers. |
Also, the integration of any newly acquired businesses may not achieve any anticipated cost savings or operating synergies, or we may not be able to effectively manage our operations at an increased scale of operations resulting from such acquisitions.
In addition, we may not be able to identify or consummate any future acquisitions on favorable terms, or at all. We may have limited opportunities to acquire businesses that we believe will enhance our product lines or our business.
Changes in our effective tax rate and our provision for income taxes could negatively affect our business, financial condition or results of operations.
Due to the global nature of our operations, we are subject to federal and state income taxes in the United States and various foreign jurisdictions. Our effective tax rate and our provision for income taxes is affected by changes in the mix of earnings and losses in jurisdictions with differing statutory tax rates, certain non-tax deductible expenses, including those arising from the requirement to expense stock options, changes in the valuation of our deferred tax assets and liabilities, and changes in accounting principles. Our tax liabilities are also impacted by the amounts we record in intercompany transactions for services, licenses, funding, and other items, which may be challenged by the tax authorities in the jurisdictions in which we operate. In addition, changes to tax laws in the jurisdictions in which we operate, such as an increase in tax rates or an adverse change in the treatment of an item of income or expense, could result in a material increase in our tax expense.
Currently, our foreign subsidiaries are treated as disregarded or transparent entities for U.S. federal income tax purposes, with the result that income generated by our foreign subsidiaries is subject to U.S. federal income tax on a current basis to the members of SRAM Holdings, LLC, in addition to the taxes imposed by the foreign jurisdictions in which the income is earned. In addition, distributions of earnings and other payments to us from our foreign subsidiaries may be subject to foreign withholding taxes. In general, a U.S. taxpayer may claim a foreign tax credit against its U.S. federal income tax liability for foreign income and withholding taxes paid on
19
Table of Contents
its foreign-source income. However, the amount of foreign tax credit that we may claim against our U.S. federal income tax liability is subject to many limitations that may significantly restrict our ability to claim a credit for all of the foreign taxes we pay, and we may incur incremental tax costs as a result of these limitations.
The loss of one or more of our top customers could have a significant negative impact on our business, financial condition or results of operations.
The customer base for our products is limited, as there are a limited number of bicycle companies who produce new, fully-assembled bicycles and a limited number of independent bicycle retailers and distributors who sell aftermarket and accessory components. Accordingly, we invest significant time and resources in building strong relationships with each of our customers. No bicycle company represented 10% or more of our total net sales and no distributor or retailer represented more than 4.5% of our total net sales for the year ended December 31, 2010. During this same period, our top 10 bicycle company customers accounted for approximately 37% of our total net sales and our top 10 distributors accounted for approximately 16% of our total net sales. We do not generally enter into long-term contracts with our customers and, as a result, one or more of such customers could elect not to continue doing business with us at any time. A loss of one or more customers could have a negative effect on our business, financial condition or results of operations.
Risks related to our corporate structure
Control by our principal stockholders could adversely affect our other stockholders.
When this offering is completed, the Day family will beneficially own approximately % of the voting power of our common stock (or % of the voting power if the underwriters exercise in full their option to purchase additional shares). As a result, the Day family will be able to exert a significant degree of influence or actual control over our management and affairs and over matters requiring stockholder approval, including the election of directors, a merger, consolidation or sale of all or substantially all of our assets and other significant business or corporate transactions. This concentrated control will limit the ability of other stockholders to influence corporate matters and, as a result, we may take actions that our other stockholders do not view as beneficial. For example, this concentration of ownership could have the effect of delaying or preventing a change in control or otherwise discouraging a potential acquirer from attempting to obtain control of SRAM, which in turn could cause the market price of our Class A common stock to decline or prevent our stockholders from realizing a premium over the market price for their Class A common stock. In addition, under the “controlled company” exemption to the independence requirements of the NYSE or Nasdaq, we will be exempt from the rules of the NYSE or Nasdaq that require that our board of directors be comprised of a majority of independent directors, that our compensation committee be comprised solely of independent directors and that our nominating and governance committee be comprised solely of independent directors.
We are a holding company with no operations of our own, and we will depend on distributions from SRAM Holdings, LLC and its subsidiaries to meet our ongoing obligations and, if applicable, to pay cash dividends on our common stock.
We are a holding company with no operations of our own and we have no independent ability to generate revenue. Consequently, our ability to obtain operating funds depends upon distributions from SRAM Holdings, LLC and its subsidiaries. The distribution of cash and other transfers of funds by SRAM Holdings, LLC and its subsidiaries to us will be subject to restrictions, including restrictions contained in our new credit facilities. We expect that our new credit facilities will limit our ability to distribute cash based upon certain covenants. We will be unable to pay dividends to our stockholders or pay other expenses outside the ordinary course of business if SRAM Holdings, LLC is unable to distribute cash to us.
Following the reorganization, we will hold directly or indirectly, 100% of the equity interests of SRAM Holdings, LLC. Because SRAM Holdings, LLC is treated as a partnership for U.S. federal and state income tax purposes, we
20
Table of Contents
and our subsidiaries, as members of SRAM Holdings, LLC, will incur U.S. federal and state income taxes on our proportionate shares of any net taxable income of SRAM Holdings, LLC. To the extent we and our subsidiaries need funds to pay such taxes or for any other purpose, and SRAM Holdings, LLC is unable to provide such funds because of limitations in its new credit facilities or other restrictions, such inability to pay could have a negative effect on our business, financial condition and results of operations.
A significant portion of our business is conducted through foreign subsidiaries and our failure to generate sufficient cash flow from these subsidiaries, or otherwise repatriate or receive cash from these subsidiaries, could result in our inability to repay our indebtedness and other liabilities.
For the year ended December 31, 2010, 86.4% of our net sales were generated outside of the United States. Our ability to meet our debt service and other obligations with cash from foreign subsidiaries will depend upon the results of operations of these subsidiaries and may be subject to legal, contractual or other restrictions and other business considerations. In addition, dividend, interest, royalty and other payments to us from our foreign subsidiaries may be subject to foreign withholding taxes, which could reduce the amount of funds we receive from our foreign subsidiaries. Distributions of earnings and other payments received from our foreign subsidiaries may also be subject to fluctuations in currency exchange rates and legal and other restrictions on repatriation, which could further reduce the amount of funds we receive from our foreign subsidiaries. Therefore, to the extent that we must use cash generated in foreign jurisdictions to make principal or interest payments on our indebtedness or other obligations, there may be a cost associated with repatriating cash to the United States.
If we are determined to be an investment company, we would become subject to burdensome regulatory requirements and our business activities would be restricted.
Generally, a company that does not actively trade in securities may nevertheless be an investment company as defined in the Investment Company Act of 1940, as amended, which we refer to as the Investment Company Act, if it owns investment securities having a value exceeding 40% of the value of its total assets (excluding U.S. government securities and cash items). Following this offering, our sole significant asset will be our ownership of units in SRAM Holdings, LLC. As sole manager of SRAM Holdings, LLC, we will control SRAM Holdings, LLC. We believe our interest in SRAM Holdings, LLC is not an investment security as that term is used in the Investment Company Act. After this offering, we and SRAM Holdings, LLC intend to continue to structure our organizations and conduct our operations so that we are not deemed to be an investment company under the Investment Company Act. A determination, however, that our interest in SRAM Holdings, LLC is an investment security for purposes of the Investment Company Act, could result in our being considered an investment company. If that were to happen, we could become subject to registration and other burdensome requirements of the Investment Company Act, including limitations on our capital structure, our ability to issue securities and our ability to enter into transactions with our affiliates. A need to comply with those requirements could make it impractical for us to continue our business as currently conducted and therefore could have a negative effect on our business, financial condition or results of operations.
Our anti-takeover provisions may delay or prevent a change of control, which could negatively affect our stock price.
Upon the consummation of this offering, our amended and restated certificate of incorporation and amended and restated bylaws will contain provisions that may make it difficult to remove our board of directors and management and may discourage or delay “change of control” transactions, which could negatively affect the price of our stock. These provisions include, among others:
| • | holders of our Class A common stock vote together with holders of our Class B common stock on all matters, unless otherwise required by law, including the election of directors, and our amended and restated certificate of incorporation prohibits cumulative voting in the election of directors; |
21
Table of Contents
| • | immediately following this offering, our board of directors will consist of a single class, with each director serving a one-year term. However, if all shares of our Class B common are converted into Class A common stock or otherwise cease to be outstanding, our board of directors will be divided into three classes, with each class serving for a staggered three-year term; |
| • | vacancies on our board of directors, and any newly created director positions created by the expansion of the board of directors, may be filled only by a majority of remaining directors then in office; |
| • | immediately following this offering, our stockholders may act by written consent. However, if all shares of our Class B common stock are converted into Class A common stock or otherwise cease to be outstanding, actions to be taken by our stockholders will only be permitted to be effected at an annual or special meeting of our stockholders and not by written consent; |
| • | special meetings of our stockholders may be called by our chairman, president, chief executive officer or a majority of our board of directors. In addition, immediately following this offering, our secretary must also call a special meeting of stockholders upon the written request of stockholders entitled to cast not less than a majority of all the votes entitled to be cast at that meeting. However, if all shares of our Class B common are converted into Class A common stock or otherwise cease to be outstanding, our stockholders will not be permitted to call special meetings of our stockholders; |
| • | our amended and restated bylaws establish an advance notice procedure for stockholders to submit proposed nominations of persons for election to our board of directors and other proposals for business to be brought before an annual or special meeting of our stockholders; and |
| • | our board of directors may issue up to shares of preferred stock, with designations, rights and preferences as may be determined from time to time by our board of directors. |
Risks related to this offering
The requirements of being a public company may strain our resources and affect our ability to attract and retain qualified board members.
As a public company, we will incur significant legal, accounting and other expenses that we have not incurred as a private company, including costs associated with public company reporting requirements. We also have incurred and will incur costs associated with the Sarbanes-Oxley Act of 2002 and related rules implemented by the Securities and Exchange Commission (SEC) and the NYSE or Nasdaq. The expenses incurred by public companies generally for reporting and corporate governance purposes have been increasing and are difficult to predict. We expect these rules and regulations to increase our legal and financial compliance costs and to make some activities more time-consuming and costly, although we are currently unable to estimate these costs with any degree of certainty. These laws and regulations could also make it more difficult or costly for us to obtain certain types of insurance, including director and officer liability insurance, and we may be forced to accept reduced policy limits and coverage or incur substantially higher costs to obtain the same or similar coverage. These laws and regulations could also make it more difficult for us to attract and retain qualified persons to serve on our board of directors, our board committees or as our executive officers. Furthermore, if we are unable to satisfy our obligations as a public company, we could be subject to delisting of our Class A common stock, fines, sanctions and other regulatory action and potentially civil litigation. In addition, our senior management has no prior experience managing a publicly traded company or complying with the increasingly complex laws pertaining to public companies described above. These obligations will require substantial attention from our senior management and partially divert their attention away from the day-to-day management of our business, which could negatively impact our business, financial condition or results of operations.
22
Table of Contents
If we fail to maintain adequate internal control over financial reporting in accordance with Section 404 of Sarbanes-Oxley or if we do not remedy our material weaknesses or significant deficiencies in our internal controls it could result in inaccurate financial reporting and have a negative impact on the price of our Class A common stock or our business.
As a public company, we will be required to comply with the standards adopted by the Public Company Accounting Oversight Board in compliance with the requirements of Section 404 of Sarbanes-Oxley regarding internal control over financial reporting. Prior to becoming a public company, we are not required to be compliant with the requirements of Section 404. The process of becoming compliant with Section 404 may divert internal resources and will take a significant amount of time and effort to complete. We may experience higher than anticipated operating expenses, as well as increased independent auditor fees during the implementation of these changes and thereafter. We are required to be compliant under Section 404 with our second Annual Report on Form 10-K after the completion of this offering and at that time our management will be required to deliver a report that assesses the effectiveness of our internal control over financial reporting. We will also be required to deliver an attestation report of our auditors on our management’s assessment of our internal controls. Completing documentation of our internal control system and financial processes, remediation of control deficiencies, and management testing of internal controls will require substantial effort by us.
In preparation for this offering and for future compliance with Section 404 of Sarbanes-Oxley, we and our independent auditors identified material weaknesses in our internal controls over financial reporting. A material weakness is a deficiency, or combination of deficiencies, in internal control over financial reporting, such that there is a reasonable possibility that a material misstatement of our financial statements will not be prevented, or detected and corrected on a timely basis. The material weaknesses were attributed to us not maintaining sufficient: external reporting, technical accounting and tax functions; financial reporting and closing processes with respect to complex transactions; and written policies and procedures, in each case to meet our needs as a public company. Specifically, we do not currently maintain a sufficient complement of personnel with an appropriate level of accounting and financial reporting knowledge, experience and training in the application of U.S. generally accepted accounting principles as will be required of us as a public company. We have begun implementing measures and plan to take additional steps to remediate the underlying causes of our material weaknesses. We are currently in the process of reviewing, documenting and testing our internal control over financial reporting. We are enhancing the technical capability of our staff by adding resources and personnel to the accounting and finance team. Until such time as we are able to retain permanent personnel, we are engaging outside consultants to assist us.
If the steps we intend to take do not remediate these material weaknesses in a timely manner, we will not be able to conclude that we have and maintain effective internal control over financial reporting. In addition, we may identify additional material weaknesses or significant deficiencies in the future. In either case, our independent registered accounting firm may not be able to issue an unqualified report on the effectiveness of our internal control over financial reporting. As a result, our ability to report our financial results on a timely and accurate basis may be adversely affected, we may be subject to sanctions or investigation by regulatory authorities and investors may lose confidence in our financial information, which in turn could adversely affect the market price of our Class A common stock.
The market price of our common stock may be volatile, which could cause the value of an investment in our stock to decline.
The market price of our common stock may fluctuate substantially due to a variety of factors, many of which are beyond our control, including:
| • | announcements concerning our competitors or the bicycle industry; |
23
Table of Contents
| • | strategic actions by us or our competitors, such as acquisitions or restructurings; |
| • | industry-specific economic conditions; |
| • | changes in financial estimates or recommendations by securities analysts or failure to meet analysts’ or our own performance expectations; |
| • | risks relating to our business and industry, including those described above; and |
| • | general market, political and economic conditions. |
As a result of these and other factors, investors in our Class A common stock may not be able to resell their shares at or above the initial offering price or may not be able to resell them at all.
The stock markets in general have experienced substantial volatility that has often been unrelated to the operating performance of particular companies. These types of broad market fluctuations may adversely affect the trading price of our Class A common stock. Furthermore, price volatility may be greater if the public float and trading volume of our Class A common stock is low.
In addition, in the past, stockholders have sometimes instituted securities class action litigation against companies following periods of volatility in the market price of their securities. Any similar litigation against us could result in substantial costs, divert management’s attention and resources, and have a negative effect on our business, financial condition or results of operations.
No public market for our Class A common stock currently exists and an active trading market may not develop or be sustained following this offering.
Before this offering, there has been no public market for our Class A common stock. An active, liquid trading market for our Class A common stock may not develop or be sustained following this offering. We intend to apply to have our Class A common stock listed on the NYSE or Nasdaq, but we cannot assure you that our application will be approved. In addition, we cannot assure you as to the liquidity of any such market that may develop or the price that our stockholders may obtain for their shares of our Class A common stock.
If securities or industry analysts do not publish research or reports about our business, or publish negative reports about our business, our share price and trading volume could decline.
The trading market for our Class A common stock depends in part on the research and reports that securities or industry analysts publish about us or our business. If one or more of the analysts who cover us downgrade our stock or publish inaccurate or unfavorable research about our business, cease coverage of our company or fail to publish reports on us regularly, or if our results of operations are not as favorable as one or more of such analysts have projected, demand for our stock could decrease, which might cause our stock price and trading volume to decline.
Purchasers in this offering will experience immediate and substantial dilution in the book value of their investment.
The assumed initial public offering price of our Class A common stock is substantially higher than the pro forma net tangible book value per share of our Class A common stock outstanding prior to this offering. Therefore, if you purchase our Class A common stock in this offering, you will incur immediate substantial dilution in pro forma net tangible book value per share from the price you paid. For a further description of the dilution that you will experience immediately after this offering, please see “Dilution.”
24
Table of Contents
The value of our Class A common stock may be adversely affected by additional issuances of common stock by us or sales by our principal stockholders.
Any future issuances or sales of Class A common stock by us will be dilutive to our existing common stockholders. Upon consummation of this offering, we will have shares of Class A common stock outstanding and shares of Class B common stock outstanding, assuming no exercise of the underwriters’ option to purchase additional shares. All of the shares of Class A common stock sold in this offering will be freely tradable without restrictions or further registration under the Securities Act. Subject to certain exceptions, the holders of approximately % of the shares of our common stock have signed lock-up agreements with the underwriters of this offering, under which they have agreed not to sell, transfer or dispose of, directly or indirectly, any shares of our Class A common stock or any securities convertible into or exercisable or exchangeable for Class A common stock without the prior written consent of the underwriters for a period of 180 days, subject to a possible extension under certain circumstances, after the date of this prospectus. See “Underwriting.” After this offering, the holders of approximately shares of our Class B common stock will be entitled to rights with respect to registration of such shares under the Securities Act pursuant to a registration rights agreement. See “Certain relationships and related person transactions—2011 refinancing and reorganization—Registration rights.” Sales of substantial amounts of our common stock in the public or private market, a perception in the market that such sales could occur, or the issuance of securities exercisable or convertible into our common stock, could adversely affect the prevailing price of our Class A common stock.
We do not intend to pay cash dividends for the foreseeable future.
SRAM International Corporation was formed on April 29, 2011 and has never declared or paid cash dividends on its common stock. We currently intend to retain our future earnings, if any, to finance the further development and expansion of our business and do not intend to pay cash dividends in the foreseeable future. Any future determination to pay dividends will be at the discretion of our board of directors and will depend on our financial condition, results of operations, contractual restrictions, capital requirements, business prospects, restrictions contained in current or future financing instruments, including our new credit facilities, and such other factors as our board of directors deems relevant.
Even if we decide in the future to pay any dividends, we are a holding company with no independent operations of our own. As a result, we depend on SRAM Holdings, LLC and its subsidiaries for cash to pay our obligations and make dividend payments. Deterioration in the financial conditions, earnings or cash flow of SRAM Holdings, LLC and its subsidiaries for any reason could limit or impair their ability to pay cash distributions or other distributions to us and thereby limit or impair our ability to pay dividends to our stockholders.
25
Table of Contents
Special note regarding forward-looking statements
This prospectus includes forward-looking statements. The words “believe,” “may,” “could,” “estimate,” “continue,” “anticipate,” “intend,” “expect,” “predict,” “potential” and similar expressions, as they relate to our company, our business and our management, are intended to identify forward-looking statements. We have based these forward-looking statements largely on our current expectations and projections about future events and financial trends affecting the financial condition of our business. Forward-looking statements should not be read as a guarantee of future performance or results, and will not necessarily be accurate indications of the times at, or by, which such performance or results will be achieved. Forward-looking statements are based on information available at the time those statements are made and/or management’s good faith belief as of that time with respect to future events, and are subject to risks and uncertainties that could cause actual performance or results to differ materially from those expressed in or suggested by the forward-looking statements. Important factors that could cause such differences include, but are not limited to:
| • | our ability to introduce new products into the market; |
| • | changes in the competitive landscape for bicycle components; |
| • | unfavorable economic conditions; |
| • | a weakening of our brand image; |
| • | a disruption in the operations of our manufacturing facilities;. |
| • | loss of our senior management; |
| • | changes in the popularity of cycling or the number of cycling enthusiasts; and |
| • | other risks included under “Risk factors” and risks described in “Management’s discussion and analysis of financial condition and results of operations” in this prospectus. |
In light of these risks and uncertainties, the forward-looking events and circumstances discussed in this prospectus may not occur and actual results could differ materially from those anticipated or implied in the forward-looking statements.
All forward-looking statements attributable to us or persons acting on our behalf are expressly qualified in their entirety by the cautionary statements set forth above. Forward-looking statements speak only as of the date of this prospectus. You should not put undue reliance on any forward-looking statements. We assume no obligation to update forward-looking statements to reflect actual results, changes in assumptions or changes in other factors affecting forward-looking information, except to the extent required by applicable laws. If we update one or more forward-looking statements, no inference should be drawn that we will make additional updates with respect to those or other forward-looking statements.
26
Table of Contents
The refinancing and reorganization
Current organizational and ownership structure
Since the completion of the 2008 recapitalization in which Trilantic and its co-investors acquired a $234.8 million equity interest in SRAM, our business has been conducted through SRAM, LLC, a wholly-owned subsidiary of SRAM Holdings, LLC. For a description of the 2008 transaction, see “Certain relationships and related person transactions—Trilantic 2008 investment and recapitalization.”
Prior to the refinancing and reorganization described below, the ownership of SRAM Holdings, LLC is as follows:
| • | Trilantic and its co-investors own 3,640,000 Class A units (100% of the Class A units). As Class A unit holders, Trilantic and its co-investors are entitled to a Class A priority interest in the amount of their initial $234.8 million investment plus a 10% annual preferred return, compounded quarterly. As of , 2011, the Class A priority interest consisted of the $234.8 million initial investment plus approximately $ million of accrued preferred return. The Class A unit holders are also entitled to participate in all distributions after the repayment of their priority interest. |
| • | The Day family, SRAM management and current and former directors and employees indirectly own 5,460,000 Class B units (100% of the Class B Units) through two holding corporations: SRAM-SP2, Inc. and SRAM International, Inc. Class B unit holders are entitled to participate in all distributions after the repayment of the Class A priority interest. |
| • | SRAM management and current and former directors and employees own 539,533 incentive units. Incentive unit holders are entitled to participate in distributions after the repayment of the Class A priority interest subject to the distribution thresholds established at the time the incentive units were granted. Distributions payable with respect to unvested incentive units are retained by SRAM until the units vest. The board of SRAM Holdings, LLC will approve the immediate vesting of these units in connection with this offering. |
Refinancing
Prior to the reorganization and this offering, SRAM, LLC intends to enter into new credit facilities consisting of a first-lien term facility, a second-lien term facility and a revolving facility. The aggregate proceeds from the new credit facilities will be approximately $ million. The proceeds from the new credit facilities will be used to (i) repay the entire outstanding amount under our existing credit facilities, which as of , 2011, was approximately $ million, (ii) acquire all of the 3,640,000 Class A units of SRAM Holdings, LLC held by Trilantic and its co-investors for $ million and (iii) pay all fees and expenses related to the refinancing. The $ million received by Trilantic and its co-investors will be in full payment for all of their interests in SRAM Holdings, LLC and will consist of $ million in respect of the common participation right and $ million in respect of the priority interests of the 3,640,000 Class A units held by Trilantic and its co-investors. In connection with these transactions, SRAM Holdings, LLC will amend and restate its operating agreement to create a single class of common units and eliminate the corporate governance and liquidity rights of Trilantic and its co-investors. We refer to the entering into of our new credit facilities, the use of proceeds therefrom and the related amendment to the SRAM Holdings LLC operating agreement as the refinancing. Following the refinancing, Trilantic and its co-investors will have no remaining ownership of SRAM Holdings, LLC.
Reorganization
On April 29, 2011, SRAM International Corporation, a Delaware corporation, was formed to be the issuer for this offering. Immediately prior to the consummation of this offering, the remaining equity holders of SRAM
27
Table of Contents
Holdings, LLC, after giving effect to the refinancing described above, will enter into a reorganization pursuant to which SRAM International Corporation, will acquire 100% of the equity interests of SRAM Holdings, LLC, either directly or through one or more wholly-owned subsidiaries, and the equity holders of SRAM Holdings, LLC will exchange their direct or indirect equity interests in SRAM Holdings, LLC for shares of common stock of SRAM International Corporation.
The following steps will be taken to effect the reorganization:
| • | SRAM International Corporation will file an amended and restated certificate of incorporation which will authorize two classes of common stock, Class A common stock and Class B common stock, each having the terms described in “Description of capital stock.” |
| • | SRAM Holdings, LLC will make a $ million distribution to its remaining equity holders to cover the estimated federal and state income taxes payable with respect to their allocable shares of the estimated taxable income of SRAM Holdings, LLC from January 1, 2011 through the closing date of this offering. |
| • | SRAM International Corporation will indirectly acquire common units of SRAM Holdings, LLC held by the Day family, SRAM management and current and former directors and employees through SRAM-SP2, Inc. The Day family will receive shares of Class B common stock of SRAM International Corporation in exchange for their shares of stock of SRAM-SP2, Inc. Of these shares, shares will be converted to Class A common stock and will be sold in this offering. The SRAM management and current and former directors and employees will receive shares of Class A common stock of SRAM International Corporation in exchange for their shares of stock of SRAM-SP2, Inc. Of these shares, shares will be sold in this offering. |
| • | SRAM International Corporation will indirectly acquire the remaining common units of SRAM Holdings, LLC held by foreign employees of SRAM through SRAM International Inc. The stockholders of SRAM International, Inc. will receive shares of Class A common stock of SRAM International Corporation in exchange for their shares of stock of SRAM International, Inc. Of these shares, shares will be sold in this offering. |
| • | SRAM management and current and former directors and employees holding incentive units of SRAM Holdings, LLC will exchange their incentive units for shares of Class A common stock of SRAM International Corporation. Of these shares, shares will be sold in this offering. |
We refer to the series of transactions listed above as the reorganization.
28
Table of Contents
New organizational and capital structure
The following diagram depicts our organizational structure immediately after the completion of the reorganization and this offering:
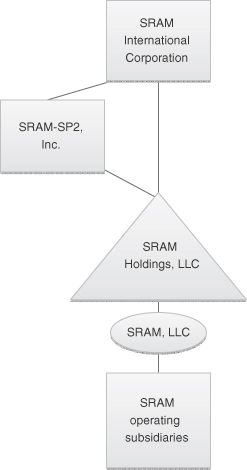
Immediately after the consummation of this offering, the ownership of SRAM International Corporation will be as follows:
| • | The Day family will collectively own shares of our Class B common stock, representing 100% of our Class B common stock and % of the total voting power of SRAM International Corporation (or % of the total voting power if the underwriters exercise in full their option to purchase additional shares). |
| • | SRAM management and current and former directors and employees will own shares of our Class A common stock, representing % of our Class A common stock and approximately % of the total voting power of SRAM International Corporation (or % of the total voting power if the underwriters exercise in full their option to purchase additional shares). |
| • | The investors in this offering will collectively own shares of our Class A common stock, representing % of our Class A common stock and % of the total voting power of SRAM International Corporation (or % of the total voting power if the underwriters exercise in full their option to purchase additional shares). |
29
Table of Contents
In addition, shares of Class A common stock will be issuable under the SRAM International Corporation 2011 Incentive Award Plan that we will adopt prior to the consummation of this offering.
Holding company structure
Upon completion of this offering, SRAM International Corporation will be a holding company that controls SRAM Holdings, LLC, which in turn will control our operating company, SRAM, LLC. We will have no business operations or material assets other than our direct and indirect ownership of 100% of the outstanding equity interests in of SRAM Holdings, LLC and SRAM, LLC and its subsidiaries and we will control all of the business and affairs of SRAM Holdings, LLC and SRAM, LLC and its subsidiaries. We will consolidate the financial results of SRAM Holdings, LLC and SRAM, LLC and its subsidiaries into our consolidated financial statements. Our only source of cash flow from operations will be distributions from SRAM Holdings, LLC pursuant to its amended and restated operating agreement. See ‘‘Risk factors—Risks related to our corporate structure—We are a holding company with no operations of our own, and we will depend on the distributions from SRAM Holdings, LLC and its subsidiaries to meet our ongoing obligations and, if applicable, to pay cash dividends on our common stock.”
30
Table of Contents
We estimate that the net proceeds to us from the sale of our Class A common stock in this offering will be approximately $ million, based on an offering price of $ per share, the midpoint of the range set forth on the cover page of this prospectus, after deducting assumed underwriting discounts and commissions payable by us. We intend to use $ million of the proceeds to us to repay $ million of indebtedness under our new credit facilities, which we intend to enter into prior to this offering, and $ million to pay fees and expenses related to this offering. See “The refinancing and reorganization.” The material terms of our new credit facilities have not yet been determined. The proceeds of the new credit facilities will be used to repay all outstanding amounts under our existing credit facilities, which as of , 2011 was $ , and to directly or indirectly acquire all of the equity interests in SRAM Holdings, LLC held by Trilantic and its co-investors.
A $1.00 increase or decrease in the assumed initial public offering price of $ per share would increase or decrease, respectively, the net proceeds to us from this offering by approximately $ million, assuming the number of shares offered by us, as set forth on the cover page of this prospectus, remains the same and after deducting assumed underwriting discounts and commissions.
We will not receive any proceeds from the sale of shares of our Class A common stock by the selling stockholders.
31
Table of Contents
We have never declared or paid cash dividends on our common stock. We do not anticipate declaring or paying any cash dividends on our common stock. We are a holding company and have no material assets other than our direct and indirect ownership of SRAM Holdings, LLC and SRAM, LLC and its subsidiaries following the reorganization. We depend on SRAM Holdings, LLC and its subsidiaries for cash to pay our obligations and make dividend payments. Our ability to pay dividends in the future is dependent upon our receipt of cash from SRAM Holdings, LLC and its subsidiaries.
In addition, we will need to comply with the restrictions contained in our financing instruments, including our new credit facilities in order to pay cash dividends. Any future determination as to the declaration and payment of dividends, if any, will be at the discretion of our board of directors and will depend on then existing conditions, including our financial condition, results of operations, contractual restrictions, capital requirements, business prospects and other factors our board of directors may deem relevant.
Immediately prior to the consummation of this offering, SRAM Holdings, LLC will make a $ million distribution to its pre-offering equity holders to cover the estimated federal and state income taxes payable with respect to their allocable shares of the estimated taxable income of SRAM Holdings, LLC from January 1, 2011 through the closing date of this offering.
32
Table of Contents
The following table sets forth our cash and capitalization as of December 31, 2010:
| • | on an actual basis; |
| • | on a pro forma basis to give effect to the refinancing and reorganization, including (i) the incurrence of $ million of indebtedness under our new credit facilities and the application of the proceeds thereof, (ii) the application of purchase accounting, the allocation of estimated values of assets and liabilities, and the recognition of a related gain as a result of the reorganization, (iii) the vesting of all outstanding incentive units and the granting of new stock options, (iv) the conversion of 5,460,000 Class B units and 539,533 incentive units into shares of Class A and shares of Class B common stock of SRAM International Corporation and (v) the distribution of approximately $ to the pre-offering equity holders of SRAM Holdings, LLC to cover the estimated federal and state income taxes payable with respect to their allocable shares of the estimated taxable income of SRAM Holdings LLC from January 1, 2011 through the closing date of this offering; and |
| • | on a pro forma as adjusted basis, to also give effect to the issuance of shares of Class A common stock in this offering (assuming an estimated public offering price of $ per share, the midpoint of the range set forth on the cover page of this prospectus) and the use of proceeds from this offering. |
33
Table of Contents
You should read this capitalization table together with our historical financial statements and the related notes appearing at the end of this prospectus, “The refinancing and reorganization,” “Use of proceeds,” “Unaudited pro forma condensed consolidated financial data,” “Management’s discussion and analysis of financial condition and results of operations” and the other financial information included in this prospectus.
| Predecessor(1) | Successor(1) | |||||||||||||||
| As of December 31, 2010 (in thousands, except share/unit amounts) |
Actual | Pro forma | Pro forma as adjusted |
|||||||||||||
| Cash and cash equivalents: |
$ | 19,409 | $ | $ | ||||||||||||
| Debt, current and long-term(2): |
$ | 227,103 | $ | $ | ||||||||||||
| Members’ / stockholders’ equity |
||||||||||||||||
| Member units—Class A, 3,640,000 units authorized, issued and outstanding, actual; no units issued and outstanding, pro forma or pro forma as adjusted |
52,930 | |||||||||||||||
| Member units—Class B, 5,460,000 units authorized, issued and outstanding, actual; no units issued and outstanding, pro forma or pro forma as adjusted |
— | |||||||||||||||
| Member units—incentive units, 337,500 units authorized, 259,197 units issued, and 253,303 units outstanding, actual; no units issued and outstanding, pro forma or pro forma as adjusted |
2,800 | |||||||||||||||
| Accumulated deficit |
(188,022 | ) | ||||||||||||||
| Accumulated other comprehensive income |
8,382 | |||||||||||||||
| Class A common stock; $0.01 par value; no shares authorized, issued and outstanding, actual; shares authorized and shares issued and outstanding, pro forma; shares authorized and shares issued and outstanding, pro forma as adjusted |
||||||||||||||||
| Class B common stock; $0.01 par value; no shares authorized, issued and outstanding, actual; shares authorized and shares issued and outstanding, pro forma; shares authorized and shares issued and outstanding, pro forma as adjusted |
||||||||||||||||
| Additional paid-in capital |
||||||||||||||||
| Total members’ / stockholders’ equity (deficit) |
(123,910 | ) | ||||||||||||||
| Total capitalization |
$ | 103,193 | $ | $ | ||||||||||||
| (1) | Prior to this offering, the proceeds from the refinancing will be used to directly or indirectly acquire all of the equity interests in SRAM Holdings, LLC held by Trilantic and its co-investors. This transaction will be accounted for under the purchase method of accounting, which will require our net assets to be recognized at fair value upon acquisition. Our historical financial statements for periods prior to the date of this offering (our predecessor periods) were prepared on the historical cost basis of accounting, which existed prior to the refinancing. Our historical financial statements for periods subsequent to the date of this offering (our successor periods) and our unaudited pro forma condensed consolidated financial statements will be prepared on a new basis of accounting, that is, fair value. As a result, our results for the successor periods are not necessarily comparable to the predecessor periods. |
| (2) | Debt, current and long-term is defined as current portion of long-term debt and long-term borrowings. |
34
Table of Contents
If you invest in our Class A common stock, you will experience dilution to the extent of the difference between the public offering price per share you pay in this offering and the pro forma net tangible book value (deficit) per share of our common stock immediately after this offering. Dilution results from the fact that the per share offering price of the Class A common stock is substantially in excess of the book value per share attributable to the existing equity holders.
After giving effect to the refinancing and reorganization, our pro forma net tangible book value as of December 31, 2010 was $ million, or $ per share. Pro forma net tangible book value per share represents the amount of our total tangible assets less the amount of our total liabilities, divided by the number of shares of common stock outstanding at December 31, 2010, prior to the sale of shares of Class A common stock in this offering, but assuming the completion of the refinancing and reorganization. Dilution in pro forma net tangible book value per share represents the difference between the amount per share paid by investors in this offering and the net tangible book value per share of our common stock outstanding immediately after this offering.
After giving effect to the completion of the refinancing, reorganization and the sale of shares of Class A common stock in this offering, based upon an assumed initial public offering price of $ per share, the midpoint of the range set forth on the cover page of this prospectus, after deducting underwriting discounts and commissions and estimated expenses payable by us in connection with this offering, our pro forma as adjusted net tangible book value as of December 31, 2010 would have been $ million, or $ per share of common stock. This represents an immediate increase in pro forma net tangible book value of $ per share to existing stockholders and immediate dilution of $ per share to new investors purchasing shares of common stock in this offering at the initial public offering price.
The following table illustrates this per share dilution:
| Assumed initial public offering price per share |
$ | |||||||
| Pro forma net tangible book value (deficit) per share as of December 31, 2010 (which gives effect to the refinancing and reorganization) |
$ | |||||||
| Increase in net tangible book value per share attributable to new investors |
||||||||
| Pro forma as adjusted net tangible book value (deficit) per share as of December 31, 2010 (which gives effect to the refinancing, reorganization and this offering) |
||||||||
| Dilution per share to new investors |
$ | |||||||
35
Table of Contents
The following table summarizes, as of December 31, 2010, on a pro forma as adjusted basis giving effect to the reorganization, the refinancing and the sale of shares of Class A common stock in this offering, the number of shares of our common stock purchased from us, the aggregate cash consideration paid to us and the average price per share paid to us by existing stockholders and paid by new investors purchasing shares of our common stock from us in this offering. The table assumes an initial public offering price of $ per share, the midpoint of the range set forth on the cover page of this prospectus, after deducting estimated underwriting discounts and commissions and estimated offering expenses payable by us in connection with this offering.
| Shares purchased | Total consideration | Average price per share |
||||||||||||||||||
| Number | Percentage | Amount | Percentage | |||||||||||||||||
| Existing stockholders |
% | $ | % | $ | ||||||||||||||||
| New investors |
||||||||||||||||||||
| Total |
100% | $ | 100% | |||||||||||||||||
A $1.00 increase (decrease) in the assumed initial public offering price of $ per share, the midpoint of the price range set forth on the cover page of this prospectus, would increase (decrease) the total consideration paid by investors participating in this offering by $ million, or increase (decrease) the percent of total consideration paid by investors participating in this offering by %, assuming that the number of shares offered by us, as set forth on the cover page of this prospectus, remains the same, and after deducting the estimated underwriting discounts and commissions and estimated offering expenses payable by us.
The tables and calculations above are based on shares of common stock outstanding as of December 31, 2010 (after giving effect to the refinancing and reorganization) and exclude an aggregate of shares of Class A common stock reserved for issuance under the SRAM International Corporation 2011 Incentive Award Plan.
36
Table of Contents
Unaudited pro forma condensed consolidated financial data
The following unaudited pro forma condensed consolidated financial data sets forth our unaudited pro forma and historical condensed consolidated statement of operations for the year ended December 31, 2010 and our unaudited pro forma and historical condensed consolidated balance sheet at December 31, 2010. Historical information is based on the audited consolidated financial statements of SRAM Holdings, LLC appearing elsewhere in this prospectus. Prior to the date of the reorganization, SRAM Holdings, LLC and its subsidiaries is considered to be our predecessor company.
The unaudited pro forma condensed consolidated balance sheet at December 31, 2010, and the unaudited pro forma condensed consolidated statement of operations for the year ended December 31, 2010, is presented on:
| • | on an actual basis; |
| • | on a pro forma basis to give effect to the refinancing and reorganization, including (i) the incurrence of $ million of indebtedness under our new credit facilities and the application of the proceeds thereof, (ii) the application of purchase accounting, the allocation of estimated values of assets and liabilities, and the recognition of a related gain as a result of the reorganization, (iii) the vesting of all outstanding incentive units and the granting of new stock options, (iv) the conversion of 5,460,000 Class B units and 539,533 incentive units, into shares of Class A and shares of Class B common stock of SRAM International Corporation, (v) the distribution of approximately $ to the pre-offering equityholders of SRAM Holdings, LLC to cover the estimated federal and state income taxes payable with respect to their allocable shares of the estimated taxable income of SRAM Holdings, LLC from January 1, 2011 through the closing date of this offering, and (vi) a provision for corporate income taxes on the income attributable to SRAM International Corporation and its subsidiaries at an effective rate of %; and |
| • | on a pro forma as adjusted basis, to also give effect to the issuance of shares of Class A common stock in this offering (assuming an estimated public offering price of $ per share, the midpoint of the range set forth on the cover page of this prospectus) and the use of proceeds from this offering, as if such transactions occurred on December 31, 2010, for the unaudited pro forma condensed consolidated balance sheet, and as if such transactions occurred on January 1, 2010, for the unaudited pro forma condensed consolidated statement of operations. |
Our unaudited pro forma adjustments are based on available information and certain assumptions that we believe are reasonable. Presentation of our unaudited pro forma condensed consolidated financial data is prepared in conformity with Article 11 of Regulation S-X.
The unaudited pro forma condensed consolidated financial data should be read in conjunction with “The refinancing and reorganization,” “Use of proceeds,” “Management’s discussion and analysis of financial condition and results of operations” and our consolidated financial statements and related notes thereto, included elsewhere in this prospectus. The unaudited pro forma condensed consolidated financial data is included for informational purposes only and does not purport to reflect our results of operations or financial position that would have occurred had we operated as a public company during the periods presented, and it therefore should not be relied upon as being indicative of our results of operations or financial position had the refinancing, the reorganization and this offering occurred on the dates assumed. The unaudited condensed consolidated pro forma financial data is also not a projection of our results of operations, or financial position for any future period or date. The estimates and assumptions used in preparation of the unaudited pro forma condensed consolidated financial data may be materially different from our actual experience in connection with any specific sale by the selling stockholders.
37
Table of Contents
| Unaudited pro forma condensed consolidated balance sheet | ||||||||||||||||||||||||||||
| Predecessor(1) | Successor(1) | |||||||||||||||||||||||||||
| Year ended December 31, 2010 (in thousands, except share/unit amounts) |
Actual | Adjustments for the refinancing(2) |
Adjustments for the |
Pro forma |
Adjustments for this offering(4) |
Pro forma as adjusted |
||||||||||||||||||||||
| Assets |
||||||||||||||||||||||||||||
| Cash and cash equivalents |
$ | 19,409 | $ | $ | $ | $ | $ | |||||||||||||||||||||
| Accounts receivable, net |
89,502 | |||||||||||||||||||||||||||
| Inventories |
34,133 | |||||||||||||||||||||||||||
| Other current assets |
7,280 | |||||||||||||||||||||||||||
| Total current assets |
150,324 | |||||||||||||||||||||||||||
| Property and equipment, net |
33,333 | |||||||||||||||||||||||||||
| Intangible assets, net |
44,461 | |||||||||||||||||||||||||||
| Goodwill |
15,606 | |||||||||||||||||||||||||||
| Deferred financing charges and other assets |
5,551 | |||||||||||||||||||||||||||
| Total assets |
$ | 249,275 | $ | $ | $ | $ | $ | |||||||||||||||||||||
| Liabilities and members’ / stockholders’ (deficit) equity |
||||||||||||||||||||||||||||
| Current portion of long-term debt |
$ | — | $ | $ | $ | $ | $ | |||||||||||||||||||||
| Accounts payable |
74,275 | |||||||||||||||||||||||||||
| Accrued personnel costs |
18,954 | |||||||||||||||||||||||||||
| Accrued expenses and other current liabilities |
13,515 | |||||||||||||||||||||||||||
| Accrued member units—incentive units |
13,315 | |||||||||||||||||||||||||||
| Income taxes payable |
11,593 | |||||||||||||||||||||||||||
| Total current liabilities |
131,652 | |||||||||||||||||||||||||||
| Long-term borrowings |
227,103 | |||||||||||||||||||||||||||
| Other noncurrent liabilities |
14,430 | |||||||||||||||||||||||||||
| Total liabilities |
373,185 | |||||||||||||||||||||||||||
| Commitments and contingencies |
||||||||||||||||||||||||||||
38
Table of Contents
| Predecessor(1) | Successor(1) | |||||||||||||||||||||||||||
| Year ended December 31, 2010 (in thousands, except share/unit amounts) |
Actual | Adjustments for the refinancing(2) |
Adjustments for the |
Pro forma |
Adjustments for this offering(4) |
Pro forma as adjusted |
||||||||||||||||||||||
| Members’ / stockholders’ equity |
||||||||||||||||||||||||||||
| Member units—Class A, 3,640,000 units authorized, issued and outstanding, actual; no units issued and outstanding, pro forma or pro forma as adjusted |
52,930 | |||||||||||||||||||||||||||
| Member units—Class B, 5,460,000 units authorized, issued and outstanding actual; no units issued and outstanding, pro forma or pro forma as adjusted |
— | |||||||||||||||||||||||||||
| Member units—incentive units 337,500 units authorized, 276,697 units issued, and 269,767 units outstanding, actual; no units issued and outstanding, pro forma or pro forma as adjusted |
2,800 | |||||||||||||||||||||||||||
| Accumulated deficit |
(188,022 | ) | ||||||||||||||||||||||||||
| Accumulated other comprehensive income |
8,382 | |||||||||||||||||||||||||||
| Class A common stock; $0.01 par value; no shares authorized, issued and outstanding, actual; shares authorized and shares issued and outstanding, pro forma; shares authorized and shares issued and outstanding, pro forma as adjusted |
||||||||||||||||||||||||||||
| Class B common stock; $0.01 par value; no shares authorized, issued and outstanding, actual; shares authorized and shares issued and outstanding, pro forma; shares authorized and shares issued and outstanding, pro forma as adjusted |
||||||||||||||||||||||||||||
| Additional paid-in capital |
||||||||||||||||||||||||||||
| Total members’ / stockholders’ (deficit) equity |
(123,910 | ) | ||||||||||||||||||||||||||
| Total liabilities and members’ / stockholders’ (deficit) equity |
$ | 249,275 | $ | $ | $ | $ | ||||||||||||||||||||||
39
Table of Contents
| Unaudited pro forma condensed consolidated statement of operations | ||||||||||||||||||||||||||||
| Predecessor(1) | Successor(1) | |||||||||||||||||||||||||||
| Year ended December 31, 2010 (in thousands, except share/ unit amounts) |
Actual | Adjustments for the refinancing(2) |
Adjustments for the |
Pro forma |
Adjustments for the offering(4) |
Pro forma as adjusted |
||||||||||||||||||||||
| Net sales |
$ | 524,187 | $ | $ | $ | $ | $ | |||||||||||||||||||||
| Cost of sales |
312,954 | |||||||||||||||||||||||||||
| Gross profit |
211,233 | |||||||||||||||||||||||||||
| Operating expenses |
||||||||||||||||||||||||||||
| General and administrative expense |
33,913 | |||||||||||||||||||||||||||
| Sales and marketing expense |
40,579 | |||||||||||||||||||||||||||
| Product development expense |
37,179 | |||||||||||||||||||||||||||
| 111,671 | ||||||||||||||||||||||||||||
| Income from operations |
99,562 | |||||||||||||||||||||||||||
| Other income (expense) |
||||||||||||||||||||||||||||
| Interest expense, net |
(32,634 | ) | ||||||||||||||||||||||||||
| Foreign currency exchange gain |
237 | |||||||||||||||||||||||||||
| Other expense, net |
(32,397 | ) | ||||||||||||||||||||||||||
| Income (loss) before income taxes |
67,165 | |||||||||||||||||||||||||||
| Income tax expense |
17,193 | |||||||||||||||||||||||||||
| Net income |
$ | 49,972 | $ | $ | $ | $ | ||||||||||||||||||||||
| Class A preferred return |
27,578 | |||||||||||||||||||||||||||
| Tax distributions to members |
6,962 | |||||||||||||||||||||||||||
| Net income attributable to members, after Class A preferred return and tax distributions to Class A and Class B members |
$ | 15,432 | ||||||||||||||||||||||||||
| Class B members |
||||||||||||||||||||||||||||
| Net income attributable to Class B members |
$ | 13,231 | ||||||||||||||||||||||||||
| Weighted average units outstanding—basic and diluted |
5,460,000 | |||||||||||||||||||||||||||
| Earnings per unit—basic and diluted |
$ | 2.42 | ||||||||||||||||||||||||||
| Pro forma as adjusted weighted average common shares outstanding—basic and diluted |
||||||||||||||||||||||||||||
| Pro forma as adjusted earnings per common share—basic and diluted |
$ | |||||||||||||||||||||||||||
Basis of presentation
| (1) | As further described in “The refinancing and reorganization”, prior to this offering, the proceeds from the refinancing will be used to directly and indirectly acquire all of the equity interests in SRAM Holdings, LLC held by Trilantic and its co-investors. This transaction will be accounted for under the purchase method of accounting, which will require that SRAM Holdings, LLC’s assets and liabilities to be recognized at fair value upon acquisition. Our historical financial statements for the periods prior to the date of this offering (our predecessor periods) were prepared on the historical cost basis of accounting, which existed prior to the refinancing. Our historical financial statements for periods subsequent to the date of this offering (our successor periods) and our unaudited pro forma condensed consolidated financial statements will be prepared on a new basis of accounting, that is, fair value. As a result, our results for the successor periods are not necessarily comparable to the Predecessor periods. |
40
Table of Contents
Pro forma adjustments
| (2) | The amounts in this column represent the pro forma adjustments to reflect the refinancing transactions described within the “refinancing and reorganization.” |
| (a) | Prior to this offering, SRAM, LLC intends to enter into new credit facilities consisting of a first-lien term facility, a second-lien term facility, and a revolving facility. |
| • | The first-lien term facility will have a principal amount of $ , will bear interest at a rate of % , and will have a term of . The unaudited pro forma condensed consolidated balance sheet reflects proceeds from the first-lien term facility of $ , net of original issue discount of $ and commissions and fees of $ . |
| • | The second-lien term facility will have a principal amount of $ , will bear interest at a rate of %, and will have a term of . The unaudited pro forma condensed consolidated balance sheet reflects proceeds from the second-lien term facility of $ , net of original issue discount of $ and commissions and fees of $ . |
| • | Our revolving credit facility will bear interest at a rate of % , including annual commitment fees of % per year on the unused portion of our revolving credit facility, will have a term of , and will require $ in upfront commitment fees. We do not plan on drawing on our revolving facility concurrent with the refinancing and reorganization. |
| Accordingly, | total borrowings under our first-lien term facility, our second-lien term facility, and our revolving credit facility, will be approximately $ million. The pro forma condensed consolidated balance sheet reflects deferred financing costs related to our new borrowing arrangements of $ , with $ and $ classified within Other current assets and Deferred financing charges and other assets, respectively. The unaudited pro forma condensed consolidated balance sheet reflects Long term borrowings on a pro forma basis related to our first-lien term facility of $ , net of original discount of $ , and Long term borrowings on a pro forma basis related to our second-lien term facility of $ , net of original discount of $ . As a result of the refinancing, the unaudited pro forma condensed consolidated statement of operations reflects incremental interest expense on a pro forma basis of $ . |
| (b) | The proceeds from our new credit facilities of approximately $ million will be used to: |
| • | Repay the entire outstanding amounts under our existing credit facilities, which as of December 31, 2010, consisted of $ million. We will account for the repayment of our existing credit facilities as an extinguishment of debt and will accordingly write off $ in deferred financing costs, of which $ and $ are classified within Deferred charges and other assets and Long term borrowings as of December 31, 2010; |
| • | Make a $ million payment to Trilantic and its co-investors consisting of $ million in respect of the common participation right and $ million in respect of the priority interest of the 3,640,000 Class A units held by Trilantic and its co-investors; and |
| • | Pay all fees and expenses related to the refinancing. |
| In connection with these transactions, SRAM Holdings, LLC will amend and restate its operating agreement to create a single class of common units and eliminate the corporate governance and liquidity rights of Trilantic and its co-investors. Trilantic and its co-investors will have no remaining ownership interest in SRAM Holdings, LLC following the refinancing. Prior to the acquisition from Trilantic and its co-investors (including corporations controlled by Trilantic and its co-investors) of their equity interests, the carrying value of the Class A member interest in SRAM Holdings, LLC, was $52.9 million, as of December 31, 2010. Accordingly, a reduction of $ and $ will be made to Class A member units and retained deficit, respectively, to effect to the acquisition from Trilantic and its co-investors (including corporations controlled by Trilantic and its co-investors) interests in SRAM Holdings, LLC. |
| (c) | Pursuant to the refinancing transactions described within footnote (2)(b) above, a change of control will occur, as defined by ASC 805, Business Combinations, whereby SRAM-SP2, Inc. will obtain control of SRAM Holdings, LLC, whereas before SRAM-SP2, Inc. has historically accounted for its interest in SRAM Holdings, LLC, as an equity method investment. SRAM-SP2, Inc. will become a wholly-owned subsidiary of SRAM International Corporation as a result of the reorganization described in footnote (3)(a) below. Within the unaudited pro forma condensed consolidated balance sheet and the unaudited pro forma condensed consolidated statement of operations, amounts under “Adjustments for the refinancing” reflect adjustments recorded by SRAM Holdings, LLC, whereas amounts under “Adjustments for the reorganization” reflect the adjustments recorded by SRAM International Corporation, of which SRAM-SP2, Inc. and SRAM Holdings, LLC are wholly-owned subsidiaries. |
| As a result of the foregoing, we have reflected adjustments within the unaudited pro forma condensed consolidated balance sheet in order to: |
| • | Reflect the fair value adjustments required to be recorded by SRAM-SP2, Inc. as a result of SRAM-SP2, Inc. obtaining control and consolidating our assets and liabilities (described under “Control obtained by SRAM-SP2, Inc., consolidation of our assets and liabilities into SRAM-SP2, Inc.” below); and |
| • | The purchase accounting adjustments necessary to reflect our assets and liabilities at fair value (described under “Adjustments to reflect our assets and liabilities at fair value” below). |
41
Table of Contents
Control obtained by SRAM-SP2, Inc., consolidation of our assets and liabilities into SRAM-SP2, Inc.
| As a result of the refinancing, a change in control event will occur whereby SRAM-SP2, Inc. will obtain a controlling interest in SRAM Holdings, LLC through a series of transactions, ultimately becoming the entity through which SRAM International Corporation holds its interest in a majority of SRAM Holdings, LLC. SRAM-SP2, Inc. will be a wholly-owned subsidiary of SRAM International Corporation. As a result, SRAM International Corporation will account for this change in control as follows: |
| • | SRAM-SP2, Inc. will remove its previously held equity interest in SRAM Holdings, LLC on the date that Trilantic and its co-investors (including corporations controlled by them) cease to hold any remaining interest in SRAM Holdings, LLC . The carrying value of its previously held equity interest in SRAM Holdings, LLC as of December 31, 2010 was $ million. |
| • | SRAM-SP2, Inc. will record a gain for the difference between the carrying value and fair value of SRAM-SP2, Inc.’s previously held equity interest in SRAM Holdings, LLC on the date that Trilantic and its co-investors cease to hold any remaining equity interest in SRAM Holdings, LLC. As of December 31, 2010, the fair value of SRAM-SP2, Inc.’s previously held equity interest in SRAM Holdings, LLC was $ , resulting in a gain of $ as of December 31, 2010. The gain recognized will be recorded by SRAM International Corporation (SRAM Holdings LLC’s successor) after giving effect to the purchase accounting adjustments described under “Adjustments to reflect our assets and liabilities at fair value” below. The fair value of SRAM-SP2, Inc.’s equity method investment was determined in accordance with ASC 820, Fair Value Measurements. |
| • | SRAM-SP2, Inc. will record 100% of the net assets of SRAM International Corporation at fair value on the date that Trilantic and its co-investors cease to hold any remaining interest in SRAM Holdings, LLC. The fair value of the net assets of SRAM International Corporation, in addition to goodwill arising from the change in control described above, was $ as of December 31, 2010 (as described below in “Adjustment to reflect our assets and liabilities at fair value”). |
Adjustments to reflect our assets and liabilities at fair value
| The series of transactions comprising the refinancing will result in a change in control, as defined by ASC 805, Business Combinations, which will be accounted for under the purchase method of accounting, and which requires the allocation of the purchase price to the estimated fair values of assets and liabilities acquired and assumed. Fair values of assets and liabilities will be estimated based on the provisions of ASC 805, Business Combinations, which defines fair value in accordance with ASC 820, Fair Value Measurements. The following is a summary of the allocations of fair values to assets and liabilities and the amount recorded that will be goodwill at December 31, 2010: |
| As of December 31, (in thousands, except share/unit amounts) |
2010 |
|||
| Total current assets |
$ | |||
| Property, plant, and equipment, net |
||||
| Intangible assets, net |
||||
| Goodwill |
||||
| Deferred charges and other assets |
||||
| Total current liabilities |
||||
| Long -term borrowings |
||||
| Other non-current liabilities |
||||
| Fair value of net assets and goodwill |
$ | |||
| The unaudited pro forma condensed consolidated balance sheet reflects adjustments to Property, plant, and equipment, Intangible assets, and Goodwill of $ , $ , and $ , respectively, in order to reflect fair value. The unaudited pro forma condensed consolidated statement of operations includes an adjustment of $ to reflect incremental depreciation and amortization for the year ended December 31, 2010, using a weighted average useful life of tangible assets and intangible assets of and years, respectively, which has been classified in the unaudited condensed consolidated statement of operations as follows: |
| For the Year ended December 31, (in thousands, except share/unit amounts) |
2010 | |||
| Cost of sales |
$ | |||
| General and administrative expense |
||||
| Sales and marketing expense |
||||
| Product development expense |
||||
| $ | ||||
| The unaudited pro forma condensed consolidated balance sheet has been adjusted to give effect to the items listed above. As a part of the purchase accounting adjustments required to reflect our assets and liabilities at fair value, retained deficit and accumulated comprehensive income will be closed to members’ capital. Our retained deficit and accumulated other comprehensive income reflected in its historical financial statements were ($188.0) million and $8.4 million as of December 31, 2010. Accordingly, after giving effect to all other pro forma adjustments which will have occurred prior to and concurrent with the change in control, a reduction of $ and $ will be recorded to retained deficit and accumulated other comprehensive income, respectively. Our members’ capital will be adjusted to reflect the fair value of our net assets. The fair value of our net assets, in addition to of goodwill recorded as a result of the purchase accounting adjustments noted above, was $ as of December 31, 2010; $ will be allocated to Class members’ capital and $ will be allocated to incentive unit members’ capital under the terms of the SRAM Holdings, LLC Operating Agreement. |
42
Table of Contents
| The only transactions which will be recorded by SRAM International Corporation after the revaluation of our assets and liabilities to fair value are: |
| • | The gain resulting from the revaluation of SRAM-SP2, Inc.’s equity-accounted investment in SRAM Holdings, LLC (prior to consolidation of SRAM Holdings, LLC into SRAM SP2, Inc.), which results in $ increase in retained earnings, and |
| • | The vesting of incentive units described in footnote 3(c), which results in a $ decrease in retained earnings. |
| (3) | The amounts in this column represent the pro forma adjustments to reflect the reorganization described within the “refinancing and reorganization.” |
| (a) | After giving effect to the refinancing transactions described in footnote (2)(a) above, the exchange of units in our predecessor company for Class A and B common shares of SRAM International Corporation is summarized as follows: |
| Previously held interest in SRAM Holdings , LLC | Exchanged for common stock in SRAM International Corporation | |
| SRAM Holdings Class units | Class A common stock*, par value of $.01 per share, total par value of $
Class B common stock*, par value of $.01 per share, total par value of $
*after giving effect to the conversion of Class B shares into Class A shares, of which shares will be sold in this offering. | |
| 539,533 Incentive units (of which 269,766 are liability classified awards) | Class A common stock, par value of $.01 per share, total par value of $ | |
| As described in (2)(c) above, SRAM International Corporation will hold its interest in SRAM Holdings, LLC, through SRAM-SP2, Inc. SRAM International Corporation will have no other material assets or liabilities other than its 100% interest in SRAM-SP2, Inc. Accordingly, upon reorganization, SRAM International Corporation will reflect the consolidated balances of SRAM-SP2, Inc., including the gain of $ recognized by SRAM-SP2, Inc. arising from the revaluation of its previously equity-accounted investment in SRAM Holdings, LLC, as described under Control obtained by SRAM-SP2, Inc., consolidation of our assets and liabilities into SRAM-SP2, Inc. within (2)(c) above. |
| Accordingly, we will record adjustments, after giving effect to the adjustments reflected for the refinancing, to increase (reduce) Class members’ equity, Incentive unit members’ equity, Class A common stock, Class B common stock, and additional paid in capital by $ , $ , $ , $ , and $ , respectively. |
| In addition to the exchange described above, and after the conversion of of our Class B shares for Class A shares, we will issue shares in a public offering, as described in footnote (4)(a). After the public offering, we will have the following number of Class A and B common shares outstanding: |
| Class A common stock, $.01 par value of per share |
||||
| Class B common stock, $.01 par value of per share |
||||
| Total |
||||
| (b) | Concurrent with the reorganization, SRAM Holdings, LLC will make a $ million tax distribution to its pre-offering equity holders to cover the estimated federal and state income taxes payable with respect to their allocable shares of the estimated taxable income of SRAM Holdings, LLC from January 1, 2011 through the closing date of this offering. |
| (c) | In connection with the reorganization and offering, 539,533 incentive units outstanding as of December 31, 2010 will vest, generating $ of additional compensation expense, which has been recorded in the unaudited pro forma condensed consolidated balance sheet as an adjustment to retained earnings. |
| $ of the additional compensation expense described above is attributable to incentive units that were equity classified in our historical financial statements. Additional compensation expense related to these awards reflects the fair value of the Class A common shares in which these incentive units will be settled. |
| $ of the additional compensation expense described above is attributable to incentive units that were liability classified in our historical financial statements. Additional compensation expense related to these awards reflects the fair value of the Class A common shares in which these incentive units will be settled. The liability related to these awards will settled in Class A common stock, as discussed in (3)(a) above. Accordingly, the liability related to these awards will be closed to APIC, resulting in a net adjustment to Accrued units – incentive units of $ . |
| (d) | Upon completion of this offering, we will grant approximately stock options for SRAM International Corporation Class A common stock to our directors and employees at an exercise price of $ . The fair value of these awards is $ per share, have a term of years, and will vest over years. |
43
Table of Contents
| As a result, the unaudited pro forma condensed consolidated statement of operations reflects additional share based compensation, classified within the unaudited pro forma condensed consolidated statement of operations, as follows: |
| For the Year ended December 31, (in thousands, except share/units amounts) |
2010 | |||
| Cost of sales |
$ | |||
| General and administrative expense |
||||
| Sales and marketing expense |
||||
| Product development expense |
||||
| $ | ||||
| (e) | As a result of the reorganization, prior to this offering, our predecessor company, SRAM Holdings, LLC was a limited liability company, with income and losses flowing directly to the members. Following the reorganization, our successor company, SRAM International Corporation will incur taxes on its income and losses and will record deferred tax assets and liabilities. |
| The unaudited pro forma condensed consolidated statement of operations reflects an incremental tax charge of $ at an assumed pro forma tax rate of %, representing a combined federal, foreign and state statutory tax rate. |
| Our deferred tax balances will change as a result of the change in the book value of our assets and liabilities. After giving effect to the aforementioned book purchase accounting adjustments and other book-tax differences, our deferred tax balances will be as follows: |
| As of December 31, (in thousands) |
2010 | |||
| Current deferred tax assets/(liabilities) |
$ | |||
| Non-current deferred tax assets/(liabilities) |
||||
| Net deferred tax assets/(liabilities) |
$ | |||
| (4) (a) | The amounts in this column represent the pro forma adjustments made to reflect the issuance of shares of common stock in this offering and subsequent use of proceeds reflects SRAM International Corporation’s issuance of shares of Class A common stock, (assuming an estimated public offering price of $ per share, the midpoint of the range set forth on the cover page of this prospectus), after deducting underwriting discounts and commissions of $ and other costs of $ , resulting in net proceeds of $ , represented by a total par value of $ and additional paid-in-capital of $ . |
| (b) | Reflects the use of our equity proceeds of $ (described in footnote (4)(a) above) to pay down our outstanding borrowings. Our borrowings under our first lien term loan facility and our second lien term loan facility will decrease by $ and $ , respectively, resulting in a decrease in pro forma interest expense of $ on a pro forma as adjusted basis. |
| We will not retain any of the net proceeds of the shares sold in this offering. |
| (c) | The following table illustrates the calculation of pro forma as adjusted income from continuing operations per share for the year ended December 31, 2010: |
| Pro forma as adjusted net income $ |
| Calculation of weighted average numbers of shares outstanding: |
| Basic | Diluted | |||||||
| Class A common stock |
||||||||
| Class B common stock |
||||||||
| Pro forma as adjusted earnings per share, basic and diluted: $ |
| The participation and liquidation rights of both the Class A and Class B common stock are the same. |
| Stock options represent the only class of potentially financial instruments that will be outstanding after the refinancing, reorganization, and this offering. Based on the terms of these options, described in footnote (3)(d), these options were determined to be anti-dilutive for the purposes of determining earnings per share under ASC 260, Earnings Per Share, and were therefore excluded from the calculation of diluted earnings per share. |
44
Table of Contents
Selected consolidated financial data
The following selected consolidated financial data of our predecessor companies should be read together with “The refinancing and reorganization,” “Management’s discussion and analysis of financial condition and results of operations” and the historical financial statements, related notes and other financial information included in this prospectus. The selected consolidated financial data in this section is not intended to replace our historical financial statements and is qualified in its entirety by the historical financial statements and related notes included in this prospectus. Our predecessor companies will be SRAM Holdings, LLC and SRAM Corporation and their consolidated financial statements will be our historical financial statements following this offering.
The statements of operations data for the years ended December 31, 2008, 2009 and 2010 and the balance sheets data as of December 31, 2009 and 2010 are derived from the audited consolidated financial statements of our predecessor companies included in this prospectus. The statements of operations data for the years ended December 31, 2006 and 2007 and the balance sheet data as of December 31, 2006, 2007 and 2008 are derived from the audited consolidated financial statements of our predecessor operations not included in this prospectus. For comparison purposes, certain balances with respect to the financial data for the years ended December 31, 2006 and 2007 have been reclassified in order to conform with the presentation for the years ended December 31, 2008, 2009 and 2010. Historical results are not necessarily indicative of the results to be expected in the future.
| Year ended December 31, (in thousands, except per unit data) |
2006 | 2007 | 2008 | 2009 | 2010 | |||||||||||||||
| Statement of operations data: |
||||||||||||||||||||
| Net sales |
$ | 283,806 | $ | 356,025 | $ | 478,354 | $ | 399,581 | $ | 524,187 | ||||||||||
| Cost of sales |
206,235 | 247,013 | 310,725 | 239,448 | 312,954 | |||||||||||||||
| Gross profit |
77,571 | 109,012 | 167,629 | 160,133 | 211,233 | |||||||||||||||
| Operating expenses |
||||||||||||||||||||
| General and administrative expense |
12,444 | 23,215 | 77,846 | 29,042 | 33,913 | |||||||||||||||
| Sales and marketing expense |
19,729 | 22,621 | 49,480 | 27,934 | 40,579 | |||||||||||||||
| Product development expense |
21,702 | 27,568 | 46,506 | 27,799 | 37,179 | |||||||||||||||
| Recapitalization costs(1) |
— | — | 8,952 | — | — | |||||||||||||||
| 53,875 | 73,404 | 182,784 | 84,775 | 111,671 | ||||||||||||||||
| Income (loss) from operations |
23,696 | 35,608 | (15,155 | ) | 75,358 | 99,562 | ||||||||||||||
| Other income (expense) |
||||||||||||||||||||
| Interest expense, net |
(3,205 | ) | (2,736 | ) | (21,703 | ) | (36,245 | ) | (32,634 | ) | ||||||||||
| Foreign currency exchange gain (loss) |
(3,734 | ) | (3,993 | ) | 4,072 | (3,221 | ) | 237 | ||||||||||||
| Total other expense, net |
(6,939 | ) | (6,729 | ) | (17,631 | ) | (39,466 | ) | (32,397 | ) | ||||||||||
| Income (loss) before income taxes |
16,757 | 28,879 | (32,786 | ) | 35,892 | 67,165 | ||||||||||||||
| Income tax expense |
5,169 | 10,866 | 15,838 | 14,373 | 17,193 | |||||||||||||||
| Net income (loss)(2) |
$ | 11,588 | $ | 18,013 | $ | (48,624 | ) | $ | 21,519 | $ | 49,972 | |||||||||
| Net Income (loss) attributable to members, after Class A preferred return and distributions to Class A and Class B members |
$ | 8,669 | $ | (13,776 | ) | $ | (54,494 | ) | $ | (6,228 | ) | $ | 15,432 | |||||||
| Class B members |
||||||||||||||||||||
| Net income (loss) attributable to Class B members |
$ | 8,120 | $ | 18,013 | $ | (54,494 | ) | $ | (5,979 | ) | $ | 13,231 | ||||||||
| Weighted average units outstanding—basic and diluted(3) |
5,460,000 | 5,460,000 | 5,460,000 | 5,460,000 | 5,460,000 | |||||||||||||||
| Earnings (loss) per unit—basic and diluted(3) |
$ | 1.49 | $ | 3.30 | $ | (9.98 | ) | $ | (1.10 | ) | $ | 2.42 | ||||||||
45
Table of Contents
| As of December 31 (in thousands, except per unit data) |
||||||||||||||||||||
| 2006 | 2007 | 2008 | 2009 | 2010 | ||||||||||||||||
| Balance sheet data: |
||||||||||||||||||||
| Cash and cash equivalents |
$ | 13,557 | $ | 10,309 | $ | 27,100 | $ | 33,689 | $ | 19,409 | ||||||||||
| Total assets |
151,315 | 236,703 | 251,632 | 238,334 | 249,275 | |||||||||||||||
| Loans and borrowings (including short-term borrowings)(4) |
40,000 | 109,332 | 339,356 | 301,428 | 227,103 | |||||||||||||||
| Stockholders’ loans |
(156 | ) | — | — | — | — | ||||||||||||||
| Total liabilities |
121,679 | 216,477 | 441,193 | 404,655 | 373,185 | |||||||||||||||
| Total Members’ equity (deficit) |
29,636 | 20,225 | (189,561 | ) | (166,321 | ) | (123,910 | ) | ||||||||||||
| (1) | The recapitalization costs relate to the 2008 recapitalization in which Trilantic and its co-investors purchased a $234.8 million equity interest in SRAM. See “Certain relationships and related person transactions–Trilantic 2008 investment and recapitalization” for a description of the 2008 recapitalization. |
| (2) | Net loss for 2008 includes expenses related to our 2008 recapitalization, including share-based compensation expense of $88.5 million in accordance with ASC 718, Compensation—Stock Compensation, which was allocated across our cost of sales, general and administrative expense, sales and marketing expense and product development expense for the year. This expense was primarily due to the immediate vesting, exercise and repurchase of awards, triggered by the 2008 recapitalization. Net income for 2009 and 2010 includes share-based compensation expense of $3.7 million and $12.4 million, respectively, similarly allocated. |
| (3) | For purposes of determining the weighted average units outstanding used in the earnings per unit calculation, the Company has retroactively reflected the impact of the 2008 recapitalization on the capital structure as if it had occurred on January 1, 2006. |
| (4) | Loans and borrowings (including short-term borrowings) are defined as (i) the current portion of long-term debt plus (ii) long-term borrowings. |
46
Table of Contents
Management’s discussion and analysis of financial condition and results of operations
The following discussion and analysis of our financial condition and results of operations should be read in conjunction with “Prospectus summary—Summary consolidated financial data,” “Selected consolidated financial data” and our historical financial statements included elsewhere in this prospectus. In addition to historical data, this discussion contains forward-looking statements about our business, operations and financial performance based on current expectations that involve risks, uncertainties and assumptions. Our actual results may differ materially from those discussed in the forward-looking statements as a result of various factors, including but not limited to those discussed in the sections entitled “Risk factors” and “Special note regarding forward-looking statements” included elsewhere in this prospectus.
Overview
We are a leading global designer, manufacturer and marketer of premium bicycle components. Consumers recognize our brands for differentiated design and innovation. Our products include drivetrain systems, suspension, brakes, internal gear hubs and wheelsets, all of which are essential components used on road bikes, mountain bikes or pavement bikes.
We operate in two distribution channels, the OEM and aftermarket channels, which correspond to our two reportable segments, OEM and aftermarket. In the OEM channel, we market our products to bicycle companies as original equipment components for new bikes that they sell to consumers through independent bicycle retailers. Although our products are specified for use by bicycle companies, we sell our products directly to the bicycle factories that manufacture bike frames and assemble bikes on behalf of bicycle companies in accordance with their specifications. Generally, by the second quarter we receive clarification of these specifications for our coming model year (July 1 through June 30). We then refine our internal forecast for annual production based on this information and historical production levels. However, production does not occur until receipt of customer orders. Given this process, we do not carry significant inventory and we have the flexibility to respond to subsequent changes in demand by adjusting production throughout the year.
We sell aftermarket products through distributors to independent bicycle retailers, who in turn sell them to consumers for replacements, upgrades or custom bike builds. Additionally, we sell a limited number of our premium aftermarket products directly to independent bicycle retailers in the United States. We base our production of aftermarket components on our frequent interaction with the distributors and dealers who sell our aftermarket products. Because we are able to command higher prices for our aftermarket components, our aftermarket components have higher margins than their OEM counterparts.
For the year ended December 31, 2010, OEM and aftermarket sales represented 67% and 33%, respectively, of our total sales, as compared to 67% and 34% of our sales for the year ended December 31, 2009 and 74% and 26% of our sales for the year ended December 31, 2008. We attribute the growth of our aftermarket segment since 2008 to an increased internal focus and external marketing efforts, as well as general economic conditions, as discussed below. We expect the percentage of sales of our two segments in the foreseeable future to remain similar to 2010.
We focus on a variety of key indicators to monitor our financial performance, including net sales and operating income. For the year ended December 31, 2010, our net sales increased from $399.6 million to $524.2 million and our net income increased from $21.5 million to $50.0 million, as compared to 2009. We attribute these increases to a normalization in production and inventory levels for new bikes as the global economy recovered
47
Table of Contents
from recession, increased market penetration due to new product introductions, and increased cycling participation leading to growth in our industry.
Other significant 2010 activities included:
| • | The refinancing of our credit facilities, which resulted in a significant decrease in the average interest rate on our indebtedness and lower interest expense. |
| • | The implementation of the first phase of a three-phase restructuring plan for our German operations, which reduces our German workforce as we shift manufacturing from Germany to our Taiwan plant. We implemented this restructuring plan in order to take advantage of lower manufacturing costs in Taiwan and to reduce excess capacity at our German facility resulting from a shift of bike production by bicycle companies from Europe to Asia. The second phase of the plan will be implemented in the second half of 2011 and the third phase is expected to be implemented by mid-2012. In connection with this restructuring plan, we expect to incur total severance expenses of $10.9 million, of which $8.0 million was incurred in 2010. |
| • | Investments in property and equipment of $17.9 million, including the construction of our new Indianapolis manufacturing and product development facility, which provides us with additional production capacity in the U.S. and office space for our expanding product development and sales and marketing functions and replaces our old facility. |
Key trends affecting our business
In the OEM channel, our business is impacted by global economic conditions. For example, in 2009, in response to the global recession, bicycle companies decreased production of new bikes, which in turn led to a decrease of our component sales in the OEM channel. According to the National Bicycle Dealers Association, the number of bikes sold in the United States decreased to 14.9 million in 2009 from 18.5 million in 2008. We believe this volume decrease is indicative of the volume change that occurred in the independent bicycle retailer market during this period. In response to these economic conditions, we took a number of steps in 2009 to reduce our expenses in order to mitigate the effect of the recession on our results of operations. The actions we took included a reduction in labor costs in our manufacturing facilities, reductions in bonuses and pay increases, a hiring freeze, reduced travel and outside consulting expenses, a decrease in marketing expenses and a reduction in capital expenditures. We were also able to partially offset our reduced net sales in the OEM channel in 2009 by increased sales of our higher-margin aftermarket products. In 2010, our expenses and capital expenditures increased from the reduced 2009 levels as economic conditions improved and our spending levels increased in response to increasing bike production volumes and to support further growth.
A key driver of our net sales and margins in both the OEM and aftermarket channels has been our ability to continually develop innovative new products, which enables us to increase specifications of our components on new bike models as well as increase aftermarket sales. Our product development lifecycle enables us to maintain a constant innovation pipeline and launch numerous new products each year, allowing us to continually capture specifications on new bike models. Our ability to continue to develop innovative new products will be key to our future growth. In addition, in recent years we have generally been able to achieve price increases of 2 to 3% on existing products across our product base.
Our business in both the OEM and aftermarket channels has also been impacted by other trends affecting the cycling industry generally, such as growth in the number of cycling enthusiasts, growing participation in cycling events and cycling related sports, improving cycling infrastructure, increasing consumer focus on healthier lifestyle trends, growing focus on the environment and increasing purchases of mid to high-end bikes in emerging markets. We expect these positive growth trends to continue in 2011.
48
Table of Contents
Financial information and the refinancing and reorganization
The financial results presented in this section are those of our predecessors, SRAM Holdings, LLC and SRAM Corporation. See “Prospectus summary—Presentation of financial information.” Upon consummation of this offering, SRAM International Corporation will acquire 100% of the equity interests of SRAM Holdings, LLC and SRAM, LLC and its subsidiaries. SRAM International Corporation will be a holding company that controls SRAM Holdings, LLC, which in turn will control our operating company, SRAM, LLC. We will have no business operations or material assets other than our ownership of 100% of the outstanding equity interests of SRAM Holdings, LLC and its subsidiaries, including SRAM, LLC, and we will control the business and affairs of SRAM Holdings, LLC and SRAM, LLC and its subsidiaries. For additional information regarding the reorganization, see “The refinancing and reorganization.”
During the quarter in which the refinancing is consummated, our results of operations and liquidity will be impacted by: a $ expense associated with the write-off of unamortized deferred financing costs with respect to our existing credit facilities, the incurrence of $ in additional debt under our new credit facilities and the payment of $ to Trilantic and its co-investors to acquire their equity interests in SRAM Holdings, LLC. In addition, as a result of the refinancing, SRAM-SP2, Inc. will recognize a gain of $ million by obtaining control of SRAM Holdings, LLC.
Our results of operations and liquidity will also be affected as a result of the reorganization and this offering in a number of significant ways. In the quarter in which the reorganization is consummated, our historical financial statements will reflect the gain recognized by SRAM-SP2, Inc. resulting from its obtaining control over SRAM Holdings, LLC during the refinancing. Also in this quarter, we expect to incur an expense of approximately $ million related to the immediate accelerated vesting of incentive compensation units of SRAM Holdings, LLC, to incur expenses and fees of approximately $ million related to the reorganization and this offering, and to make a distribution of approximately $ million to SRAM Holdings, LLC’s pre-offering equity holders to cover the estimated federal and state income taxes payable with respect to their allocable shares of the estimated taxable income of SRAM Holdings, LLC from January 1, 2011 through the closing date of this offering.
In addition, we expect the following changes will have an ongoing impact on our results of operations and liquidity after the consummation of the refinancing, the reorganization and this offering: we will incur an annual expense in connection with the granting of awards under the new SRAM International Corporation 2011 Incentive Award Plan, depreciation and amortization expense will increase as a result of purchase accounting in connection with the refinancing, income tax expense will increase as a result of our reorganization as a C-corporation and interest expense will increase as a result of increased amounts outstanding under our new credit facilities.
2008 recapitalization
On September 30, 2008, we completed the 2008 recapitalization, pursuant to which Trilantic and its co-investors purchased a $234.8 million equity interest in SRAM. In connection with the 2008 recapitalization, we experienced an $88.5 million optionholder compensation expense due to the immediate vesting and exercise of outstanding stock options and buyout of certain options, which was allocated across our cost of sales, general and administrative expense, sales and marketing expense and product development expense for the year. In addition, we incurred transaction expenses of $9.0 million, consisting of legal, accounting and investment banking fees in connection with the 2008 recapitalization.
Note about segments We have two reportable segments, OEM and aftermarket. In addition, we report certain “corporate” costs, consisting of general and administrative costs not allocated to the OEM or aftermarket segments separately in our segmented results of operations below. Unallocated general and administrative costs include the following: payroll and related benefits, stock option and incentive unit compensation, finance and IT costs, transaction costs, litigation costs and other corporate operating costs.
49
Table of Contents
Results of operations
The statement of operations data for the years ended December 31, 2008, 2009 and 2010 are derived from the audited consolidated financial statements of our predecessor companies, which, in the opinion of management, includes all adjustments necessary for a fair presentation of our financial position and operating results for such periods and as of such dates. See note 13 of our historical financial statements included elsewhere in this prospectus for additional information regarding our segment reporting.
Year ended December 31, 2009 compared with year ended December 31, 2010
| 2009 | 2010 | |||||||||||||||||||||||
| Year ended December 31, (in thousands, except percentages) |
Amount | As a % of net sales |
Amount | As a % of net sales |
Period-to-period change |
|||||||||||||||||||
| Net sales |
$ | 399,581 | 100.0% | $ | 524,187 | 100.0% | $ | 124,606 | 31.2% | |||||||||||||||
| Cost of sales |
239,448 | 59.9% | 312,954 | 59.7% | 73,506 | 30.7% | ||||||||||||||||||
| Gross profit |
160,133 | 40.1% | 211,233 | 40.3% | 51,100 | 31.9% | ||||||||||||||||||
| Operating expenses |
||||||||||||||||||||||||
| General and administrative expense |
29,042 | 7.3% | 33,913 | 6.5% | 4,871 | 16.8% | ||||||||||||||||||
| Sales and marketing expense |
27,934 | 7.0% | 40,579 | 7.7% | 12,645 | 45.3% | ||||||||||||||||||
| Product development expense |
27,799 | 7.0% | 37,179 | 7.1% | 9,380 | 33.7% | ||||||||||||||||||
| 84,775 | 21.2% | 111,671 | 21.3% | 26,896 | 31.7% | |||||||||||||||||||
| Income (loss) from operations |
75,358 | 18.9% | 99,562 | 19.0% | 24,204 | 32.1% | ||||||||||||||||||
| Other income (expense) |
||||||||||||||||||||||||
| Interest expense, net |
(36,245 | ) | (9.1)% | (32,634 | ) | (6.2)% | 3,611 | (10.0)% | ||||||||||||||||
| Foreign currency exchange gain (loss) |
(3,221 | ) | (0.8)% | 237 | 0.0% | 3,458 | 107.4% | |||||||||||||||||
| Total other expense, net |
(39,466 | ) | (9.9)% | (32,397 | ) | (6.2)% | 7,069 | (17.9)% | ||||||||||||||||
| Income before income taxes |
35,892 | 9.0% | 67,165 | 12.8% | 31,273 | 87.1% | ||||||||||||||||||
| Income tax expense |
14,373 | 3.6% | 17,193 | 3.3% | 2,820 | 19.6% | ||||||||||||||||||
| Net income |
$ | 21,519 | 5.4% | $ | 49,972 | 9.5% | $ | 28,453 | 132.2% | |||||||||||||||
| Segment data |
||||||||||||||||||||||||
| Net sales |
||||||||||||||||||||||||
| OEM segment |
$ | 265,629 | 66.5% | $ | 348,879 | 66.6% | $ | 83,250 | 31.3% | |||||||||||||||
| Aftermarket segment |
133,952 | 33.5% | 175,308 | 33.4% | 41,356 | 30.9% | ||||||||||||||||||
| Total net sales |
$ | 399,581 | 100.0% | $ | 524,187 | 100.0% | $ | 124,606 | 31.2% | |||||||||||||||
| Income (loss) from operations |
||||||||||||||||||||||||
| OEM segment |
$ | 61,430 | 15.4% | $ | 83,321 | 15.9% | $ | 21,891 | 35.6% | |||||||||||||||
| Aftermarket segment |
41,286 | 10.3% | 53,440 | 10.2% | 12,154 | 29.4% | ||||||||||||||||||
| Corporate |
(27,358 | ) | (6.8)% | (37,199 | ) | (7.1)% | (9,841 | ) | 36.0% | |||||||||||||||
| Total income (loss) from operations |
$ | 75,358 | 18.9% | $ | 99,562 | 19.0% | $ | 24,204 | 32.1% | |||||||||||||||
Net sales increased $124.6 million, or 31.2%, to $524.2 million in 2010 from $399.6 million in 2009. Net sales in the OEM and aftermarket segments as a percentage of total net sales remained steady at 67% and 33%, respectively, in 2010, as compared to 67% and 34%, respectively, in 2009. During 2010, we increased prices of our existing products by 2% to 3% on average. In the OEM segment, net sales increased $83.3 million, or 31.3%, to $348.9 million in 2010 from $265.6 million in 2009. We attribute this increase primarily to specification gains across our bicycle company customers, particularly on mountain and road bikes, as well as volume increases
50
Table of Contents
driven by a return to historical bike production levels in the OEM segment after the global recession in 2009 and increased cycling participation. In the aftermarket segment, net sales increased $41.4 million, or 30.9%, to $175.3 million in 2010 from $134.0 million in 2009. This increase was a result of increased volumes, which we attribute to increased consumer preference for custom bike builds and component upgrades to existing bikes, robust retail sales driven by economic recovery and an increase in cycling participation.
Cost of sales increased $73.5 million, or 30.7%, to $313.0 million in 2010 from $239.4 million in 2009. The increase was primarily attributable to higher net sales and volume of products produced during the year, as described above. Cost of sales as a percentage of net sales remained mostly flat, decreasing to 59.7% in 2010 from 59.9% in 2009. The three components of cost of sales are material costs, labor costs and overhead costs. During 2010, material costs remained flat as a percentage of net sales at 45.9% as compared to 2009. Labor costs as a percentage of net sales decreased to 4.2% in 2010 from 4.9% in 2009, which was attributable to improved labor efficiency and automation in our production facilities. This decrease was offset by an increase in overhead costs. Overhead costs as a percentage of net sales increased in 2010 to 9.6% from 9.1% in 2009, primarily as a result of an $8.0 million expense related to the restructuring of our German operations.
Gross profit increased $51.1 million, or 31.9%, to $211.2 million in 2010 from $160.1 million in 2009. This increase in gross profit is attributable to the higher volumes and pricing that led to our increased net sales, as described above. Gross margin stayed relatively flat, increasing slightly to 40.3% in 2010 from 40.1% in 2009, which reflects cost of sales remaining proportional to our net sales growth.
General and administrative expense includes payroll and related benefits, and other general and administrative expense for our corporate, finance and information technology functions. General and administrative expense increased $4.9 million, or 16.8%, to $33.9 million in 2010 from $29.0 million in 2009. This increase was attributable to an increase in payroll-related expenses of $2.7 million resulting primarily from increased bonuses, an increase in incentive unit compensation expense of $3.4 million and a writedown of $1.3 million with respect to our old Indianapolis facility, which was partially offset by reduced litigation costs of $3.0 million. General and administrative expense as a percentage of net sales decreased to 6.5% in 2010 from 7.3% in 2009 as a result of our increase in net sales in 2010 coupled with the largely fixed nature of these costs.
Sales and marketing expense consists primarily of wages, salaries and other employee costs, as well as advertising, trade show and sponsorship costs. Sales and marketing expense increased $12.6 million, or 45.3%, to $40.6 million in 2010 from $27.9 million in 2009. This increase was primarily a result of increased spending of $5.7 million for marketing activities, including advertising costs and team and event sponsorship. Additionally, we incurred an increased commission expense of $1.3 million from expansion of our independent representative program and a higher compensation expense of $2.1 million resulting from additional headcount and increased bonus expense due to our return to our regular bonus plan in 2010 following a reduction in bonuses in 2009 and a $2.1 million increase in incentive unit compensation expense. Sales and marketing expense as a percentage of net sales increased to 7.7% in 2010 from 7.0% in 2009, as a result of our allocation of additional resources to marketing activities aimed at increasing our visibility in the market and supporting top line sales growth after emerging from the recession in 2009.
Product development expense consists primarily of wages, salaries and other employee costs, as well as product testing and prototype costs. Product development expense increased $9.4 million, or 33.7%, to $37.2 million in 2010 from $27.8 million in 2009. The increase was primarily a result of higher compensation expense of $4.4 million resulting from additional compensation expense due to higher headcount and bonus, increased incentive unit compensation expense of $2.7 million and increased prototype costs of $1.1 million. Product development expense as a percentage of net sales remained relatively flat from 2009 to 2010.
Income (loss) from operations increased $24.2 million, or 32.1%, to $99.6 million in 2010 from $75.4 million in 2009. The increase was a result of increased sales, which was partially offset by the increases in cost of sales
51
Table of Contents
and operating expenses, as described above. Operating margins remained relatively flat, increasing to 19.0% in 2010 from 18.9% in 2009. In the OEM segment, income from operations increased $21.9 million, or 35.6%, to $83.3 million in 2010 from $61.4 million in 2009, while operating margins increased slightly to 23.9% in 2010 from 23.1% in 2009. The increase in operating margin is primarily attributable to our ability to spread our cost basis over higher sales levels. In the aftermarket segment, income from operations increased $12.2 million, or 29.4%, to $53.4 million in 2010 from $41.3 million in 2009, while operating margins decreased slightly to 30.5% in 2010 from 30.8% in 2009. The decline in operating margin was the result of our increased sales and marketing costs for the aftermarket segment as we continued to increase our focus on growth in this segment.
Interest expense, net decreased $3.6 million, or 10.0%, to $32.6 million in 2010 from $36.2 million in 2009. The decrease was a result of lower interest rates on our existing credit facilities as a result of the refinancing of our credit facilities in April 2010, as well as a $75.4 million reduction of the debt outstanding under our existing credit facilities throughout the year.
Foreign currency exchange gain (loss) changed by $3.5 million to a gain of $0.2 million in 2010 from a loss of $3.2 million in 2009, primarily due to non-cash currency movement on intercompany balances between various subsidiaries, with Euro-denominated balances being the largest driver of the gain at $5.0 million.
Income tax expense increased $2.8 million, or 19.6%, to $17.2 million in 2010 from $14.4 million in 2009. The increase was a result of higher foreign tax expense as a result of higher net income in 2010. Our foreign pretax income as a percentage of total pretax income increased slightly to 82.8% in 2010 from 78.9% in 2009. The pretax income increase was partially offset by a decrease in the Taiwanese income tax rate, reducing our foreign effective tax rate from 19.0% in 2009 to 15.7% in 2010.
52
Table of Contents
Year ended December 31, 2008 compared with year ended December 31, 2009
| 2008 | 2009 | |||||||||||||||||||||||
| Year ended December 31, (in thousands, except percentages) |
Amount | As a % of net sales |
Amount | As a % of net sales |
Period-to-period change |
|||||||||||||||||||
| Net sales |
$ | 478,354 | 100.0% | $ | 399,581 | 100.0% | $ | (78,773 | ) | (16.5)% | ||||||||||||||
| Cost of sales |
310,725 | 65.0% | 239,448 | 59.9% | (71,277 | ) | (22.9)% | |||||||||||||||||
| Gross profit |
167,629 | 35.0% | 160,133 | 40.1% | (7,496 | ) | (4.5)% | |||||||||||||||||
| Operating expenses |
||||||||||||||||||||||||
| General and administrative expense |
77,846 | 16.3% | 29,042 | 7.3% | (48,804 | ) | (62.7)% | |||||||||||||||||
| Sales and marketing expense |
49,480 | 10.3% | 27,934 | 7.0% | (21,546 | ) | (43.5)% | |||||||||||||||||
| Product development expense |
46,506 | 9.7% | 27,799 | 7.0% | (18,707 | ) | (40.2)% | |||||||||||||||||
| Recapitalization costs |
8,952 | 1.9% | — | — | (8,952 | ) | (100)% | |||||||||||||||||
| 182,784 | 38.2% | 84,775 | 21.2% | (98,009 | ) | (53.6)% | ||||||||||||||||||
| Income (loss) from operations |
(15,155 | ) | (3.2)% | 75,358 | 18.9% | 90,513 | 597.2% | |||||||||||||||||
| Other income (expense) |
||||||||||||||||||||||||
| Interest expense, net |
(21,703 | ) | (4.5)% | (36,245 | ) | (9.1)% | (14,542 | ) | 67.0% | |||||||||||||||
| Foreign currency exchange gain (loss) |
4,072 | 0.9% | (3,221 | ) | (0.8)% | (7,293 | ) | (179.1)% | ||||||||||||||||
| Other expense, net |
(17,631 | ) | (3.7)% | (39,466 | ) | (9.9)% | (21,835 | ) | 123.8% | |||||||||||||||
| Income (loss) before income taxes |
(32,786 | ) | (6.9)% | 35,892 | 9.0% | 68,678 | 209.5% | |||||||||||||||||
| Income tax expense |
15,838 | 3.3% | 14,373 | 3.6% | (1,465 | ) | (9.2)% | |||||||||||||||||
| Net income (loss) |
$ | (48,624 | ) | (10.2)% | $ | 21,519 | 5.4% | $ | 70,143 | 144.3% | ||||||||||||||
| Segment data |
||||||||||||||||||||||||
| Net sales: |
||||||||||||||||||||||||
| OEM segment |
$ | 353,584 | 73.9% | $ | 265,629 | 66.5% | $ | (87,955 | ) | (24.9)% | ||||||||||||||
| Aftermarket segment |
124,770 | 26.1% | 133,952 | 33.5% | 9,182 | 7.4% | ||||||||||||||||||
| Total net sales |
$ | 478,354 | 100.0% | $ | 399,581 | 100.0% | $ | (78,773 | ) | (16.5)% | ||||||||||||||
| Income (loss) from operations |
||||||||||||||||||||||||
| OEM segment |
$ | 68,487 | 14.3% | $ | 61,430 | 15.4% | $ | (7,057 | ) | (10.3)% | ||||||||||||||
| Aftermarket segment |
34,062 | 7.1% | 41,286 | 10.3% | 7,224 | 21.2% | ||||||||||||||||||
| Corporate |
(117,704 | ) | (24.6)% | (27,358 | ) | (6.8)% | 90,346 | 76.8% | ||||||||||||||||
| Total income (loss) from operations |
$ | (15,155 | ) | (3.2)% | $ | 75,358 | 18.9% | $ | 90,513 | 597.2% | ||||||||||||||
Net sales decreased $78.8 million, or 16.5%, to $399.6 million in 2009 from $478.4 million in 2008. This decrease was primarily the result of a decline in overall bike production due to the global recession, offset in part by increased sales of our aftermarket products, which have slightly higher prices than our OEM products. Net sales in the OEM segment decreased to 67% of total net sales in 2009 compared to 74% in 2008 while net sales in the aftermarket segment increased to 34% of total net sales in 2009 compared to 26% in 2008. Our net sales in 2009 benefitted from increased sales of components for road bikes, for which prices and margins are typically higher, and the introduction of a number of high-end mountain bike components. Additionally we increased prices on average of 2 to 3% during the year. In the OEM segment, net sales decreased $88.0 million, or 24.9%, to $265.6 million in 2009 from $353.6 million in 2008. During 2009, bicycle companies reduced bike production globally in anticipation of slower consumer demand for fully assembled bikes as a result of the recession, which in turn decreased demand for our components and resulted in this decline in net sales. Despite this overall decline in bicycle production, we increased specifications on new bike models, positioning us to take
53
Table of Contents
advantage of rebounding volumes after the recession. In the aftermarket segment, net sales increased $9.2 million, or 7.4%, to $134.0 million in 2009 from $124.8 million in 2008. This increase was a result of a shift in retail demand during the recession from new bike purchases to component replacements and upgrades purchased in the aftermarket.
Cost of sales decreased $71.3 million, or 22.9%, to $239.4 million in 2009 from $310.7 million in 2008. This decrease was primarily attributable to lower net sales and volume during the year, as described above. As production volume decreased during the year, we were able to reduce our labor and other manufacturing-related costs by reducing the size of our manufacturing labor force, bringing certain manufacturing processes in-house and ongoing efficiency gains. These efforts reduced our effective cost of sales per unit significantly, resulting in a decrease in cost of sales as a percentage of net sales to 59.9% in 2009 from 65.0% in 2008. Material costs as a percentage of net sales decreased to 45.9% in 2009 from 49.6% in 2008, largely as a result of our ability to bring more manufacturing processes in-house and our continued aftermarket growth. Labor costs as a percentage of net sales decreased to 4.9% in 2009 from 5.3% in 2008, which was a result of ongoing efficiency gains in our factories. Overhead costs as a percentage of net sales decreased to 9.1% in 2009 from 10.1% in 2008 as a result of the consolidation of our two facilities in China, which provided $3.0 million of savings, cost reduction efforts at our factories in response to lower sales volumes and $2.1 million of savings from reduced option compensation expense.
Gross profit decreased $7.5 million, or 4.5%, to $160.1 million in 2009 from $167.6 million in 2008. This decrease in gross profit was attributable to the lower volumes that led to the decrease in our net sales, as described above. Gross margin increased to 40.1% in 2009 from 35.0% in 2008. The increase in gross margin reflected increased net sales of our higher-margin aftermarket products, as well as the labor and other manufacturing-related cost reductions taken in response to decreased demand in our OEM segment resulting from the global recession.
General and administrative expense decreased $48.8 million, or 62.7%, to $29.0 million in 2009 from $77.8 million in 2008. This decrease was primarily a result of a reduction in share-based compensation expense of $50.1 million due to the expense recognized in 2008 of $51.3 million in connection with the 2008 recapitalization, partially offset by a litigation accrual of $3.0 million in 2009 related to a European patent case. In addition, as part of our cost-reduction efforts in 2009, we eliminated bonuses for certain senior employees and we reduced the bonus payout for all other employees, resulting in an expense reduction of $2.8 million. General and administrative expense as a percentage of net sales decreased to 7.3% in 2009 from 16.3% in 2008, which reflects the cost reductions discussed above.
Sales and marketing expense decreased $21.5 million, or 43.5%, to $27.9 million in 2009 from $49.5 million in 2008. This decrease was primarily a result of a reduction in share-based compensation expense of $16.8 million due to the expense of $17.8 million recognized in 2008 in connection with the 2008 recapitalization, a reduction in marketing and advertising spending of $2.2 million, employee-related cost reduction efforts of $0.9 million (which includes the elimination of bonuses for certain senior employees and reduced bonuses for all other employees) and a reduction in travel costs of $0.8 million. Sales and marketing expense as a percentage of net sales decreased to 7.0% in 2009 from 10.3% in 2008, which reflects the cost reductions discussed above.
Product development expense decreased $18.7 million, or 40.2%, to $27.8 million in 2009 from $46.5 million in 2008. The decrease was a result of a reduction in share-based compensation expense of $15.8 million due to the expense of $17.2 million recognized in 2008 in connection with the 2008 recapitalization, cost reduction efforts aimed at streamlining the product development process, including reductions in product development employee costs from decreased bonus payments and reduced hiring in this area of $1.9 million, reductions in product development-related spending on travel of $0.5 million and reductions in outside consulting and prototype costs of $0.4 million. Product development expense as a percentage of net sales decreased to 7.0% in 2009 from 9.7% in 2008, which reflects the cost reductions discussed above.
54
Table of Contents
Income (loss) from operations changed by $90.5 million to $75.4 million in 2009 from a loss of $15.2 million in 2008. The change was primarily a result of the cost reduction measures taken in 2009 in response to the global recession, combined with the fact that our 2008 loss from operations included optionholder compensation expense of $88.5 million and transaction costs of $9.0 million related to the 2008 recapitalization. Operating margin changed to 18.9% in 2009 from (3.2)% in 2008. This change was a result of the expense reductions discussed above, increased sales of higher-margin products in the aftermarket and increased sales of components for road bikes, for which prices and margins are typically higher than mountain or pavement bikes, and the successful introduction of a number of high-end higher-margin mountain bike components. Income from operations in the OEM segment decreased $7.1 million, or 10.3%, to $61.4 million in 2009 from $68.5 million in 2008. The decrease was primarily a result of a decrease in net sales. Despite the decline in OEM sales, operating margin in the OEM segment increased to 23.1% in 2009 from 19.4% in 2008. This increase resulted from increased sales of components for road bikes and the introduction of a number of high-end higher-margin mountain bike components, as discussed above. In addition, operating margins improved as a result of the cost reductions we made in response to the global recession, as discussed above. Income from operations in the aftermarket segment increased $7.2 million, or 21.2%, to $41.3 million in 2009 from $34.1 million in 2008. This increase was the result of increased sales of our aftermarket products resulting from the shift in retail demand during the recession from new bike purchases to component replacements discussed above. Operating margin in the aftermarket increased to 30.8% in 2009 from 27.3% in 2008, primarily as a result of our 2009 cost reduction efforts.
Interest expense, net increased $14.5 million, or 67%, to $36.2 million in 2009 from $21.7 million in 2008. The increase was a result of increased indebtedness and higher average interest rates on the credit facilities entered into in connection with the 2008 recapitalization, which were outstanding for only the last quarter of 2008 and consisted of a $240.0 million term loan accruing interest at a floating rate of approximately 8.0% and a $110.0 million subordinated note accruing interest at 13.0%. Prior to the 2008 recapitalization, we had a $40.0 million term facility accruing interest at 6.6% and a revolving facility with an average outstanding balance of $59.0 million accruing interest at a 5.0% average interest rate.
Foreign currency exchange gain (loss) changed by $7.3 million from a gain of $4.1 million in 2008 to a loss of $3.2 million in 2009, primarily due to non-cash currency movement on intercompany balances between various subsidiaries, with Euro-denominated balances of $5.9 million being the largest driver of the gain.
Income tax expense decreased $1.5 million, or 9.2%, to $14.4 million in 2009 from $15.8 million in 2008. The decrease was a result of lower foreign taxes paid due to lower taxable income for the year. Foreign pretax income decreased to $28.3 million in 2009 from $64.4 million in 2008. During this same period, our effective foreign tax rate decreased to 19.0% from 21.4% as income and activity shifted to lower tax jurisdictions in Asia.
Liquidity and capital resources
Our primary uses of cash are to fund working capital, operating expenses, debt service and capital expenditures. Historically, our primary sources of liquidity have been cash flows from operations and the use of our credit facilities. We believe that the cash generated by operations and cash and cash equivalents, together with the borrowing availability under our existing credit facilities, will be sufficient to meet our working capital needs for the foreseeable future, including investments made and expenses incurred in connection with our growth strategy.
Upon completion of this offering, we will have $ million outstanding under our new credit facilities, which will accrue interest at variable rates. Therefore, a substantial portion of our cash flows will be used to meet our interest obligations and will not be available for other purposes. Our ability to meet our debt service obligations under our new credit facilities and to reduce our total debt will depend on our future operating performance and on economic, financial, competitive and other factors, as well as future interest rates.
55
Table of Contents
On or about the date of the closing of this offering, SRAM Holdings, LLC will make a $ million distribution to its pre-offering equity holders to cover the estimated federal and state income taxes payable with respect to their allocable shares of the estimated taxable income of SRAM Holdings, LLC from January 1, 2011 through the closing date of this offering. In addition, we expect to incur a series of severance expenses in 2011 and 2012 related to the 2010 restructuring of our German operations. We expect these expenses to be approximately $0.9 million in the first quarter of 2011, $0.8 million in the second quarter of 2011, and $0.3 million in each of third and fourth quarters of 2011 and the first and second quarters of 2012. For additional information regarding the impact of the refinancing and the reorganization on our financial condition, See “—Financial information and the refinancing and reorganization.
Sources and uses of cash
The following table presents the major components of net cash flows provided by and used in operating, investing and financing activities for the periods indicated. As of December 31, 2010, we had cash and cash equivalents of $19.4 million, compared to cash and cash equivalents of $33.7 million as of December 31, 2009.
| Year ended December 31, (in thousands) |
2008 | 2009 | 2010 | |||||||||
| Cash provided by (used in) |
||||||||||||
| Operating activities |
$ | 19,136 | $ | 58,548 | $ | 88,691 | ||||||
| Investing activities |
(10,328 | ) | (6,095 | ) | (17,378 | ) | ||||||
| Financing activities |
6,871 | (44,979 | ) | (88,353 | ) | |||||||
| Effect on exchange rates on cash |
1,112 | (885 | ) | 2,760 | ||||||||
| Net change in cash and cash equivalents |
$ | 16,791 | $ | 6,589 | $ | (14,280 | ) | |||||
Cash flows from operating activities
In 2010, cash flows provided by operating activities totaled $88.7 million and consisted of $50.0 million of net income, non cash items of $35.5 million plus $3.2 million for working capital activities, including uses of cash of $17.4 million from accounts receivables and $5.2 million from inventory, and a source of cash of $15.0 million from accounts payable, driven by increased net sales as compared to the prior year. Non-cash items for 2010 included $15.5 million of depreciation and amortization, $12.4 million of incentive unit stock compensation expense resulting from an increase in SRAM’s valuation and $7.8 million in amortization and write off of deferred financing fees related to our existing credit facilities, which we entered into in April 2010.
In 2009, cash flows provided by operating activities totaled $58.5 million and consisted of $21.5 million of net income, $23.2 million of non cash items plus $13.9 million of working capital activities, including sources of cash of $6.5 million from accounts receivable and $8.6 million from inventory, and a use of cash of $1.8 million from accounts payable, driven by decreased sales as compared to the prior year. Non-cash items included $15.2 million of depreciation and amortization, $3.7 million of incentive unit compensation expense, $2.9 million of amortization of deferred financing fees related to the 2008 recapitalization and $2.2 million of paid-in-kind interest on the mezzanine loan we entered into in connection with the 2008 recapitalization.
In 2008, cash flows provided by operating activities totaled $19.1 million and consisted of $(48.6) million of net loss, non cash items of $81.0 million less $13.2 million for working capital activities, including uses of cash of $1.7 million from accounts receivable and $4.6 million from inventory and a use of cash of $9.2 million from accounts payable, driven by increased net sales as compared to the prior year. Non-cash items included $15.8 million of depreciation and amortization, $61.6 million of stock option compensation expense related to accelerated vesting of stock options in connection with the 2008 recapitalization, $1.5 million in amortization and write off of deferred financing fees related to the 2008 recapitalization and $0.6 million of paid-in-kind interest related to the mezzanine loan.
56
Table of Contents
Cash flows from investing activities
Net cash used in investing activities relates almost entirely to capital expenditures. The majority of our capital expenditures are used for machinery, equipment and tooling purchases for our production facilities in order to support our continued growth. In 2010, cash flows used in investing activities totaled $17.4 million, which included $6.1 million related to the construction of our new facility in Indianapolis. In 2009, net cash used in investing activities totaled $6.1 million. Our investment expenditures were lower in 2009 than either 2008 or 2010 as we curtailed capital expenditures in response to the global recession. The focus of capital spending in 2009 was on maintaining our existing machinery, equipment and tooling for new product introductions, as opposed to purchases of new equipment. In 2008, cash flows used in investing activities totaled $10.3 million. In 2011, we expect our capital expenditures to be consistent with 2010, with a focus on machinery, equipment and tooling purchases to support the growth of our business.
Cash flows from financing activities
In 2010, cash flows used in financing activities totaled $88.4 million. During the year, we reduced the outstanding amounts under our term facilities and prior mezzanine loans by $75.4 million. We also incurred debt issuance costs of $6.0 million related to the refinancing of our credit facilities in 2010. Additionally, we made a distribution of $7.0 million to SRAM Holdings, LLC unitholders for the income tax liability attributable to their earnings. In 2009, cash flows used in financing activities totaled $45.0 million. During 2009, we reduced the debt outstanding under our credit facilities by $42.4 million. Additionally, we made a distribution of $2.6 million to SRAM Holdings, LLC unitholders for the income tax liability attributable to their earnings. In 2008, cash flows provided by financing activities totaled $6.9 million, which was primarily attributable to the 2008 recapitalization and included borrowings under a new credit facility of $338.3 million, borrowings and repayment of debt under prior credit facilities of $86.9 million and $196.2 million, respectively, the payment of a distribution of $240.9 million to SRAM-SP2, Inc. proceeds of $12.2 million in connection with exercised options and a capital contribution for SRAM Cycling Advocacy Fund, LLC of $10.0 million.
Our borrowings
Existing credit facilities
Our existing credit facilities consist of a $25.0 million revolving credit facility and a $290.0 million term loan facility, which mature on April 30, 2015. The borrower under our existing credit facilities is SRAM, LLC. We entered into our existing credit facilities on April 30, 2010 to refinance the $172.1 outstanding under our prior credit facilities and the $113.3 million outstanding under a prior mezzanine credit facility, each of which we had entered into in connection with Trilantic and its co-investors’ 2008 equity investment in SRAM.
Revolving credit facility. In April 2010, SRAM, LLC entered into a $25.0 million revolving credit facility. The revolving credit facility includes a $10.0 million letter of credit sub-facility and a swingline sub-facility of up to $10.0 million. Outstanding letters of credit are subject to a letter of credit fee equal to the Eurodollar margin on the revolver. The revolving credit facility is subject to an unused line fee of 0.50%. As of December 31, 2010, we had no amounts drawn under the revolving credit facility and no outstanding letters of credit which would reduce the remaining undrawn portion of the revolving credit facility that is available for future borrowing.
Term loan. In April 2010, SRAM, LLC also entered into a $290.0 million term loan facility. The term loan facility was drawn in its entirety at the closing of the facility. As of December 31, 2010, we had $235.0 million outstanding under the term loan facility. Initially, the term loan amortized in quarterly installments of $0.7 million, which commenced on June 30, 2010, with a bullet payment due on the fifth anniversary of the closing date. As of December 31, 2010, due to our prepayments of amounts outstanding under the facility during 2010,
57
Table of Contents
no additional quarterly installments are required prior to maturity. In addition to the regularly scheduled amortization payments, an excess cash flow recapture equal to 50% is applied to the term loan for each year, with a step down to 0% based on leverage.
Collateral for existing credit facilities. Collateral for the existing credit facilities includes equity interests in our domestic subsidiaries, and first priority security interests in substantially all of the existing and after-acquired real and personal property of SRAM Holdings, LLC and each guarantor (including guarantors that are foreign subsidiaries). Collateral also includes 100% of the equity interests in the foreign subsidiaries of SRAM Holdings, LLC.
Financial covenants. The financial covenants in our existing credit facilities include minimum fixed charge coverage and maximum total leverage ratios.
New credit facilities
Prior to this offering, we expect SRAM, LLC to enter into new credit facilities consisting of a first-lien term credit facility a second-lien term loan facility and a revolving facility. The material terms of the new credit facilities have not yet been determined. We intend to use the proceeds from the new credit facilities to repay amounts outstanding under our existing credit facilities. See “The refinancing and reorganization” and “Use of proceeds.”
Contractual obligations and commitments
As of December 31, 2010, our commitments and contractual obligations are as follows:
| As of December 31, (in thousands) |
2011 | 2012 | 2013 | 2014 | 2015 | After 2015 | Total | |||||||||||||||||||||
| Long term debt(1) |
||||||||||||||||||||||||||||
| GE Capital Corporation senior note |
$ | 75,000 | $ | 80,000 | $ | 80,000 | $ | — | $ | — | $ | — | $ | 235,000 | ||||||||||||||
| Interest on long term debt |
12,263 | 6,107 | 2,075 | — | — | — | 20,445 | |||||||||||||||||||||
| Operating leases(2) |
4,195 | 3,641 | 3,378 | 2,703 | 2,381 | 3,071 | 19,369 | |||||||||||||||||||||
| Postretirement obligations |
602 | 634 | 695 | 762 | 1,017 | 3,679 | 7,389 | |||||||||||||||||||||
| Germany restructuring(3) |
3,077 | 1,296 | 296 | — | — | — | 4,669 | |||||||||||||||||||||
| Litigation(4) |
308 | — | — | — | — | — | 308 | |||||||||||||||||||||
| Other long term obligations(5) |
384 | 125 | 125 | 125 | 42 | — | 801 | |||||||||||||||||||||
| Total contractual obligations |
$ | 95,829 | $ | 91,803 | $ | 86,569 | $ | 3,590 | $ | 3,440 | $ | 6,750 | $ | 287,981 | ||||||||||||||
| (1) | Amounts represent expected principal and interest payments consistent with historical principal payments on our existing credit facilities. The total principal amount of $235.0 million is contractually due in full in 2015. 2011 also includes $0.8 million of accrued interest payable at December 31, 2010 due in January 2011. We intend to enter into new credit facilities and repay all outstanding amounts due under our existing credit facilities prior to the consummation of this offering. See “The refinancing and reorganization.” |
| (2) | After 2015 amount represents certain operating lease obligations for our France, Germany, Ireland and Taiwan locations, converted at Euro rate of 0.7704 and New Taiwan Dollar rate of 30.479. |
| (3) | Germany restructuring amounts represent payments associated with the transfer of manufacturing to Asia. |
| (4) | Litigation amounts represent royalty payments and legal fees related to various legal proceedings. |
| (5) | 2011 other long term obligations represent a commitment fee of 0.50% on the unused portion of our existing revolving credit facility and commissions payable in January 2011. Other long term obligations from 2012 and onward represent only the unused fee owed on our existing revolving credit facility. |
58
Table of Contents
Off-balance sheet arrangements
We have not created, and are not party to, any special-purpose or off-balance sheet entities for the purpose of raising capital, incurring debt or operating our business. We do not have any off-balance sheet arrangements or relationships with entities that are not consolidated into our financial statements that have or are reasonably likely to have a material current or future effect on our financial condition, changes in financial condition, sales, expenses, results of operations, liquidity, capital expenditures or capital resources.
Critical accounting policies
The preparation of financial statements in conformity with accounting principles generally accepted in the United States of America requires management to make estimates and assumptions that affect the reported amounts of assets and liabilities and disclosure of contingent assets and liabilities at the date of the financial statements, and the reported amounts of revenue and expenses during the reporting period. Critical accounting policies are those that are the most important portrayal of our financial condition and results of operations, and require our most difficult, subjective and complex judgments as a result of the need to make estimates about the effect of matters that are inherently uncertain. In applying such policies, we must use some amounts that are based upon our informed judgments and best estimates. Estimates, by their nature, are based on judgments and available information. The estimates that we make are based upon historical factors, current circumstances and the experience and judgment of management. We evaluate our assumptions and estimates on an ongoing basis.
Goodwill
We review goodwill for impairment at the end of each year, and on an interim basis whenever events or changes in circumstances indicate that the carrying value of our reporting units may not be recoverable. A reporting unit is an operating segment or one level below an operating segment for which discrete financial information is prepared and is regularly reviewed by management. We define our reporting units as OEM and aftermarket, which are equivalent to our operating and reportable segments. The trends that we specifically monitor for each of our reporting units are as follows:
| • | Significant variances in financial performance (e.g. revenues, earnings and cash flows) in relation to expectations and historical performance; |
| • | Significant changes in end markets or other economic factors; and |
| • | Significant changes in customer relationships and competitive conditions. |
The impairment test for goodwill is a two-step process. The first step is to compare the fair value of a reporting unit with its carrying amount. If the carrying value of a reporting unit exceeds its fair value, the second step is performed to measure the amount of the impairment loss, if any. In this second step, if the carrying value of the reporting unit’s goodwill exceeds the implied fair value of that goodwill, an impairment loss is recognized in an amount equal to the excess, not to exceed the carrying amount of goodwill.
We determine the fair value of our reporting units by combining two valuation methods. A discounted future cash flow analysis (DCF) is used to determine our consolidated enterprise value and market multiples of comparable publicly-traded companies are used to substantiate the fair value of our reporting units. For the DCF method, we prepare annual projections of future cash flows over a period of six years (the “discrete projection period”), and apply a terminal value assumption to the final year within the discrete projection period to estimate the total value of the cash flows beyond the final year. Projections of future cash flows are based on the estimated net debt-free cash flows. These cash flows are then discounted to their present value as
59
Table of Contents
of the valuation date at an estimated cost of capital. The estimated cost of capital is derived by a weighted average cost of capital (WACC) using the capital asset pricing model (CAPM), based in part on guideline publicly-traded companies. The terminal value is estimated using the Gordon Growth model, which is based on the expected cash flows of the last year in the discrete projection period, the expected long-term growth rate, and the WACC.
In the market multiples method, fair value is determined by applying a multiple to EBITDA (earnings before interest, taxes, depreciation and amortization). The EBITDA multiple reflects the risk of cash flows generated by an entity. We use peer groups with similar risk profiles as well as the implied multiple from our DCF analysis to determine the appropriate multiple for our reporting units.
The determination of the reporting unit fair value includes numerous uncertainties and, a material change in assumptions utilized or in the conditions and circumstances influencing fair values, could have a significant effect on our goodwill impairment assessment.
No impairment charges to goodwill were recorded during 2008, 2009 or 2010 and the fair value of our reporting units was substantially in excess of the respective carrying values. While the WACC is only one of several important estimates used in the analysis, we determined that an increase of one percentage point in the WACC used for each respective reporting unit would not have resulted in an impairment indicator for our reporting units at the time of this analysis.
Product warranty costs
Reserves are recorded on the balance sheet to reflect our contractual liabilities relating to warranty commitments to customers. After the original purchase date, two years of warranty coverage is provided to customers for defects in materials and workmanship. An estimate for warranty expense is recorded at the time of sale within cost of sales based on historical warranty return rates and all repair costs to satisfy claims, including labor and materials. Product warranty liabilities are included within accrued expenses and other current liabilities on the consolidated balance sheets at December 31, 2009 and 2010. A 10% change in historical warranty rates used to estimate the liability would have affected net income by $0.3 million, $0.3 million and $0.4 million for the years ended December 31, 2008, 2009 and 2010.
Stock based compensation
In accordance with the accounting standards for share based payments, all share based payments, including grants of equity-classified incentive units and stock options, are required to be recognized in the consolidated statement of operations as an operating expense, based on their grant date fair values, over the requisite service period.
The liability-classified incentive awards are re-measured at fair value at each reporting date until settlement and the changes in fair value are also recorded in the consolidated statement of operations as an operating expense.
Incentive units
As of each grant date and year end, we performed valuations consistent with the American Institute of Certified Public Accountants Practice Aid, “Valuation of Privately-Held Company Equity Securities Issued as Compensation” (AICPA Practice Aid) to calculate the fair value of our incentive units.
Valuations as of December 31, 2008 and December 31, 2009
We used a Black-Scholes option pricing model to estimate the grant date fair value. Inputs include the fair value of the underlying assets distributable to award holders (based on our enterprise value and the terms of the awards), estimated price volatility, dividend yield and the risk-free interest rate. In determining our enterprise
60
Table of Contents
value, we used the DCF method. The expected volatility is based on the historical volatility of publicly-traded companies that are similar in size, industry, growth stage, or business model. The expected dividend yield represents the expected annual dividends to be paid to award holders over the term of the incentive units, and the risk-free interest rate is based on United States Treasury rates with remaining terms similar to the expected term of the incentive units. The 2008 and 2009 valuations utilized the following Black-Scholes assumptions:
| December 31, 2008 | December 31, 2009* | |||||||
| Expected volatility |
39.6% | 47.2% | ||||||
| Expected dividend yield |
0% | 0% | ||||||
| Expected term (in years) |
6 | 5 | ||||||
| Risk free interest rate |
2.1% | 2.0% | ||||||
| * | There was no material difference between the valuation performed on December 1, 2009 and December 31, 2009 |
Valuations as of July 23, 2010 and December 31, 2010
As we assessed the prospects of an initial public offering, starting in mid-2010 we began using multiple valuation techniques. We established our enterprise value through an equal weighting between (a) the income approach in the form of the DCF method and (b) the market approach in the form of the guideline public company method. For the guideline public company method, we selected a group of publicly-traded companies that are similar in size, industry, growth stage, or business model. The valuation multiples considered for providing indicated values were the ratio of enterprise value to the last twelve months and estimated future EBITDA and the ratio of the market value of equity (MVE) to the last twelve months and estimated future net income. Both enterprise value and MVE of each guideline public company were calculated based on closing stock prices as of the respective valuation dates.
After establishing our enterprise value, we added back cash and cash equivalents and deducted outstanding debt to determine our total equity value. We then allocated the total equity value among the securities that comprise our capital structure using an average of the Black-Scholes method and the probability-weighted expected return method (PWERM), as described in the AICPA Practice Aid.
The Black-Scholes method utilized the following assumptions:
| July 23, 2010 | December 31, 2010 | |||||||
| Expected volatility |
35.0% | 35.0% | ||||||
| Expected dividend yield |
0% | 0% | ||||||
| Expected term (in years) |
1.0 | 0.5 | ||||||
| Risk free interest rate |
0.3% | 0.2% | ||||||
We used the PWERM due to:
| • | our improved financial results as demonstrated by strong sales growth and improving profitability; |
| • | our favorable growth prospects and expectations for continued improvement in profitability; and |
| • | the increasing prospects on an initial public offering or sale/merger. |
The PWERM estimates value based upon an analysis of future values of the enterprise assuming various outcomes such as an IPO, merger or sale, dissolution or continued operation as a viable enterprise. Unit value is based upon the probability-weighted present value of expected future investment returns, considering each of the possible future outcomes available to the enterprise, as well as the rights of each unit class.
61
Table of Contents
The PWERM utilized the following assumptions:
| July 23, 2010 | December 31, 2010 | |||||||
| IPO scenario |
75.0% | 75.0% | ||||||
| M&A scenario |
20.0% | 20.0% | ||||||
| No value scenario |
5.0% | 5.0% | ||||||
Incentive unit fair value under the IPO scenario reflects the equity value by the estimated IPO price, allocated according to (a) the projected Class A liquidation preference at the assumed IPO date, (b) the distribution thresholds associated with the incentive units and (c) the participating distribution ratios of each class of equity. Incentive unit fair value under the M&A scenario reflects the equity value by the estimated sales price allocated in the same manner as the IPO scenario. Under the no value scenario, upon a liquidity event, our distributions would not exceed the specified distribution thresholds, therefore resulting in a $0 value for the incentive units.
The suggested values from the Black-Scholes method and PWERM reflect a fully marketable security that is not burdened by limited marketability; however, our incentive units represent economic interests in a privately held company without a ready market for its units. Therefore, we considered it necessary to incorporate a discount for lack of marketability to reflect the most likely time horizons until an incentive unitholder can achieve liquidity.
The fair value per unit for each of our grants is summarized in the following table:
| Grant date | Valuation date | |||||||||||||||||||
| 12/31/2008 | 12/1/2009 | 12/31/2009 | 7/23/2010 | 12/31/2010 | ||||||||||||||||
| 12/31/2008 |
$ | 21.03 | N/A | $ | 29.04 | N/A | $ | 104.73 | ||||||||||||
| 12/1/2009 |
N/A | 29.04 | 29.04 | N/A | 104.73 | |||||||||||||||
| 7/23/2010 |
N/A | N/A | N/A | 81.01 | 98.16 | |||||||||||||||
Comparison from December 31, 2008 to December 31, 2009
The primary factors that supported these estimates, and which contributed to an increase in the estimated value of the incentive units were:
| • | higher than expected operating results primarily driven by stronger than anticipated profitability; |
| • | strong demand for our products in the aftermarket channel; |
| • | increased retention of cash; and |
| • | improved forecast profitability. |
Comparison from December 31, 2009 to July 23, 2010
The primary factors that supported these estimates, and which contributed to an increase in the estimated value of the incentive units were:
| • | continued strong demand for our products in the aftermarket channel and a return to pre-recession demand in the OEM channel; |
| • | improved financial results as demonstrated by strong sales growth and profitability; |
62
Table of Contents
| • | decreased market risk and uncertainty associated with continuing improvement of economic trends; and |
| • | improvement in the capital markets which generally increased business valuations. |
Comparison from July 23, 2010 to December 31, 2010
The primary factors that supported these estimates, and which contributed to an increase in the estimated value of the incentive units were:
| • | continued improvement in our financial results; |
| • | our favorable growth prospects and expectations for continued improvement in profitability; |
| • | improved guideline public company valuations; |
| • | continued improvement in the capital markets which generally increased business valuations; and |
| • | efforts undertaken to prepare for and expectations of an initial public offering. |
Stock options. We used a Black-Scholes option pricing model to estimate the grant date fair value of our stock options. The inputs we use in estimating the fair value include expected stock price volatility over the term of the awards, dividend yield and the risk-free interest rate. The expected term of stock options granted represents the period of time that stock options granted are expected to be outstanding. The expected volatility is based on the historical volatility of publicly-traded companies that are similar in size, industry, growth stage, or business model. The expected dividend yield represents the expected annual dividends to be paid to stockholders over the term of the stock options, and the risk-free interest rate is based on United States Treasury rates with remaining terms similar to the expected term of the stock options. There were no options granted in 2008, 2009 or 2010.
Income taxes
For federal income taxation purposes, SRAM Holdings, LLC is taxed as a partnership. Consequently, income and losses flow directly through to the members of SRAM Holdings, LLC. Accordingly, no provision for U.S. federal income taxes has been reflected in the consolidated financial statements of SRAM Holdings, LLC.
Income taxes in foreign jurisdictions and certain U.S. state taxes are accounted for under the asset and liability method. Deferred tax assets and liabilities are recognized for the future tax consequences attributable to differences between the carrying amounts of existing assets and liabilities in the financial statements and their respective tax bases. Deferred tax assets and liabilities are measured using enacted tax rates expected to apply to taxable income in the years in which those temporary differences are expected to be recovered or settled. The effect on deferred tax assets and liabilities of a change in tax rates is recognized in income in the period that includes the enactment date. A valuation allowance is established if it is more likely than not that a deferred tax asset will not be realized. In determining the appropriate valuation allowance, we consider projected realization of tax benefits based on expected levels of future taxable income, available tax planning strategies and its overall deferred tax position. As of December 31, 2010, we believe that it is more likely than not that we will have future taxable income to utilize our deferred tax assets. Therefore, we have not provided a valuation allowance against any of our deferred tax assets.
The amount of income tax that we pay annually is dependent on various factors, including the timing of certain deductions and ongoing audits by foreign and state tax authorities, which may result in proposed adjustments. We perform reviews of our income tax positions on a quarterly basis and accrue for potential uncertain tax positions. Accruals for these uncertain tax positions are recorded based on an expectation as to the timing of when the matter will be resolved. As events change or resolution occurs, these accruals are adjusted, such as in
63
Table of Contents
the case of audit settlements with taxing authorities. We believe we have adequately provided for any reasonably foreseeable outcome related to these matters. Our future results may include favorable or unfavorable adjustments to our estimated tax liabilities due to closure of income tax examinations, statute expirations, new regulatory or judicial pronouncements, changes in tax laws, changes in projected levels of taxable income, future tax planning strategies or other relevant events.
Fair value of financial instruments
The fair value guidance establishes a three-level valuation hierarchy for financial instruments. These valuation techniques are based upon the transparency of inputs (observable and unobservable) to the valuation of an asset or liability as of the measurement date. Observable inputs reflect market data obtained from independent sources, while unobservable inputs reflect our market assumptions. These two types of inputs create the following fair value hierarchy:
Level 1—Valuation is based on quoted prices for identical assets or liabilities in active markets;
Level 2—Valuation is based on quoted prices for similar assets or liabilities in active markets, or other inputs that are observable for the asset or liability, either directly or indirectly, for the full term of the financial instrument; and
Level 3—Valuation is based upon other unobservable inputs that are significant to the fair value measurement.
Our financial instruments consist primarily of cash and cash equivalents, trade receivables, trade payables, and long-term debt. Management considers the carrying values of cash and cash equivalents, trade receivables and trade payables to be representative of their respective fair values because of their short-term maturities or expected settlement dates. We measure the fair value of our long-term borrowings using a DCF technique that incorporates a market interest yield curve with adjustments for our projected payment schedule, duration, optionality and risk profile. In determining the market interest yield curve, the Company considered its corporate ratings from Moody’s and S&P, as well as other companies with similarly rated debt securities.
Effects of inflation
We do not believe that our sales or operating results have been materially impacted by inflation during the periods presented in our financial statements. There can be no assurance, however, that our sales or operating results will not be impacted by inflation in the future.
Quantitative and qualitative disclosures about market risk
Market risk represents the risk of changes in the value of market risk sensitive instruments caused by fluctuations in interest rates and commodity prices. Changes in these factors could cause fluctuations in the results of our operations and cash flows. In the ordinary course of business, we are primarily exposed to interest rate risks and changes in foreign currency exchange rates.
Interest rate risk
Our existing credit facilities bear interest at a variable rate tied to LIBOR or prime rate, at our option, and, therefore, our statement of operations and our cash flows will be exposed to changes in interest rates. A one percentage point change in the interest rates applicable to each of our credit facilities in 2010 (for the respective periods for which they were effective) would have caused an increase to interest expense of approximately $2.6 million for 2010. As of December 31, 2010, we had one interest rate swap agreement for $75.0 million, effectively converting that portion of debt from variable rate to fixed rate. The swap agreement
64
Table of Contents
expires in October 2011. In the future, in an effort to mitigate losses associated with these risks, we may at times enter into additional derivative financial instruments.
Foreign currency risk
For the year ended December 31, 2010, we generated approximately 59% of our net sales in U.S. Dollars, 32% of our net sales in New Taiwan Dollars, 8% of net sales in Euros and 1% of our net sales in RMB. The reporting currency for our consolidated financial statements is U.S. Dollars. Our results of operations could be adversely impacted by changes in exchange rates. For example, if we recognize international sales in local foreign currencies, as the U.S. Dollar strengthens it would have a negative impact on our international results upon translation of those results into U.S. Dollars upon consolidation. To an extent, there is a natural hedge against foreign currency changes due to the fact that, while certain receipts for international sales may be denominated in a foreign currency, certain production and distribution expenses are also denominated in foreign currencies, mitigating fluctuations to some extent depending on their relative magnitude. As a result, fluctuations of 10% in foreign currency rates would not have a material impact on our earnings or results of operations. We historically have not engaged in foreign exchange rate hedging activities and do not intend to do so in the foreseeable future. However, in the future, in an effort to mitigate losses associated with these risks, we may at times enter into derivative financial instruments.
Internal controls over financial reporting
As a public company, we will be required to comply with the standards adopted by the Public Company Accounting Oversight Board in compliance with the requirements of Section 404 of Sarbanes-Oxley regarding internal control over financial reporting. Prior to becoming a public company, we are not required to be compliant with the requirements of Section 404.
In preparation for this offering and for future compliance with Section 404 of Sarbanes Oxley, we and our independent auditors identified material weaknesses in our internal controls over financial reporting. A material weakness is a deficiency, or combination of deficiencies, in internal control over financial reporting, such that there is a reasonable possibility that a material misstatement of our financial statements will not be prevented, or detected and corrected on a timely basis. The material weaknesses were attributed to us not maintaining sufficient: external reporting, technical accounting and tax functions; financial reporting and closing processes with respect to complex transactions; and written policies and procedures, in each case to meet our needs as a public company. We have begun implementing measures and plan to take additional steps to remediate the underlying causes of our material weakness.
65
Table of Contents
We are currently implementing a remediation plan to improve the effectiveness of our internal controls over financial reporting. The plan includes:
Financial Reporting Function
| • | Implementing our recruiting plan to attract additional accounting and finance personnel. |
| • | Engaging outside consultants to assist our accounting and finance team until such time as we are able to retain permanent personnel. |
| • | Evaluating of skill sets and experience levels of existing financial reporting staff relative to those needed as a public company. |
Controls Documentation/Testing Process
| • | Reviewing and evaluating current documentation of internal controls. |
| • | Evaluating and documenting overall entity control environment. |
| • | Developing documentation standards/methodology. |
| • | Determining and documenting key controls in each functional area of our operations. |
| • | Developing and implementing a testing plan. |
| • | Implementing additional financial reporting system modules, which will help us assess and monitor segregation of duties. |
If the steps we take do not remediate these material weaknesses in a timely manner, we will not be able to conclude that we have and maintain effective internal control over financial reporting. In addition, if we have material weaknesses our independent registered accounting firm may not be able to issue an unqualified report on the effectiveness of our internal control over financial reporting.
66
Table of Contents
Overview
We are a leading global designer, manufacturer and marketer of premium bicycle components. Consumers recognize our brands for differentiated design and innovation. Our products include drivetrain systems, suspension, brakes, internal gear hubs and wheelsets, all of which are essential components used on road bikes, mountain bikes or pavement bikes. Many of the world’s elite cyclists use our components. We believe the success of elite cyclists using our products at the highest levels of competition, including the Tour de France and the Ironman Triathlon, creates aspirational demand for our components and drives demand from a broad consumer base of cyclists across all skill levels.
In 1987, our founders, including our CEO, Stanley R. Day, Jr., started SRAM to manufacture and market Grip Shift, a revolutionary product for shifting gears on bikes. After becoming a market leader in shifters in 1995, we began our transformation from a single product company to a full-line component supplier. We have grown through internal product development and a series of strategic acquisitions, including the acquisition of the bicycle division of Mannesman Sachs AG (1997), RockShox, Inc. (2002), the bicycle business of Avid, LLC (2004), Truvativ International Co., Ltd. (2004) and Compositech, Inc. (Zipp) (2007). We employ over 280 individuals in product development and for our 2011 model year, we have introduced over 40 new products to date. These new products build upon our portfolio of more than 550 existing patents. We believe we have the broadest product portfolio of any company in the industry.
We are the second largest supplier of bicycle components in the world. We focus primarily on the independent bicycle retailer market, which sells mid to high-end bikes, ranging in price from $300 to over $10,000, in the United States, Europe and other developed markets. Our portfolio of premium bike brands includes SRAM, RockShox, Zipp, Avid and Truvativ. Our brands are prominently displayed on our products. Our products are used on all of the major premium brands, including Trek, Specialized, Cannondale, Giant, Raleigh and Schwinn, produced by our bicycle company customers. SRAM products have been used by the last two Tour de France winners, the 2010 Ironman World Championship winner, the winners of all six 2010 World Cup mountain bike races and the winners of the 2011 editions of Paris-Roubaix and the Tour of Flanders.
To reach the independent bicycle retailer market, we operate through two distribution channels: the OEM channel and the aftermarket channel. In the OEM channel, we market our products to bicycle companies as original equipment components for new bikes that they sell to consumers through independent bicycle retailers. In the aftermarket channel, we sell products through distributors to independent bicycle retailers and sell a limited number of premium aftermarket products directly to independent bicycle retailers in the United States, who in turn sell them to consumers for replacements, upgrades or custom bike builds. For the year ended December 31, 2010, we generated 67% of our net sales from the sale of components in the OEM channel and 33% of our net sales from the sale of components in the aftermarket channel.
We employ approximately 2,200 people. To meet the global needs of our customers, we maintain a presence in fifteen locations in nine countries for design, sourcing, manufacturing and distribution. Our principal executive offices are located in Chicago, Illinois.
We believe our premium brands, technological innovation, product development and leading market positions have been key drivers of our strong financial performance. We grew our net sales from $283.8 million in 2006 to $524.2 million in 2010, representing a compound annual growth rate, or CAGR, of 16.6%. Over the same period, our operating income increased from $23.7 million to $99.6 million, representing a CAGR of 43.2% and an increase in operating margin from 8.3% to 19.0%. Our net earnings also increased from $11.6 million in 2006 to $50.0 million in 2010, representing a CAGR of 44.1%.
67
Table of Contents
Market overview and opportunity
Bicycle industry overview
The National Bicycle Dealers Association estimates annual worldwide bike production in 2009 to be 108 million units, of which approximately 46 million are sold in developed markets. There are two primary retail channels for the sale of bikes in developed markets: the independent bicycle retailer market (primarily independent bicycle retailers and to a lesser extent sporting good chains) and mass market retailers (e.g., Wal-Mart and Target). We estimate that in 2010 there were 18 million new bikes sold in the independent bicycle retailer market, representing $9.2 billion in retail sales, with an average retail price of approximately $500 per bike. Of these 18 million new bikes sold, we believe approximately 90% were sold in the United States, Europe and Japan.
There are three primary types of bikes:
| • | Road bikes—Lightweight, performance oriented bikes, such as those used in the Tour de France. |
| • | Mountain bikes—Performance oriented bikes designed to ride off the road. |
| • | Pavement bikes—Bikes used for everyday recreation and commuting. |
Independent bicycle retailer market
In developed markets, most mid to high-end bikes (i.e. bikes selling from $300 to over $10,000) are sold in the independent bicycle retailer market, and represent approximately 79% of the 2010 new bike retail sales in this market. This market also accounts for the vast majority of aftermarket bicycle component sales and almost all after-sale bicycle services. The size of the average independent bicycle retailer, number of products carried and breadth of service provided have all increased in recent years, driven by consumer preference. The consumer in this market is generally the cycling enthusiast, who seeks higher performance, premium branded bikes and components and after-sale services that are not provided in the mass market, and who we believe to be less price-sensitive than the average consumer. Accordingly, we believe the independent bicycle retailer market is the highest margin segment of the market.
68
Table of Contents
Bicycle industry supply chain
The supply chain for mid to high-end bikes sold in the independent bicycle retailer market consists of the participants illustrated below:
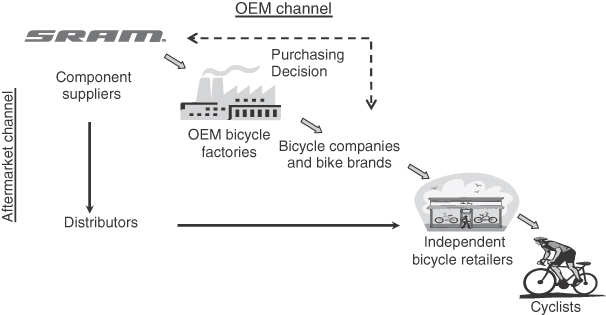
| • | Component suppliers are the designers and manufacturers of branded bicycle components (e.g., SRAM and Shimano Inc.) that sell their products to OEM bicycle factories for assembly on new bikes, or to distributors, who in turn sell to independent bicycle retailers for resale in the aftermarket. |
| • | OEM bicycle factories are the factories that manufacture bike frames and assemble bikes (e.g., Giant Bicycle Inc. and Merida Industry Co., Ltd.) in accordance with the specifications of individual bicycle companies and their brands. |
| • | Bicycle companies are the companies that engage in the design, specification, branding, marketing and distribution of bikes (e.g., Trek Bicycle Corporation, Specialized Bicycle Components, Giant Bicycle Inc. and Cannondale Bicycle Corporation). Individual bicycle companies may have several brands (e.g., Trek Bicycle Corporation sells bikes under the Trek and Gary Fisher brands). Bicycle companies are responsible for selecting and specifying the components that go onto each new bike model. |
| • | Distributors are logistics companies (e.g., Quality Bicycle Products (QBP), Security Bicycle Accessories (SBA) and Fisher Outdoor Leisure) that connect suppliers and independent bicycle retailers by carrying a large variety of bicycle components, accessories and apparel. |
| • | Independent bicycle retailers are specialty retail stores (also referred to as dealers or retailers) that sell new fully-assembled bikes, components, accessories and apparel and provide services to consumers. |
Bike design and manufacturing process overview
Bicycle companies continuously strive to create new models with improved frame designs and specifications made of increasingly technologically advanced materials. Cycling enthusiasts evaluate bikes in terms of both the bike frame brand and the branded components on the bike. As a result, bicycle companies focus on
69
Table of Contents
assembling bikes with components that will be most appealing to consumers. During the bike design process, the bike brand product managers at bicycle companies work with several component suppliers to decide which branded components to specify as standard equipment on a new model. This process includes presentations, test rides and negotiations. Following the completion of the design and specification process, bike brand product managers provide their design and component specifications to OEM bicycle factories. OEM bicycle factories manufacture the bike frame, purchase the specified components from component suppliers and assemble the bikes, which are ultimately distributed to independent bicycle retailers for sale to the end user.
Bicycle component market
Branded bicycle components are key to the performance of mid to high-end bikes and strongly influence the buying decisions of cycling enthusiasts. New product introductions and technological innovations in the components space, such as fully adjustable hydraulic braking and suspension systems, help increase rider performance and make cycling more enjoyable. Industry publications, grass roots marketing efforts and sponsorships highlight branded bicycle component performance, which serves to build demand among cycling enthusiasts. Strong demand for branded components enables component suppliers to realize premium price positioning and gross margins that we believe are higher than other participants in the bicycle industry supply chain. On average, we estimate that the aggregate manufacturers’ sales price of bicycle components in the OEM channel represents 21% to 26% of the overall retail price of a new bike.
We estimate the size of the independent bicycle retailer market (independent bicycle retailers and sporting goods chains) for bicycle components to be approximately $3.5 billion, as measured in component suppliers’ sales. The following chart displays an overview of the independent bicycle retailer market for bicycle components, based on management estimates:
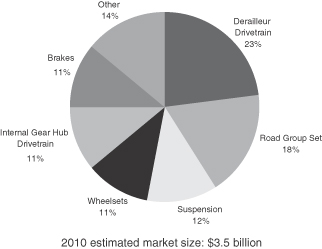
OEM and aftermarket channels
Bicycle component suppliers sell their products through two major channels: the OEM channel and the aftermarket channel.
OEM channel represents the sale of components to OEM bicycle factories for assembly on new bikes. The decision maker for the components specified on each model is the bike brand product manager at the bicycle company, who is typically an accomplished cyclist and experienced in the dynamics of the industry.
70
Table of Contents
Aftermarket channel represents the sale of components, accessories and apparel to consumers primarily through independent bicycle retailers via distributors and, to a lesser extent, directly through independent bicycle retailers. We believe the most influential person to the consumer’s purchasing decision for this channel is the salesperson at the independent bicycle retailer. Aftermarket sales primarily include upgrades, replacements, components for custom bike builds and accessories.
Outlook
We expect the bicycle component market to continue to grow due to a variety of factors that impact the cycling industry, including:
| • | continuing growth in the number of cycling enthusiasts; |
| • | increasing average retail selling prices driven by better-performing product designs and technologies; |
| • | growing participation in road racing, mountain bike racing, organized weekend rides and charity cycling events, as well as cycling related sports, such as triathlons and cyclo-cross; |
| • | improving cycling infrastructure, such as cycling lanes in urban areas; |
| • | increasing consumer focus on healthier lifestyle trends; |
| • | growing focus on the environment; and |
| • | increasing adoption of mid to high-end bikes in emerging markets. |
Our strengths
We attribute our success to the following competitive strengths:
Premium brand portfolio. We have five premium brands under the SRAM umbrella: SRAM, RockShox, Zipp, Avid and Truvativ. Our brands are prominently displayed on all of our products and are associated with innovation and performance by our customers, consumers and elite athletes.
| • | SRAM is a leading brand in drivetrains and internal gear hubs with strong recognition among cycling enthusiasts for a combination of cutting-edge design and engineering. |
| • | RockShox introduced the first front suspension system for mountain bikes in 1989 and has become one of the most widely recognized brands in the components industry for its high-performance products. |
| • | Zipp is an ultra-premium priced, world-class brand name in carbon wheelsets. Its wheelsets are among the lightest, fastest and most aerodynamic in the industry. |
| • | Avid is recognized for innovative brake systems, offering leading hydraulic and mechanical braking technology. |
| • | Truvativ is a premium brand of high-performing cranksets, bottom brackets, handlebars, stems, seatposts and other accessories. |
Our brands are a leading choice in performance products for the cycling industry. We sponsor professional cyclists and teams to build a race-proven image for our products. Our sponsored cyclists have appeared on the podiums at every significant prestigious race, including the Tour de France, Giro d’Italia and Vuelta a Espana, all major mountain biking world championships and the Ironman World Championship. This success has helped us increase our brand recognition at all skill levels of cyclists.
71
Table of Contents
Cycling enthusiasts typically have strong preferences for both bike and component brands. We believe branded components, such as drivetrains, suspension, wheelsets and brakes, influence consumers’ buying decisions. We employ a multi-branded portfolio approach to marketing our products, which provides us the flexibility to respond to varying consumer preferences and to leverage the component specific technological strengths of each of our brands. Our multiple brand and product approach differentiates us from most other component suppliers who focus primarily on either a single brand or a single component category.
Relentless innovation and product development. Our ability to develop innovative products has been a key driver of our success and growth as a company. We generated over 50% of our 2010 model year (July 1 through June 30) net sales from products that were less than three years old. Our products, while appearing simple, require a significant breadth and depth of technical knowledge to be designed successfully. For example, a typical suspension design might have over 50 components packaged into five cubic inches and require knowledge of structural mechanics, fluid dynamics and heat transfer, as well as other engineering disciplines. We currently have more than 280 employees dedicated to product development. Our product development teams are knowledgeable in a wide variety of engineering disciplines and have developed, through cumulative experience, the engineering expertise required to successfully design high performance bicycle components. Our product development teams are strategically located in the United States and Western Europe, which are the two largest markets for mid to high-end bikes. Our presence in these markets enables our product development teams to more effectively interpret and integrate market trends in our product design. We also have an intellectual property portfolio of over 550 patents. Recent examples of highly innovative products developed by our teams that have enjoyed industry-wide success include: SRAM Red road drivetrain systems, RockShox SID front suspension, Zipp 404 wheelsets and Avid Elixir brakes. We continue to launch numerous new products each year. For example, for our 2011 model year, we launched over 40 new products to date.
Leader in growing independent bicycle retailer market. We sell our products as original equipment specifications on new mid to high-end bikes and in the aftermarket primarily to cycling enthusiasts via independent bicycle retailers. Performance and technology are the primary drivers of purchases by cycling enthusiasts, and these consumers are likely to purchase new bikes or replace bicycle components with greater frequency than other consumers. As a result, we believe the independent bicycle retailer market is the highest margin segment of the bicycle component market. Based on management estimates, we believe we have a 15% share of the approximately $3.5 billion of annual sales in the independent bicycle retailer market for bicycle components, as measured in component suppliers’ sales, including an estimated 32% share of suspension products and an estimated 23% share of brakes. We believe a number of trends will continue to drive growth in the independent bicycle retailer market, including cycling’s increasing popularity, movement toward healthier lifestyles, concern for the environment, increased spending on cycling infrastructure and increasing price points for new technologies.
Highly defensible business model. Over the past 24 years, we have developed global design, production and distribution capabilities and established longstanding customer relationships that we believe are difficult to replicate. The bicycle component market is dependent on product innovation, which requires scale and ability to spread development costs across multiple customers. In the OEM channel, we work with each major bicycle company and are the only supplier offering a full-line of mid to high-end drivetrain, brakes suspension components and wheelsets. We believe our in-house product development expertise and collaboration with these customers differentiates us from our competitors. Additionally, our strategically located manufacturing facilities provide advantages, such as flexible operations planning and the ability to offer just in time manufacturing from our largest factories in Asia. In the fragmented aftermarket channel, we have an established presence, with relationships with key distributors and numerous independent bicycle retailers. We differentiate our company by offering leading customer service and warranty support to independent bicycle retailers.
72
Table of Contents
Committed management team with deep-rooted corporate culture. Stanley R. Day Jr., one of our founders and our Chief Executive Officer, and our core senior management team have an average tenure with SRAM of approximately 18 years. Since founding SRAM, Mr. Day has recruited a talented team comprised of cycling enthusiasts and established a unique entrepreneurial culture fostering innovation and creativity. Management’s extensive knowledge of the industry and their ability to identify opportunities for profitable growth through both internal product development and strategic acquisitions has transformed SRAM from a single product company in 1987 to a full-line bicycle component supplier with approximately 2,200 employees in nine countries around the world.
Our strategy
We intend to continue to increase our sales and profitability by strengthening our position in the bicycle component market. Key elements of our growth strategy are:
Extend our technological and product leadership. We intend to continue to develop and market products that incorporate innovative design, advanced features and improved performance that differentiate us in the bicycle component market. These efforts will include enhancing existing products and developing next generation technologies in order to maintain our position as an industry leader. We also intend to develop new product offerings that leverage our existing product platforms. For example, we currently produce wheels for road and pavement bikes, and plan to utilize our existing platform to introduce wheels for mountain bikes in 2012.
Continue to increase our share of components on new bikes. Although we have relationships with almost all bicycle companies in the OEM channel, we believe there is significant opportunity to increase our share of components on new bikes. We are favorably positioned given the strength of our brands, the diversity of our product portfolio, and our innovation pipeline. We focus on the following key decision-makers who influence component specifications for new bikes:
| • | Bike brand product managers. We work closely with the bike brand product managers of leading bicycle companies through collaborative product development, a dedicated sales force, and events such as ride camps and trade shows. |
| • | Independent bicycle retailers. The leading bicycle companies rely on key retailers to provide them market feedback and advice on the components to specify on their bikes. We engage these key retailers through frequent visits to review products, answer their questions, educate them and address their concerns. By turning these retailers into advocates for our products, we believe we can increase our share of components on new bikes. |
| • | Cycling industry media. We believe the cycling industry is led by enthusiasts with a passion for high performance products, who rely on a wide variety of cycling media for facts and opinions about the products. We have an experienced public relations team which maintains relationships with cycling media editors. Our objective is to reinforce our position in the market through independent sources and enhance the perception of our brand. |
| • | Alpha enthusiasts. We target amateur racers, triathletes and local independent bicycle retailers who are the opinion leaders in their communities through a range of activities including race and athlete sponsorship, grass root event support and advertising. |
Increase aftermarket penetration. We intend to increase our sales of aftermarket components by strengthening our relationships with independent bicycle retailers and increasing brand awareness at the consumer level. In February 2011, we established a dedicated aftermarket function led by a 15 year veteran of SRAM to focus solely on the aftermarket channel across all product areas. We will continue to invest in our retailer relationships by educating retailers about our full-line of aftermarket products, through our various dealer excitement programs, and by continuing to provide leading customer service and warranty support. This
73
Table of Contents
ongoing effort will help these retailers communicate the benefits of our products to end consumers. At the consumer level, we will continue our marketing efforts aimed at increasing our brand recognition among cycling enthusiasts, which creates additional demand for our aftermarket products. We also intend to expand product development efforts to enhance our aftermarket product offerings, such as increasing differentiation of our aftermarket channel components from our OEM channel components and, where appropriate, expanding into product areas adjacent to our current product lines.
Grow the industry while strengthening our leadership profile. We are focused on a number of initiatives aimed at growing our industry and reinforcing our leadership position within it, including:
| • | Continued innovation. We believe that our future technological advancements can serve to expand our industry by spurring additional demand among cycling enthusiasts and creating new cyclists. New and better products give cyclists a reason to invest more in their sport. |
| • | Strengthen independent retailer network. Independent retailers interact directly with end consumers and have a strong influence on the choices of consumers seeking advice and guidance on new bike and aftermarket component purchases. Within their communities, retailers play a vital role in promoting cycling and attracting new enthusiasts. As a result, retailers have the ability to impact the size and improve the health of our industry. We intend to continue to work with independent retailers to facilitate this process through our various dealer excitement and mobile marketing programs and by offering various educational services such as SRAM Technical University, online training and SRAM facility visits. |
| • | Promote cycling advocacy. In 2008, we founded the SRAM Cycling Advocacy Fund, a fund dedicated to supporting global advocacy efforts that enhance cycling infrastructure and safety. Through the SRAM Cycling Advocacy Fund, we are actively involved in, and contribute to, advocacy groups that promote the use of bikes for environmental, health, recreational and transportation reasons. We believe these programs build a better environment for cycling and will help grow the overall industry and increase our market opportunity. For example, we believe the greatest barrier to increased bike usage in the United States is the lack of cycling infrastructure in major cities. We are actively involved in the promotion of improved cycling infrastructure in the United States, which we believe will result in an expansion of the United States bike market. |
The reorganization
For a detailed description of the refinancing and the reorganization, see “The refinancing and reorganization.”
History
SRAM International Corporation was incorporated on April 29, 2011 for the purpose of becoming the holding company of SRAM Holdings, LLC and SRAM, LLC immediately prior to the consummation of this offering. SRAM was originally founded in 1987 as SRAM Corporation, an Illinois corporation, to design, manufacture and market bicycle shifters. In 1995, after becoming a market leader in shifters, we began our transformation into a full-line component supplier. We have grown through internal product development and a series of strategic acquisitions, including the acquisition of the bicycle division of Mannesman Sachs AG (1997), RockShox, Inc. (2002), the bicycle business of Avid, LLC (2004), Truvativ International Co., Ltd. (2004) and Compositech, Inc. (Zipp) (2007). One of our founders, Stanley R. Day, Jr., is our President, Chief Executive Officer and Chairman of the Board. On September 30, 2008, we completed a recapitalization transaction in which Trilantic and its co-investors purchased a $234.8 million equity interest in SRAM.
74
Table of Contents
Our products
We produce a number of different types of components for road bikes, mountain bikes and pavement bikes, including drivetrain systems, suspension, brakes, internal gear hubs and wheelsets. The diagram below provides an overview of where our products appear on bikes.

We sell all of our major components in both the OEM and aftermarket channels. In 2010, the road, mountain and pavement product lines represented 26%, 62% and 12% of our net sales, respectively; in 2009, the road, mountain and pavement product lines represented 21%, 64% and 14% of our net sales, respectively; and in 2008, the road, mountain and pavement product lines represented 18%, 62% and 20% of our net sales, respectively. Price points depend on the component and can vary significantly between product line and technology. For example, wheelsets for road bikes can range from $750 (MSRP) for a pair of SRAM S30 Aluminum Clinchers to $2,950 (MSRP) for a pair of Zipp 808 Clinchers, while a SRAM derailleur on a road bike can range between $72 (MSRP) for a SRAM Apex Rear Derailleur to $320 (MSRP) for SRAM Red Rear Derailleur. The various types of components we produce for our three product lines are described below.
Drivetrain systems. Our drivetrain systems for mountain and pavement bikes include front and rear derailleurs, shifters, cassettes, chains, cranksets and bottom brackets. Our drivetrain products are marketed under the SRAM and Truvativ brands.
| • | Derailleurs. We offer a full range of front and rear derailleurs for use on mountain bikes and pavement bikes under the SRAM brand. We believe our SRAM XX derailleur, with its precise shifting technology and light weight, is one of the leading mountain bike derailleurs in the market. |
| • | Shifters. We offer a full-line of both trigger and twist shifters for mountain bikes and pavement bikes under the SRAM brand. Our ZeroLoss SRAM XO trigger is the first trigger shifter to offer a fully adjustable pull lever and clamp position. |
| • | Cassettes/chains/cranksets/bottom brackets. We offer cassettes and chains under the SRAM brand and we offer cranksets and bottom brackets under the SRAM and Truvativ brands. |
Suspension. Our suspension products include front and rear suspension and are marketed under the RockShox brand. We design the majority of our suspension products for mountain bikes given the off-road use of such bikes. We expanded into the suspension market with our acquisition of RockShox in 2002. Our suspension products utilize technology aimed at decreasing weight and increasing rigidity while providing shock absorption on rough terrain.
75
Table of Contents
Brakes. Our brake products include hydraulic disc, mechanical disc and mechanical rim brakes, as well as brake levers and accessories. Our brake products are primarily used on mountain bikes and performance-oriented pavement bikes. We entered the performance brake market with our acquisition of Avid in 2004 and continue to market our brake products under the Avid brand. We have been able to differentiate our product offering and increase sales of our brake products through the use of advanced materials, such as carbon fiber and titanium, which yield increased performance and decreased weight, as well as technological advancements in aesthetic and physical design.
Internal gear. Our internal gear products are used on pavement bikes and are marketed under the SRAM brand. We initially entered the internal gear hub market in 1997 with the acquisition of the bicycle components division of Mannesmann Sachs. Popular in Europe, internal gear hubs are an alternative to the derailleur technology found on most bikes sold in the United States. We believe our i-Motion 3 and Automatix internal gear hubs represent the current state-of-the-art in internal gear hub technology. Additional products related to internal gear hubs include shifters, brakes and dynamos.
Wheelsets. Our wheelsets are used in road and pavement bikes, and we plan to introduce wheelsets for mountain bikes in 2012. We entered the wheelset market in 2007 through our acquisition of Compositech, Inc. (Zipp). We now market our ultra-premium wheelsets under the Zipp brand, which are sold primarily through the aftermarket channel. Since acquiring Zipp in 2007, we have leveraged the acquired expertise in wheelset design and development to introduce SRAM branded wheelsets in both the OEM and aftermarket channels.
Road products. Developed internally and originally introduced in 2006, our road products include drivetrain systems and brake components for racing-style bikes. Our road products have lightweight, efficient designs and utilize advanced materials. The highlight of our road products is the innovative DoubleTap shifting technology. DoubleTap’s single-lever design handles up-shifts and downshifts in one short, sweeping motion, providing superior engagement to traditional two-lever shifting systems. We market our road products under the SRAM, Truvativ and Zipp brands. Our SRAM road products include the SRAM RED road system, which is one of the leading premium products in the market and is used by a number of top professional cycling teams.
Product development
Our products, while appearing simple require a significant breadth and depth of technical knowledge to be designed successfully. This technical complexity requires that we hire and train engineers who are competent in a wide variety of engineering disciplines. As of December 31, 2010, we had over 280 employees around the world dedicated to product development. Our product development teams work in seven different locations in three countries with state-of-the-art design, testing and communication tools. Our product development teams interact with bike brand product managers throughout the product development process. Our engineers come from a variety of cultures and many are avid cyclists. We believe the size and geographic and cultural diversity of our product development teams differentiates us from our competitors. We currently have approximately 70 ongoing product development projects, which we believe exceeds those of most of our competitors. For our 2011 model year, our product development projects led to the launch of over 40 new products to date. In the last three years, our product development expenses were $37.2 million in 2010, $27.8 million in 2009 and $46.5 million in 2008. We believe the cumulative knowledge and development expertise built through years of our product development investment gives us an edge over our competitors. Despite the recent economic downturn, we continued to invest in product development consistent with historical levels, and we continue to emphasize product development as a key aspect of our strategy.
76
Table of Contents
Distribution, marketing and sales
In the OEM channel, we believe purchasing decisions by bike brand product managers at bicycle companies are influenced by their personal evaluation of component performance, independent bicycle retailer feedback, magazine and web editorial, competing products and price. Our sales force in the OEM channel includes 22 account managers located around the world who interact directly with these bike brand product managers through product consultations, customer ride camps, trade shows, custom products and other direct marketing efforts. We believe this is an important differentiating factor as we believe the bike brand product managers who make product specification decisions respect a sales representative who can test-ride a prospective product with them under demanding and competitive conditions. This is especially important with respect to high-end products where performance is key. Our product development employees also participate in this process.
In the aftermarket channel, our marketing strategy focuses on the independent bicycle retailers who sell our aftermarket products and drive demand at the distributor level. The independent bicycle retailers promote products based on product attributes, brand excitement, availability, retailer or peer recommendations and magazine and web editorials. We have over 30 independent field sales representatives who interact with U.S. independent bicycle retailers. These representatives market the entire range of our products and provide a direct interface with the independent bicycle retailers. We also have various dealer excitement programs and other training programs, such as SRAM Technical University, aimed at educating, engaging and inspiring retailers. In addition, we maintain relationships with key distributors around the world who distribute our products to retailers.
Beyond the product managers at bicycle companies and retailers, we market directly to alpha enthusiasts, including amateur racers and triathletes. Alpha enthusiasts conduct their own research prior to going to the independent bicycle retailers and typically purchase the highest performance components. As opinion leaders in their cycling communities, alpha enthusiasts also influence the purchasing decisions of others. We reach the alpha enthusiast through media editorial support, race team and individual cyclist sponsorships, participation at cycling events and the endorsement of the leading bicycle retailers. We currently sponsor over 15 professional teams and over 40 individuals in competitive cycling, which creates an affiliation with grass roots, expert and professional cyclists.
Intellectual property
Intellectual property is an important aspect of our business. We have been issued over 550 patents and have obtained an average of over 50 new patents per year since 2002. Our principal intellectual property also includes our trademarks. We have over 350 registered trademarks, including U.S. and international protection for our five core brands: SRAM, RockShox, Zipp, Avid and Truvativ. Our practice is to seek protection for our intellectual property as appropriate, including by means of patent, trademark and trade secret protection. Although our intellectual property is important to our business operations and in the aggregate constitutes a valuable asset, we do not believe that any single patent, trademark or trade secret is critical to the success of our business as a whole.
Raw materials and suppliers
Our primary raw materials are steel, aluminum, carbon fiber and plastic. We dual or multi source the majority of our raw materials and we leverage our dual or multi source relationships to help manage these raw material costs. We may experience temporary shortages of certain materials due to weather, natural disasters or other factors, including disruptions in supply caused by material transportation, labor disputes or production delays. Such shortages have not previously had, and are not expected in the future to have, a material adverse effect on our operations.
77
Table of Contents
Our community commitment
We are also focused on social responsibility and are actively involved in several bike-related organizations. We believe our efforts in this area strengthen consumers’ views of our brands. In 2008, we established the SRAM Cycling Advocacy Fund, which we capitalized with $10 million. This fund supports advocacy in the United States, Europe and Asia on issues affecting cycling infrastructure and the bicycle industry. Leading industry associations, such as Bikes Belong, request funding from the fund for industry related programs. Since inception, approximately $3.0 million has been distributed to not-for-profit organizations from this fund.
Competition
We operate in highly competitive markets. We are the second largest supplier of bicycle components, with Shimano Inc. being the largest. Competition in the independent bicycle retailer market is principally based on product design, innovation, customer service, manufacturing and distribution capabilities, product quality and price. In the OEM and aftermarket channels, we compete primarily against branded components. Branded components are recognized by consumers and come with service support and warranty support that extend throughout the OEM and aftermarket channels. Alternatively, low-cost components typically enter the market several years behind branded component manufactures for a particular technology. In addition, we believe that we successfully compete by offering superior technology and customer service to consumers and by offering large scale manufacturing and distribution capabilities and a full-line of mid to high-end components to bicycle companies.
Our principal branded competitors include Shimano Inc. (the only other mid to high-end full-line component supplier) and Campagnolo S.r.l, Compass Group Diversified Holdings LLC (Fox brand), DT Swiss AG and Amer Sports Corporation (Mavic brand), each of which is a primary competitor of one or two of our product types. Due to the patent landscape, product scale issues and product development cycle requirements, most component suppliers concentrate on a limited number of components. Therefore, we have different primary competitors for our different types of products and there is limited competition by individual competitors for our full-line of mid to high-end components.
Customers
In the OEM channel, we consider our customers to be the bicycle companies who select our products for use on specific bikes. Many bicycle companies have several bike brands. Our revenue is diversified among our customers, with no bicycle company representing 10% or more of our total net sales for the year ended December 31, 2010. We have relationships with almost all major bicycle companies.
In the aftermarket channel, we sell the majority of our products to bicycle distributors who then sell our products to independent bicycle retailers. We also sell some products directly to independent bicycle retailers in the United States. We focus most of our marketing efforts on the retailers, since the retailers drive demand at the distributor level. Our revenue is diversified among our bicycle distributors and independent bicycle retailers, with no distributor or retailer representing more than 4.5% of our total net sales for the year ended December 31, 2010. We have relationships with over 90 bicycle distributors.
Insurance and risk management
We purchase insurance to cover standard risks in our industry, including policies to cover general and products liability, workers compensation, and other casualty and property risks. Our insurance rates are based on our safety record as well as trends in the insurance industry.
78
Table of Contents
We face an inherent risk of exposure to product liability claims in the event that, among other things, the use of our products results in injury. With respect to product liability coverage, we carry insurance coverage typical of our industry and product lines. We believe we have obtained a prudent amount of insurance for the insurable risks associated with our business. We do not currently hold patent infringement insurance.
Employees
We have approximately 2,200 full-time employees. We do not have unionized employees in any of our facilities, other than our European facilities, with unionized employees representing less than 10% of our total employees. We have never experienced a material company-related work stoppage or a material disruption to our business for employee matters. We consider our relationships with our employees to be good.
Properties
We maintain fifteen facilities located around the world, seven of which have manufacturing capabilities. The following table lists our fifteen facilities:
| Facility Location | Function | Leased/Owned | ||
| Chicago, Illinois, United States |
Global headquarters and product development (OEM and aftermarket) | Leased | ||
| Colorado Springs, Colorado, United States |
Product development (OEM and aftermarket) | Leased | ||
| Coimbra, Portugal |
Manufacturing (OEM and aftermarket) | Owned | ||
| Dali City, Taichung County, Taiwan |
Manufacturing (OEM and aftermarket) | Leased(1) | ||
| Francin, France |
Sales and customer service (OEM and aftermarket) | Leased | ||
| Melbourne, Australia |
Sales and customer service (OEM and aftermarket) | Leased(2) | ||
| Shunde, China |
Manufacturing (OEM and aftermarket) | Leased | ||
| Nijkerk, Netherlands |
European sales and marketing (OEM and aftermarket) | Leased | ||
| San Luis Obispo, California, United States |
Product development (OEM and aftermarket) | Leased | ||
| Schweinfurt, Germany |
Manufacturing, product development and customer service (OEM and aftermarket) | Leased | ||
| Shen Kang, Taichung County Taiwan |
Manufacturing, sales, finance and administration (OEM and aftermarket) | Leased(3) | ||
| Spearfish, South Dakota, United States |
Manufacturing and product development (aftermarket) | Leased | ||
| Indianapolis, Indiana, United States |
Manufacturing, product development, sales and customer service (OEM and aftermarket) | Owned | ||
| Taichung, Taiwan |
Product development (OEM and aftermarket) | Leased | ||
| Waterford, Ireland |
Finance and administration (OEM and aftermarket) | Leased | ||
| (1) | Facility is comprised of nine separate lease agreements. |
| (2) | Facility lease being negotiated. |
| (3) | Facility is comprised of 24 separate lease agreements. |
79
Table of Contents
Manufacturing and backlog
We manufacture and complete the final assembly on approximately 85% of the products we sell. By manufacturing our own products, we are able to significantly improve quality control, quickly respond to feedback on our designs and maintain strong relationships with the bicycle companies. Many of our manufacturing facilities are located in close proximity to bicycle factories, which enables us to provide short lead times from those facilities.
If necessary, we are able to increase capacity by increasing the number of shifts at our manufacturing facilities, expanding existing facilities, or sourcing additional components from suppliers. As an example, we recently expanded capabilities at our Taiwan manufacturing facility by adding a new in-house anodizing line and adding extensive CNC machining capability.
Our production forecast is based on estimated future demand, but production generally does not occur until the receipt of customer orders. As a result, we do not carry significant inventory and we have flexibility to respond to subsequent changes in demand by adjusting production throughout the year. In addition, since orders generally do not extend beyond 30 days and we generally meet all order requirements, backlog volume is not significant to our business.
Seasonality
Generally, our net sales and operating results have not been particularly seasonal due, in part, to the expansion of our product offering and aftermarket presence in recent years. However, our third and fourth quarter sales are slightly higher than our first and second quarter sales. We believe this is a result of sales of bicycle components generally following production of bike models, and the fact that bicycle companies typically transition their model year during the second quarter. Therefore, bike production is slightly lower during first and second quarters.
Financial information about segments and geographical information
For information regarding our reportable business segments and geographical information, see note 13 to our historical financial statements included elsewhere in this prospectus.
Environmental
Our operations, facilities and properties are subject to a variety of foreign, federal, state and local laws and regulations relating to health, safety and the protection of the environment. Failure to comply with such laws and regulations can result in significant fines, penalties, costs, liabilities or restrictions on operations that could negatively affect our operations or financial condition.
We believe that our operations are in substantial compliance with applicable environmental laws and regulations. Our compliance with such laws and regulations has not had, nor is it expected to have, a material impact on our capital expenditures, earnings or competitive position. Additional environmental issues relating to presently known or unknown matters could give rise to currently unanticipated investigation, assessment or expenditures. In addition, future events, such as changes in existing laws and regulations or their interpretation could give rise to additional compliance costs, capital expenditures or liabilities. Compliance with more stringent laws or regulations as well as different interpretations of existing laws, more vigorous enforcement by regulators or unanticipated events could require additional expenditures that may materially affect our business, financial condition or results of operations.
80
Table of Contents
Government regulation
We are subject to numerous federal, foreign, state and local government laws and regulations, including laws governing our relationships with employees, including minimum wage requirements, overtime, working conditions, hiring and firing, non-discrimination for disabilities and other individual characteristics, work permits and benefit offerings. Compliance with these various laws and regulations could adversely affect our operations. We believe that our business is conducted in substantial compliance with applicable laws and regulations.
Legal proceedings
We are currently and in the future may continue to be subject to litigation incidental to our business, including patent infringement litigation and product liability claims, as well as other litigation of a non-material nature in the ordinary course of business. We believe that the outcome of any existing litigation, either individually or in the aggregate, will not have a material impact on our business, or financial condition.
81
Table of Contents
The following table provides information regarding our executive officers and directors as of April 29, 2011. Each director and executive officer became a director or executive officer of SRAM International Corporation on April 29, 2011. Up until the consummation of this offering, each executive officer and director listed below will also be an executive officer and/or director of SRAM Holdings, LLC.
| Name | Age | Position(s) | ||
| Stanley R. Day, Jr. |
52 | President, Chief Executive Officer and Chairman of the Board | ||
| Michael R. Herr |
42 | Chief Financial Officer | ||
| Jeffrey M. Shupe |
47 | Chief Operating Officer | ||
| Frederick K. W. Day |
51 | Executive Vice President and Director | ||
| Gidon Cohen |
53 | Director | ||
| Jack Smith |
62 | Director | ||
| Charles C. Moore |
44 | Director | ||
Executive officers and directors
Stanley R. Day Jr. is our founder. He has served as our Chief Executive Officer since February 2007 and as Chairman of our board of directors and President since 1987. Prior to founding SRAM, Mr. Day was a marketing manager at Molex Company for the Personal Computer and Telecom industries. At the time, Molex was a leading supplier of electrical connectors to the Automotive, White Goods, and Data Products industries. In addition, Mr. Day currently serves on the board of World Bicycle Relief, a not-for-profit organization. Mr. Day holds a B.S. in Management from Tulane University and a Masters in Management from the Kellogg Graduate School of Management of Northwestern University. Mr. Day is a brother of Mr. Frederick K. W. Day, who is our Executive Vice President and a member of our board of directors.
We believe Mr. Day’s qualifications to serve on our board of directors include his extensive knowledge of our company and the bicycle component industry and the accumulated experience from his years of leadership at our company.
Michael R. Herr has served as our Chief Financial Officer since 1999. Prior to becoming Chief Financial Officer, Mr. Herr held a variety of accounting positions at SRAM since joining us in 1994. Prior to joining us, Mr. Herr worked as an accountant at GE Capital and in public accounting for Crowe Chizek and Company. Mr. Herr, a C.P.A., holds a B.S. in Accounting from the University of Dayton and an M.B.A. from DePaul University.
Jeffrey M. Shupe has served as our Chief Operating Officer since 2007. Mr. Shupe is one of our co-founders. Prior to serving as Chief Operating Officer, Mr. Shupe was our Vice President of Asian Operations from 2001 to 2007 and our Vice President of Manufacturing from 1997 to 2001. From 1987 to 1997, Mr. Shupe was our Director of Manufacturing. As our Director of Manufacturing, Mr. Shupe’s responsibilities included establishing our factories in Chicago, Ireland and Mexico. Mr. Shupe holds a B.S. in Electrical Engineering from Notre Dame University.
Frederick K. W. Day has served as our Executive Vice President since 2006 and has been a member of our board of directors since 1987. Mr. Day has worked at SRAM since 1987, during which time he has served in various roles, including Director of Aftermarket Sales, Director of European Operations, Research and Development, Vice President of Product Management and Vice President of Product Development. Mr. Day is also the President of World Bicycle Relief. In addition, Mr. Day currently serves on the Board of Trustees of
82
Table of Contents
South Kent School and Rock Island Company. Mr. Frederick K. W. Day is a brother of Mr. Stanley R. Day Jr., who is our President and Chief Executive Officer, and Chairman of the Board.
We believe Mr. Day’s qualifications to serve on our board of directors include his knowledge of our company, his executive management experience and his extensive knowledge of the bicycle component industry.
Gidon Cohen has been a member of our board of directors since 2003. Mr. Cohen is President and Chief Executive Officer of Highland Capital LLC, a private equity company he founded in 2000. Prior to forming Highland Capital, Mr. Cohen was an investment banker for 18 years. In addition, Mr. Cohen served on the Board of Pharmedium Healthcare Corporation from 2003 to 2007 and currently serves on the Board of Blue Star Lubrication Technology, LLC. Mr. Cohen holds a Master of Management from Northwestern University’s J.L. Kellogg Graduate School of Management and a Bachelor of Commerce degree from the University of the Witwatersrand in Johannesburg, South Africa.
We believe Mr. Cohen’s qualifications to serve on our board of directors include his mergers and acquisitions, restructuring, and general corporate finance experience and his experience with private and public offerings of equity and debt.
Jack Smith has been a member of our board of directors since 2004. Mr. Smith is Chairman, Director and co-owner of Silversmith Inc., a producer of natural gas well metering and automated data reporting systems. Mr. Smith co-founded Silversmith Inc. in 2003. Prior to Silversmith, Mr. Smith was President and Chief Executive Officer of Holland Neway International, a producer of commercial vehicle suspensions and brake systems. Mr. Smith serves on the Board of Beacon Power Corp, Bissell Corporation and Weasler Engineering. He is a Trustee of Grand Valley State University Foundation. Mr. Smith is also a member of the Executive Council of American Securities. Mr. Smith received a Bachelor of Science and Masters Degree in Mechanical Engineering and a Masters Degree in Business Administration from the University of Michigan.
We believe Mr. Smith’s qualifications to serve on our board of directors include his entrepreneurial background, manufacturing and engineering experience and leadership.
Charles C. Moore has been a member of our board of directors since 2008. Mr. Moore is a Partner of Trilantic Capital Partners, a middle market private equity fund. Prior to joining Trilantic Capital Partners in 2008, Mr. Moore worked at The Carlyle Group from 2005 to 2008, where he was a Managing Director in the firm’s middle market buyout and growth equity firm. Earlier in his career, Mr. Moore practiced law at Williams & Connolly LLP, clerked at the U.S. Supreme Court, and worked in strategy consulting at McKinsey & Co. and Mercer Management Consulting. Prior to joining Carlyle, Mr. Moore was a Managing Director of Perseus LLC, a private equity firm. Mr. Moore serves on the Board of Fortitech, Inc. and is a member of the Board of Visitors of Stanford Law School. Mr. Moore previously served on the Board of RMI, Inc., Apollo Global, Inc., Command Information, Inc., Comark Building Systems, Inc., Workflow Management, Inc. and Acirca, Inc. Mr. Moore holds an A.B. from Princeton University, an M.St. from Oxford University, and a J.D. from Stanford Law School.
We believe Mr. Moore’s qualifications to serve on our board of directors include his expertise in the consumer sector, his knowledge of our company and his prior board experiences.
Other than the relationship of Mr. Stanley R. Day Jr. and Mr. Frederick K. W. Day as described above, there are no family relationships among any of our directors or executive officers. Each executive officer is elected or appointed by, and serves at the discretion of, our board of directors.
Agreements or understandings
Pursuant to the amended and restated operating agreement of SRAM Holdings, LLC in effect prior to the refinancing, Trilantic and its co-investors are entitled to designate two of the seven managers of SRAM Holdings, LLC. Charles C. Moore and E. Daniel James are the current designees. Prior to this offering
83
Table of Contents
and as part of the refinancing, SRAM Holdings, LLC’s operating agreement will be amended to, among other things, eliminate Trilantic and its co-investors right to elect managers. No similar right will exist in our amended and restated bylaws. See “Certain relationships and related person transactions—Trilantic 2008 investment and recapitalization” for additional information.
Board composition
Effective upon the consummation of this offering, our board of directors will be authorized to have members.
The Day family as a group, owns more than 50% of our outstanding voting securities and we are therefore considered a “controlled company” within the meaning of the NYSE or Nasdaq rules. Following the consummation of this offering, we expect to remain a “controlled company” and we intend to rely upon the “controlled company” exception to the board of directors and committee independence requirements under the NYSE or Nasdaq rules. Pursuant to this exception, we will be exempt from the rules that would otherwise require that our board of directors be comprised of a majority of independent directors and that our compensation committee and nominating and corporate governance committee be composed entirely of independent directors. The “controlled company” exception does not modify the independence requirements for the audit committee. Our board of directors will undertake a review of the independence of each director and consider whether any director has a material relationship with us that could compromise his or her ability to exercise independent judgment in carrying out his or her responsibilities.
Leadership structure
Our board of directors believes that Mr. Stanley R. Day Jr.’s service as both Chairman of the Board and Chief Executive Officer is in the best interests of our company and our stockholders. Mr. Day possesses detailed and in-depth knowledge of the issues, opportunities and challenges we face, and we believe he is the person best positioned to develop agendas that ensure that our board of directors’ time and attention is focused on the most critical matters. While we do not currently intend to separate these positions, a change in leadership structure would be made if our board of directors determines it is in the best long-term interests of our stockholders.
Board committees
Our board of directors will have the following committees: an audit committee, a compensation committee and a nominating and corporate governance committee. The composition and responsibilities of each committee are described below. Members serve on these committees until their resignation or until otherwise determined by our board of directors.
Audit committee
Our audit committee will oversee our corporate accounting, financial reporting and internal controls process. Among other matters, the audit committee will evaluate the independent auditors’ qualifications, independence and performance, determine the engagement of the independent auditors, review and approve the scope of our annual audit and audit fee, discuss with management and the independent auditors the results of our annual audit and the review of our quarterly consolidated financial statements, approve the retention of the independent auditors to perform any proposed permissible non-audit services, monitor the rotation of partners of the independent auditors on the engagement team as required by law, review our critical accounting policies and estimates, oversee our internal audit function and annually review the audit committee charter and the committee’s performance. The members of our audit committee will be , and , with serving as the chair of the committee. , and meet the requirements for financial
84
Table of Contents
literacy under the applicable rules and regulations of the SEC and the NYSE or Nasdaq. Our board has determined that is an audit committee financial expert as defined under the applicable rules of the SEC and has the requisite financial sophistication as defined under the applicable rules and regulations of the NYSE or Nasdaq. Our board of directors has affirmatively determined that meets the definition of “independent director” as defined under the applicable rules and regulations of the SEC and the NYSE or Nasdaq listing rules. The audit committee will operate under a written charter that satisfies the applicable standards of the SEC and the NYSE or Nasdaq. Our audit committee will consist of at least one member that is independent upon the effectiveness of our registration statement of which this prospectus forms a part, a majority of members that are independent within ninety days thereafter and all members that are independent within one year thereafter.
Compensation committee
Our compensation committee will review and recommend policies relating to compensation and benefits of our officers and employees. The compensation committee will review and approve corporate goals and objectives relevant to the compensation of our Chief Executive Officer and other executive officers, evaluate our performance in light of those goals and objectives, and set the compensation of these officers based on such evaluations. The compensation committee will also consider recommendations of our Chief Executive Officer with respect to the compensation of other executive officers. Our Chief Executive Officer will evaluate each other executive officer’s overall performance and contributions to us at the end of each year and report to the compensation committee his recommendations as to the other executive officers’ compensation. The compensation committee will also administer the issuance of stock options and other awards under our stock plans. The compensation committee will review and evaluate, at least annually, the performance of the compensation committee and its members, including compliance of the compensation committee with its charter. The members of our compensation committee will be , and , with serving as the chair of the committee.
As a “controlled company,” we will qualify for, and intend to rely on, exemptions from the NYSE or Nasdaq corporate governance requirements that require such committee to be composed entirely of independent directors. Notwithstanding our intended reliance on the controlled company exemption, our board of directors has affirmatively determined that each of and meets the definition of “independent director” for purposes of the NYSE or Nasdaq listing rules.
Nominating and corporate governance committee
The nominating and corporate governance committee will be responsible for making recommendations regarding candidates for directorships and the size and composition of our board. In addition, the nominating and corporate governance committee will be responsible for overseeing our corporate governance guidelines and reporting and making recommendations concerning governance matters. The nominating and corporate governance committee will be comprised of , and , with serving as the chair of the committee. Potential candidates for nomination to the board of directors will be discussed by the committee.
As a “controlled company,” we will qualify for, and intend to rely on, exemptions from the NYSE or Nasdaq corporate governance requirements that require such committee to be composed entirely of independent directors. Notwithstanding our intended reliance on the controlled company exemption, our board of directors has affirmatively determined that each of and meets the definition of “independent director” for purposes of the NYSE or Nasdaq listing rules.
85
Table of Contents
Code of business conduct and ethics
Prior to the consummation of this offering, our board of directors will adopt a Code of Ethics and Business Conduct. The Code of Ethics and Business Conduct will apply to all members of the board, executive officers and employees, including our Chief Executive Officer, Chief Financial Officer and principal accounting officer. The Code of Ethics and Business Conduct will be available on our website at under “Code of Ethics.” The Code of Ethics and Business Conduct will address, among other things, issues relating to conflicts of interests, including internal reporting of violations and disclosures, and compliance with applicable laws, rules and regulations. The purpose of the Code of Ethics and Business Conduct is to deter wrongdoing and to promote, among other things, honest and ethical conduct and to ensure to the greatest possible extent that our business is conducted in a legal and ethical manner. We intend to promptly disclose (1) the nature of any amendment to our code of ethics that applies to our directors, executive officers or other principal financial officers and (2) the nature of any waiver, including an implicit waiver, from a provision of our code of ethics that is granted to a director, executive officer or other principal financial officer, the name of such person who is granted the waiver and the date of the waiver on our website in the future.
Compensation committee interlocks and insider participation
None of our executive officers currently serves, or has served during the last completed year, on the compensation committee or board of directors of any other entity that has one or more executive officers serving as a member of our board of directors or compensation committee.
86
Table of Contents
Compensation discussion and analysis
The following discussion and analysis of compensation arrangements of our named executive officers for 2010 should be read together with the compensation tables and related disclosures set forth below. This discussion is based on our current plans, considerations and expectations regarding our compensation programs. Compensation policies that we adopt in the future may differ materially from the policies summarized in this discussion.
The following individuals were our “named executive officers” for 2010:
| • | Stanley R. Day Jr., Chief Executive Officer, or CEO; |
| • | Michael R. Herr, Chief Financial Officer, or CFO; |
| • | Jeffrey M. Shupe, Chief Operating Officer, or COO; |
| • | Frederick K. W. Day, Executive Vice President. |
Overview of compensation objectives
We recognize that our success is in large part dependent on our ability to attract and retain talented employees. We endeavor to create and maintain compensation programs based on performance, teamwork, rapid progress, democratic principles and to align the interests of our employees and equity holders. As such, we have designed our compensation program to achieve the following objectives:
| • | attract and retain highly-talented, experienced employees in our industry; |
| • | motivate and reward employees whose knowledge, skills and performance contribute to our success; |
| • | align compensation with our business and financial objectives; and |
| • | offer total compensation that is competitive and fair. |
To meet these objectives, the principle components of compensation in 2010 consisted of base salary and annual cash incentive awards for all employees. Additionally, each of our named executive officers holds equity, either as a founder or through equity incentive units granted at the time of the 2008 recapitalization, or both. Other than the equity compensation, our compensation programs are applied equally to each employee of the company, varying only in the amount of compensation received. Each component of compensation is designed to have a role in meeting the objectives above by rewarding and motivating for both short-term (annual salary and incentives) and long-term performance (equity ownership). We intend to continue to set our compensation policies with the goal of achieving the same compensation objectives identified above and to ensure that total compensation reflects our overall success.
Compensation setting process
Historically, the compensation of our named executive officers has been largely determined on an individual basis and was principally based on paying them a total compensation package that was both competitive at the time they were hired and competitive based on the salaries paid to other executives in our industry per our analysis of general salary surveys and market data. Each year our CEO reviews with the compensation committee the performance of each named executive officer (other than himself) and, based on this review and our CEO’s and compensation committee’s understanding of current market conditions, sets the executive compensation package
87
Table of Contents
for the named executive officers for the coming year. Our compensation committee reviews our CEO’s compensation each year and sets his compensation package based on its understanding of current market conditions and his performance.
We have not historically engaged compensation consultants to assist our compensation committee with compensation policies, nor have we benchmarked our compensation policies against a peer group. However, at the time our named executive officers were hired, we set their salary levels using general salary surveys and competitive market analysis. In addition, management and the compensation committee engaged Towers Watson in 2011 to perform due diligence with respect to certain aspects of our executive compensation program in anticipation of this offering.
Elements of compensation
For 2010, the principal components of executive compensation consisted of base salary and annual cash incentive awards. Each component of compensation has a role in meeting the compensation objectives described above. The following summarizes our objectives for each of the principal components of executive compensation for 2010:
Base Salaries
| • | Reward individuals’ current contributions to the company; and |
| • | Compensate individuals for their expected day-to-day performance. |
Annual cash incentive compensation
| • | Align executive compensation with annual performance; |
| • | Enable us to attract, retain and reward individuals who contribute to our success; and |
| • | Motivate individuals to enhance the value of our company. |
If our corporate objectives are not achieved, a portion of the compensation for our named executive officers is not earned. In this way, our executive compensation program is directly aligned with the interests of our equity holders.
Each component of our executive compensation is discussed in more detail below.
Base salary
Base salaries are reviewed annually and are initially based on arm’s length negotiations at the time of hire and are later adjusted based on individual performance, competitiveness versus the external market, and internal merit increases. Factors that are taken into account to increase or decrease compensation include significant changes in individual job responsibilities, individual performance and/or our growth. Base salaries of our named executive officers are annually reviewed by the compensation committee, with significant input from our CEO for our other named executive officers, to determine whether an adjustment is warranted.
In early 2010, the compensation committee reviewed the base salaries of our named executive officers. The compensation committee, in consultation with our CEO (with respect to the salaries of our other named executive officers), determined that internal merit based increases were warranted for each of our named executive officers. Accordingly, Messrs. Stanley R. Day Jr., Jeffrey M. Shupe and Frederick K. W. Day received a
88
Table of Contents
4% increase in base salary and Mr. Michael R. Herr received an 8% increase due to his strong individual performance and our comparison of his salary, using general surveys and market data, to the salaries of other individuals in similar positions in our industry. By reviewing general salary surveys, the compensation committee determined that these increases were necessary in order for us to remain competitive. The actual salaries of our named executive officers as of December 31, 2009 and 2010 are set forth in the table below.
| Name | 2009 Base Salary | 2010 Base Salary | ||||
| Stanley R. Day, Jr. |
426,000 | 443,040 | ||||
| Michael R. Herr |
242,000 | 261,360 | ||||
| Jeffrey M. Shupe |
305,000 | 317,200 | ||||
| Frederick K. W. Day |
203,000 | 211,120 | ||||
Annual cash incentive compensation
Our named executive officers, as well as all our other employees, participate in the Annual SRAM Bonus Pool, which is based on the achievement of pre-established company objectives for the year. Its purpose is to provide a financial reward when the company achieves or exceeds its annual financial targets. For model year 2010, the two performance measures that were used for determining the amount of the Annual SRAM Bonus Pool were bonus operating income margin and bonus operating income growth. The maximum funding for the Annual SRAM Bonus Pool is a total of four months of the aggregate salaries of all employees determined based on the following matrix:
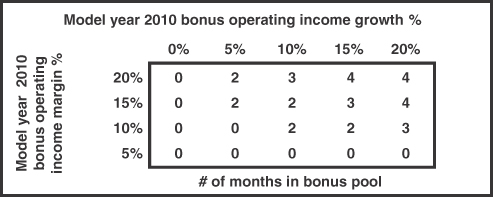
The Annual SRAM Bonus Pool is determined by the intersection of our bonus operating income margin and our bonus operating income growth financial metrics, as shown above. For 2010, a bonus operating income margin of 23.7% was used and a bonus operating income growth of 40.0% was used, resulting in a full four month funding of the Annual SRAM Bonus Pool. Bonus operating income is an internal metric we use to evaluate our performance which is calculated by adding back to operating income (as it appears on our financial statements) certain expenses we believe are not indicative of our operating performance.
Once the Annual SRAM Bonus Pool is established, then the pool is allocated to individual participants in a discretionary manner (which may result in a given participant receiving less or more than the exact funding level). Our CEO determines in his discretion the amount that each of the other named executive officers receives of the pool based on his assessment of their performance and contributions during the year. The CEO’s portion of the pool is determined by the compensation committee based on their discretionary assessment of his performance and contribution for the year. During 2010, Messrs. S. Day, Herr, Shupe and F. Day earned bonuses equal to 18.4%, 40.1%, 32.7%, and 18.4% of their salaries as of year end. Messrs. S. and F. Day both received
89
Table of Contents
the average bonus equal to four months salary for 2010. Mr. Shupe received a higher bonus amount based on his leadership abilities and contributions to our achieving our overall corporate results. Mr. Herr also received a higher bonus due to his strong performance in connection with the completion of our debt refinancing in April 2010 and preparing our accounting group for a possible initial public offering of our shares. We believe that the ability to reward individuals in a discretionary manner, not locked into specific goals and targets, allows our executives to better respond to the fluid nature of our business. We also believe that making a portion of employees’ compensation subject to the achievement of company performance goals motivates them to increase their efforts on behalf of the company.
Benefits and perquisites
In line with our general democratic principles, the named executive officers are not eligible for special perquisites or other benefits that are not available to all of our employees. We offer a 401(k) plan basic group health, disability and life insurance. In addition, all employees are entitled to a discount on purchases of our products.
The compensation committee has not found it necessary for the attraction or retention of our named executive officers to provide them with perquisites or other personal benefits except for those described above. In the future, the compensation committee, in its discretion, may revise, amend or add to any executive officer’s benefits and perquisites as it deems appropriate.
Equity compensation
Each of our named executive officers holds equity in the company in the form of Class B units, and in the case of Messrs. Herr and Shupe, through incentive units that were granted at the time of the 2008 recapitalization. The incentive units vest over a five year period beginning in model year 2009. Provided that Messrs. Herr and Shupe have not terminated their services with our company, or one of our affiliates, their incentive units will vest each year that we meet our model year EBITDA target, as defined in each incentive unit agreement. If the model year EBITDA target is not met for a particular year and the incentive units for that model year do not vest, such incentive units will be forfeited and cancelled. The model year EBITDA target for 2010 was $118 million. Because the 2010 model year EBITDA target was met, both Messrs. Herr and Shupe vested in a portion of their incentive units for that model year. In addition, the vesting of any incentive units held by Messrs. Herr and Shupe may be accelerated, at the board’s discretion, upon the sale of the company or the consummation of an IPO. The board has determined that the vesting of all incentive units held by employees, including Messrs. Herr and Shupe, will accelerate upon the completion of this offering.
The incentive units are intended to provide Messrs. Herr and Shupe with long-term incentives tied to financial performance and to align their interests with our equity holders.
Change in control and severance agreements
Again, in line with our democratic principles, each of our named executive officers is an employee-at-will, meaning that his employment may be terminated at any time and for any reason. None of our named executive officers are parties to any employment, change in control or severance agreements (other than with respect to potential vesting of incentive units upon a sale of the Company) and we do not have any obligations to pay severance in the event their employment were to be terminated.
90
Table of Contents
Summary compensation table
The following table summarizes the total compensation earned by each of our named executive officers for the year ended December 31, 2010.
| Name | Year | Salary | Bonus | Total | ||||||||||||
| Stanley R. Day Jr. Chief Executive Officer |
2010 | $ | 434,520 | $ | 79,875 | $ | 514,395 | |||||||||
| Michael R. Herr Chief Financial Officer |
2010 | $ | 251,680 | $ | 100,833 | $ | 352,513 | |||||||||
| Jeffrey M. Shupe Chief Operating Officer |
2010 | $ | 311,100 | $ | 101,667 | $ | 412,767 | |||||||||
| Frederick K. W. Day Executive Vice President |
2010 | $ | 207,060 | $ | 38,063 | $ | 245,123 | |||||||||
Outstanding equity awards at December 31, 2010
The following table sets forth certain information regarding outstanding equity awards for each of our named executive officers as of December 31, 2010. We did not grant any incentive units to our named executive officers in 2010.
| Incentive Unit Awards | ||||||||
| Name | Number of Units of That Have Not Vested |
Market Value of Units That Have Not Vested(1) |
||||||
| Stanley R. Day, Jr. |
— | — | ||||||
| Michael R. Herr(2) |
18,652.8 | $ | 1,953,507.74 | |||||
| Jeffrey M. Shupe(3) |
34,197.0 | $ | 3,581,451.81 | |||||
| Frederick K. W. Day |
— | — | ||||||
| (1) | Determined based on a value of the incentive units equal to $104.73 per unit as of December 31, 2010. |
| (2) | On December 31, 2008 Mr. Herr was granted 31,088 incentive units, which vest in five installments of 6,217.6 incentive units for each model year, for model years 2009-2013; provided, that no termination event has occurred and we achieve our model year EBITDA for such model year. All unvested incentive units will fully vest upon the completion of this offering. |
| (3) | On December 31, 2008 Mr. Shupe was granted 56,995 incentive units, which vest in five installments of 11,399 incentive units for each model year, for model years 2009-2013; provided, that no termination event has occurred and we achieve our model year EBITDA for such model year. All unvested incentive units will fully vest upon the completion of this offering. |
Equity awards vested in fiscal year 2010
The following table sets forth information regarding the equity awards that vested during the year ended December 31, 2010.
| Incentive Unit Awards | ||||||||
| Name | Number of Units of Acquired on Vesting |
Value Realized on Vesting(1) |
||||||
| Stanley R. Day, Jr. |
— | — | ||||||
| Michael R. Herr |
6,217.6 | $ | 651,169.25 | |||||
| Jeffrey M. Shupe |
11,399.0 | $ | 1,193,817.27 | |||||
| Frederick K. W. Day |
— | — | ||||||
| (1) | Determined based on a value of the incentive units equal to $104.73 per unit as of December 31, 2010. |
91
Table of Contents
Change in Control
The board, in its discretion may cause all incentive units to become fully vested upon a sale of the company. Assuming such a sale on December 31, 2010, and that the board exercised its discretion to vest the units, and using a value of the Company of $104.73 per unit the value of the acceleration of Messrs. Herr’s and Shupe’s incentive units would have been $1,953,508 and $3,581,452 respectively. None of our named executive officers is party to any employment or severance agreement and we do not have any obligations to pay severance in the event their employment is terminated.
Compensation of directors
Beginning in 2011, management and the compensation committee engaged Towers Watson to assist the compensation committee in benchmarking outside director compensation against a peer group. We expect that the compensation committee will continue to review relevant market peer group data in connection with setting the compensation we offer our outside directors to help ensure that our compensation programs are competitive and fair.
Only three of the directors of SRAM Holdings, LLC, Messrs. Walker, Cohen and Smith, have received any compensation in connection with their service on our board of directors. In 2010, Messrs. Walker and Moore were the non-employee directors on the compensation committee of SRAM Holdings, LLC; and Messrs. Cohen and Moore were the non-employee directors on the audit committee of SRAM Holdings, LLC.
In general, Messrs. Walker, Cohen and Smith are paid a quarterly director fee of $2,500; a quarterly committee fee of $750; $2,000 for attending regular board meetings of SRAM Holdings, LLC and $250 for participating in telephonic board meetings of SRAM Holdings, LLC. Only non-employee directors and those directors who are not affiliated with Trilantic are paid fees in connection with their service on the board of SRAM Holdings, LLC. Messrs. Moore and James are affiliated with Trilantic and, therefore, received no fees in 2010 for their service on the board of SRAM Holdings, LLC. The following table sets forth the compensation paid to the non-employee directors of SRAM Holdings, LLC with respect to their services as such during the year ended December 31, 2010.
| Name | Fees paid in cash ($) |
|||
| Charles R. Walker |
21,000 | |||
| Gidon Cohen |
21,000 | |||
| Jack Smith |
21,000 | |||
| Charles C. Moore |
0 | |||
| E. Daniel James |
0 | |||
92
Table of Contents
Certain relationships and related person transactions
We describe below transactions and series of similar transactions, during our last three years, to which we were a participant or will be a participant, in which:
| • | the amounts involved exceeded or will exceed $120,000; and |
| • | any of our directors, executive officers, holders of more than 5% of our common stock or any member of their immediate family had or will have a direct or indirect material interest. |
Trilantic 2008 investment and recapitalization
On September 30, 2008, we effected a recapitalization in connection with the acquisition by Trilantic and its co-investors of a $234.8 million equity interest in us. Pursuant to the recapitalization, the stockholders of SRAM Corporation contributed their shares to newly formed SRAM-SP2, Inc. in exchange for shares of SRAM-SP2, Inc., and SRAM Corporation thereafter merged into SRAM, LLC, a wholly-owned subsidiary of SRAM Holdings, LLC. As part of this financing and reorganization;
| • | Trilantic and its co-investors purchased 3,640,000 Class A units (100% of the Class A units) of SRAM Holdings, LLC from SRAM-SP2, Inc. As Class A unitholders, Trilantic and its co-investors are entitled to a Class A priority interest in the amount of their initial $234.8 million investment plus a 10% annual preferred return, compounded quarterly (increasing to 15% on September 30, 2014). As of , 2011, the Class A priority interest consisted of their $234.8 million initial investment plus $ million of accrued preferred return. The Class A holders are also entitled to participate in all distributions after the repayment of their priority interest. Additionally, the Class A holders appoint two of the seven managers of SRAM Holdings, LLC and are entitled to certain other governance rights, as described below; |
| • | SRAM-SP2, Inc. used $224.8 million of the proceeds of the sale of Class A units to Trilantic and its co-investors to fund a repurchase of SRAM-SP2, Inc. shares held by the pre-transaction holders of the capital stock of SRAM Corporation; and |
| • | We entered into a $240.0 million term loan credit facility, of which $236.4 million was used to fund a special distribution to pre-transaction stockholders of SRAM-SP2, Inc. |
We refer to the transactions above collectively as the 2008 recapitalization.
Credit Facilities
In connection with the 2008 recapitalization, in September 2008, we entered into a $240.0 million term loan credit facility, of which $236.4 million was used to fund a special distribution to SRAM-SP2, Inc. SRAM-SP2, Inc. distributed these funds as a special dividend of approximately $32.00 per share to its stockholders. Of the $240.0 million term loan credit facility, $1.6 million of the term loan was funded by Stanley R. Day, Jr., our President and Chief Executive Officer and $1.4 million was funded by Frederick K. W. Day, our Executive Vice President. The interest rate on the loan was 8.07%, 7.35% and 7.57% in 2008, 2009 and 2010, respectively. In 2008, 2009 and 2010, Stanley R. Day, Jr. received interest and principal payments of approximately $22,844, $356,902 and $133,315, respectively, and Frederick K. W. Day received payments of approximately $19,988, $312,290 and $116,650, respectively, for interest and principal on these loans from SRAM Holdings, LLC. In March 2010, a member of the lending syndicate purchased their portions of the loan. Certain holders of the Class A units of SRAM Holdings, LLC, including certain affiliates of our selling stockholders, are lenders in the existing term loan credit facility, including General Electric Capital Corporation and JP Morgan Chase Bank, N.A. Simultaneous with the term loan facility, we entered into a $110.0 million mezzanine credit facility. Certain
93
Table of Contents
holders of Class A units of SRAM Holdings, LLC, including certain affiliates of our selling stockholders, were lenders in the mezzanine credit facility, including JPM Mezzanine Capital, LLC, Gleacher Mezzanine Fund II, L.P. and Southern Farm Bureau Life Insurance Company.
Option Exercise and Distribution
Pursuant to the 2008 recapitalization, each U.S. resident, including Gidon Cohen, one of our directors, Frederick K. W. Day, Stanley R. Day, Jr., John W. Stroh, III, brother-in-law to Stanley R. and Frederick K. W. Day, Michael R. Herr, our Chief Financial Officer, Jeffrey M. Shupe, our Chief Operating Officer, Jack Smith, one of our directors, Charles R. Walker, a director of SRAM Holdings, LLC, Robert Perkowitz, a former director of SRAM Holdings, LLC and Jack Smith, a former director of SRAM Holdings, LLC, who held stock options to purchase shares of SRAM Corporation having a value in excess of $100,000 in the aggregate exercised such options and received shares of SRAM-SP2, Inc., and each U.S. resident who held stock options to purchase shares of SRAM Corporation having a value of less than $100,000 in the aggregate and each non-U.S. resident who held stock options to purchase shares of SRAM Corporation cancelled their options in exchange for a cash payment. Non-U.S. residents who received proceeds in excess of $100,000 were required to invest at least 25% of their net proceeds in SRAM International, Inc., a newly-formed corporation. SRAM-SP2, Inc. sold 68,161 of its Class B units in SRAM Holdings, LLC to SRAM International, Inc. for approximately $4.4 million. SRAM-SP2, Inc. distributed the proceeds of this sale as a special dividend of approximately $0.95 per share to its stockholders.
Trilantic Investment and repurchase
As described above, in the 2008 recapitalization, SRAM-SP2, Inc. sold 100% of the Class A units (3,640,000 Class A units) in SRAM Holdings, LLC to Trilantic and its co-investors for $234.8 million, which constituted a 40% minority interest in SRAM Holdings, LLC. SRAM-SP2, Inc. used $224.8 million of the sale proceeds to redeem 40% of its outstanding shares (less the number of options purchased by SRAM Corporation as described above) from certain electing stockholders. In connection with this repurchase, each of the non-Day family stockholders of SRAM-SP2, Inc. were offered the opportunity to sell up to 75% of their shares in SRAM-SP2, Inc., and the Day family stockholders agreed to sell the portion of their shares of SRAM-SP2, Inc., necessary to cause the total number of shares repurchased to equal 40% of the outstanding SRAM-SP2, Inc. shares. The repurchase price per share of SRAM-SP2, Inc. was approximately $80.79, payable in two separate installments in 2008 and 2009. Repurchase proceeds paid to Stanley R. Day, Jr. and a trust for his benefit, Frederick K. W. Day and a trust for his benefit, Lincoln W. Day (brother to Stanley R. and Frederick K. W. Day), Vivian W. Day (sister to Stanley and Frederick Day), John W. Stroh, III, Gidon Cohen and a trust for his benefit, Michael R. Herr, Jeffrey M. Shupe, Jack Smith and Charles R. Walker in 2008 and 2009 were as follows: $50,615,584 and $8,667,379, respectively; $45,604,728 and $7,809,323, respectively; $23,347,894 and $3,998,078, respectively; $13,463,466 and $2,305,476, respectively; $811,975 and $139,042, respectively; $2,050,686 and $350,494, respectively; $3,919,297 and $670,437, respectively; $8,133,573 and $1,390,657, respectively; $1,681,585 and $287,500, respectively; and $4,507,467 and $770,395, respectively.
Operating Agreement
In connection with the 2008 recapitalization, the holders of the Class A Units of SRAM Holdings, LLC were granted certain governance rights, which were set forth in the amended and restated limited liability company operating agreement of SRAM Holdings, LLC and include the following:
| • | The holders of the Class A units are entitled to designate two of the seven managers of SRAM Holdings, LLC, and also have various approval rights with respect to certain extraordinary transactions or activities of SRAM Holdings, LLC and its subsidiaries, as well as certain liquidity rights and customary registration rights commencing between September 30, 2012 and September 30, 2013. Currently, Mr. Charles C. Moore and |
94
Table of Contents
| Mr. E. Daniel James are the two designated managers of SRAM Holdings, LLC. At the time of the 2008 recapitalization, we entered into an indemnification agreement with Mr. Moore. |
| • | The holders of the Class A units receive a 10% cumulative preferred return, compounded quarterly, payable on their $234.8 million initial capital contribution and on any accrued but unpaid preferred return (with the preferred return increasing to 15% on September 30, 2014). |
| • | The holders of the Class A units are entitled to a return of their entire $234.8 million initial capital contribution and any accrued but unpaid preferred return thereon, as compounded at the preferred return rate, before any distributions (other than mandatory tax distributions) are made to the holders of the Class B units or to the holders of any incentive units. Once the holders of the Class A units have received a distribution equal to their entire $234.8 million initial capital contribution and any accrued but unpaid preferred return thereon, as compounded at the preferred return rate, they are also entitled to share in further distributions by SRAM Holdings, LLC. |
2011 refinancing and reorganization
Refinancing
Prior to the reorganization and this offering, SRAM, LLC intends to enter into new credit facilities consisting of a first-lien term facility, a second-lien term facility and a revolving facility. The aggregate proceeds from the new credit facilities will be approximately $ million. The proceeds from the new credit facilities will be used to repay all outstanding amounts under our existing credit facilities, which as of , 2011 was $ million, to directly or indirectly acquire all of the equity interests in SRAM Holdings, LLC held by Trilantic and its co-investors for $ million and to pay fees and expenses related to the refinancing. In connection with these transactions, SRAM Holdings, LLC will amend and restate its operating agreement to create a single class of common units and eliminate the corporate governance and liquidity rights of the Class A unit holders. Following the refinancing, Trilantic and its co-investors will have no remaining ownership of SRAM Holdings, LLC. See “The refinancing and reorganization” for additional information.
Reorganization
Immediately prior to the consummation of this offering, the remaining equity holders of SRAM Holdings, LLC, after giving effect to the refinancing described above, will enter into a reorganization pursuant to which SRAM International Corporation will acquire 100% of the equity interests of SRAM Holdings, LLC, either directly or through one or more wholly-owned subsidiaries, and the equity holders of SRAM Holdings, LLC will exchange their direct or indirect equity interests in SRAM Holdings, LLC for shares of common stock of SRAM International Corporation. The remaining equity holders will include the Day family, SRAM management and current and former directors and employees. A portion of the shares of common stock issued to the remaining equity holders will be sold in the secondary portion of this offering. SRAM Holdings, LLC will continue to hold 100% of the equity interests of our operating company, SRAM, LLC. Immediately prior to this offering, SRAM Holdings, LLC will make a $ million distribution to its remaining equity holders to cover the estimated federal and state income taxes payable on their allocable shares of estimated taxable income of SRAM Holdings, LLC from January 1, 2011 through the closing date of this offering. See “The refinancing and reorganization” for additional information.
Registration rights
We intend to enter into a registration rights agreement with certain members of the Day family, which will provide for customary registration rights, including demand, short-form and piggyback registration rights of their common stock.
95
Table of Contents
Stockholders agreement
We intend to enter into a stockholders agreement with the Day family members. The stockholders agreement will set forth certain terms relating to the rights of our principal stockholders and restrictions on transfers of shares of our common stock.
Other agreements
We intend to enter into indemnification agreements with each of our directors and executive officers.
Policies and Procedures for related person transactions
Our board of directors intends to adopt a written related person policy to set forth the policies and procedures for the review and approval or ratification of related person transactions. This policy will cover any transaction, arrangement or relationship, or any series of similar transactions, arrangements or relationships in which we are to be a participant, the amount involved exceeds $120,000 and a related person had or will have a direct or indirect material interest, including purchases of goods or services by or from the related person or entities in which the related person has a material interest, indebtedness, guarantees of indebtedness and employment by us of a related person.
96
Table of Contents
Principal and selling stockholders
The following table sets forth information regarding beneficial ownership of SRAM International Corporation’s capital stock immediately prior to the consummation of this offering, giving effect to the refinancing and the reorganization, including the filing of our amended and restated certificate of incorporation, and immediately after this offering for the following:
| • | each person, or group of affiliated persons, known by us to beneficially own more than 5% of our voting securities; |
| • | each of our directors; |
| • | each of our named executive officers; |
| • | each of the selling stockholders; and |
| • | all of our executive officers and directors as a group. |
Beneficial ownership is determined according to the rules of the SEC and generally means that a person has beneficial ownership of a security if he, she or it possesses sole or shared voting or investment power of that security, including options and warrants that are currently exercisable or exercisable within 60 days. Except as indicated by the footnotes below, we believe, based on the information furnished to us, that the persons named in the table below have sole voting and investment power with respect to all shares of common stock shown that they beneficially own, subject to community property laws where applicable.
Unless otherwise noted below, the address for each of the stockholders in the table below is c/o SRAM, 1333 North Kingsbury Street, 4th Floor, Chicago, Illinois 60622.
See “Certain relationships and related person transactions” and “Management” for information with respect to certain selling stockholders and their relationship with us.
| Beneficial ownership prior to the offering(1) |
Beneficial ownership after the offering |
|||||||||||||||||||||||||||||||||||||||||||
| Class A common stock |
Class B common stock |
Class A common stock |
Class B common stock |
|||||||||||||||||||||||||||||||||||||||||
| Name and address of beneficial owner |
Shares | % | Shares | % | Percent of total voting power prior to offering |
Class A shares being offered |
Shares | % | Shares | % | Percentage of total voting power after the offering |
|||||||||||||||||||||||||||||||||
| 5% stockholders: |
||||||||||||||||||||||||||||||||||||||||||||
| Lincoln W. Day(2) |
||||||||||||||||||||||||||||||||||||||||||||
| Vivian W. Day(3) |
||||||||||||||||||||||||||||||||||||||||||||
| Executive officers and directors: |
||||||||||||||||||||||||||||||||||||||||||||
| Stanley R. Day, Jr.(4) |
||||||||||||||||||||||||||||||||||||||||||||
| Michael R. Herr(5) |
||||||||||||||||||||||||||||||||||||||||||||
| Jeffrey M. Shupe(6) |
||||||||||||||||||||||||||||||||||||||||||||
| Frederick K. W. Day(7) |
||||||||||||||||||||||||||||||||||||||||||||
| Gidon Cohen(8) |
||||||||||||||||||||||||||||||||||||||||||||
| Jack Smith(9) |
||||||||||||||||||||||||||||||||||||||||||||
| Charles C. Moore(10) |
||||||||||||||||||||||||||||||||||||||||||||
| Other selling stockholders |
||||||||||||||||||||||||||||||||||||||||||||
| All executive officers and directors as a group (7 persons) |
||||||||||||||||||||||||||||||||||||||||||||
| * | Represents beneficial ownership of less than one percent (1%) of our outstanding common stock. |
| (1) | Gives effect to the refinancing and the reorganization. Shares shown in the table above include shares held in the beneficial owner’s name or jointly with others, or in the name of a bank, nominee or trustee for the beneficial owner’s account. |
| (2) | Lincoln W. Day has sole investment and voting power as to these shares. The address of Mr. Day is 30 E. 7th Street, Suite 2000, St. Paul, Minnesota 55101. Pursuant to a stockholders agreement that will be entered into in connection with this offering, the Day family will agree to certain voting arrangements. See “Certain relationships and related person transactions—2011 refinancing and reorganization—Stockholders agreement.” |
97
Table of Contents
| (3) | Represents (i) shares of Class A common stock beneficially owned by Vivian W. Day and (ii) shares of Class A common stock held by Vivian W. Day’s spouse. Vivian W. Day has sole investment and voting power as to shares listed in (i). Ms. Day disclaims beneficial ownership of the shares listed in (ii), except to the extent of her pecuniary interest therein. Pursuant to a stockholders agreement that will be entered into in connection with this offering, the Day family will agree to certain voting arrangements. See “Certain relationships and related person transactions—2011 refinancing and reorganization—Stockholders agreement.” The address of Ms. Day is 300 River Place, Suite 5000, Detroit, Michigan 48207. |
| (4) | Represents (i) shares of Class A common stock beneficially owned by the Stanley R. Day Jr. Trustee U/A, dated 10/22/04 with Stanley R. Day Jr.; (ii) shares of Class A common stock held of record by S.R. Day Jr. and C.P. Stroh Trustees U/A dated 2/28/01 with Vivian W. Day and John W. Stroh III f/b/o Christopher R.W.D. Stroh Trust and (iii) shares of Class A common stock held of record by S.R. Day Jr. and C.P. Stroh Trustees U/A dated 5/15/96 with Vivian W. Day and John W. Stroh III f/b/o Elizabeth R.W.D. Stroh Trust. Stanley R. Day, Jr. is the sole trustee of the Stanley R. Day Jr., Trustee U/A dated 10/22/04 with Stanley R. Day Jr. and as such, has investment and voting power as to these shares. Mr. Day is co-trustee of S.R. Day Jr. and C.P. Stroh Trustees U/A dated 2/28/01 with Vivian W. Day and John W. Stroh III f/b/o Christopher R.W.D. Stroh and S.R. Day Jr. and C.P. Stroh Trustees U/A dated 5/15/96 with Vivian W. Day and John W. Stroh III f/b/o Elizabeth R.W.D. Stroh Trusts and, as such, has shared investment and voting power as to these shares. Mr. Day disclaims beneficial ownership of these shares listed in (ii) and (iii), except to the extent of his pecuniary interest therein, if any. Pursuant to a stockholders agreement that will be entered into in connection with this offering, the Day family will agree to certain voting arrangements. See “Certain relationships and related person transactions—2011 refinancing and reorganization—Stockholders agreement.” |
| (5) | Represents (i) shares of Class A common stock beneficially owned by Michael R. Herr and (ii) shares of Class A common stock beneficially owned by the Michael R. Herr Trust, dated 10/26/00, as amended. Mr. Herr is the sole trustee of the Michael R. Herr Trust. Mr. Herr has sole investment and voting power as to all of these shares. |
| (6) | Jeffrey M. Shupe has sole investment and voting power as to these shares. |
| (7) | Frederick K. W. Day is the sole trustee of the F.K.W. Day Trust U/A dated 6/9/04 and as such, has investment and voting power as to these shares. Pursuant to a stockholders agreement that will be entered into in connection with this offering, the Day family will agree to certain voting arrangements. See “Certain relationships and related person transactions—2011 refinancing and reorganization—Stockholders agreement.” |
| (8) | Gidon Cohen is sole trustee of the Gidon Cohen Revocable Trust dated 5/8/90 and, as such, has investment and voting power as to these shares. |
| (9) | Jack Smith has sole investment and voting power as to these shares. |
| (10) | Charles C. Moore is a partner of Trilantic Capital Partners. Mr. Moore was elected to our Board of Directors as a Trilantic Capital Partners designee in 2008 as part of the 2008 recapitalization. See “Certain relationships and related person transactions—Trilantic 2008 investment and recapitalization.” |
98
Table of Contents
General
The following is a summary of the material rights of our capital stock and related provisions of our amended and restated certificate of incorporation and amended and restated bylaws, as they will be in effect upon the completion of this offering. The following description of our capital stock does not purport to be complete and is subject to, and qualified in its entirety by, our amended and restated certificate of incorporation, amended and restated bylaws, the Day family stockholders agreement and the Day family registration rights agreement, which we have included as exhibits to the registration statement of which this prospectus is a part.
Our amended and restated certificate of incorporation provides that, upon the closing of this offering, we will have two classes of common stock: Class A common stock, which will have one vote per share, and Class B common stock, which will have ten votes per share. Any holder of Class B common stock may convert his or her shares at any time into shares of Class A common stock on a share-for-share basis and, under certain circumstances, the shares of Class B common stock will be automatically converted into shares of Class A common stock on a share-for-share basis. Otherwise the rights of the two classes of our common stock will be identical. The rights of these classes of our common stock are discussed in greater detail below.
After completion of this offering, our authorized capital stock will consist of shares, each with a par value of $0.01 per share, of which:
| • | shares will be designated as Class A common stock; |
| • | shares will be designated as Class B common stock; and |
| • | shares will be designated as preferred stock. |
Our Class A common stock is the class of stock we are proposing to sell in our initial public offering and will be the only class of stock which is publicly traded. After completion of this offering, there will be shares of Class A common stock outstanding and shares of Class B common stock outstanding (assuming the underwriters do not exercise their right to purchase additional shares).
Common stock
Voting rights
Holders of our Class A common stock are entitled to one vote per share and holders of our Class B common stock are entitled to ten votes per share. Holders of shares of Class A common stock and Class B common stock will vote together as a single class on all matters (including the election of directors) submitted to a vote of stockholders, unless otherwise required by law. Delaware law could require either our Class A common stock or our Class B common stock to vote separately as a single class in the following circumstances:
| • | If we were to seek to amend our amended and restated certificate of incorporation to increase the authorized number of shares of a class of stock, or to increase or decrease the par value of a class of stock, then that class would be required to vote separately to approve the proposed amendment; and |
| • | If we were to seek to amend our amended and restated certificate of incorporation in a manner that altered or changed the powers, preferences or special rights of a class of stock in a manner that affected its holders adversely, then that class would be required to vote separately to approve the proposed amendment. |
We have not provided for cumulative voting for the election of directors in our amended and restated certificate of incorporation.
99
Table of Contents
Dividend rights
Subject to preferences that may apply to any outstanding shares of preferred stock, holders of Class A common stock and Class B common stock will be entitled to share equally in any dividends that our board of directors may declare from time to time. In the event a dividend is paid in the form of shares of common stock or rights to acquire shares of common stock, holders of Class A common stock will receive Class A common stock, or rights to acquire Class A common stock, as the case may be, and holders of Class B common stock will receive Class B common stock, or rights to acquire Class B common stock, as the case may be.
Liquidation
Upon any voluntary or involuntary liquidation, dissolution, distribution of assets or winding up of our corporation, holders of our Class A common stock and Class B common stock are entitled to share equally, on a per share basis, in all our assets available for distribution, after payment to creditors and subject to any prior distribution rights granted to holders of any outstanding shares of preferred stock.
Conversion
Our Class A common stock is not convertible into any other shares of our capital stock.
Each share of Class B common stock is convertible at any time at the option of the holder into one share of Class A common stock. In addition, each share of Class B common stock will convert automatically into one share of Class A common stock upon any transfer, whether or not for value, except for certain transfers described in our amended and restated certificate of incorporation, including the following:
| • | transfers between members of the Day family; |
| • | transfers for tax and estate planning purposes, including to trusts, corporations and partnerships controlled by a holder of Class B common stock, or transfers to certain qualified charitable foundations; and |
| • | transfers approved in advance by our board of directors or a majority of the independent directors on our board of directors after making a determination that the transfer is consistent with the purposes of the other types of transfers that are permitted. |
All shares of Class B common stock will convert automatically into shares of Class A common stock if, on any record date for determining the stockholders entitled to vote at an annual or special meeting of stockholders, the aggregate number of shares of our Class A common stock and Class B common stock owned, directly or indirectly, by the holders of our Class B common stock is less than % of the aggregate number of shares of our Class A common stock and Class B common stock then outstanding.
Once converted into Class A common stock, the Class B common stock shall not be reissued. No class of common stock may be subdivided or combined unless the other class of common stock concurrently is subdivided or combined in the same proportion and in the same manner.
Other than in connection with dividends and distributions, subdivisions or combinations, or mergers, consolidations, reorganizations or other business combinations involving stock consideration as provided for in our amended and restated certificate of incorporation, we are not authorized to issue additional shares of Class B common stock.
Preferred stock
Following this offering, our board of directors will be authorized, without any further action by our stockholders, but subject to the limitations imposed by Delaware law, to issue up to shares of preferred stock in one or more series. Our board of directors may fix the designations, powers, preferences and rights of the
100
Table of Contents
preferred stock, along with any qualifications, limitations or restrictions, including voting rights, dividend rights, conversion rights, redemption privileges and liquidation preferences of each series of preferred stock. The preferred stock could have voting or conversion rights that could adversely affect the voting power or other rights of holders of our common stock. The issuance of preferred stock, or rights to acquire preferred stock, could also have the effect, under certain circumstances, of delaying, deferring or preventing a change of control of our company.
Registration rights
We intend to enter into a registration rights agreement with certain members of the Day family, providing for customary registration rights, including demand, short-form and piggyback registration rights of their common stock.
Anti-takeover provisions
Certain provisions of Delaware law and our amended and restated certificate of incorporation and bylaws that will become effective upon completion of this offering could have the effect of delaying, deferring or discouraging another party from acquiring control of us. In particular, our dual class common stock structure will concentrate ownership of our voting stock in the hands of the Day family. These provisions, which are summarized below, are expected to discourage certain types of coercive takeover practices and inadequate takeover bids. These provisions are also designed in part to allow management to continue making decisions for the long-term best interest of SRAM International Corporation and all of our stockholders and encourage anyone seeking to acquire control of us to first negotiate with our board of directors. We believe that the advantages gained by protecting our ability to negotiate with any unsolicited and potentially unfriendly acquirer outweigh the disadvantages of discouraging such proposals, including those priced above the then-current market value of our common stock, because, among other reasons, the negotiation of such proposals could improve their terms.
Dual class structure
Our Class B common stock is entitled to ten votes per share, while our Class A common stock is entitled to one vote per share. Our Class A common stock is the class of stock we are proposing to sell in our initial public offering and will be the only class of stock which is publicly traded. Following this offering, the Day family will beneficially own, in the aggregate, all of our Class B common stock, representing % of the total voting power of our outstanding common stock (or % of the total voting power of our outstanding common stock if the underwriters exercise in full their option to purchase additional shares). As a result, the Day family will be able to exert a significant degree of influence or actual control over our management and affairs and over matters requiring stockholder approval, including the election of directors, a merger, consolidation or sale of all or substantially all of our assets and any other significant transaction. Because of our dual class common stock structure, holders of our Class B common stock will continue to exert a significant degree of influence or actual control over matters requiring stockholder approval, even if they own less than 50% of the outstanding shares of our common stock. This concentrated control could discourage others from initiating any potential merger, takeover or other change of control transaction that other stockholders may view as beneficial.
101
Table of Contents
Certificate of incorporation and bylaws
Our amended and restated certificate of incorporation and amended and restated bylaws, which will become effective upon completion of this offering will include the following provisions, among others:
| • | holders of our Class A common stock vote together with holders of our Class B common stock on all matters, unless otherwise required by law, including the election of directors, and our amended and restated certificate of incorporation prohibits cumulative voting in the election of directors; |
| • | immediately following this offering, our board of directors will consist of a single class, with each director serving a one-year term. However, if all shares of our Class B common stock are converted into Class A common stock or otherwise cease to be outstanding, our board of directors will be divided into three classes, with each class serving for a staggered three-year term; |
| • | vacancies on our board of directors, and any newly created director positions created by the expansion of the board of directors, may be filled only by a majority of remaining directors then in office; |
| • | immediately following this offering, our stockholders may act by written consent. However, if all shares of our Class B common stock are converted into Class A common stock or otherwise cease to be outstanding, actions to be taken by our stockholders will only be permitted to be effected at an annual or special meeting of our stockholders and not by written consent; |
| • | special meetings of our stockholders may be called by our chairman, president, chief executive officer or a majority of our board of directors. In addition, immediately following this offering, our secretary must also call a special meeting of stockholders upon the written request of stockholders entitled to cast not less than a majority of all the votes entitled to be cast at that meeting. However, if all shares of our Class B common stock are converted into Class A common stock or otherwise cease to be outstanding, our stockholders will not be permitted to call special meetings of our stockholders; |
| • | our amended and restated bylaws establish an advance notice procedure for stockholders to submit proposed nominations of persons for election to our board of directors and other proposals for business to be brought before an annual or special meeting of our stockholders; and |
| • | our board of directors may issue up to shares of preferred stock, with designations, rights and preferences as may be determined from time to time by our board of directors. |
Section 203 of the Delaware General Corporation Law
Immediately following this offering, we will not be governed by Section 203 of the Delaware general corporation law. However, our amended and restated certificate of incorporation provides that we will be governed by Section 203 if all shares of our Class B common are converted into Class A common stock or otherwise cease to be outstanding. In general, Section 203 prohibits a public Delaware corporation from engaging in a “business combination” with an “interested stockholder” for a period of three years after the date of the transaction in which the person became an interested stockholder, unless the business combination is approved in a prescribed manner. A “business combination” includes mergers, asset sales or other transactions resulting in a financial benefit to the stockholder. An “interested stockholder” is a person who, together with affiliates and associates, owns, or within the prior three years did own, 15% or more of the corporation’s outstanding voting stock.
The provisions of Delaware law, our amended and restated certificate of incorporation and our amended and restated bylaws could have the effect of discouraging others from attempting hostile takeovers and, as a consequence, they may also inhibit temporary fluctuations in the market price of our common stock that often
102
Table of Contents
result from actual or rumored hostile takeover attempts. These provisions may also have the effect of preventing changes in our management. It is possible that these provisions could make it more difficult to accomplish transactions that stockholders may otherwise deem to be in their best interests.
Voting agreements
In connection with the consummation of this offering, we intend to enter into a stockholders agreement with the Day family members. The stockholders agreement will set forth certain terms relating to the rights of the Day family and restrictions on transfers of shares of our Class B common stock.
Limitations of liability and indemnification
See “Certain relationships and related person transactions—Other agreements.”
New York Stock Exchange or Nasdaq Stock Market listing
We will apply to have our Class A common stock approved for quotation on the NYSE or Nasdaq under the symbol “SRAM.”
Transfer agent and registrar
The transfer agent and registrar for our Class A common stock is . The transfer agent’s address is and its telephone number is .
103
Table of Contents
Shares eligible for future sale
Prior to this offering, there has been no public market for our common stock. Future sales of our Class A common stock in the public market, or the availability of such shares for sale in the public market, could adversely affect market prices prevailing from time to time. As described below, only a limited number of shares will be available for sale shortly after this offering due to contractual and legal restrictions on resale. Nevertheless, sales of our common stock in the public market after such restrictions lapse, or the perception that those sales may occur, could adversely affect the prevailing market price at such time and our ability to raise equity capital in the future.
The number of shares outstanding on a pro forma as adjusted basis, after giving effect to the refinancing, the reorganization, including the filing of our amended and restated certificate of incorporation, and this offering, will be shares of Class A common stock and shares of Class B common stock. Of the outstanding shares, all of the shares sold in this offering will be freely tradable, except that any shares held by our affiliates, as that term is defined in Rule 144 under the Securities Act, may only be sold in compliance with the limitations described below.
The remaining shares of Class A common stock outstanding after this offering and the shares of Class A common stock issuable upon conversion of Class B common stock will be restricted as a result of securities laws or lock-up agreements as described below. Following the expiration of the lock-up period, all shares of Class A common stock will be eligible for resale in compliance with Rule 144, Rule 144(k). “Restricted securities” as defined under Rule 144 were issued and sold by us in reliance on exemptions from the registration requirements of the Securities Act. These shares may be sold in the public market only if registered or pursuant to an exemption from registration, such as Rule 144 under the Securities Act.
Rule 144
In general, a person who has beneficially owned restricted shares of our common stock for at least six months would be entitled to sell their securities provided that (i) such person is not deemed to have been one of our affiliates at the time of, or at any time during the 90 days preceding, a sale and (ii) we are subject to the Exchange Act periodic reporting requirements for at least 90 days before the sale. Persons who have beneficially owned restricted shares of our common stock for at least six months but who are our affiliates at the time of, or any time during the 90 days preceding, a sale, would be subject to additional restrictions, by which such person would be entitled to sell within any three-month period only a number of securities that does not exceed the greater of either of the following:
| • | 1% of the number of shares of our Class A common stock then outstanding, which will equal approximately shares immediately after this offering, based on the number of shares of Class A common stock outstanding as of the completion of this offering; or |
| • | the average weekly trading volume of our Class A common stock on NYSE or Nasdaq during the four calendar weeks preceding the filing of a notice on Form 144 with respect to the sale. |
Provided, in each case, that we are subject to the Exchange Act periodic reporting requirements for at least 90 days before the sale. Such sales, if applicable, must also comply with the manner of sale, current public information and notice provisions of Rule 144.
Lock-up agreements
Our directors, executive officers and certain of our stockholders have entered or will enter into lock-up agreements with the underwriters pursuant to which they have agreed, with limited exceptions, not to sell,
104
Table of Contents
transfer or dispose of, directly or indirectly, any shares of our Class A common stock or any securities convertible into or exercisable or exchangeable for shares of our Class A common stock without the prior written consent of J.P. Morgan Securities LLC, Merrill Lynch, Pierce, Fenner & Smith Incorporated and Morgan Stanley & Co. Incorporated for a period of 180 days after the date of this prospectus, subject to a possible extension under certain circumstances, after the date of this prospectus. The holders of approximately % of our outstanding shares of common stock have executed lock-up agreements. These agreements are described under “Underwriting.”
Registration rights
On the date beginning days after the date of this prospectus, the holders of approximately shares of our Class B common stock, or their transferees, will be entitled to certain rights with respect to the registration of those shares under the Securities Act. For a description of these registration rights, see “Description of capital stock—Registration rights.” After these shares are registered, they will be freely tradable without restriction under the Securities Act.
Registration statements
As soon as practicable after the consummation of this offering, we intend to file a Form S-8 registration statement under the Securities Act to register shares of our Class A common stock reserved for issuance under our SRAM International Corporation 2011 Incentive Award Plan. This registration statement will become effective immediately upon filing, and shares covered by this registration statement will thereupon be eligible for sale in the public markets, subject to vesting restrictions, the lock-up agreements described above and Rule 144 limitations applicable to affiliates.
105
Table of Contents
Material U.S. federal income tax consequences to non-U.S. holders of our Class A common stock
The following discussion describes the material U.S. federal income tax consequences to non-U.S. holders (as defined below) of the acquisition, ownership and disposition of our Class A common stock issued pursuant to this offering. This discussion is not a complete analysis of all potential U.S. federal income tax consequences and does not address any tax consequences arising under any state, local or foreign tax laws, any income tax treaties, or any other U.S. federal tax laws, including U.S. federal estate and gift tax laws. This discussion is based on the Internal Revenue Code of 1986, as amended (the “Code”), U.S. Treasury Regulations promulgated thereunder, judicial decisions, and published rulings and administrative pronouncements of the Internal Revenue Service (the “IRS”), all as in effect on the date of this offering. These authorities may change, possibly retroactively, resulting in tax consequences different from those discussed below. No rulings have been or will be sought from the IRS with respect to the matters discussed below, and there can be no assurance that the IRS will not take a different position regarding the tax consequences of a non-U.S. holder’s acquisition, ownership or disposition of our Class A common stock or that any such position would not be sustained by a court.
This discussion is limited to non-U.S. holders who purchase our Class A common stock pursuant to this offering and who hold our Class A common stock as “capital assets” within the meaning of Code Section 1221 (generally, property held for investment). This discussion does not address all U.S. federal income tax consequences that may be relevant to a non-U.S. holder in light of the holder’s particular circumstances. It also does not consider any specific facts or circumstances that may be relevant to non-U.S. holders subject to special rules under the U.S. federal income tax laws, including, without limitation, U.S. expatriates, banks, financial institutions, insurance companies, regulated investment companies, real estate investment trusts, “controlled foreign corporations,” “passive foreign investment companies,” corporations that accumulate earnings to avoid U.S. federal income tax, brokers, dealers or traders in securities, commodities or currencies, partnerships or other pass-through entities (or investors in such entities), tax-exempt organizations, tax-qualified retirement plans, persons subject to the alternative minimum tax, and persons holding our Class A common stock as part of a straddle, hedge or other risk reduction strategy or as part of a conversion transaction or other integrated investment.
WE RECOMMEND THAT PROSPECTIVE INVESTORS CONSULT THEIR TAX ADVISORS REGARDING THE PARTICULAR U.S. FEDERAL INCOME TAX CONSEQUENCES TO THEM OF THE ACQUISITION, OWNERSHIP AND DISPOSITION OF OUR CLASS A COMMON STOCK, AS WELL AS ANY TAX CONSEQUENCES ARISING UNDER ANY STATE, LOCAL OR FOREIGN TAX LAWS, ANY APPLICABLE INCOME TAX TREATIES, OR ANY OTHER U.S. FEDERAL TAX LAWS (INCLUDING ESTATE AND GIFT TAX LAWS).
Definition of Non-U.S. Holder
As used in this discussion, a non-U.S. holder is any beneficial owner of our Class A common stock who is not treated as a partnership for U.S. federal income tax purposes and is not:
| • | an individual citizen or resident of the United States; |
| • | a corporation (or other entity treated as a corporation for U.S. federal income tax purposes) created or organized under the laws of the United States, any state thereof or the District of Columbia; |
| • | an estate, the income of which is subject to U.S. federal income tax regardless of its source; or |
| • | a trust if (i) a U.S. court is able to exercise primary supervision over its administration and one or more U.S. persons have authority to control all its substantial decisions or (ii) the trust was in existence on August 20, 1996, was treated as a U.S. person prior to that date, and validly elected to continue to be so treated. |
106
Table of Contents
If any entity treated as a partnership for U.S. federal income tax purposes holds our Class A common stock, the tax treatment of a partner generally will depend on the status of the partner and the activities of the partnership. Partnerships and their partners should consult their tax advisors as to the tax consequences to them of the acquisition, ownership and disposition of our Class A common stock.
Distributions on our Class A common stock
As described in the section entitled, “Dividend policy,” we do not anticipate paying dividends on our Class A common stock in the foreseeable future. If we do make a distribution of cash or other property with respect to our Class A common stock, the distribution generally will constitute a dividend for U.S. federal income tax purposes to the extent paid from our current or accumulated earnings and profits, as determined under U.S. federal income tax principles. Amounts not treated as dividends for U.S. federal income tax purposes will constitute a return of capital and will first be applied against and reduce a holder’s adjusted tax basis in its Class A common stock, but not below zero. Any remaining excess will be treated as capital gain from the sale of property.
Dividends paid to a non-U.S. holder of our Class A common stock that are not effectively connected to the holder’s conduct of a U.S. trade or business generally will be subject to U.S. federal withholding tax at a rate of 30% of the gross amount of the dividends, or a lower rate specified by an applicable tax treaty. To receive the benefit of a reduced treaty rate, a non-U.S. holder must furnish to us or our paying agent a valid IRS Form W-8BEN (or applicable successor form) certifying the holder’s qualification for the reduced rate. A non-U.S. holder may be required to obtain a U.S. taxpayer identification number to claim treaty benefits. This certification must be provided to us or our paying agent prior to the payment of dividends and may be required to be updated periodically. Non-U.S. holders that do not timely provide us or our paying agent with the required certification, but which qualify for a reduced treaty rate, may obtain a refund of any excess amounts withheld by timely filing an appropriate claim for refund with the IRS. Non-U.S. holders should consult their tax advisors regarding their entitlement to benefits under a relevant income tax treaty.
If a non-U.S. holder holds our Class A common stock in connection with the conduct of a trade or business in the United States, and dividends paid on the Class A common stock are effectively connected with the holder’s U.S. trade or business, the non-U.S. holder will be exempt from U.S. federal withholding tax. To claim the exemption, the non-U.S. holder must furnish to us or our paying agent a properly executed IRS Form W-8ECI (or applicable successor form) prior to the payment of the dividends. Any dividends paid on our Class A common stock that are effectively connected with a non-U.S. holder’s U.S. trade or business generally will be subject to U.S. federal income tax on a net income basis at the regular graduated U.S. federal income tax rates in the same manner as if the holder were a resident of the United States, unless the holder is entitled to the benefits of a tax treaty that provides otherwise. A non-U.S. holder that is a foreign corporation also may be subject to a branch profits tax equal to 30% (or a lower rate specified by an applicable tax treaty) of its effectively connected earnings and profits for the taxable year that are attributable to such dividends. Non-U.S. holders should consult any applicable tax treaties that may provide for different rules.
Gain on disposition of our Class A common stock
Subject to the discussions below regarding backup withholding and foreign accounts, a non-U.S. holder generally will not be subject to U.S. federal income tax on any gain realized upon the sale or other disposition of our Class A common stock unless:
| • | the gain is effectively connected with the non-U.S. holder’s conduct of a trade or business in the United States; |
| • | the non-U.S. holder is a nonresident alien individual present in the United States for 183 days or more during the taxable year of the disposition and certain other requirements are met; or |
107
Table of Contents
| • | our Class A common stock constitutes a U.S. real property interest by reason of our status as a U.S. real property holding corporation (“USRPHC”) at any time within the shorter of the five-year period preceding the disposition or the non-U.S. holder’s holding period for our Class A common stock, and certain other requirements are met. |
Unless an applicable tax treaty provides otherwise, gain described in the first bullet point above will be subject to U.S. federal income tax on a net income basis at the regular graduated U.S. federal income tax rates in the same manner as if the holder were a resident of the United States. Non-U.S. holders that are foreign corporations also may be subject to a branch profits tax equal to 30% (or a lower rate specified by an applicable tax treaty) of its effectively connected earnings and profits for the taxable year that are attributable to such gain. Non-U.S. holders should consult any applicable tax treaties that may provide for different rules.
Gain described in the second bullet point above will be subject to U.S. federal income tax at a flat 30% rate (or a lower rate specified by an applicable income tax treaty), but may be offset by U.S. source capital losses.
With respect to the third bullet point above, we believe we currently are not and will not become a USRPHC. However, because the determination of whether we are a USRPHC generally depends on whether the fair market value of our U.S. real property interests equals or exceeds 50% of the sum of the fair market value of our other trade or business assets and our worldwide real property interests, there can be no assurance that we will not become a USRPHC in the future. In the event we do become a USRPHC, as long as our Class A common stock is regularly traded on an established securities market, our Class A common stock will constitute a U.S. real property interest only with respect to a non-U.S. holder that actually or constructively holds more than five percent of our Class A common stock at some time during the shorter of the five-year period preceding the disposition or the non-U.S. holder’s holding period for our Class A common stock. Any taxable gain generally will be taxed in the same manner as gain that is effectively connected with the conduct of a U.S. trade or business, except that the branch profits tax will not apply.
Information reporting and backup withholding
We must report annually to the IRS and to each non-U.S. holder the amount of dividends on our Class A common stock paid to the holder and the amount of any tax withheld with respect to those dividends. These information reporting requirements apply even if no withholding was required because the dividends were effectively connected with the holder’s conduct of a U.S. trade or business, or withholding was reduced or eliminated by an applicable tax treaty. This information also may be made available under a specific treaty or agreement with the tax authorities in the country in which the non-U.S. holder resides or is established.
Backup withholding, currently at a rate of 28%, generally will not apply to payments of dividends to a non-U.S. holder of our Class A common stock provided the non-U.S. holder furnishes to us or our paying agent the required certification as to its non-U.S. status (typically, by providing a valid IRS Form W-8BEN or W-8ECI) or an exemption is otherwise established.
Payment of the proceeds from a non-U.S. holder’s disposition of our Class A common stock made by or through a foreign office of a broker will not be subject to information reporting or backup withholding, except that information reporting (but generally not backup withholding) may apply to those payments if the broker does not have documentary evidence that the beneficial owner is a non-U.S. holder, an exemption is not otherwise established, and the broker is:
| • | a U.S. person, as defined in the Code; |
| • | a controlled foreign corporation for U.S. federal income tax purposes; |
108
Table of Contents
| • | a foreign person 50% or more of whose gross income is effectively connected with a U.S. trade or business for a specified three-year period; or |
| • | a foreign partnership if at any time during its tax year (1) one or more of its partners are U.S. persons who hold in the aggregate more than 50% of the income or capital interest in the partnership or (2) it is engaged in the conduct of a U.S. trade or business. |
Payment of the proceeds from a non-U.S. holder’s disposition of our Class A common stock made by or through the U.S. office of a broker generally will be subject to information reporting and backup withholding unless the non-U.S. holder certifies as to its non-U.S. status (such as by providing a valid IRS Form W-8BEN or W-8ECI) or otherwise establishes an exemption from information reporting and backup withholding.
Backup withholding is not an additional tax. Taxpayers may use amounts withheld as a credit against their U.S. federal income tax liability or may claim a refund if they timely provide certain information to the IRS.
Additional withholding tax relating to foreign accounts
A 30% withholding tax will apply to dividends on, or gross proceeds from the sale or other disposition of, our Class A common stock paid to a foreign financial institution (whether holding stock for its own account or on behalf of its account holders/investors) after December 31, 2012, unless the foreign financial institution enters into an agreement with the U.S. Treasury to, among other things, undertake to identify accounts held by certain U.S. persons or U.S.-owned foreign entities, annually report certain information about such accounts, and withhold 30% on payments to account holders whose actions prevent it from complying with these reporting and other requirements. The 30% withholding tax also will apply to the same types of payments made to a foreign non-financial entity after December 31, 2012, unless the entity certifies that it does not have any substantial U.S. owners or furnishes identifying information regarding each substantial U.S. owner and satisfies certain other requirements. Prospective investors should consult their tax advisors regarding these rules.
WE RECOMMEND THAT PROSPECTIVE INVESTORS CONSULT THEIR TAX ADVISORS REGARDING THE PARTICULAR U.S. FEDERAL INCOME TAX CONSEQUENCES TO THEM OF THE PURCHASE, OWNERSHIP AND DISPOSITION OF OUR CLASS A COMMON STOCK, AS WELL AS ANY TAX CONSEQUENCES ARISING UNDER ANY STATE, LOCAL OR FOREIGN TAX LAWS, ANY APPLICABLE INCOME TAX TREATIES, OR ANY OTHER U.S. FEDERAL TAX LAWS (INCLUDING ESTATE AND GIFT TAX LAWS).
109
Table of Contents
We and the selling stockholders are offering the shares of Class A common stock described in this prospectus through a number of underwriters. J.P. Morgan Securities LLC, Merrill Lynch, Pierce, Fenner & Smith Incorporated and Morgan Stanley & Co. Incorporated are acting as joint book-running managers of the offering and as representatives of the underwriters. We and the selling stockholders have entered into an underwriting agreement with the underwriters. Subject to the terms and conditions of the underwriting agreement, we and the selling stockholders have agreed to sell to the underwriters, and each underwriter has severally agreed to purchase, at the public offering price less the underwriting discounts and commissions set forth on the cover page of this prospectus, the number of shares of Class A common stock listed next to its name in the following table:
| Name | Number of Shares |
|||
| J.P. Morgan Securities LLC |
||||
| Merrill Lynch, Pierce, Fenner &
Smith |
||||
| Morgan Stanley & Co. Incorporated |
||||
| Robert W. Baird & Co. Incorporated |
||||
| Lazard Capital Markets LLC |
||||
| Piper Jaffray & Co. |
||||
| Stifel, Nicolaus & Company, Incorporated |
||||
| Total |
||||
The underwriters are committed to purchase all of the Class A common stock offered by us if they purchase any shares. The underwriting agreement also provides that if an underwriter defaults, the purchase commitments of non-defaulting underwriters may also be increased or the offering may be terminated.
The underwriters propose to offer the Class A common stock directly to the public at the initial public offering price set forth on the cover page of this prospectus and to certain dealers at that price less a concession not in excess of $ per share. Any such dealers may resell shares to certain other brokers or dealers at a discount of up to $ per share from the initial public offering price. After the initial public offering of the shares, the offering price and other selling terms may be changed by the underwriters. Sales of shares made outside of the United States may be made by affiliates of the underwriters. The representatives have advised us that the underwriters do not intend to confirm discretionary sales in excess of 5% of the Class A common stock offered in this offering.
The underwriters have an option to purchase up to additional shares of Class A common stock from the selling stockholders to cover sales of shares by the underwriters which exceed the number of shares specified in the table above. The underwriters have 30 days from the date of this prospectus to exercise this over-allotment option. If any shares are purchased with this over-allotment option, the underwriters will purchase shares in approximately the same proportion as shown in the table above. If any additional shares of Class A common stock are purchased, the underwriters will offer the additional shares on the same terms as those on which the shares are being offered.
110
Table of Contents
The underwriting fee is equal to the public offering price per share of Class A common stock less the amount paid by the underwriters to us per share of Class A common stock. The underwriting fee is $ per share. The following table shows the per share and total underwriting discounts and commissions to be paid to the underwriters assuming both no exercise and full exercise of the underwriters’ option to purchase additional shares.
| Paid by Us | Paid by the Selling Stockholders |
|||||||||||||||
| Without over- allotment exercise |
With full over- allotment exercise |
Without over- allotment exercise |
With full over- allotment exercise |
|||||||||||||
| Per Share |
$ | $ | $ | $ | ||||||||||||
| Total |
$ | $ | $ | $ | ||||||||||||
We estimate that the total expenses of this offering, including registration, filing and listing fees, printing fees and legal and accounting expenses, but excluding the underwriting discounts and commissions, will be approximately $ .
A prospectus in electronic format may be made available on the web sites maintained by one or more underwriters, or selling group members, if any, participating in this offering. The underwriters may agree to allocate a number of shares to underwriters and selling group members for sale to their online brokerage account holders. Internet distributions will be allocated by the representatives to underwriters and selling group members that may make Internet distributions on the same basis as other allocations.
We and the selling stockholders have agreed that we will not (i) offer, pledge, announce the intention to sell, sell, contract to sell, sell any option or contract to purchase, purchase any option or contract to sell, grant any option, right or warrant to purchase or otherwise dispose of, directly or indirectly, or file with the SEC a registration statement under the Securities Act relating to, any shares of our Class A common stock or securities convertible into or exchangeable or exercisable for any shares of our Class A common stock, or publicly disclose the intention to make any offer, sale, pledge, disposition or filing, or (ii) enter into any swap or other arrangement that transfers all or a portion of the economic consequences associated with the ownership of any shares of Class A common stock or any such other securities (regardless of whether any of these transactions are to be settled by the delivery of shares of Class A common stock or such other securities, in cash or otherwise), in each case without the prior written consent of J.P. Morgan Securities LLC, Merrill Lynch, Pierce, Fenner & Smith Incorporated and Morgan Stanley & Co. Incorporated for a period of 180 days after the date of this prospectus, other than the shares of our Class A common stock to be sold hereunder and any shares of our Class A common stock issued upon the exercise of options granted under our stock incentive plans. Notwithstanding the foregoing, if (1) during the last 17 days of the 180-day restricted period, we issue an earnings release or material news or a material event relating to our company occurs; or (2) prior to the expiration of the 180-day restricted period, we announce that we will release earnings results during the 16-day period beginning on the last day of the 180-day period, the restrictions described above shall continue to apply until the expiration of the 18-day period beginning on the issuance of the earnings release or the occurrence of the material news or material event.
Our directors, executive officers, and certain of our significant stockholders have entered into or will enter into lock-up agreements with the underwriters pursuant to which each of these persons or entities, with limited exceptions, for a period of 180 days after the date of this prospectus, may not, without the prior written consent of J.P. Morgan Securities LLC, Merrill Lynch, Pierce, Fenner & Smith Incorporated and Morgan Stanley & Co. (1) offer, pledge, sell, contract to sell, sell any option or contract to purchase, purchase any option or
111
Table of Contents
contract to sell, grant any option, right or warrant to purchase, or otherwise transfer or dispose of, directly or indirectly, any shares of our Class A common stock or any securities convertible into or exercisable or exchangeable for our Class A common stock (including, without limitation, Class B common stock or such other securities which may be deemed to be beneficially owned by such directors, executive officers, and shareholders in accordance with the rules and regulations of the SEC and securities which may be issued upon exercise of a stock option or warrant) or publicly disclose the intention to make any offer, sale, pledge or disposition, (2) enter into any swap or other agreement that transfers, in whole or in part, any of the economic consequences of ownership of the Class A common stock or such other securities, whether any such transaction described in clause (1) or (2) above is to be settled by delivery of Class A common stock or such other securities, in cash or otherwise, or (3) make any demand for or exercise any right with respect to the registration of any shares of our Class A common stock or any security convertible into or exercisable or exchangeable for our Class A common stock. Our directors and executive officers have further agreed that the foregoing restrictions will apply to any shares of Class A common stock purchased by them through the directed share program described below. Notwithstanding the foregoing, if (1) during the last 17 days of the 180-day restricted period, we issue an earnings release or material news or a material event relating to our company occurs; or (2) prior to the expiration of the 180-day restricted period, we announce that we will release earnings results during the 16-day period beginning on the last day of the 180-day period, the restrictions described above shall continue to apply until the expiration of the 18-day period beginning on the issuance of the earnings release or the occurrence of the material news or material event.
We and the selling stockholders have agreed to indemnify the underwriters against certain liabilities, including liabilities under the Securities Act of 1933.
We will apply to have our Class A common stock approved for listing/quotation on the New York Stock Exchange or Nasdaq Stock Market under the symbol “SRAM.”
In connection with this offering, the underwriters may engage in stabilizing transactions, which involves making bids for, purchasing and selling shares of Class A common stock in the open market for the purpose of preventing or retarding a decline in the market price of the Class A common stock while this offering is in progress. These stabilizing transactions may include making short sales of the Class A common stock, which involves the sale by the underwriters of a greater number of shares of Class A common stock than they are required to purchase in this offering, and purchasing shares of Class A common stock on the open market to cover positions created by short sales. Short sales may be “covered” shorts, which are short positions in an amount not greater than the underwriters’ over-allotment option referred to above, or may be “naked” shorts, which are short positions in excess of that amount. The underwriters may close out any covered short position either by exercising their over-allotment option, in whole or in part, or by purchasing shares in the open market. In making this determination, the underwriters will consider, among other things, the price of shares available for purchase in the open market compared to the price at which the underwriters may purchase shares through the over-allotment option. A naked short position is more likely to be created if the underwriters are concerned that there may be downward pressure on the price of the Class A common stock in the open market that could adversely affect investors who purchase in this offering. To the extent that the underwriters create a naked short position, they will purchase shares in the open market to cover the position.
The underwriters have advised us that, pursuant to Regulation M of the Securities Act of 1933, they may also engage in other activities that stabilize, maintain or otherwise affect the price of the Class A common stock, including the imposition of penalty bids. This means that if the representatives of the underwriters purchase Class A common stock in the open market in stabilizing transactions or to cover short sales, the representatives can require the underwriters that sold those shares as part of this offering to repay the underwriting discount received by them.
112
Table of Contents
These activities may have the effect of raising or maintaining the market price of the Class A common stock or preventing or retarding a decline in the market price of the Class A common stock, and, as a result, the price of the Class A common stock may be higher than the price that otherwise might exist in the open market. If the underwriters commence these activities, they may discontinue them at any time. The underwriters may carry out these transactions on the New York Stock Exchange or Nasdaq Stock Market in the over-the-counter market or otherwise.
Prior to this offering, there has been no public market for our Class A common stock. The initial public offering price will be determined by negotiations between us and the representatives of the underwriters. In determining the initial public offering price, we and the representatives of the underwriters expect to consider a number of factors including:
| • | the information set forth in this prospectus and otherwise available to the representatives; |
| • | our prospects and the history and prospects for the industry in which we compete; |
| • | an assessment of our management; |
| • | our prospects for future earnings; |
| • | the general condition of the securities markets at the time of this offering; |
| • | the recent market prices of, and demand for, publicly traded common stock of generally comparable companies; and |
| • | other factors deemed relevant by the underwriters and us. |
Neither we nor the underwriters can assure investors that an active trading market will develop for our Class A common stock, or that the shares will trade in the public market at or above the initial public offering price.
Other than in the United States, no action has been taken by us or the underwriters that would permit a public offering of the securities offered by this prospectus in any jurisdiction where action for that purpose is required. The securities offered by this prospectus may not be offered or sold, directly or indirectly, nor may this prospectus or any other offering material or advertisements in connection with the offer and sale of any such securities be distributed or published in any jurisdiction, except under circumstances that will result in compliance with the applicable rules and regulations of that jurisdiction. Persons into whose possession this prospectus comes are advised to inform themselves about and to observe any restrictions relating to the offering and the distribution of this prospectus. This prospectus does not constitute an offer to sell or a solicitation of an offer to buy any securities offered by this prospectus in any jurisdiction in which such an offer or a solicitation is unlawful.
This document is only being distributed to and is only directed at (i) persons who are outside the United Kingdom or (ii) to investment professionals falling within Article 19(5) of the Financial Services and Markets Act 2000 (Financial Promotion) Order 2005 (the “Order”) or (iii) high net worth entities, and other persons to whom it may lawfully be communicated, falling with Article 49(2)(a) to (d) of the Order (all such persons together being referred to as “relevant persons”). The securities are only available to, and any invitation, offer or agreement to subscribe, purchase or otherwise acquire such securities will be engaged in only with, relevant persons. Any person who is not a relevant person should not act or rely on this document or any of its contents.
In relation to each Member State of the European Economic Area (the EU plus Iceland, Norway and Liechtenstein) which has implemented the Prospectus Directive (each, a ‘‘Relevant Member State’’), from and including the date on which the European Union Prospectus Directive (the ‘‘EU Prospectus Directive’’) is
113
Table of Contents
implemented in that Relevant Member State (the ‘‘Relevant Implementation Date’’) an offer of securities described in this prospectus may not be made to the public in that Relevant Member State prior to the publication of a prospectus in relation to the shares which has been approved by the competent authority in that Relevant Member State or, where appropriate, approved in another Relevant Member State and notified to the competent authority in that Relevant Member State, all in accordance with the EU Prospectus Directive, except that it may, with effect from and including the Relevant Implementation Date, make an offer of shares to the public in that Relevant Member State at any time:
| • | to legal entities which are authorized or regulated to operate in the financial markets or, if not so authorized or regulated, whose corporate purpose is solely to invest in securities; |
| • | to any legal entity which has two or more of (1) an average of at least 250 employees during the last financial year; (2) a total balance sheet of more than €43,000,000 and (3) an annual net turnover of more than €50,000,000, as shown in its last annual or consolidated accounts; |
| • | to fewer than 100 natural or legal persons (other than qualified investors as defined in the EU Prospectus Directive) subject to obtaining the prior consent of the book-running managers for any such offer; or |
| • | in any other circumstances which do not require the publication by the Issuer of a prospectus pursuant to Article 3 of the Prospectus Directive. |
For the purposes of this provision, the expression an ‘‘offer of securities to the public’’ in relation to any securities in any Relevant Member State means the communication in any form and by any means of sufficient information on the terms of the offer and the securities to be offered so as to enable an investor to decide to purchase or subscribe for the securities, as the same may be varied in that Member State by any measure implementing the EU Prospectus Directive in that Member State and the expression EU Prospectus Directive means Directive 2003/71/EC and includes any relevant implementing measure in each Relevant Member State.
Certain of the underwriters and their affiliates have provided in the past to us and our affiliates and may provide from time to time in the future certain commercial banking, financial advisory, investment banking and other services for us and such affiliates in the ordinary course of their business, for which they have received and may continue to receive customary fees and commissions. In addition, from time to time, certain of the underwriters and their affiliates may effect transactions for their own account or the account of customers, and hold on behalf of themselves or their customers, long or short positions in our debt or equity securities or loans, and may do so in the future. Affiliates of each of J.P. Morgan Securities LLC and Merrill Lynch, Pierce, Fenner & Smith Incorporated are lenders under our existing credit facilities and have received and will receive fees from us in the future. In connection with the refinancing, we will use proceeds from our new credit facilities to repay, among other things, outstanding amounts under our existing credit facilities, including all amounts outstanding to affiliates of J.P. Morgan Securities LLC and Merrill Lynch, Pierce, Fenner & Smith Incorporated. We also expect that affiliates of J.P. Morgan Securities LLC will be lenders under our new credit facilities and will receive fees from us in the future. In addition, JPM Mezzanine Capital, LLC, an affiliate of J.P. Morgan Securities, LLC, holds Class A units in SRAM Holdings, LLC that we will acquire in connection with the refinancing. See “The refinancing and reorganization.”
At our request, the underwriters have reserved up to of the shares of Class A common stock being sold in this offering for sale to certain parties at the initial public offering price through a directed share program. The number of shares available for sale to the general public in this offering will be reduced to the extent that these reserved shares are purchased by these persons. Any reserved shares not purchased by these persons will be offered by the underwriters to the general public on the same basis as the other shares in this offering. We have agreed to indemnify the underwriters against certain liabilities and expenses, including liabilities under the Securities Act, in connection with the sales of the directed shares.
114
Table of Contents
Certain legal matters with respect to the legality of the issuance of the shares of Class A common stock offered by us and the selling stockholders by this prospectus will be passed upon for us and the selling stockholders by Latham & Watkins LLP, Chicago, Illinois. The underwriters are being represented by Winston & Strawn LLP, Chicago, Illinois, in connection with this offering.
115
Table of Contents
The consolidated financial statements of SRAM Holdings, LLC as of December 31, 2009 and 2010 and for each of the three years in the period ended December 31, 2010 included in this prospectus have been so included in reliance on the report of PricewaterhouseCoopers LLP, an independent registered public accounting firm, given on the authority of said firm as experts in auditing and accounting.
116
Table of Contents
Where you can find more information
We have filed with the SEC a registration statement on Form S-1 under the Securities Act with respect to this offering of our Class A common stock. This prospectus, which constitutes a part of the registration statement, does not contain all of the information set forth in the registration statement, some items of which are contained in exhibits to the registration statement as permitted by the rules and regulations of the SEC. For further information with respect to us and our Class A common stock, we refer you to the registration statement, including the exhibits and the historical financial statements and notes filed as a part of the registration statement. Statements contained in this prospectus concerning the contents of any contract or any other document are not necessarily complete. If a contract or document has been filed as an exhibit to the registration statement, please see the copy of the contract or document that has been filed. Each statement is this prospectus relating to a contract or document filed as an exhibit is qualified in all respects by the filed exhibit. The exhibits to the registration statement should be referenced for the complete contents of these contracts and documents. You may obtain copies of this information by mail from the Public Reference Room of the SEC at 100 F Street, N.E., Washington, D.C. 20549, at prescribed rates. You may obtain information on the operation of the public reference rooms by calling the SEC at 1-800-SEC-0330. The SEC also maintains an Internet website that contains reports, proxy statements and other information about issuers, like us, that file electronically with the SEC. The address of that website is www.sec.gov.
As a result of this offering, we will become subject to the information and reporting requirements of the Securities Exchange Act and, in accordance with this law, will file periodic reports, proxy statements and other information with the SEC. These periodic reports, proxy statements and other information will be available for inspection and copying at the SEC’s public reference facilities and the website of the SEC referred to above.
117
Table of Contents
SRAM Holdings, LLC and subsidiaries
Index to historical financial statements
F-1
Table of Contents
Report of independent registered public accounting firm
To the Board of Directors and
Members of SRAM Holdings, LLC and subsidiaries
In our opinion, the accompanying consolidated balance sheets and the related consolidated statements of operations, members’ deficit and cash flows present fairly, in all material respects, the financial position of SRAM Holdings, LLC and subsidiaries at December 31, 2009 and 2010, and the results of their operations and their cash flows for each of the three years in the period ended December 31, 2010 in conformity with accounting principles generally accepted in the United States of America. These financial statements are the responsibility of the Company’s management. Our responsibility is to express an opinion on these financial statements based on our audits. We conducted our audits of these statements in accordance with the standards of the Public Company Accounting Oversight Board (United States). Those standards require that we plan and perform the audit to obtain reasonable assurance about whether the financial statements are free of material misstatement. An audit includes examining, on a test basis, evidence supporting the amounts and disclosures in the financial statements, assessing the accounting principles used and significant estimates made by management, and evaluating the overall financial statement presentation. We believe that our audits provide a reasonable basis for our opinion.
/s/ PricewaterhouseCoopers LLP
Chicago, Illinois
May 11, 2011
F-2
Table of Contents
SRAM Holdings, LLC and subsidiaries
Consolidated balance sheets
| December 31, (in thousands, except share/unit data) |
2009 | 2010 | Pro forma (Note 17) |
|||||||||
| Assets |
||||||||||||
| Cash and cash equivalents |
$ | 33,689 | $ | 19,409 | $ | 19,409 | ||||||
| Accounts receivable, net |
71,317 | 89,502 | 89,502 | |||||||||
| Inventories |
28,246 | 34,133 | 34,133 | |||||||||
| Other current assets |
6,421 | 7,280 | 7,280 | |||||||||
| Total current assets |
139,673 | 150,324 | 150,324 | |||||||||
| Property and equipment, net |
28,081 | 33,333 | 33,333 | |||||||||
| Intangible assets, net |
48,452 | 44,461 | 44,461 | |||||||||
| Goodwill |
15,606 | 15,606 | 15,606 | |||||||||
| Deferred financing charges and other assets |
6,522 | 5,551 | 5,551 | |||||||||
| Total assets |
$ | 238,334 | $ | 249,275 | $ | 249,275 | ||||||
| Liabilities and members’/stockholders’ deficit |
||||||||||||
| Current portion of long-term debt |
$ | 10,855 | $ | — | $ | — | ||||||
| Accounts payable |
54,560 | 74,275 | 74,275 | |||||||||
| Accrued personnel costs |
12,451 | 18,954 | 18,954 | |||||||||
| Accrued expenses and other current liabilities |
12,677 | 13,515 | 13,515 | |||||||||
| Accrued member units—incentive units |
2,151 | 13,315 | 13,315 | |||||||||
| Income taxes payable |
6,837 | 11,593 | 11,593 | |||||||||
| Accrued distribution |
— | — | ||||||||||
| Total current liabilities |
99,531 | 131,652 | ||||||||||
| Long-term borrowings |
290,573 | 227,103 | 227,103 | |||||||||
| Other noncurrent liabilities |
14,551 | 14,430 | 14,430 | |||||||||
| Total liabilities |
404,655 | 373,185 | ||||||||||
| Commitments and contingencies |
||||||||||||
| Members’/stockholders’ deficit |
||||||||||||
| Member units—Class A, 3,640,000 units authorized, issued, and outstanding, actual; no units issued and outstanding, proforma |
28,342 | 52,930 | — | |||||||||
| Member units—Class B, 5,460,000 units authorized, issued, and outstanding, actual; no units issued and outstanding, proforma |
— | — | — | |||||||||
| Member units—Incentive units, 337,500 and 337,500 units authorized, 259,197 and 276,697 units issued, and 253,303 and 269,767 units outstanding, 2009 and 2010, respectively; no units issued and outstanding proforma |
1,533 | 2,800 | — | |||||||||
| Accumulated deficit |
(206,444 | ) | (188,022 | ) | ||||||||
| Accumulated other comprehensive income |
10,248 | 8,382 | 8,382 | |||||||||
| Class A common stock; $0.01 par value; no shares authorized, issued and outstanding, actual; shares authorized shares issued and outstanding, pro forma |
— | — | ||||||||||
| Class B common stock; $0.01 par value; no shares authorized, issued and outstanding, actual; shares authorized shares issued and outstanding, pro forma |
— | — | ||||||||||
| Additional paid-in capital |
— | — | ||||||||||
| Total Members’/stockholders’ deficit |
(166,321 | ) | (123,910 | ) | ||||||||
| Total liabilities and members’/stockholders’ deficit |
$ | 238,334 | $ | 249,275 | $ | |||||||
The accompanying notes are an integral part of these financial statements.
F-3
Table of Contents
SRAM Holdings, LLC and subsidiaries
Consolidated statements of operations
| Year ended December 31, (in thousands, except share/unit data) |
2008 | 2009 | 2010 | Pro Forma (Note 17) |
||||||||||||
| Net sales |
$ | 478,354 | $ | 399,581 | $ | 524,187 | ||||||||||
| Cost of sales |
310,725 | 239,448 | 312,954 | |||||||||||||
| Gross profit |
167,629 | 160,133 | 211,233 | |||||||||||||
| Operating expenses |
||||||||||||||||
| General and administrative expense |
77,846 | 29,042 | 33,913 | |||||||||||||
| Sales and marketing expense |
49,480 | 27,934 | 40,579 | |||||||||||||
| Product development expense |
46,506 | 27,799 | 37,179 | |||||||||||||
| Recapitalization costs |
8,952 | — | — | |||||||||||||
| 182,784 | 84,775 | 111,671 | ||||||||||||||
| Income (loss) from operations |
(15,155 | ) | 75,358 | 99,562 | ||||||||||||
| Other income (expense) |
||||||||||||||||
| Interest expense, net |
(21,703 | ) | (36,245 | ) | (32,634 | ) | ||||||||||
| Foreign currency exchange gain (loss) |
4,072 | (3,221 | ) | 237 | ||||||||||||
| Other expense, net |
(17,631 | ) | (39,466 | ) | (32,397 | ) | ||||||||||
| Income (loss) before income taxes |
(32,786 | ) | 35,892 | 67,165 | ||||||||||||
| Income tax expense |
15,838 | 14,373 | 17,193 | |||||||||||||
| Net income (loss) |
$ | (48,624 | ) | $ | 21,519 | $ | 49,972 | |||||||||
| Class A preferred return |
$ | 5,870 | $ | 24,985 | $ | 27,578 | ||||||||||
| Tax distributions to members |
— | 2,762 | 6,962 | |||||||||||||
| Net Income (loss) attributable to members, after Class A preferred return and tax distributions to Class A and Class B members |
$ | (54,494 | ) | $ | (6,228 | ) | $ | 15,432 | ||||||||
| Class B members |
||||||||||||||||
| Net income (loss) attributable to Class B members |
$ | (54,494 | ) | $ | (5,979 | ) | $ | 13,231 | ||||||||
| Weighted average units outstanding—basic and diluted |
5,460,000 | 5,460,000 | 5,460,000 | |||||||||||||
| Earnings (loss) per unit-basic and diluted |
$ | (9.98 | ) | $ | (1.10 | ) | $ | 2.42 | ||||||||
| Unaudited proforma earnings per common share (Note 17) |
||||||||||||||||
| Net income, as reported |
$ | 49,972 | ||||||||||||||
| Pro forma tax provision |
||||||||||||||||
| Pro forma net income |
$ | |||||||||||||||
| Class A member preferred return |
$ |
27,578 |
| |||||||||||||
| Tax distributions to Class A and Class B members |
6,962 | |||||||||||||||
| Pro forma net income attributable to Class A and Class B common stock after Class A member preferred return and tax distributions to members |
$ | |||||||||||||||
| Weighted average common shares outstanding—basic and diluted |
||||||||||||||||
| Earnings per common share—basic and diluted |
$ | |||||||||||||||
The accompanying notes are an integral part of these financial statements.
F-4
Table of Contents
SRAM Holdings, LLC and subsidiaries
Consolidated statements of members’ deficit
| Year ended December 31, | Common Stock | Additional Capital |
Member Units - Class A |
Member Units - Class B |
Member Units - Incentive Units |
Retained (Deficit) |
Accumulated Income |
Total (Deficit) |
||||||||||||||||||||||||||||||||||||||||
| (in thousands, except share/unit data) | Shares | Amount | Units | Amount | Units | Amount | Units | Amount | ||||||||||||||||||||||||||||||||||||||||
| Balance at December 31, 2007 |
6,681 | $ | 2,639 | $ | — | — | $ | — | — | $ | — | — | $ | — | $ | 6,258 | $ | 11,328 | $ | 20,225 | ||||||||||||||||||||||||||||
| Stock option exercise |
710 | 12,206 | 61,550 | — | — | — | — | — | — | — | — | 73,756 | ||||||||||||||||||||||||||||||||||||
| Reorganization to LLC |
(7,391 | ) | (14,845 | ) | (61,550 | ) | 3,640,000 | 30,558 | 5,460,000 | 45,837 | — | — | — | — | — | |||||||||||||||||||||||||||||||||
| Contributions from Class B member |
— | — | — | — | — | — | 10,000 | — | — | — | — | 10,000 | ||||||||||||||||||||||||||||||||||||
| Dividends to Class B member |
— | — | — | — | (30,558 | ) | — | (55,837 | ) | — | — | (154,493 | ) | — | (240,888 | ) | ||||||||||||||||||||||||||||||||
| Preferred Dividends |
— | — | — | — | 5,870 | — | — | — | — | (5,870 | ) | — | — | |||||||||||||||||||||||||||||||||||
| Comprehensive income |
||||||||||||||||||||||||||||||||||||||||||||||||
| Net loss |
— | — | — | — | — | — | — | — | — | (48,624 | ) | — | (48,624 | ) | ||||||||||||||||||||||||||||||||||
| Currency translation adjustment and other |
— | — | — | — | — | — | — | — | — | — | (4,030 | ) | (4,030 | ) | ||||||||||||||||||||||||||||||||||
| Total comprehensive loss |
(52,654 | ) | ||||||||||||||||||||||||||||||||||||||||||||||
| Balance at December 31, 2008 |
— | — | — | 3,640,000 | 5,870 | 5,460,000 | — | — | — | (202,729 | ) | 7,298 | (189,561 | ) | ||||||||||||||||||||||||||||||||||
| Incentive units compensation expense |
— | — | — | — | — | — | — | 49,831 | 1,533 | — | — | 1,533 | ||||||||||||||||||||||||||||||||||||
| Preferred dividends |
— | — | — | — | 24,985 | — | — | — | — | (24,985 | ) | — | — | |||||||||||||||||||||||||||||||||||
| Other dividends |
— | — | — | — | (2,513 | ) | — | — | — | — | (249 | ) | — | (2,762 | ) | |||||||||||||||||||||||||||||||||
| Comprehensive income |
||||||||||||||||||||||||||||||||||||||||||||||||
| Net income |
— | — | — | — | — | — | — | — | — | 21,519 | — | 21,519 | ||||||||||||||||||||||||||||||||||||
| Currency translation adjustment and other |
— | — | — | — | — | — | — | — | — | — | 2,950 | 2,950 | ||||||||||||||||||||||||||||||||||||
| Total comprehensive income |
24,469 | |||||||||||||||||||||||||||||||||||||||||||||||
| Balance at December 31, 2009 |
— | — | — | 3,640,000 | 28,342 | 5,460,000 | — | 49,831 | 1,533 | (206,444 | ) | 10,248 | (166,321 | ) | ||||||||||||||||||||||||||||||||||
| Incentive units compensation expense |
— | — | — | — | — | — | — | 50,609 | 1,267 | — | — | 1,267 | ||||||||||||||||||||||||||||||||||||
| Preferred Dividends |
— | — | — | — | 27,578 | — | — | — | — | (27,578 | ) | — | — | |||||||||||||||||||||||||||||||||||
| Other dividends |
— | — | — | — | (2,990 | ) | — | — | — | — | (3,972 | ) | — | (6,962 | ) | |||||||||||||||||||||||||||||||||
| Comprehensive income |
||||||||||||||||||||||||||||||||||||||||||||||||
| Net income |
— | — | — | — | — | — | — | — | — | 49,972 | — | 49,972 | ||||||||||||||||||||||||||||||||||||
| Currency translation adjustment and other |
— | — | — | — | — | — | — | — | — | — | (1,866 | ) | (1,866 | ) | ||||||||||||||||||||||||||||||||||
| Total comprehensive income |
48,106 | |||||||||||||||||||||||||||||||||||||||||||||||
| Balance at December 31, 2010 |
— | $ | — | $ | — | 3,640,000 | $ | 52,930 | 5,460,000 | $ | — | 100,440 | $ | 2,800 | $ | (188,022 | ) | $ | 8,382 | $ | (123,910 | ) | ||||||||||||||||||||||||||
The accompanying notes are an integral part of these financial statements.
F-5
Table of Contents
SRAM Holdings, LLC and subsidiaries
Consolidated statements of cash flows
| Year ended December 31, (in thousands) |
2008 | 2009 | 2010 | ||||||||||||||||||||||||||||||||||||||||||||||||||||||||||||||||||||||||||||||||||||||||||||||||||||||||||||||||||||||||||||||||||||||||||||||||||||||||||||||||||||||||||||||||||||||||||||||||||||||||||||||||||||||||||||||||||||||||||||||||||||||||||||||||||||||||||||||||||||||||||||||||||||||||||||||||||||||||||||||||||||||||||||||||||||||||||||||||||||||||||||||||||||||||||||||||||||||||||||||||||||||||||||||||||||||||||||||||||||||||||||||||||||||||||||||||||||||||||||||||||||||||||||||||||||||||||||||||||||||||||||||||||||||||||||||||||||||||||||||||||||||||||||||||||||||||||||||||||||||||||||||||||||||||||||||||||||||||||||||||||||||||||||||||||||||||||||||||||||||||||||||||||||||||||||||||||||||||||||||||||||||||||||||||||||||||||||||||||||||||||||||||||||||||||||||||||||||||||||||||||||||||||||||||||||||||||||||||||||||||||||||||||||||||||||||||||||||||||||||||||||||||||||||||||||||||||||||||||||||||||||||||||||||||||||||||||||||||||||||||||||||||||||||||||||||||||||||||||||
| Cash flows from operating activities |
|||||||||||||||||||||||||||||||||||||||||||||||||||||||||||||||||||||||||||||||||||||||||||||||||||||||||||||||||||||||||||||||||||||||||||||||||||||||||||||||||||||||||||||||||||||||||||||||||||||||||||||||||||||||||||||||||||||||||||||||||||||||||||||||||||||||||||||||||||||||||||||||||||||||||||||||||||||||||||||||||||||||||||||||||||||||||||||||||||||||||||||||||||||||||||||||||||||||||||||||||||||||||||||||||||||||||||||||||||||||||||||||||||||||||||||||||||||||||||||||||||||||||||||||||||||||||||||||||||||||||||||||||||||||||||||||||||||||||||||||||||||||||||||||||||||||||||||||||||||||||||||||||||||||||||||||||||||||||||||||||||||||||||||||||||||||||||||||||||||||||||||||||||||||||||||||||||||||||||||||||||||||||||||||||||||||||||||||||||||||||||||||||||||||||||||||||||||||||||||||||||||||||||||||||||||||||||||||||||||||||||||||||||||||||||||||||||||||||||||||||||||||||||||||||||||||||||||||||||||||||||||||||||||||||||||||||||||||||||||||||||||||||||||||||||||||||||||||||||||||
| Net income (loss) |
$ | (48,624 | ) | $ | 21,519 | $ | 49,972 | ||||||||||||||||||||||||||||||||||||||||||||||||||||||||||||||||||||||||||||||||||||||||||||||||||||||||||||||||||||||||||||||||||||||||||||||||||||||||||||||||||||||||||||||||||||||||||||||||||||||||||||||||||||||||||||||||||||||||||||||||||||||||||||||||||||||||||||||||||||||||||||||||||||||||||||||||||||||||||||||||||||||||||||||||||||||||||||||||||||||||||||||||||||||||||||||||||||||||||||||||||||||||||||||||||||||||||||||||||||||||||||||||||||||||||||||||||||||||||||||||||||||||||||||||||||||||||||||||||||||||||||||||||||||||||||||||||||||||||||||||||||||||||||||||||||||||||||||||||||||||||||||||||||||||||||||||||||||||||||||||||||||||||||||||||||||||||||||||||||||||||||||||||||||||||||||||||||||||||||||||||||||||||||||||||||||||||||||||||||||||||||||||||||||||||||||||||||||||||||||||||||||||||||||||||||||||||||||||||||||||||||||||||||||||||||||||||||||||||||||||||||||||||||||||||||||||||||||||||||||||||||||||||||||||||||||||||||||||||||||||||||||||||||||||||||||||||||||||
| Adjustments to reconcile net income (loss) to net cash provided by operating activities |
|||||||||||||||||||||||||||||||||||||||||||||||||||||||||||||||||||||||||||||||||||||||||||||||||||||||||||||||||||||||||||||||||||||||||||||||||||||||||||||||||||||||||||||||||||||||||||||||||||||||||||||||||||||||||||||||||||||||||||||||||||||||||||||||||||||||||||||||||||||||||||||||||||||||||||||||||||||||||||||||||||||||||||||||||||||||||||||||||||||||||||||||||||||||||||||||||||||||||||||||||||||||||||||||||||||||||||||||||||||||||||||||||||||||||||||||||||||||||||||||||||||||||||||||||||||||||||||||||||||||||||||||||||||||||||||||||||||||||||||||||||||||||||||||||||||||||||||||||||||||||||||||||||||||||||||||||||||||||||||||||||||||||||||||||||||||||||||||||||||||||||||||||||||||||||||||||||||||||||||||||||||||||||||||||||||||||||||||||||||||||||||||||||||||||||||||||||||||||||||||||||||||||||||||||||||||||||||||||||||||||||||||||||||||||||||||||||||||||||||||||||||||||||||||||||||||||||||||||||||||||||||||||||||||||||||||||||||||||||||||||||||||||||||||||||||||||||||||||||||||
| Depreciation and amortization |
15,799 | 15,172 | 15,463 | ||||||||||||||||||||||||||||||||||||||||||||||||||||||||||||||||||||||||||||||||||||||||||||||||||||||||||||||||||||||||||||||||||||||||||||||||||||||||||||||||||||||||||||||||||||||||||||||||||||||||||||||||||||||||||||||||||||||||||||||||||||||||||||||||||||||||||||||||||||||||||||||||||||||||||||||||||||||||||||||||||||||||||||||||||||||||||||||||||||||||||||||||||||||||||||||||||||||||||||||||||||||||||||||||||||||||||||||||||||||||||||||||||||||||||||||||||||||||||||||||||||||||||||||||||||||||||||||||||||||||||||||||||||||||||||||||||||||||||||||||||||||||||||||||||||||||||||||||||||||||||||||||||||||||||||||||||||||||||||||||||||||||||||||||||||||||||||||||||||||||||||||||||||||||||||||||||||||||||||||||||||||||||||||||||||||||||||||||||||||||||||||||||||||||||||||||||||||||||||||||||||||||||||||||||||||||||||||||||||||||||||||||||||||||||||||||||||||||||||||||||||||||||||||||||||||||||||||||||||||||||||||||||||||||||||||||||||||||||||||||||||||||||||||||||||||||||||||||||||
| Unrealized exchange (gain) loss |
(2,122 | ) | 363 | (937 | ) | ||||||||||||||||||||||||||||||||||||||||||||||||||||||||||||||||||||||||||||||||||||||||||||||||||||||||||||||||||||||||||||||||||||||||||||||||||||||||||||||||||||||||||||||||||||||||||||||||||||||||||||||||||||||||||||||||||||||||||||||||||||||||||||||||||||||||||||||||||||||||||||||||||||||||||||||||||||||||||||||||||||||||||||||||||||||||||||||||||||||||||||||||||||||||||||||||||||||||||||||||||||||||||||||||||||||||||||||||||||||||||||||||||||||||||||||||||||||||||||||||||||||||||||||||||||||||||||||||||||||||||||||||||||||||||||||||||||||||||||||||||||||||||||||||||||||||||||||||||||||||||||||||||||||||||||||||||||||||||||||||||||||||||||||||||||||||||||||||||||||||||||||||||||||||||||||||||||||||||||||||||||||||||||||||||||||||||||||||||||||||||||||||||||||||||||||||||||||||||||||||||||||||||||||||||||||||||||||||||||||||||||||||||||||||||||||||||||||||||||||||||||||||||||||||||||||||||||||||||||||||||||||||||||||||||||||||||||||||||||||||||||||||||||||||||||||||||||||||||
| (Gain) loss on sales of property and equipment |
(28 | ) | 102 | 1,175 | |||||||||||||||||||||||||||||||||||||||||||||||||||||||||||||||||||||||||||||||||||||||||||||||||||||||||||||||||||||||||||||||||||||||||||||||||||||||||||||||||||||||||||||||||||||||||||||||||||||||||||||||||||||||||||||||||||||||||||||||||||||||||||||||||||||||||||||||||||||||||||||||||||||||||||||||||||||||||||||||||||||||||||||||||||||||||||||||||||||||||||||||||||||||||||||||||||||||||||||||||||||||||||||||||||||||||||||||||||||||||||||||||||||||||||||||||||||||||||||||||||||||||||||||||||||||||||||||||||||||||||||||||||||||||||||||||||||||||||||||||||||||||||||||||||||||||||||||||||||||||||||||||||||||||||||||||||||||||||||||||||||||||||||||||||||||||||||||||||||||||||||||||||||||||||||||||||||||||||||||||||||||||||||||||||||||||||||||||||||||||||||||||||||||||||||||||||||||||||||||||||||||||||||||||||||||||||||||||||||||||||||||||||||||||||||||||||||||||||||||||||||||||||||||||||||||||||||||||||||||||||||||||||||||||||||||||||||||||||||||||||||||||||||||||||||||||||||||||||
| Stock option compensation expense |
61,550 | — | — | ||||||||||||||||||||||||||||||||||||||||||||||||||||||||||||||||||||||||||||||||||||||||||||||||||||||||||||||||||||||||||||||||||||||||||||||||||||||||||||||||||||||||||||||||||||||||||||||||||||||||||||||||||||||||||||||||||||||||||||||||||||||||||||||||||||||||||||||||||||||||||||||||||||||||||||||||||||||||||||||||||||||||||||||||||||||||||||||||||||||||||||||||||||||||||||||||||||||||||||||||||||||||||||||||||||||||||||||||||||||||||||||||||||||||||||||||||||||||||||||||||||||||||||||||||||||||||||||||||||||||||||||||||||||||||||||||||||||||||||||||||||||||||||||||||||||||||||||||||||||||||||||||||||||||||||||||||||||||||||||||||||||||||||||||||||||||||||||||||||||||||||||||||||||||||||||||||||||||||||||||||||||||||||||||||||||||||||||||||||||||||||||||||||||||||||||||||||||||||||||||||||||||||||||||||||||||||||||||||||||||||||||||||||||||||||||||||||||||||||||||||||||||||||||||||||||||||||||||||||||||||||||||||||||||||||||||||||||||||||||||||||||||||||||||||||||||||||||||||||
| Incentive unit compensation expense |
— | 3,684 | 12,430 | ||||||||||||||||||||||||||||||||||||||||||||||||||||||||||||||||||||||||||||||||||||||||||||||||||||||||||||||||||||||||||||||||||||||||||||||||||||||||||||||||||||||||||||||||||||||||||||||||||||||||||||||||||||||||||||||||||||||||||||||||||||||||||||||||||||||||||||||||||||||||||||||||||||||||||||||||||||||||||||||||||||||||||||||||||||||||||||||||||||||||||||||||||||||||||||||||||||||||||||||||||||||||||||||||||||||||||||||||||||||||||||||||||||||||||||||||||||||||||||||||||||||||||||||||||||||||||||||||||||||||||||||||||||||||||||||||||||||||||||||||||||||||||||||||||||||||||||||||||||||||||||||||||||||||||||||||||||||||||||||||||||||||||||||||||||||||||||||||||||||||||||||||||||||||||||||||||||||||||||||||||||||||||||||||||||||||||||||||||||||||||||||||||||||||||||||||||||||||||||||||||||||||||||||||||||||||||||||||||||||||||||||||||||||||||||||||||||||||||||||||||||||||||||||||||||||||||||||||||||||||||||||||||||||||||||||||||||||||||||||||||||||||||||||||||||||||||||||||||||
| Deferred income taxes |
305 | (614 | ) | 530 | |||||||||||||||||||||||||||||||||||||||||||||||||||||||||||||||||||||||||||||||||||||||||||||||||||||||||||||||||||||||||||||||||||||||||||||||||||||||||||||||||||||||||||||||||||||||||||||||||||||||||||||||||||||||||||||||||||||||||||||||||||||||||||||||||||||||||||||||||||||||||||||||||||||||||||||||||||||||||||||||||||||||||||||||||||||||||||||||||||||||||||||||||||||||||||||||||||||||||||||||||||||||||||||||||||||||||||||||||||||||||||||||||||||||||||||||||||||||||||||||||||||||||||||||||||||||||||||||||||||||||||||||||||||||||||||||||||||||||||||||||||||||||||||||||||||||||||||||||||||||||||||||||||||||||||||||||||||||||||||||||||||||||||||||||||||||||||||||||||||||||||||||||||||||||||||||||||||||||||||||||||||||||||||||||||||||||||||||||||||||||||||||||||||||||||||||||||||||||||||||||||||||||||||||||||||||||||||||||||||||||||||||||||||||||||||||||||||||||||||||||||||||||||||||||||||||||||||||||||||||||||||||||||||||||||||||||||||||||||||||||||||||||||||||||||||||||||||||||||
| Unrealized (gain) loss on interest rate swap |
3,454 | (640 | ) | (1,005 | ) | ||||||||||||||||||||||||||||||||||||||||||||||||||||||||||||||||||||||||||||||||||||||||||||||||||||||||||||||||||||||||||||||||||||||||||||||||||||||||||||||||||||||||||||||||||||||||||||||||||||||||||||||||||||||||||||||||||||||||||||||||||||||||||||||||||||||||||||||||||||||||||||||||||||||||||||||||||||||||||||||||||||||||||||||||||||||||||||||||||||||||||||||||||||||||||||||||||||||||||||||||||||||||||||||||||||||||||||||||||||||||||||||||||||||||||||||||||||||||||||||||||||||||||||||||||||||||||||||||||||||||||||||||||||||||||||||||||||||||||||||||||||||||||||||||||||||||||||||||||||||||||||||||||||||||||||||||||||||||||||||||||||||||||||||||||||||||||||||||||||||||||||||||||||||||||||||||||||||||||||||||||||||||||||||||||||||||||||||||||||||||||||||||||||||||||||||||||||||||||||||||||||||||||||||||||||||||||||||||||||||||||||||||||||||||||||||||||||||||||||||||||||||||||||||||||||||||||||||||||||||||||||||||||||||||||||||||||||||||||||||||||||||||||||||||||||||||||||||||||
| Amortization and write-off of deferred financing fees |
1,471 | 2,883 | 7,821 | ||||||||||||||||||||||||||||||||||||||||||||||||||||||||||||||||||||||||||||||||||||||||||||||||||||||||||||||||||||||||||||||||||||||||||||||||||||||||||||||||||||||||||||||||||||||||||||||||||||||||||||||||||||||||||||||||||||||||||||||||||||||||||||||||||||||||||||||||||||||||||||||||||||||||||||||||||||||||||||||||||||||||||||||||||||||||||||||||||||||||||||||||||||||||||||||||||||||||||||||||||||||||||||||||||||||||||||||||||||||||||||||||||||||||||||||||||||||||||||||||||||||||||||||||||||||||||||||||||||||||||||||||||||||||||||||||||||||||||||||||||||||||||||||||||||||||||||||||||||||||||||||||||||||||||||||||||||||||||||||||||||||||||||||||||||||||||||||||||||||||||||||||||||||||||||||||||||||||||||||||||||||||||||||||||||||||||||||||||||||||||||||||||||||||||||||||||||||||||||||||||||||||||||||||||||||||||||||||||||||||||||||||||||||||||||||||||||||||||||||||||||||||||||||||||||||||||||||||||||||||||||||||||||||||||||||||||||||||||||||||||||||||||||||||||||||||||||||||||||
| Paid in kind interest expense |
550 | 2,228 | — | ||||||||||||||||||||||||||||||||||||||||||||||||||||||||||||||||||||||||||||||||||||||||||||||||||||||||||||||||||||||||||||||||||||||||||||||||||||||||||||||||||||||||||||||||||||||||||||||||||||||||||||||||||||||||||||||||||||||||||||||||||||||||||||||||||||||||||||||||||||||||||||||||||||||||||||||||||||||||||||||||||||||||||||||||||||||||||||||||||||||||||||||||||||||||||||||||||||||||||||||||||||||||||||||||||||||||||||||||||||||||||||||||||||||||||||||||||||||||||||||||||||||||||||||||||||||||||||||||||||||||||||||||||||||||||||||||||||||||||||||||||||||||||||||||||||||||||||||||||||||||||||||||||||||||||||||||||||||||||||||||||||||||||||||||||||||||||||||||||||||||||||||||||||||||||||||||||||||||||||||||||||||||||||||||||||||||||||||||||||||||||||||||||||||||||||||||||||||||||||||||||||||||||||||||||||||||||||||||||||||||||||||||||||||||||||||||||||||||||||||||||||||||||||||||||||||||||||||||||||||||||||||||||||||||||||||||||||||||||||||||||||||||||||||||||||||||||||||||||||
| Increase (decrease) in cash from changes in operating assets and liabilities, net of acquisitions |
|||||||||||||||||||||||||||||||||||||||||||||||||||||||||||||||||||||||||||||||||||||||||||||||||||||||||||||||||||||||||||||||||||||||||||||||||||||||||||||||||||||||||||||||||||||||||||||||||||||||||||||||||||||||||||||||||||||||||||||||||||||||||||||||||||||||||||||||||||||||||||||||||||||||||||||||||||||||||||||||||||||||||||||||||||||||||||||||||||||||||||||||||||||||||||||||||||||||||||||||||||||||||||||||||||||||||||||||||||||||||||||||||||||||||||||||||||||||||||||||||||||||||||||||||||||||||||||||||||||||||||||||||||||||||||||||||||||||||||||||||||||||||||||||||||||||||||||||||||||||||||||||||||||||||||||||||||||||||||||||||||||||||||||||||||||||||||||||||||||||||||||||||||||||||||||||||||||||||||||||||||||||||||||||||||||||||||||||||||||||||||||||||||||||||||||||||||||||||||||||||||||||||||||||||||||||||||||||||||||||||||||||||||||||||||||||||||||||||||||||||||||||||||||||||||||||||||||||||||||||||||||||||||||||||||||||||||||||||||||||||||||||||||||||||||||||||||||||||||||||
| Accounts receivable, net |
(1,669 | ) | 6,457 | (17,396 | ) | ||||||||||||||||||||||||||||||||||||||||||||||||||||||||||||||||||||||||||||||||||||||||||||||||||||||||||||||||||||||||||||||||||||||||||||||||||||||||||||||||||||||||||||||||||||||||||||||||||||||||||||||||||||||||||||||||||||||||||||||||||||||||||||||||||||||||||||||||||||||||||||||||||||||||||||||||||||||||||||||||||||||||||||||||||||||||||||||||||||||||||||||||||||||||||||||||||||||||||||||||||||||||||||||||||||||||||||||||||||||||||||||||||||||||||||||||||||||||||||||||||||||||||||||||||||||||||||||||||||||||||||||||||||||||||||||||||||||||||||||||||||||||||||||||||||||||||||||||||||||||||||||||||||||||||||||||||||||||||||||||||||||||||||||||||||||||||||||||||||||||||||||||||||||||||||||||||||||||||||||||||||||||||||||||||||||||||||||||||||||||||||||||||||||||||||||||||||||||||||||||||||||||||||||||||||||||||||||||||||||||||||||||||||||||||||||||||||||||||||||||||||||||||||||||||||||||||||||||||||||||||||||||||||||||||||||||||||||||||||||||||||||||||||||||||||||||||||||||||
| Inventories |
(4,626 | ) | 8,624 | (5,166 | ) | ||||||||||||||||||||||||||||||||||||||||||||||||||||||||||||||||||||||||||||||||||||||||||||||||||||||||||||||||||||||||||||||||||||||||||||||||||||||||||||||||||||||||||||||||||||||||||||||||||||||||||||||||||||||||||||||||||||||||||||||||||||||||||||||||||||||||||||||||||||||||||||||||||||||||||||||||||||||||||||||||||||||||||||||||||||||||||||||||||||||||||||||||||||||||||||||||||||||||||||||||||||||||||||||||||||||||||||||||||||||||||||||||||||||||||||||||||||||||||||||||||||||||||||||||||||||||||||||||||||||||||||||||||||||||||||||||||||||||||||||||||||||||||||||||||||||||||||||||||||||||||||||||||||||||||||||||||||||||||||||||||||||||||||||||||||||||||||||||||||||||||||||||||||||||||||||||||||||||||||||||||||||||||||||||||||||||||||||||||||||||||||||||||||||||||||||||||||||||||||||||||||||||||||||||||||||||||||||||||||||||||||||||||||||||||||||||||||||||||||||||||||||||||||||||||||||||||||||||||||||||||||||||||||||||||||||||||||||||||||||||||||||||||||||||||||||||||||||||||
| Other current assets |
501 | 418 | (1,015 | ) | |||||||||||||||||||||||||||||||||||||||||||||||||||||||||||||||||||||||||||||||||||||||||||||||||||||||||||||||||||||||||||||||||||||||||||||||||||||||||||||||||||||||||||||||||||||||||||||||||||||||||||||||||||||||||||||||||||||||||||||||||||||||||||||||||||||||||||||||||||||||||||||||||||||||||||||||||||||||||||||||||||||||||||||||||||||||||||||||||||||||||||||||||||||||||||||||||||||||||||||||||||||||||||||||||||||||||||||||||||||||||||||||||||||||||||||||||||||||||||||||||||||||||||||||||||||||||||||||||||||||||||||||||||||||||||||||||||||||||||||||||||||||||||||||||||||||||||||||||||||||||||||||||||||||||||||||||||||||||||||||||||||||||||||||||||||||||||||||||||||||||||||||||||||||||||||||||||||||||||||||||||||||||||||||||||||||||||||||||||||||||||||||||||||||||||||||||||||||||||||||||||||||||||||||||||||||||||||||||||||||||||||||||||||||||||||||||||||||||||||||||||||||||||||||||||||||||||||||||||||||||||||||||||||||||||||||||||||||||||||||||||||||||||||||||||||||||||||||||||
| Other assets |
(35 | ) | 45 | (62 | ) | ||||||||||||||||||||||||||||||||||||||||||||||||||||||||||||||||||||||||||||||||||||||||||||||||||||||||||||||||||||||||||||||||||||||||||||||||||||||||||||||||||||||||||||||||||||||||||||||||||||||||||||||||||||||||||||||||||||||||||||||||||||||||||||||||||||||||||||||||||||||||||||||||||||||||||||||||||||||||||||||||||||||||||||||||||||||||||||||||||||||||||||||||||||||||||||||||||||||||||||||||||||||||||||||||||||||||||||||||||||||||||||||||||||||||||||||||||||||||||||||||||||||||||||||||||||||||||||||||||||||||||||||||||||||||||||||||||||||||||||||||||||||||||||||||||||||||||||||||||||||||||||||||||||||||||||||||||||||||||||||||||||||||||||||||||||||||||||||||||||||||||||||||||||||||||||||||||||||||||||||||||||||||||||||||||||||||||||||||||||||||||||||||||||||||||||||||||||||||||||||||||||||||||||||||||||||||||||||||||||||||||||||||||||||||||||||||||||||||||||||||||||||||||||||||||||||||||||||||||||||||||||||||||||||||||||||||||||||||||||||||||||||||||||||||||||||||||||||||||
| Accounts payable |
(9,167 | ) | (1,807 | ) | 14,975 | ||||||||||||||||||||||||||||||||||||||||||||||||||||||||||||||||||||||||||||||||||||||||||||||||||||||||||||||||||||||||||||||||||||||||||||||||||||||||||||||||||||||||||||||||||||||||||||||||||||||||||||||||||||||||||||||||||||||||||||||||||||||||||||||||||||||||||||||||||||||||||||||||||||||||||||||||||||||||||||||||||||||||||||||||||||||||||||||||||||||||||||||||||||||||||||||||||||||||||||||||||||||||||||||||||||||||||||||||||||||||||||||||||||||||||||||||||||||||||||||||||||||||||||||||||||||||||||||||||||||||||||||||||||||||||||||||||||||||||||||||||||||||||||||||||||||||||||||||||||||||||||||||||||||||||||||||||||||||||||||||||||||||||||||||||||||||||||||||||||||||||||||||||||||||||||||||||||||||||||||||||||||||||||||||||||||||||||||||||||||||||||||||||||||||||||||||||||||||||||||||||||||||||||||||||||||||||||||||||||||||||||||||||||||||||||||||||||||||||||||||||||||||||||||||||||||||||||||||||||||||||||||||||||||||||||||||||||||||||||||||||||||||||||||||||||||||||||||||||
| Accrued personnel costs |
297 | (731 | ) | 6,062 | |||||||||||||||||||||||||||||||||||||||||||||||||||||||||||||||||||||||||||||||||||||||||||||||||||||||||||||||||||||||||||||||||||||||||||||||||||||||||||||||||||||||||||||||||||||||||||||||||||||||||||||||||||||||||||||||||||||||||||||||||||||||||||||||||||||||||||||||||||||||||||||||||||||||||||||||||||||||||||||||||||||||||||||||||||||||||||||||||||||||||||||||||||||||||||||||||||||||||||||||||||||||||||||||||||||||||||||||||||||||||||||||||||||||||||||||||||||||||||||||||||||||||||||||||||||||||||||||||||||||||||||||||||||||||||||||||||||||||||||||||||||||||||||||||||||||||||||||||||||||||||||||||||||||||||||||||||||||||||||||||||||||||||||||||||||||||||||||||||||||||||||||||||||||||||||||||||||||||||||||||||||||||||||||||||||||||||||||||||||||||||||||||||||||||||||||||||||||||||||||||||||||||||||||||||||||||||||||||||||||||||||||||||||||||||||||||||||||||||||||||||||||||||||||||||||||||||||||||||||||||||||||||||||||||||||||||||||||||||||||||||||||||||||||||||||||||||||||||||
| Accrued expenses and other current liabilities |
615 | 1,383 | 343 | ||||||||||||||||||||||||||||||||||||||||||||||||||||||||||||||||||||||||||||||||||||||||||||||||||||||||||||||||||||||||||||||||||||||||||||||||||||||||||||||||||||||||||||||||||||||||||||||||||||||||||||||||||||||||||||||||||||||||||||||||||||||||||||||||||||||||||||||||||||||||||||||||||||||||||||||||||||||||||||||||||||||||||||||||||||||||||||||||||||||||||||||||||||||||||||||||||||||||||||||||||||||||||||||||||||||||||||||||||||||||||||||||||||||||||||||||||||||||||||||||||||||||||||||||||||||||||||||||||||||||||||||||||||||||||||||||||||||||||||||||||||||||||||||||||||||||||||||||||||||||||||||||||||||||||||||||||||||||||||||||||||||||||||||||||||||||||||||||||||||||||||||||||||||||||||||||||||||||||||||||||||||||||||||||||||||||||||||||||||||||||||||||||||||||||||||||||||||||||||||||||||||||||||||||||||||||||||||||||||||||||||||||||||||||||||||||||||||||||||||||||||||||||||||||||||||||||||||||||||||||||||||||||||||||||||||||||||||||||||||||||||||||||||||||||||||||||||||||||||
| Income taxes payable |
993 | (216 | ) | 3,916 | |||||||||||||||||||||||||||||||||||||||||||||||||||||||||||||||||||||||||||||||||||||||||||||||||||||||||||||||||||||||||||||||||||||||||||||||||||||||||||||||||||||||||||||||||||||||||||||||||||||||||||||||||||||||||||||||||||||||||||||||||||||||||||||||||||||||||||||||||||||||||||||||||||||||||||||||||||||||||||||||||||||||||||||||||||||||||||||||||||||||||||||||||||||||||||||||||||||||||||||||||||||||||||||||||||||||||||||||||||||||||||||||||||||||||||||||||||||||||||||||||||||||||||||||||||||||||||||||||||||||||||||||||||||||||||||||||||||||||||||||||||||||||||||||||||||||||||||||||||||||||||||||||||||||||||||||||||||||||||||||||||||||||||||||||||||||||||||||||||||||||||||||||||||||||||||||||||||||||||||||||||||||||||||||||||||||||||||||||||||||||||||||||||||||||||||||||||||||||||||||||||||||||||||||||||||||||||||||||||||||||||||||||||||||||||||||||||||||||||||||||||||||||||||||||||||||||||||||||||||||||||||||||||||||||||||||||||||||||||||||||||||||||||||||||||||||||||||||||||
| Other noncurrent liabilities |
(128 | ) | (321 | ) | 1,585 | ||||||||||||||||||||||||||||||||||||||||||||||||||||||||||||||||||||||||||||||||||||||||||||||||||||||||||||||||||||||||||||||||||||||||||||||||||||||||||||||||||||||||||||||||||||||||||||||||||||||||||||||||||||||||||||||||||||||||||||||||||||||||||||||||||||||||||||||||||||||||||||||||||||||||||||||||||||||||||||||||||||||||||||||||||||||||||||||||||||||||||||||||||||||||||||||||||||||||||||||||||||||||||||||||||||||||||||||||||||||||||||||||||||||||||||||||||||||||||||||||||||||||||||||||||||||||||||||||||||||||||||||||||||||||||||||||||||||||||||||||||||||||||||||||||||||||||||||||||||||||||||||||||||||||||||||||||||||||||||||||||||||||||||||||||||||||||||||||||||||||||||||||||||||||||||||||||||||||||||||||||||||||||||||||||||||||||||||||||||||||||||||||||||||||||||||||||||||||||||||||||||||||||||||||||||||||||||||||||||||||||||||||||||||||||||||||||||||||||||||||||||||||||||||||||||||||||||||||||||||||||||||||||||||||||||||||||||||||||||||||||||||||||||||||||||||||||||||||||
| Net cash provided by operating activities |
19,136 | 58,548 | 88,691 | ||||||||||||||||||||||||||||||||||||||||||||||||||||||||||||||||||||||||||||||||||||||||||||||||||||||||||||||||||||||||||||||||||||||||||||||||||||||||||||||||||||||||||||||||||||||||||||||||||||||||||||||||||||||||||||||||||||||||||||||||||||||||||||||||||||||||||||||||||||||||||||||||||||||||||||||||||||||||||||||||||||||||||||||||||||||||||||||||||||||||||||||||||||||||||||||||||||||||||||||||||||||||||||||||||||||||||||||||||||||||||||||||||||||||||||||||||||||||||||||||||||||||||||||||||||||||||||||||||||||||||||||||||||||||||||||||||||||||||||||||||||||||||||||||||||||||||||||||||||||||||||||||||||||||||||||||||||||||||||||||||||||||||||||||||||||||||||||||||||||||||||||||||||||||||||||||||||||||||||||||||||||||||||||||||||||||||||||||||||||||||||||||||||||||||||||||||||||||||||||||||||||||||||||||||||||||||||||||||||||||||||||||||||||||||||||||||||||||||||||||||||||||||||||||||||||||||||||||||||||||||||||||||||||||||||||||||||||||||||||||||||||||||||||||||||||||||||||||||||
| Cash flows from investing activities |
|||||||||||||||||||||||||||||||||||||||||||||||||||||||||||||||||||||||||||||||||||||||||||||||||||||||||||||||||||||||||||||||||||||||||||||||||||||||||||||||||||||||||||||||||||||||||||||||||||||||||||||||||||||||||||||||||||||||||||||||||||||||||||||||||||||||||||||||||||||||||||||||||||||||||||||||||||||||||||||||||||||||||||||||||||||||||||||||||||||||||||||||||||||||||||||||||||||||||||||||||||||||||||||||||||||||||||||||||||||||||||||||||||||||||||||||||||||||||||||||||||||||||||||||||||||||||||||||||||||||||||||||||||||||||||||||||||||||||||||||||||||||||||||||||||||||||||||||||||||||||||||||||||||||||||||||||||||||||||||||||||||||||||||||||||||||||||||||||||||||||||||||||||||||||||||||||||||||||||||||||||||||||||||||||||||||||||||||||||||||||||||||||||||||||||||||||||||||||||||||||||||||||||||||||||||||||||||||||||||||||||||||||||||||||||||||||||||||||||||||||||||||||||||||||||||||||||||||||||||||||||||||||||||||||||||||||||||||||||||||||||||||||||||||||||||||||||||||||||||||
| Purchase of property and equipment |
(10,790 | ) | (6,300 | ) | (17,893 | ) | |||||||||||||||||||||||||||||||||||||||||||||||||||||||||||||||||||||||||||||||||||||||||||||||||||||||||||||||||||||||||||||||||||||||||||||||||||||||||||||||||||||||||||||||||||||||||||||||||||||||||||||||||||||||||||||||||||||||||||||||||||||||||||||||||||||||||||||||||||||||||||||||||||||||||||||||||||||||||||||||||||||||||||||||||||||||||||||||||||||||||||||||||||||||||||||||||||||||||||||||||||||||||||||||||||||||||||||||||||||||||||||||||||||||||||||||||||||||||||||||||||||||||||||||||||||||||||||||||||||||||||||||||||||||||||||||||||||||||||||||||||||||||||||||||||||||||||||||||||||||||||||||||||||||||||||||||||||||||||||||||||||||||||||||||||||||||||||||||||||||||||||||||||||||||||||||||||||||||||||||||||||||||||||||||||||||||||||||||||||||||||||||||||||||||||||||||||||||||||||||||||||||||||||||||||||||||||||||||||||||||||||||||||||||||||||||||||||||||||||||||||||||||||||||||||||||||||||||||||||||||||||||||||||||||||||||||||||||||||||||||||||||||||||||||||||||||||||||||
| Proceeds from the sale of property and equipment |
462 | 205 | Reserves are recorded on the balance
sheet to reflect the Company’s contractual liabilities relating to warranty commitments to customers. Warranty coverage of two years is provided to customers. An estimate for warranty expense is recorded at the time of sale within cost of sales
based on historical warranty return rates and repair costs. Product warranty liabilities are included within accrued expenses and other current liabilities on the consolidated balance sheets at December 31, 2009 and 2010.
Advertising costs The Company expenses all advertising costs as they are incurred. Advertising costs were $2,784, $1,943, and $2,948 for the years ended December 31, 2008, 2009 and 2010. Revenue recognition The Company recognizes revenue at the time of shipment of products to customers as at that time title has transferred, the price is fixed or determinable and collection is deemed probable. Billings for shipping and handling costs are included in revenues, for which the costs are included in cost of sales. Upon recognition of revenue, the Company also provides reserves for product returns, discounts, volume rebates and other allowances, all of which are recorded as reductions in net sales. The Company assesses sales and reserves data on an ongoing basis to determine whether customers will meet the requirements of specific programs. Stock based compensation In accordance with the accounting standards for share-based payments, all share based payments, including grants of stock options and incentive units, are required to be recognized in the consolidated statement of operations as an operating expense, based on their grant date fair values, over the requisite service period. Incentive units The Incentive Units are accounted for using the fair value method. Based on the terms and conditions of the awards, a portion is classified as equity awards and a portion is classified as liability awards. The liability awards are remeasured at fair value at each reporting period until settlement and the changes in fair value are recorded in the consolidated statement of operations. For 2008 and 2009 the Company used a Black-Scholes option pricing model to estimate the grant-date fair-value of its incentive units. Inputs to the Black-Scholes option pricing model include the fair value of the underlying assets distributable to award holders (based on the enterprise value of the Company and the terms of the awards), estimated price volatility of the underlying assets distributable to award holders, the term of the awards, dividend yield, and the risk-free interest rate. In determining the enterprise value of the Company, the valuation incorporates discounted cash flow modeling techniques, which require estimates regarding the amount and timing of expected cash flows and discount rate assumptions commensurate with the risk involved.
Table of ContentsSRAM Holdings, LLC and subsidiaries Notes to consolidated financial statements Year ended December 31, 2008, 2009, and 2010 (In thousands, except share/unit data)
Starting in 2010 the Company began estimating the grant date fair value using a weighted average between the Black-Scholes option pricing model and the probability-weighted expected return method. The probability-weighted expected return method estimates value based upon an analysis of future values of the enterprise assuming various outcomes such as an IPO, merger or sale, dissolution, or continued operation as a viable enterprise. Unit value is based upon the probability-weighted present value of expected future investment returns, considering each of the possible future outcomes available to the enterprise, as well as the rights of each unit class. Stock options The Company uses a Black-Scholes option pricing model in order to estimate the grant-date fair value of its stock options. Inputs used by the Company in estimating the fair include expected stock price volatility over the expected term of the awards, the expected dividend yield and the risk free interest rate. The expected term of stock options granted represents the period of time that stock options granted are expected to be outstanding. The expected volatility is based on the historical volatility of competitors that are similar except for having publicly traded securities. The expected dividend yield represents the expected annual dividends to be paid to stockholders over the term of the stock options. The risk free interest rate used in the option valuation model is based on United States Treasury rates with remaining terms similar to the expected term of the stock options. Income taxes The Company is a limited liability company classified as a partnership for federal income tax purposes. Consequently, income and losses flow directly through to the members of the Company. Accordingly, no provision for U.S. federal income taxes has been reflected in the consolidated financial statements. Income taxes in foreign jurisdictions and certain U.S. state taxes are accounted for under the asset and liability method. Deferred tax assets and liabilities are recognized for the future tax consequences attributable to differences between the carrying amounts of existing assets and liabilities in the financial statements and their respective tax bases. Deferred tax assets and liabilities are measured using enacted tax rates expected to apply to taxable income in the years in which those temporary differences are expected to be recovered or settled. The effect on deferred tax assets and liabilities of a change in tax rates is recognized in income in the period that includes the enactment date. A valuation allowance is established if it is more likely than not that a deferred tax asset will not be realized. In determining the appropriate valuation allowance, the Company considers projected realization of tax benefits based on expected levels of future taxable income, available tax planning strategies and its overall deferred tax position. Withholding tax is required to be remitted on certain types of payments made by foreign jurisdictions, including but not limited to royalty charges and sales and marketing charges. The withholding tax rules vary by jurisdiction and by entity classification. The Company accrues withholding tax as incurred throughout the year. Effective January 1, 2008, the Company adopted the new accounting standard for uncertainty in income tax positions, which prescribes a comprehensive model for recognizing, measuring, presenting, and disclosing in the financial statements tax positions taken by the Company on its tax returns. This standard requires that the tax effects of a position be recognized only if it is “more-likely-than-not” to be sustained based solely on its
Table of ContentsSRAM Holdings, LLC and subsidiaries Notes to consolidated financial statements Year ended December 31, 2008, 2009, and 2010 (In thousands, except share/unit data)
technical merits as of the reporting date. The more-likely-than-not threshold represents a positive assertion by management that a company is entitled to the economic benefits of a tax position. If a tax position is not considered more-likely-than-not, no benefits of the tax position are to be recognized. If deemed necessary, the Company will record accrued interest and penalties as a component of the provision for income taxes in the consolidated statements of operations. The adoption of this accounting standard did not have a significant effect on the Company’s financial statements. Prior to January 1, 2008, the Company recorded a liability when such uncertainties were probable and reasonably estimable. Fair value of financial instruments The Company’s financial instruments consist primarily of cash and cash equivalents, trade receivables, trade payables, and long-term debt. Management considers the carrying values of cash and cash equivalents, trade receivables and trade payables to be representative of their respective fair values because of their short-term maturities or expected settlement dates. The estimated fair value of the outstanding amounts under the long-term borrowings is further discussed in Footnote 11. This guidance establishes a three-level valuation hierarchy for fair value measurements. These valuation techniques are based upon the transparency of inputs (observable and unobservable) to the valuation of an asset or liability as of the measurement date. Observable inputs reflect market data obtained from independent sources, while unobservable inputs reflect the Company’s market assumptions. These two types of inputs create the following fair value hierarchy: Level 1—Valuation is based on quoted prices for identical assets or liabilities in active markets; Level 2—Valuation is based on quoted prices for similar assets or liabilities in active markets, or other inputs that are observable for the asset or liability, either directly or indirectly, for the full term of the financial instrument; and Level 3—Valuation is based upon other unobservable inputs that are significant to the fair value measurement. Foreign currency The financial statements of the Company’s foreign subsidiaries and branches are maintained in local currency, except for its Asian trading company, whose functional currency is the U.S. dollar. For financial reporting purposes, the non-U.S. dollar functional currency entities translate their balance sheets at exchange rates in effect at the balance sheet date and their statements of operations at weighted average rates prevailing during the year. The cumulative effect of translation adjustments for the balance sheet is reflected as a separate component of members’ deficit. Gains and losses resulting from foreign exchange transactions are recorded in the results of operations in the period that they occur. Such transaction gains and losses are a result of the Company conducting its business in various foreign currencies and translation of intercompany receivables and payables that are not deemed to be permanent in nature.
Table of ContentsSRAM Holdings, LLC and subsidiaries Notes to consolidated financial statements Year ended December 31, 2008, 2009, and 2010 (In thousands, except share/unit data)
New accounting pronouncements In September 2006, the FASB issued “Fair Value Measurements” (ASC Topic 820). ASC Topic 820 defines fair value, establishes a framework for measuring fair value in generally accepted accounting principles, and expands disclosures about fair value measurement. This statement applies under other accounting pronouncements that require or permit fair value measurements and does not require any new fair value measurements. The Company adopted ASC Topic 820 as of January 1, 2008 except for nonfinancial assets and liabilities recognized or disclosed at fair value on a nonrecurring basis, for which the effective date was fiscal years beginning after November 15, 2008. In May 2009, the FASB issued Guidance that establishes general standards of accounting for and disclosures of subsequent events that occurred after the balance sheet date but prior to the issuance of financial statements. This Guidance is effective for financial statements issued for interim or fiscal years ending after September 15, 2009. The adoption of this Guidance, effective September 30, 2009, did not affect the consolidated financial position, results of operations or cash flows of the Company. In June 2009, the Financial Accounting Standards Board (FASB) issued The FASB Accounting Standards Codification (ASC or Codification) and the Hierarchy of Generally Accepted Accounting Principles (GAAP). This statement was adopted by the Company in 2009. The Codification became the single source of authoritative U.S. GAAP recognized by the FASB and the Company’s notes to the consolidated financial statements will no longer make reference to Statements of Financial Accounting Standards (SFAS) or other U.S. GAAP pronouncements. In August 2009, we adopted Accounting Standards Update, or ASU, 2009-05, Fair Value Measurements (Topic 820) Measuring Liabilities at Fair Value. ASU 2009-05 amends ASC topic 820 by providing additional guidance clarifying the measurement of liabilities at fair value. When a quoted price in an active market for the identical liability is not available, the amendments require that the fair value of a liability be measured using one or more of the listed valuation techniques that should maximize the use of relevant observable inputs and minimize the use of unobservable inputs. The adoption did not have a material impact on our financial position or results from operations. 4. Allowance for doubtful accounts
Table of ContentsSRAM Holdings, LLC and subsidiaries Notes to consolidated financial statements Year ended December 31, 2008, 2009, and 2010 (In thousands, except share/unit data)
5. Inventories Inventories consist of the following at December 31:
6. Property and equipment Property and equipment consist of the following at December 31:
Depreciation expense totaled $11,808, $11,181, and $11,472 for the years ended December 31, 2008, 2009, and 2010, respectively. 7. Intangible assets Intangible assets represent the value of the registered tradenames and trademarks, customer relationships, patents, and noncompete agreements acquired in purchase business combinations. These assets are being amortized over periods ranging from five to twenty-five years using the straight-line method. Amortization expense totaled $3,991 for each of the years ended December 31, 2008, 2009 and 2010, respectively. The estimated amount of amortization expense for the identifiable intangible assets are summarized as follows for the next five years ended December 31:
Table of ContentsSRAM Holdings, LLC and subsidiaries Notes to consolidated financial statements Year ended December 31, 2008, 2009, and 2010 (In thousands, except share/unit data)
Refer to the table below for a summary of the gross carrying amount and accumulated amortization of intangible assets at December 31, 2009 and 2010, respectively:
8. Product warranty The following table presents a summary of changes in the product warranty accrual activity for the years ended December 31, 2008, 2009 and 2010:
9. SRAM-restructuring Effective in June 2010, a plan was approved that will reduce the workforce at its German plant pursuant to a shift in manufacturing from Germany to Taiwan. The scheduled plan includes three phases for the reduction in force, with the first phase taking effect on December 31, 2010 and the last phase on July 1, 2012. In connection with these actions the Company accrued termination benefits and other restructuring costs which were earned as of December 31, 2010 within accrued personnel costs and charged the expense to cost of sales.
Table of ContentsSRAM Holdings, LLC and subsidiaries Notes to consolidated financial statements Year ended December 31, 2008, 2009, and 2010 (In thousands, except share/unit data)
Activity in accrued personnel costs related to this restructuring in 2010 consists of the following:
Restructuring costs incurred as of December 31, 2010 and are expected to be incurred over the course of the plan are as follows:
Additional costs expected to be incurred in connection with this restructuring total $2,870, of which $2,291 relate to the Original Equipment Segment and $579 relate to the Aftermarket Segment. 10. Commitments and contingencies Legal matters In November 2001, a patent infringement lawsuit was filed against the Company, in the Munich District Court in Germany. In July 2007, the trail court ruled in favor of the Company. However, in October 2009, a German Appellate Court reversed the ruling and indicated that the Company infringed the utility model in suit. In November 2009, the Company appealed the decision to the German Court of Justice (Supreme Court). After consultation with legal counsel, management has assessed the probability of an unfavorable outcome as probable and in 2009 recorded a $3,000 liability within accrued expenses and other current liabilities on the consolidated balance sheet as of December 31, 2009 and December 31, 2010. The Company is involved in other various legal matters from time to time which management considers to be ordinary, routine and incidental to the Company’s business. Although the final outcome of these matters cannot presently be determined, in the opinion of management, disposition of these matters will not have a material adverse effect on the financial position or results of operations of the Company.
Table of ContentsSRAM Holdings, LLC and subsidiaries Notes to consolidated financial statements Year ended December 31, 2008, 2009, and 2010 (In thousands, except share/unit data)
The Company currently leases office, manufacturing and warehouse space under the terms of operating leases expiring on various dates through 2017. The aggregate future minimum lease commitments under these operating leases for the next five years are summarized as follows for the years ended December 31:
Total rent expense for the years ended December 31, 2008, 2009 and 2010 under operating leases approximated $4,462, $4,577 and $4,373, respectively. 11. Long-term borrowings Long-term borrowings consist of the following at December 31, 2009 and 2010:
On April 30, 2010 the Company entered into a new credit agreement. This agreement is a senior secured credit facility with various financial institutions and GE Capital as the administrative agent which matures in April 2015. Proceeds from this facility were used to repay in full all obligations of the previous short term revolving credit facility and previous long term senior note borrowing arrangements and all obligations from the subordinated notes outstanding. The Company incurred costs of $6,309 in connection with the refinancing, of which third party fees of $295 were accounted for as to a debt modification and were expensed as incurred within interest expense. Additionally, previously capitalized deferred financing costs of $2,396 were expensed
Table of ContentsSRAM Holdings, LLC and subsidiaries Notes to consolidated financial statements Year ended December 31, 2008, 2009, and 2010 (In thousands, except share/unit data)
in connection with the refinancing. Of these previously capitalized deferred financing costs, $1,869 represented creditor costs that were accounted for as a debt extinguishment and expensed and $527 represented third party costs that were accounted for as a debt modification and expensed in connection with the refinancing. This agreement includes a $25,000 revolving credit facility borrowing arrangement and term note of $290,000. The revolver matures April 2015 and provides for revolving credit borrowings, denominated in U.S. dollars. The Company is also required to pay a commitment fee of 0.5% on the unused portion of the facility. Borrowings against the revolving credit facility and the term note bear interest at a rate of prime plus 2.3% or LIBOR plus 3.5%. The new credit agreement requires the Company to maintain ongoing compliance with certain financial covenants, including compliance with a maximum consolidated leverage ratio and a minimum consolidated fixed charge coverage ratio. At December 31, 2010, the Company was in compliance with all its financial covenants. Additionally, the agreement requires the Company to make a mandatory prepayment within five business days after the last business day the annual financial statements are required to be delivered, equal to the Excess Cash Flow for such fiscal year as defined in the credit agreement, if the companies maximum consolidated leverage ratio is above certain levels. At December 31, 2010, the companies maximum consolidated leverage ratio was below the required limit, therefore no mandatory prepayment was required. Substantially all of the Company’s assets serve as collateral for borrowings under the agreements. On September 30, 2008, the Company entered into two credit agreements. The first agreement was a senior secured credit facility with various financial institutions and GE Capital as the administrative agent. Proceeds from this facility were used to repay in full all obligations of the previous short term revolving credit facility and previous long term senior note borrowing arrangements. The remaining amounts of these proceeds were used to pay the special dividend payment to shareholders. This agreement included a $25,000 revolving credit facility borrowing arrangement and term note of $240,000. The revolver was to mature on September 2014 and provided for revolving credit borrowings, denominated in U.S. dollars. The Company was required to pay a commitment fee of 0.5% on the unused portion of the facility. The senior term note was to mature on September 2014 and was payable in equal quarterly installments totaling $2,400 per annum beginning January 1, 2009. Borrowings against the revolving credit facility and the term note beared interest at a rate of prime plus 3.8% or LIBOR plus 5%. This debt was paid off in full on April 30, 2010. The second agreement was a $110,000 senior subordinated note with various financial institutions. Proceeds from this agreement were applied to the special dividend payment and costs associated with the Recapitalization. The subordinated note was to mature in September 2015 and was payable in full on the maturity date. Interest on the subordinated note was calculated on the unpaid principal balance at 13%. 11% of the annual interest expense was payable quarterly in arrears and 2% of the annual interest expense was paid-in-kind interest that was capitalized and due upon the maturity of the note. This debt was paid off in full on April 30, 2010. Both agreements required the Company to maintain ongoing compliance with certain financial covenants, including compliance with a maximum consolidated leverage ratio and a minimum consolidated fixed charge coverage ratio. At December 31, 2009, the Company was in compliance with all its financial covenants. Additionally, the first agreement required the Company to make a mandatory prepayment within five business
Table of ContentsSRAM Holdings, LLC and subsidiaries Notes to consolidated financial statements Year ended December 31, 2008, 2009, and 2010 (In thousands, except share/unit data)
days after the last business day the annual financial statements are required to be delivered, equal to the Excess Cash Flow for such fiscal year as defined in the credit agreement. At December 31, 2009, the mandatory prepayment was $10,855 which is classified as a current liability on the consolidated balance sheet. Substantially all of the Company’s assets served as collateral for borrowings under the agreements. The carrying amount reported in the consolidated balance sheet as of December 31, 2009 and 2010 for long-term debt is $307,600 and $235,000, respectively. Using a discounted cash flow technique that incorporates a market interest yield curve with adjustments for duration, optionality, and risk profile, the Company has determined the fair value of its debt to be $337,300 and $232,800 at December 31, 2009 and 2010, respectively. In determining the market interest yield curve, the Company considered its corporate ratings from Moody’s and S&P. Scheduled maturities of long-term borrowings are as follows:
12. Income taxes The Company’s income tax provision reflects its partnership (and previous S-Corporation) tax classification and is comprised of various foreign and U.S. state income tax provisions. The components of income (loss) before the provision for income taxes for the years ended December 31, 2008, 2009 and 2010 are as follows:
The provision for income taxes for the years ended December 31, 2008, 2009, and 2010 consists of the following:
Table of ContentsSRAM Holdings, LLC and subsidiaries Notes to consolidated financial statements Year ended December 31, 2008, 2009, and 2010 (In thousands, except share/unit data)
Deferred income tax assets are included in deferred charges and other assets on the consolidated balance sheets and consist of the following at December 31:
The difference between the effective tax rate and the federal statutory rate of 35% is primarily due to the following:
There are no interest and penalty amounts included in the unrecognized tax benefits as of December 31, 2009 and December 31, 2010, respectively. The Company does not expect that changes in the liability for unrecognized tax benefits during the next 12 months will have a significant impact on the Company’s financial position or results of operations. The Company is subject to taxation in the various U.S., state and foreign jurisdictions. The U.S. federal income tax returns have open statute of limitations for the 2007 and subsequent tax years as of December 31, 2010. Generally, the state tax returns have open statute of limitations for tax years 2007 and subsequent as of December 31, 2010. The German income tax returns for 2000 through 2005 have been audited. The remaining open years are for the 2006 and subsequent tax years as of December 31, 2010. The Irish and Chinese income tax returns have open statute of limitations for the 2006 and subsequent tax years as of December 31, 2010. The Taiwan income tax returns are examined each year. The remaining open years are for the 2009 and subsequent tax years as of December 31, 2010. The Company does not provide for foreign withholding taxes on undistributed earnings of foreign operations that are intended to be permanently reinvested. At December 31, 2010, these earnings amounted to approximately $44,065. If these earnings were repatriated to the US, the Company may be required to accrue and pay taxes on the earnings based on each jurisdiction’s rules and the current foreign withholding tax rates in effect. The amount of the potential tax liability could range from $1,000 to $7,000 as of December 31, 2010.
Table of ContentsSRAM Holdings, LLC and subsidiaries Notes to consolidated financial statements Year ended December 31, 2008, 2009, and 2010 (In thousands, except share/unit data)
13. Segment information The Company has two reportable segments, differentiated by the method used to distribute products to customers: Original Equipment and Aftermarket. The Original Equipment Segment revenue is generated through the sale of bicycle components that are assembled onto new bikes by the bicycle manufacturers. The Aftermarket Segment represents upgrades, accessories, specialty, and replacement components marketed primarily through field sales employees and independent distributors. Where applicable, the Company reports information about operating segments and related disclosures about products and services, geographic areas and major customers. SRAM Holdings, LLC’s chief operating decision maker (“CODM”) assesses segment performance and makes resource allocation decisions based on segment operating income. The Company does not generate information about assets for its operating segments, and accordingly no asset information is presented in the table below. Our selling, marketing, and product development, expenses are allocated to the segments based on what the Company considers to be a reasonable reflection of the utilization of services provided. Our general and administrative expense, interest expense (net), and foreign currency gain (loss) are evaluated on a consolidated basis and not allocated to the Company’s segments. Operating segment data for the periods indicated are as follows:
The following table summarizes net sales by product line:
Table of ContentsSRAM Holdings, LLC and subsidiaries Notes to consolidated financial statements Year ended December 31, 2008, 2009, and 2010 (In thousands, except share/unit data)
The tables below presents information related to geographic areas in which the Company operated. Net revenue is primarily classified based on the country where the Company’s customer is located: Net sales by customer location were as follows:
Total long lived assets by location were as follows:
There are two customers that represent greater than 10% of total revenues for 2008, 2009, and 2010. The first customer represented 12%, 11%, and 12% of total revenues for the years 2008, 2009, and 2010, respectively, and the second customer represented 8%, 8%, and 11% of total revenues for the years 2008, 2009, and 2010, respectively. The revenues from both of these customers are included within the revenues of the OEM reportable segment. 14. Members’ capital Class A Units As of December 31, 2010, there were 3,640,000 Class A Member Units authorized, issued, and outstanding. Class A units entitle holders to the rights and privileges specified in the SRAM Holdings, LLC Operating Agreement, as described below. Class A units maintain preemptive rights against the issuance of additional voting and/or participating units, carry one vote per unit, are nontransferable absent specific approval by the Board of Directors, and maintain the right to initiate a sale of the Company through a majority vote of Class A members. Under the Operating Agreement, no distributions other than tax distributions shall be made to any other members until Class A members have received a complete return of contributed capital, the Class A preferred return (10% of contributed capital per annum, compounded quarterly, beginning September 30, 2008), and any Class A stepped-up preferred return (15% of the sum of contributed capital and any undistributed preferred return, compounded quarterly, beginning September 30, 2014). Tax distributions are made to Class A members based on the estimated member tax liability accruing to the member unit holder as a result of the allocation of taxable gain and loss to the Class A units. Upon a sale of the Company, all Class A members will be granted equity interests such that their rights, preferences, and privileges are the same after such a sale as they were before, unless otherwise agreed upon by the Class A members.
Table of ContentsSRAM Holdings, LLC and subsidiaries Notes to consolidated financial statements Year ended December 31, 2008, 2009, and 2010 (In thousands, except share/unit data)
Class B units As of December 31, 2010, there were 5,460,000 Class B Member Units authorized, issued, and outstanding. Class B units entitle holders to the rights and privileges specified in the SRAM Holdings, LLC Operating Agreement. Class B units maintain preemptive rights against the issuance of additional voting and/or participating units, carry one vote per unit, and are nontransferable absent specific approval by the Board of Directors. Tax distributions are made to Class B members based on the estimated member tax liability accruing to the member unit holder as a result of the allocation of taxable gain and loss to the Class B units. Other than tax distributions, Class B units share in distributions based on a participation ratio specified in the Operating Agreement once Class A units have received a complete return of contributed capital, the Class A preferred return, and any Class A stepped-up preferred return. Upon a sale of the Company, all Class B members will be granted equity interests such that their rights, preferences, and privileges are the same after such a sale as they were before, unless otherwise agreed upon by Class B members. Incentive units The Company is authorized to issue 675,000 Incentive Units. As of December 31, 2010, there were 553,394 issued Incentive Units, of which 539,533 were outstanding. Upon vesting, Incentive Units entitle the holders thereof to the rights and privileges specified in the SRAM Holdings, LLC Operating Agreement and the individual grantee Incentive Unit Agreement(s). As discussed in Note 16, the Company issues Incentive Units to key management, employees, and directors as a means for allowing participation in member distributions. Incentive Units do not maintain any preemptive rights, are nonvoting, and are nontransferable absent specific approval by the Board of Directors. Tax distributions are made to Incentive Unit holders (both vested and unvested) based on the estimated member tax liability accruing to the member unit holder as a result of the allocation of taxable gain and loss incentive units. Other than tax distributions, Incentive Units participate in distributions once Class A units have received a complete return of contributed capital, the Class A Preferred Return, any Class A Stepped-up Preferred Return, and once distributions to Class A and Class B members exceed the distribution threshold defined in the grantee Incentive Unit Agreement. Distributions are made to vested Incentive Unit holders if and when the aforementioned criteria are met, with remittance to the grantee of any distributions accruing during the vesting period upon vesting in the award. As described in Note 16, Incentive Units are forfeited, in whole or in part, upon a termination event, death, or disability. 15. Earnings per unit Earnings per unit is presented in conformity with the two-class method. Income is allocated to each class of members in a manner that reflects the allocation resulting from a full distribution of current period income or loss. Losses are allocated in manner that reflects the method in which losses are absorbed by the members; under the SRAM Holdings, LLC Operating Agreement, losses, from current or prior years, are not required to be funded by any of the members. The allocation of income or loss to each class is discussed below: Class A member units The Class A units are entitled to certain preferred allocations and distributions, as described in Note 14. As a result of the preference attributable to Class A members, no losses (after allocation of preferred returns and
Table of ContentsSRAM Holdings, LLC and subsidiaries Notes to consolidated financial statements Year ended December 31, 2008, 2009, and 2010 (In thousands, except share/unit data)
contractual tax distributions) are allocated to Class A members. Class A members units participate in earnings based on the participation ratio outlined in the SRAM Holdings, LLC Operating Agreement. Class B member units As a result of the preference items attributable to the Class A members, all losses (after contractually required distributions) are allocated to Class B members. Class B units participate in earnings based on the participation ratio outlined in the SRAM Holdings, LLC Operating Agreement to the extent that net income distributable to members exceeds the Class A preferred return and contractual tax distributions. Incentive units Incentive units do not represent substantive equity ownership in the Company for the purposes of calculating earnings per unit based on the following characteristics:
As a result of the above, no allocations of income or loss have been made to the Incentive Units in any of the periods presented. Accordingly, the Company has not presented basic or diluted earnings per unit for the incentive units and there is no dilutive effect of the incentive units on both the Class A and Class B earnings per unit measures for each of the three years ended December 31, 2008, 2009 and 2010. For purposes of determining the weighted average units outstanding used in the earnings per unit calculation for 2008, the Company has retroactively reflected the impact of the 2008 recapitalization on the capital structure, as if it had occurred on January 1, 2008.
Table of ContentsSRAM Holdings, LLC and subsidiaries Notes to consolidated financial statements Year ended December 31, 2008, 2009, and 2010 (In thousands, except share/unit data)
16. Stock option plans In 2008, prior to the Recapitalization, the Company had six stock option plans (the “Plans”) in effect under which grants have been issued. The Plans, on a combined basis, provided for the granting of options to purchase, in aggregate, a maximum of 1,597,016 shares of the Company’s common stock. The exercise price for the stock options was equal to the fair value on the date of grant as determined in accordance with the Plans. The vesting requirements were determined by the Board of Directors, with most outstanding options vesting 100% in three years. The options expire on the earlier of termination of employment, ten years from the respective plan’s inception, or ten years after the grant date, as defined by the respective plan. A summary of the Company’s Plans as of December 31, 2008, and the changes during the year then ended, are as follows:
The range in exercise prices falls between $2.57 and $38.00. There were no options outstanding at December 31, 2008. All stock option awards issued under this Plan had certain performance conditions, including a requirement that the Company changes its incorporation to a “C corporation” status in order for the options to become exercisable. The Company considered such performance condition as not probable and as such no compensation expense was recognized in the statement of operations prior to recapitalization. The Recapitalization triggered certain performance conditions which immediately vested all outstanding options and allowed the holders to exercise their outstanding options. The majority of US option holders chose to exercise their options which resulted in compensation expense of $62,106. All options held by non-US option holders were cancelled and repurchased by the Company for an agreed upon price which resulted in $26,415 of compensation expense. Incentive units In connection with the Recapitalization, SRAM Holdings, LLC has authorized 675,000 of nonvoting Incentive Units to be issued to certain members of management of the Company in accordance with the Amended and Restated Limited Liability Company Operating Agreement of the Company. At the time of the issuance, the Incentive Units are issued for no consideration. Each Incentive Unit has a Distribution Threshold set forth in the Incentive Member’s Incentive Unit Agreement of $467,600 for 2008 and 2009 grants and $525,415 for 2010
Table of ContentsSRAM Holdings, LLC and subsidiaries Notes to consolidated financial statements Year ended December 31, 2008, 2009, and 2010 (In thousands, except share/unit data)
grants. Incentive Units vest 20% per year, provided that no Termination Event has occurred, based upon the achieved Model Year EBITDA as compared to the Model Year EBITDA Target for such model year in accordance with the Member’s Incentive Unit Agreement. In accordance with the forfeiture and buy out section of the Incentive Unit Agreement, if the Incentive Unit Member terminates their employment with the Company, 50% of the then vested Incentive Units and 100% of the unvested Incentive Units are immediately forfeited and cancelled for no consideration. SRAM Holdings, LLC has the option of purchasing vested units at the terminating date fair value or can permit the Incentive Member to retain the vested Incentive Units. The summary of the Incentive Units activity as of December 31, 2009 and 2010, which represent 50% liability awards and 50% equity awards at the SRAM Holdings, LLC level, are as follows: The summary of the Incentive Units activity as of December 31, 2009 and 2010 for all awards are as follows:
Total compensation expense for equity classified awards was $0, $1,533, and $1,267 in 2008, 2009 and 2010, respectively. The compensation expense for liability classified awards was $0, $2,151 and $11,164 in 2008, 2009 and 2010, respectively. The summary of the unvested Incentive Units activity as of December 31, 2009 and 2010 is as follows:
Table of ContentsSRAM Holdings, LLC and subsidiaries Notes to consolidated financial statements Year ended December 31, 2008, 2009, and 2010 (In thousands, except share/unit data)
The assumptions used in the Black-Scholes option valuation model to calculate the fair value of the Incentive Units granted on December 1, 2009 and July 23, 2010, are as follows:
Expected volatility of the units is based on historical equity volatility from other public company’s trading data within the bicycle, sporting equipment, and consumer products growth sector over the stated period. The risk-free interest rate is based upon the U.S. Treasury yield curve at the date of grant with maturity dates corresponding to the incentive units expected average life. The Company estimated expected terms of the units using the simplified method based on the expected term over which the units are likely to vest. 17. Pro forma information (unaudited) Pro forma consolidated balance sheet The pro forma consolidated balance sheet presented in the accompanying consolidated financial statements reflects the conversion as of December 31, 2010 of all outstanding Class A member units, Class B member units and Incentive Unit member units into shares of Class A common stock and shares of Class B common stock of SRAM International Corporation upon the initial public offering, all based upon an assumed share price of $ per share (the midpoint of the range set forth on the cover of Company’s prospectus, after deducting underwriting discounts and commissions and estimated expenses payable by the Company in connection with the offering). The conversion of Member Units to common stock is contractually required upon the reorganization to a C-corporation as contemplated in the offering. Additionally, the pro forma consolidated balance sheet reflects an accrual for the accumulated Class A preferred return as of December 31, 2010. The Company will distribute $ to Class A member units, representing their accumulated preferred return of $ as of the settlement date, which will be settled in cash. Pro forma earnings per common share The pro forma basic and diluted earnings per common share for the year ended December 31, 2010 have been computed to give effect to: (a) the contractually required conversion of Class A, Class B and Incentive Unit member units into common stock, described above, and (b) the tax effect of the conversion from a limited liability corporation to a C-corporation; as though all of the conversions occurred on January 1, 2010. In connection with the offering and related reorganization the Company became taxed as a corporation. The Company was previously treated as a limited liability corporation for tax purposes and therefore generally not
Table of ContentsSRAM Holdings, LLC and subsidiaries Notes to consolidated financial statements Year ended December 31, 2008, 2009, and 2010 (In thousands, except share/unit data)
subject to federal income tax in the United States. The pro forma net income for the year ended December 31, 2010 includes an adjustment for income tax expense as if the Company had been a corporation from January 1, 2010, at an assumed combined federal, state, and local income tax rate of %. Pro forma weighted average common shares outstanding are computed as follows:
18. Subsequent events On May 4, 2011, the Company acquired certain assets and certain liabilities of Quarq Technology, Inc., who is engaged in the business of designing, manufacturing, supplying and selling bicycle power meters, measurement devices and related products. The purchase price was $4,500, plus an earn-out clause that could result in an additional maximum purchase price of $6,000. The acquisition was funded through cash on hand. The future earn-out is based on a two year period and is based on the net sales of Quarq Technology, Inc. products.
Table of Contentsshares
Class A common stock
Prospectus
Through and including , 2011 (the 25th day after the date of this prospectus), all dealers effecting transactions in these securities, whether or not participating in this offering, may be required to deliver a prospectus. This is in addition to a dealer’s obligation to deliver a prospectus when acting as an underwriter and with respect to an unsold allotment or subscription.
Table of ContentsPart II Item 13. Other expenses of issuance and distribution The following table sets forth the costs and expenses, other than underwriting discounts and commissions, payable in connection with the sale and distribution of the securities being registered. All amounts are estimated except for the SEC registration fee and the FINRA filing fee. All the expenses below will be paid by SRAM.
Item 14. Indemnification of directors and officers SRAM International Corporation is a Delaware corporation. Section 145 of the Delaware General Corporation Law authorizes a court to award, or a corporation’s board of directors to grant, indemnity to directors and officers in terms sufficiently broad to permit such indemnification under certain circumstances for liabilities, including reimbursement for expenses incurred, arising under the Securities Act of 1933, as amended. Our amended and restated certificate of incorporation to be in effect upon the consummation of this offering provides for indemnification of our directors, officers, employees and other agents to the maximum extent permitted by the Delaware General Corporation Law, and our amended and restated bylaws to be in effect upon the consummation of this offering provide for indemnification of our directors, officers, employees and other agents to the maximum extent permitted by the Delaware General Corporation Law. In addition, in connection with this offering, we intend to enter into indemnification agreements with our directors and executive officers which are in some respects broader than the specific indemnification provisions contained in the Delaware General Corporation Law. The indemnification agreements may require us, among other things, to indemnify our directors against certain liabilities that may arise by reason of their status or service as directors and to advance their expenses incurred as a result of any proceeding against them as to which they could be indemnified. Reference is also made to the underwriting agreement to be filed as Exhibit 1.1 hereto, which provides for indemnification by the underwriters of the registrant and its officers and directors against certain liabilities. Item 15. Recent sales of unregistered securities On April 29, 2011, SRAM International Corporation, a Delaware corporation, was formed. SRAM-SP2, Inc. purchased 100 shares for $10.00 in a transaction exempt from registration pursuant to Section 4(2) of the Securities Act, as it was a transaction by an issuer that did not involve a public offering of securities. In connection with the reorganization described in the section entitled “The refinancing and reorganization” in the accompanying prospectus, we will issue shares of our Class B common stock to the Day family and
II-1
Table of Contentsshares of our Class A common stock to SRAM management and current and former directors and employees in exchange for their direct or indirect interests in SRAM Holdings, LLC. The shares will be issued in reliance on Section 4(2) of the Securities Act, on the basis that the issuance will not involve a public offering. There were no underwriters employed in connection with the transactions set forth in Item 15. Item 16. Exhibits and consolidated financial statements See the Exhibit Index beginning on page II-5, which follows the signature pages hereof and is incorporated herein by reference. Item 17. Undertakings The undersigned registrant hereby undertakes that: (1) for purposes of determining any liability under the Securities Act, the information omitted from the form of prospectus filed as part of this registration statement in reliance upon Rule 430A and contained in a form of prospectus filed by the registrant pursuant to Rule 424(b)(1) or (4) or 497(h) under the Securities Act shall be deemed to be part of this registration statement as of the time it was declared effective; (2) for the purpose of determining any liability under the Securities Act, each post-effective amendment that contains a form of prospectus shall be deemed to be a new registration statement relating to the securities offered therein, and the offering of such securities at that time shall be deemed to be the initial bona fide offering thereof; (3) for the purpose of determining liability of the registrant under the Securities Act to any purchaser in the initial distribution of the securities, the undersigned registrant undertakes that in a primary offering of securities of the undersigned registrant pursuant to this registration statement, regardless of the underwriting method used to sell the securities to the purchaser, if the securities are offered or sold to such purchaser by means of any of the following communications, the undersigned registrant will be a seller to the purchaser and will be considered to offer or sell such securities to such purchaser: (i) any preliminary prospectus or prospectus of the undersigned registrant relating to the offering required to be filed pursuant to Rule 424; (ii) any free writing prospectus relating to the offering prepared by or on behalf of the undersigned registrant or used or referred to by the undersigned registrant; (iii) the portion of any other free writing prospectus relating to the offering containing material information about the undersigned registrant or its securities provided by or on behalf of the undersigned registrant; and (iv) any other communication that is an offer in the offering made by the undersigned registrant to the purchaser; and (4) the undersigned will provide to the underwriters at the closing specified in the underwriting agreement, certificates in such denominations and registered in such names as required by the underwriters to permit prompt delivery to each purchaser. Insofar as indemnification for liabilities arising under the Securities Act may be permitted to directors, officers and controlling persons of the registrant pursuant to the foregoing provisions, or otherwise, the registrant has been advised that in the opinion of the SEC such indemnification is against public policy as expressed in the
II-2
Table of ContentsSecurities Act and is, therefore, unenforceable. In the event that a claim for indemnification against such liabilities (other than the payment by the registrant of expenses incurred or paid by a director, officer or controlling person of the registrant in the successful defense of any action, suit or proceeding) is asserted by such director, officer or controlling person in connection with the securities being registered, the registrant will, unless in the opinion of its counsel the matter has been settled by controlling precedent, submit to a court of appropriate jurisdiction the question whether such indemnification by it is against public policy as expressed in the Securities Act and will be governed by the final adjudication of such issue.
II-3
Table of ContentsSignatures Pursuant to the requirements of the Securities Act of 1933, as amended, we have duly caused this registration statement on Form S-1 to be signed on its behalf by the undersigned, thereunto duly authorized, in the City of Chicago, State of Illinois, on the 12th day of May, 2011.
Power of attorney KNOW ALL PERSONS BY THESE PRESENTS, that each person whose signature appears below constitutes and appoints Stanley R. Day, Jr. and Michael R. Herr, and each of them, as his or her true and lawful attorneys-in-fact and agents, with full power of substitution and resubstitution, for him or her and in his or her name, place and stead, in any and all capacities, to sign any and all amendments (including post-effective amendments) to this registration statement and to sign any registration statement for the same offering covered by the registration statement that is to be effective upon filing pursuant to Rule 462 promulgated under the Securities Act of 1933, as amended, and to file the same, with all exhibits thereto, and other documents in connection therewith, with the Securities and Exchange Commission, granting unto said attorneys-in-fact and agents, and each of them, full power and authority to do and perform each and every act and thing requisite and necessary to be done in connection therewith and about the premises, as fully to all intents and purposes as he or she might or could do in person, hereby ratifying and confirming all that said attorneys-in-fact and agents, or any of them, or their or his substitute or substitutes, may lawfully do or cause to be done by virtue hereof. Pursuant to the requirements of the Securities Act of 1933, as amended, this registration statement has been signed by the following persons in the capacities and on the dates indicated.
II-4
Table of ContentsExhibit index
II-5 | ||||||||||||||||||||||||||||||||||||||||||||||||||||||||||||||||||||||||||||||||||||||||||||||||||||||||||||||||||||||||||||||||||||||||||||||||||||||||||||||||||||||||||||||||||||||||||||||||||||||||||||||||||||||||||||||||||||||||||||||||||||||||||||||||||||||||||||||||||||||||||||||||||||||||||||||||||||||||||||||||||||||||||||||||||||||||||||||||||||||||||||||||||||||||||||||||||||||||||||||||||||||||||||||||||||||||||||||||||||||||||||||||||||||||||||||||||||||||||||||||||||||||||||||||||||||||||||||||||||||||||||||||||||||||||||||||||||||||||||||||||||||||||||||||||||||||||||||||||||||||||||||||||||||||||||||||||||||||||||||||||||||||||||||||||||||||||||||||||||||||||||||||||||||||||||||||||||||||||||||||||||||||||||||||||||||||||||||||||||||||||||||||||||||||||||||||||||||||||||||||||||||||||||||||||||||||||||||||||||||||||||||||||||||||||||||||||||||||||||||||||||||||||||||||||||||||||||||||||||||||||||||||||||||||||||||||||||||||||||||||||||||||||||||||||||||||||||||||||||