Attached files
| file | filename |
|---|---|
| 8-K - FORM 8-K - InterDigital, Inc. | w82758e8vk.htm |
Exhibit 99.1
| May 2011 Investor Presentation |

| This presentation contains "forward-looking statements" within the meaning of Section 27A of the Securities Act of 1933, as amended, and Section 21E of the Securities Exchange Act of 1934, as amended, regarding InterDigital, Inc.'s current beliefs, plans and expectations as to: (i) future results, projections and trends; (ii) its strategy; (iii) its 3G/4G revenue growth potential and the growth potential of its 3G/4G patent licensing program and 4G/LTE royalty rates; (iv) the development of next generation cellular technologies, including LTE and LTE-Advanced; (v) future global mobile device sales and market opportunities; (vi) selective acquisitions and investment opportunities; and (vii) planned R & D investment. Such statements are subject to the "safe harbor" created by those sections. Words such as "anticipate," "believe," "estimate," "expect," "project," "intend," "plan," "forecast," variations of any such words and similar expressions, and graphical charts and timelines representing future estimates or events are intended to identify such forward-looking statements. Actual results and events may differ materially from those described in any forward-looking statement as a result of certain risks and uncertainties, including, without limitation: (i) the market relevance of our technologies; (ii) changes in the needs, availability, pricing and features of competitive technologies as well as those of strategic partners or consumers; (iii) unanticipated technical or resource difficulties or delays related to further development of our technologies; (iv) our ability to leverage or enter into new customer agreements, strategic relationships or complementary investment opportunities on acceptable terms; (v) our ability to enter into additional patent license agreements; (vi) changes in expenses related to our technology offerings and operations; (vii) whether we have the appropriate financial assets and/or cash flows; (viii) unfavorable outcomes in patent disputes and the expense of defending our intellectual property rights; (ix) changes in the market share and sales performance of our primary licensees, and any delay in receipt of quarterly royalty reports from our licensees; (x) changes or inaccuracies in market projections; and (xi) our strategy to pursue complementary acquisitions and partnerships, as well as other risks and uncertainties, including those detailed in our Annual Report on Form 10-K/A for the year ended December 31, 2010 and our Quarterly Report on Form 10-Q for the quarter ended March 31, 2011 and from time to time in our other Securities and Exchange Commission filings. We undertake no obligation to update any forward-looking statement contained herein except as required by law. Safe Harbor Statement 2 |

| 3 InterDigital Snapshot 3 All trademarks are the sole property of their respective owners R&D, Montreal, Canada R&D, Melville, NY Headquarters, R&D, King of Prussia, PA InterDigital provides the technology that enables wireless communication ~ 180 engineers developing technology used in every cellular wireless device Portfolio of 18,500 issued patents and applications at year-end 2010 Covering a wide range of technologies, including 2G, 3G, 4G / LTE and IEEE 802 50% of 3G market under license at year-end 2010; 80% of 2G market licensed historically Strong 4G / LTE portfolio Cash and short-term investments of $527 million1; first quarter 2011 revenues $78.5 million $2.07 billion market cap2 R&D, San Diego, CA ___________________________ 1. As of March 31, 2011 2. As of May 2, 2011 |

| Investment Highlights Vendor agnostic wireless communications pure play Continuously developing fundamental wireless technology intellectual property that is incorporated into industry standards Secular revenue growth with large and growing addressable market $203bn handset market in 2010(1) ~ 50% plus of 3G market under license at year-end 2010 Potential for increased royalty rate from 4G / LTE Acquisitions Business model provides significant operating leverage Management team with a proven track record 4 ___________________________ Source: Gartner, Mobile Devices, Worldwide, 2007-2014, Q4 2010 Update. |
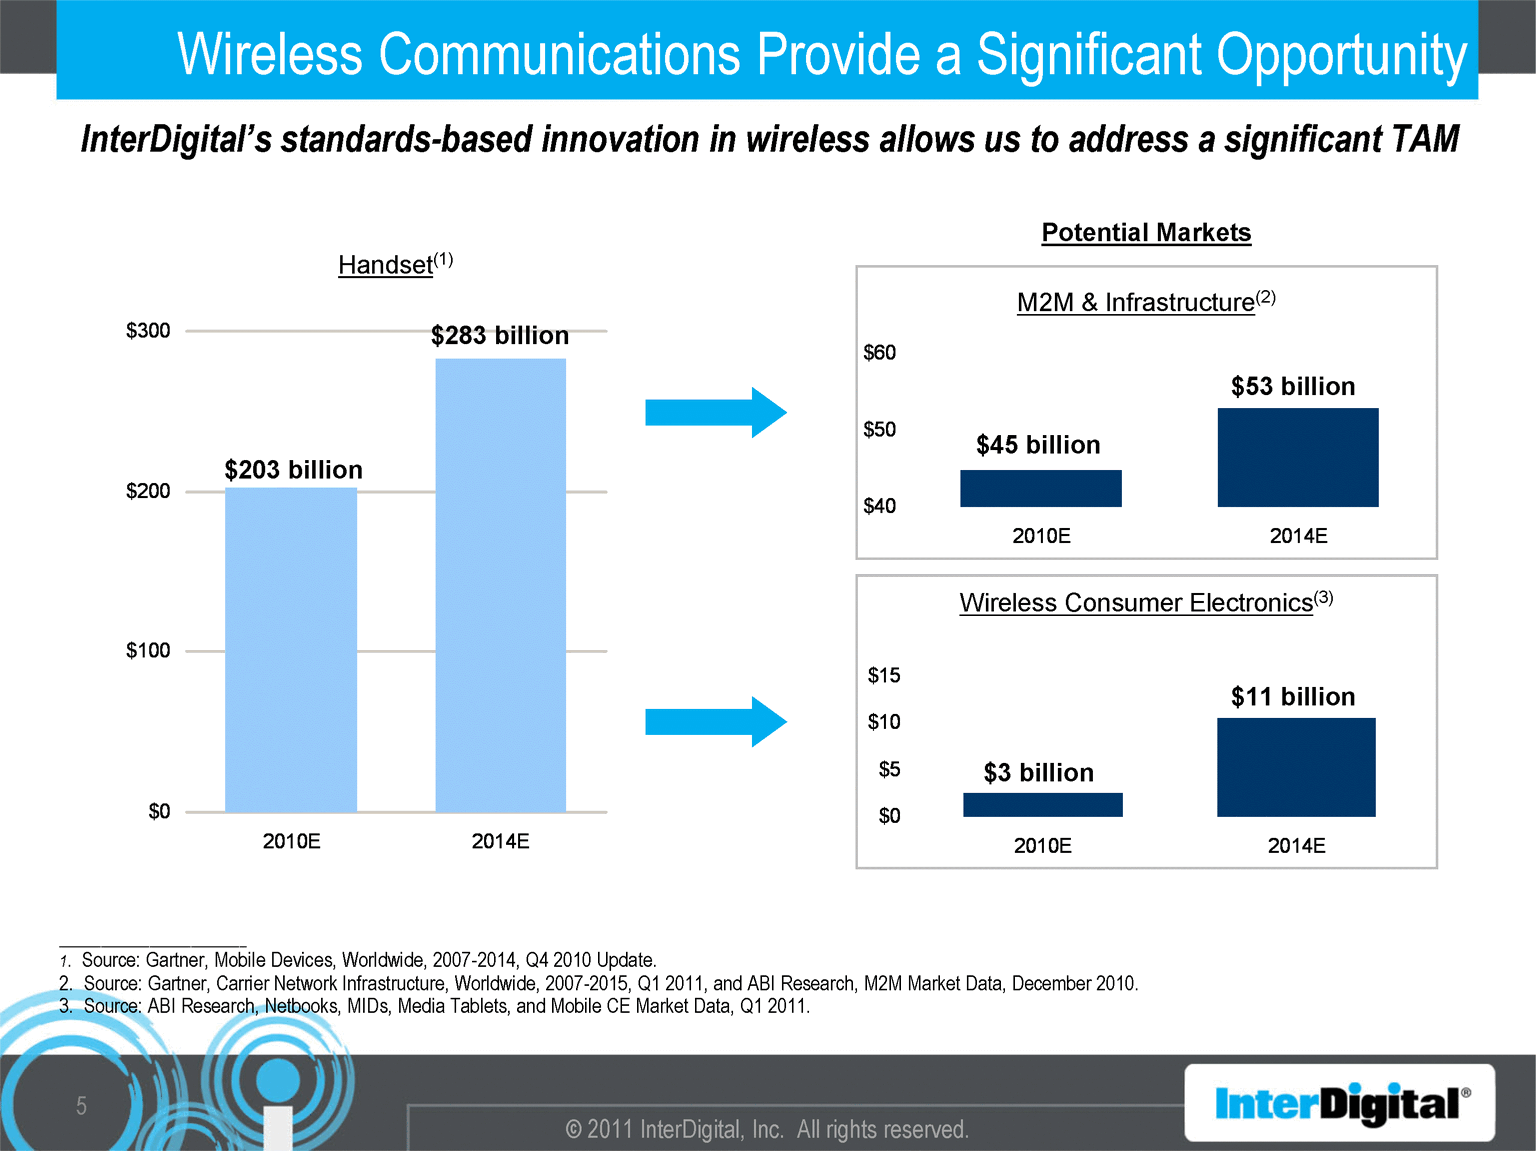
| Wireless Communications Provide a Significant Opportunity 5 InterDigital's standards-based innovation in wireless allows us to address a significant TAM Series 1 Series 2 Series 3 Series 4 Series 5 Series 6 Series 7 Series 8 2010E 202.612 1100 233 3961 2876 1297 466 267 2011 205 1100 269 3691 2876 1027 1333 303 2012 225 2013 245 2014E 282.983 Handset(1) $283 billion Series 1 Series 2 Series 3 Series 4 Series 5 Series 6 Series 7 Series 8 2010E 44.759 1100 233 3961 2876 1297 466 267 2011 45 1100 269 3691 2876 1027 1333 303 2012 47 2013 51 2014E 52.902 M2M & Infrastructure(2) $53 billion Series 1 Series 2 Series 3 Series 4 Series 5 Series 6 Series 7 Series 8 2010E 2.576 1100 233 3961 2876 1297 466 267 2011 4.6 1100 269 3691 2876 1027 1333 303 2012 7.4 2013 11.2 2014E 10.509 Wireless Consumer Electronics(3) $11 billion ___________________________ 1. Source: Gartner, Mobile Devices, Worldwide, 2007-2014, Q4 2010 Update. 2. Source: Gartner, Carrier Network Infrastructure, Worldwide, 2007-2015, Q1 2011, and ABI Research, M2M Market Data, December 2010. 3. Source: ABI Research, Netbooks, MIDs, Media Tablets, and Mobile CE Market Data, Q1 2011. Potential Markets $203 billion $3 billion $45 billion |

| InterDigital is a Wireless Industry Pioneer 6 Our technology is used in every cellular wireless communications device Invent Wireless Technologies Contribute to Standards License Patents Long history of developing wireless IP Provided technology to a number of industry leading innovations: Wideband communications Wireless data Focus on fundamental SA Wireless resource management Interference mitigation Involvement in standards drives relevance of patents Our technology is used in all 2G, 3G, LTE devices By working to develop the standards upon which wireless communications are based (e.g. 2G, 3G, LTE), we: Enhance relevance of our patents Help ensure our TAM We have demonstrated expertise in establishing licensing programs Handset OEMs negotiate agreements with us based on the relevance of the patent portfolio, and the agreements incorporate: Past sales (back payment for pre- license unit sales) Per-unit royalty payments Fixed fees Agreements last ~5 years |

| 2G / 2.5G 3G 4G 2009A 811 340 0 2010E 855 433 6 2011E 826 590 11 2012E 784 725 21 2013E 735 843 47 2014E 652 970 84 2015E 611 1049 129 Our Core Market Presents a Large, Growing Opportunity... 7 Trends Projected 1.2 billion unit opportunity in 3G / 4G in 2015 Target is to license 100% of 3G market 4G represents an opportunity for potentially higher royalties Significant prospects in other connected devices (tablets, PCs, e-readers, etc.) Worldwide Handset Shipments ___________________________ Source: iSuppli Mobile Handset Q1 2011 Market Tracker. Includes WiMAX and LTE. Largely Licensed (Units in Millions) Licensing Opportunity ~435 M units ~1,050 M units 4G Shipments ~130 M units 2010 - 2014 CAGR 2010 - 2014 CAGR 2G / 2.5G (8%) 3G 19% 4G (1) 87% Total 7% (1) |

| ...We Have A Solid 3G License Base... 8 Deals Samsung 0.202 Apple 0.096 LG 0.082 RIM 0.06 Sony Ericsson 0.052 Nokia 0.224 HTC 0.046 ZTE 0.043 Motorola 0.033 Huawei 0.032 Others 0.128 Under License as of 12/31/2010 Not Under License as of 12/31/2010 Mixed Others ___________________________ Source: Strategy Analytics, Vendor Share: Global Handset Market by Technology, 3Q 2010. 3G includes UMTS and 3G CDMA. Market shares represent 3Q 2010. LG's 3G license terminated on 12/31/2010 and has not yet been renewed. Global 3G Handset Market Shares (1) |

| ...A Strong Position in LTE... 9 Number of InterDigital US Patents and Applications Declared to ETSI for E-UMTS (LTE) (By Year Declared to ETSI) Number of InterDigital US Patents and Applications Declared to ETSI for UMTS (WCDMA) and E-UMTS (LTE) (Cumulative, by Year) ___________________________ The data in the tables presented above reflect the U.S. (i) patents, (ii) non-provisional patent applications and (iii) provisional patent applications declared to the European Telecommunications Standards Institute ("ETSI") for the UMTS (including UMTS/CDMA) (3G) and E-UMTS (LTE) projects, as applicable, through October 27, 2010 by InterDigital's patent holding subsidiaries. UMTS and E-UMTS stand for Universal Mobile Telecommunications System and Evolved Universal Mobile Telecommunications System, respectively. Some patents and applications have been declared to ETSI by InterDigital for both UMTS and E-UMTS and therefore are included in both the UMTS and the E-UMTS data above. The data above has been adjusted to reflect withdrawals of, and corrections made to, declarations of patents and applications as of October 27, 2010. Certain of the patent and application data provided above by InterDigital may not correlate to the data available on the ETSI IPR Database as a result of differences in compiling, organizing and displaying declaration data. In addition, the patent and application data provided above may not be comparable to similar data provided by other third parties due to, among other things, differences in ETSI database search methodologies and applicable time periods. The data in the tables above may include patents and applications that are directed to technology that is not, or may never be, deployed. InterDigital's presentation of this data is not a statement of the essentiality of the patents and applications referred to herein, nor is this data a substitute for an independent evaluation of essentiality. We believe we have one of the leading patent portfolios in LTE technology Significantly bigger opportunity in LTE as more devices available (tablets, e-readers, etc.) LTE royalty rates expected to be higher Series 1 Series 2 Series 3 Series 4 Series 5 Series 6 Series 7 Series 8 2007 49 1100 233 3961 2876 1297 466 267 2008 94 1100 269 3691 2876 1027 1333 303 2009 163 2010 293 UMTS (WCDMA) E-UMTS (LTE) Series 3 Series 4 Series 5 Series 6 Series 7 Series 8 2001 49 233 3961 2876 1297 466 267 2004 226 269 3691 2876 1027 1333 303 2007 338 49 2008 483 143 2009 626 306 2010 830 599 |

| Sensors ...And We Are Positioned to Benefit from Next-Generation Networks Cellular WiMax WiFi Mesh Ambiance Femto Relays Ubiquitous Connectivity: - Billions of subscribers - Trillions of connections - Seamlessly connected and fully integrated 10 |
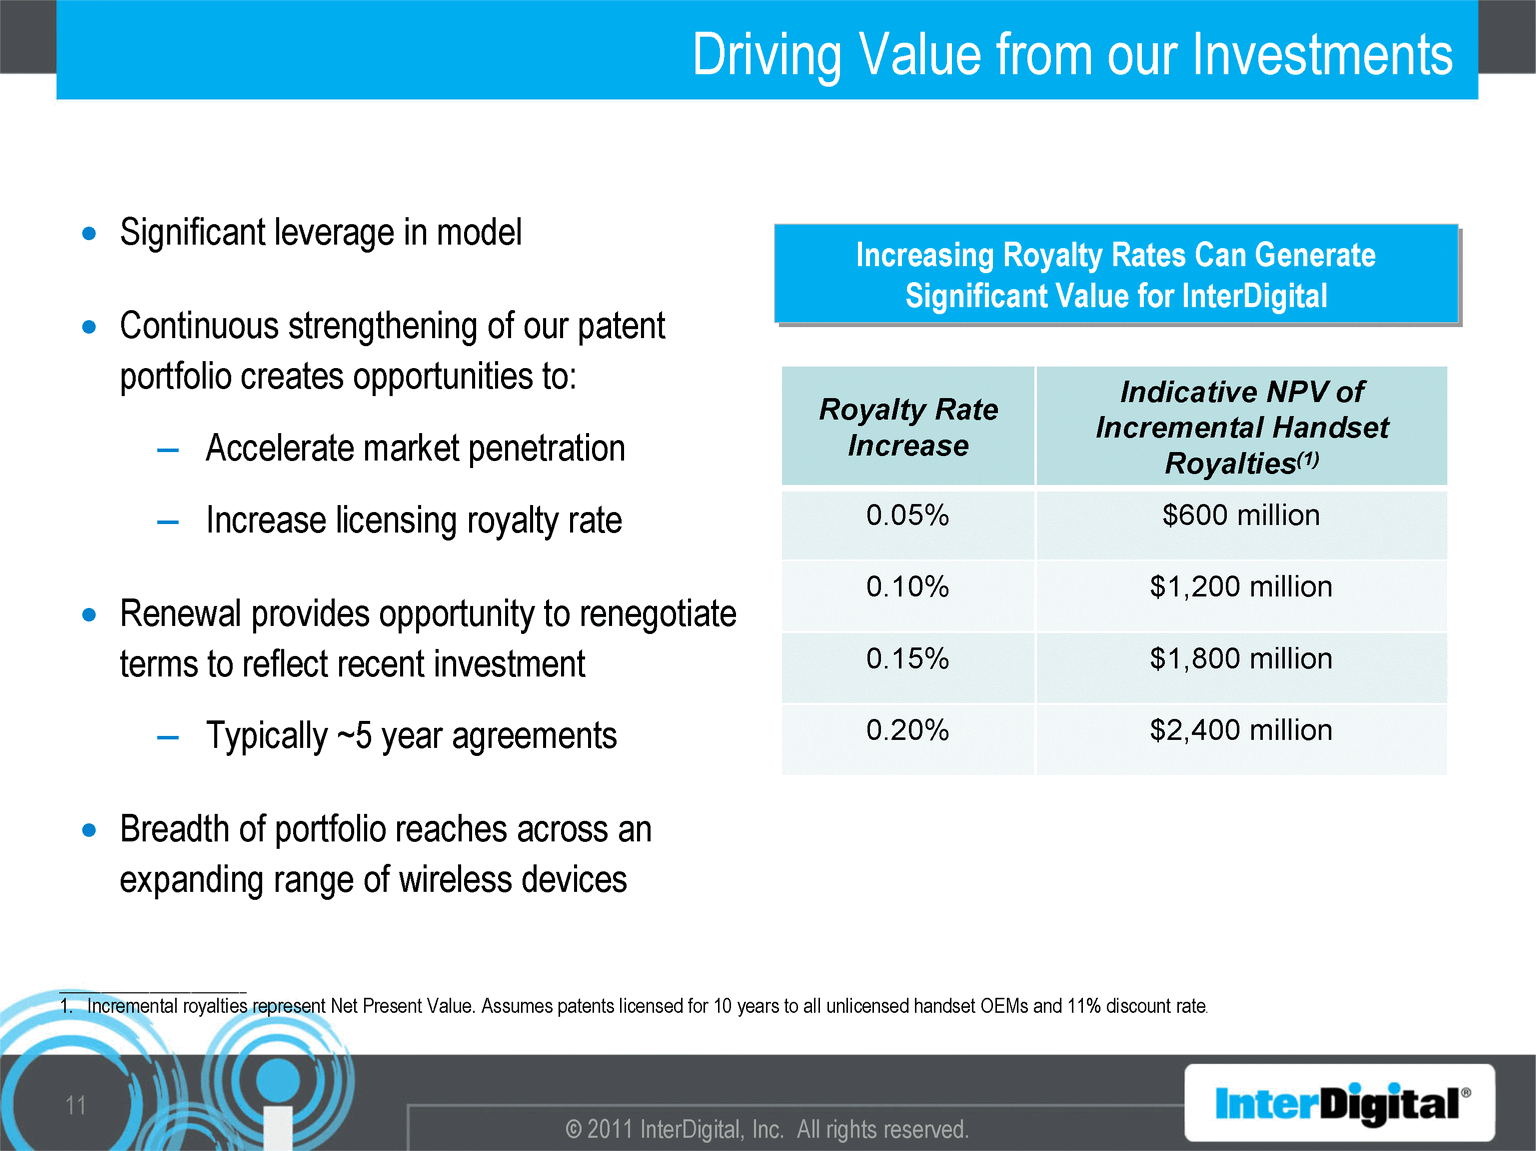
| Driving Value from our Investments 11 Increasing Royalty Rates Can Generate Significant Value for InterDigital Royalty Rate Increase Indicative NPV of Incremental Handset Royalties(1) 0.05% $600 million 0.10% $1,200 million 0.15% $1,800 million 0.20% $2,400 million Significant leverage in model Continuous strengthening of our patent portfolio creates opportunities to: Accelerate market penetration Increase licensing royalty rate Renewal provides opportunity to renegotiate terms to reflect recent investment Typically ~5 year agreements Breadth of portfolio reaches across an expanding range of wireless devices ___________________________ Incremental royalties represent Net Present Value. Assumes patents licensed for 10 years to all unlicensed handset OEMs and 11% discount rate. |
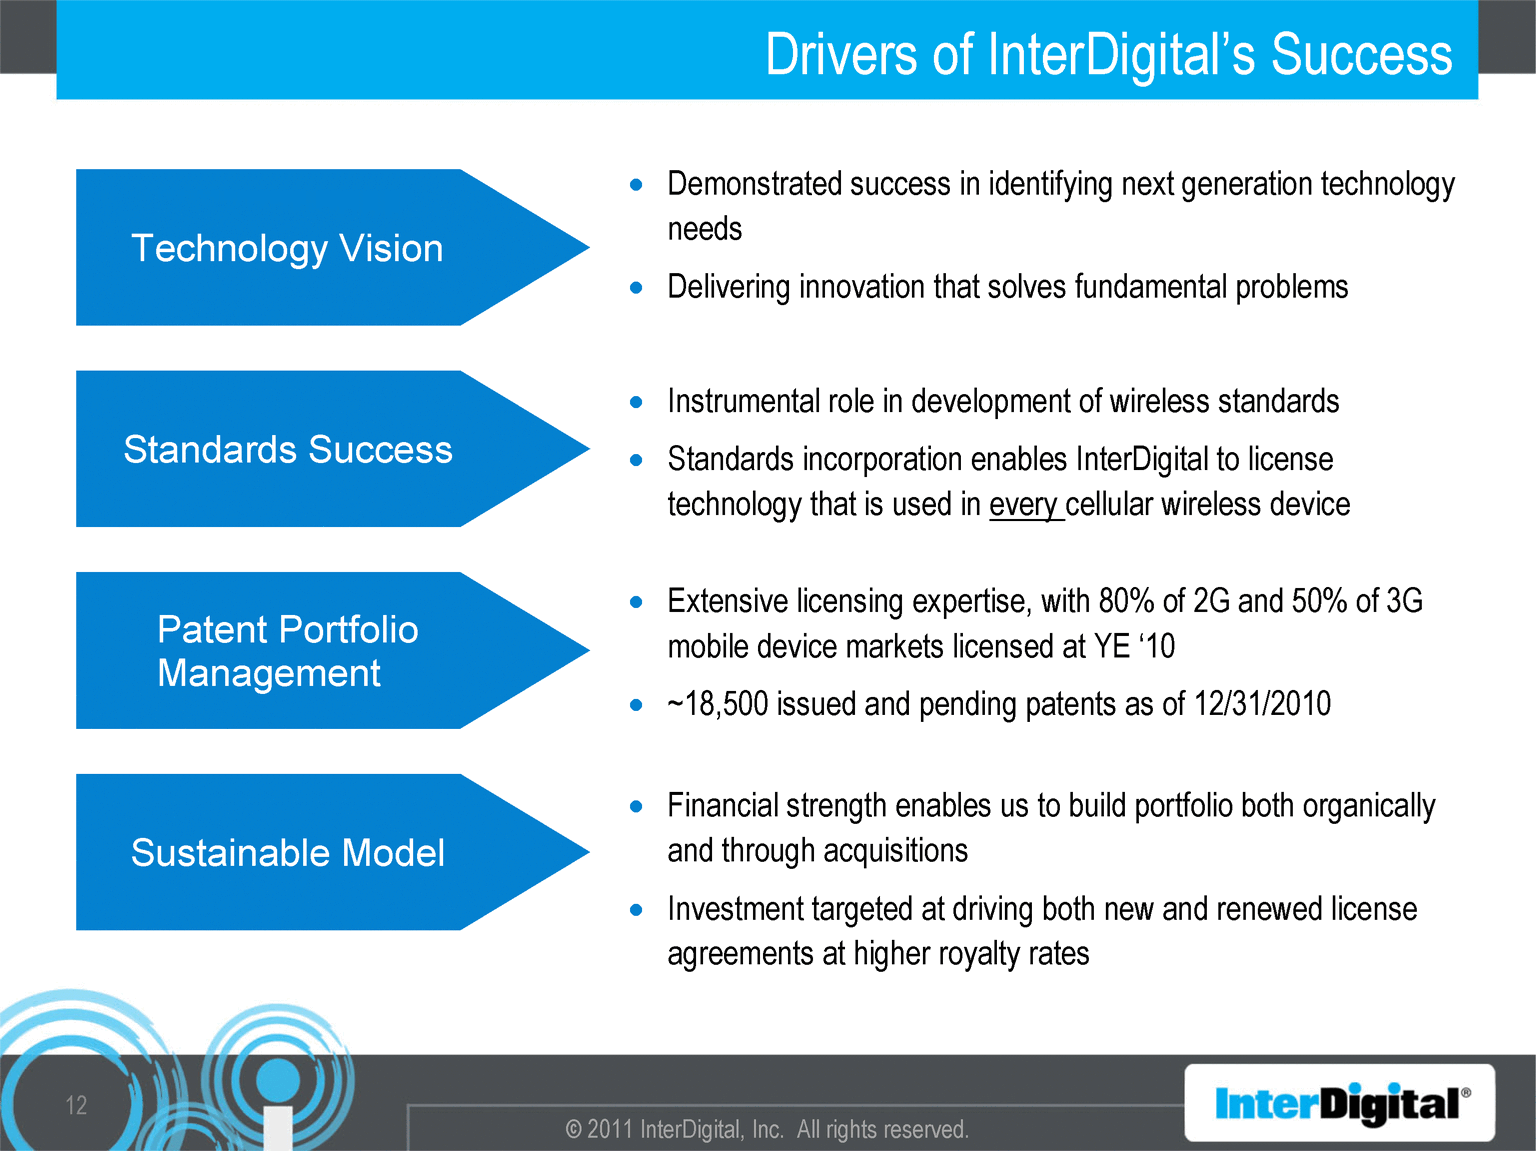
| Drivers of InterDigital's Success 12 Extensive licensing expertise, with 80% of 2G and 50% of 3G mobile device markets licensed at YE '10 ~18,500 issued and pending patents as of 12/31/2010 Financial strength enables us to build portfolio both organically and through acquisitions Investment targeted at driving both new and renewed license agreements at higher royalty rates Instrumental role in development of wireless standards Standards incorporation enables InterDigital to license technology that is used in every cellular wireless device Technology Vision Patent Portfolio Management Sustainable Model Standards Success Demonstrated success in identifying next generation technology needs Delivering innovation that solves fundamental problems |
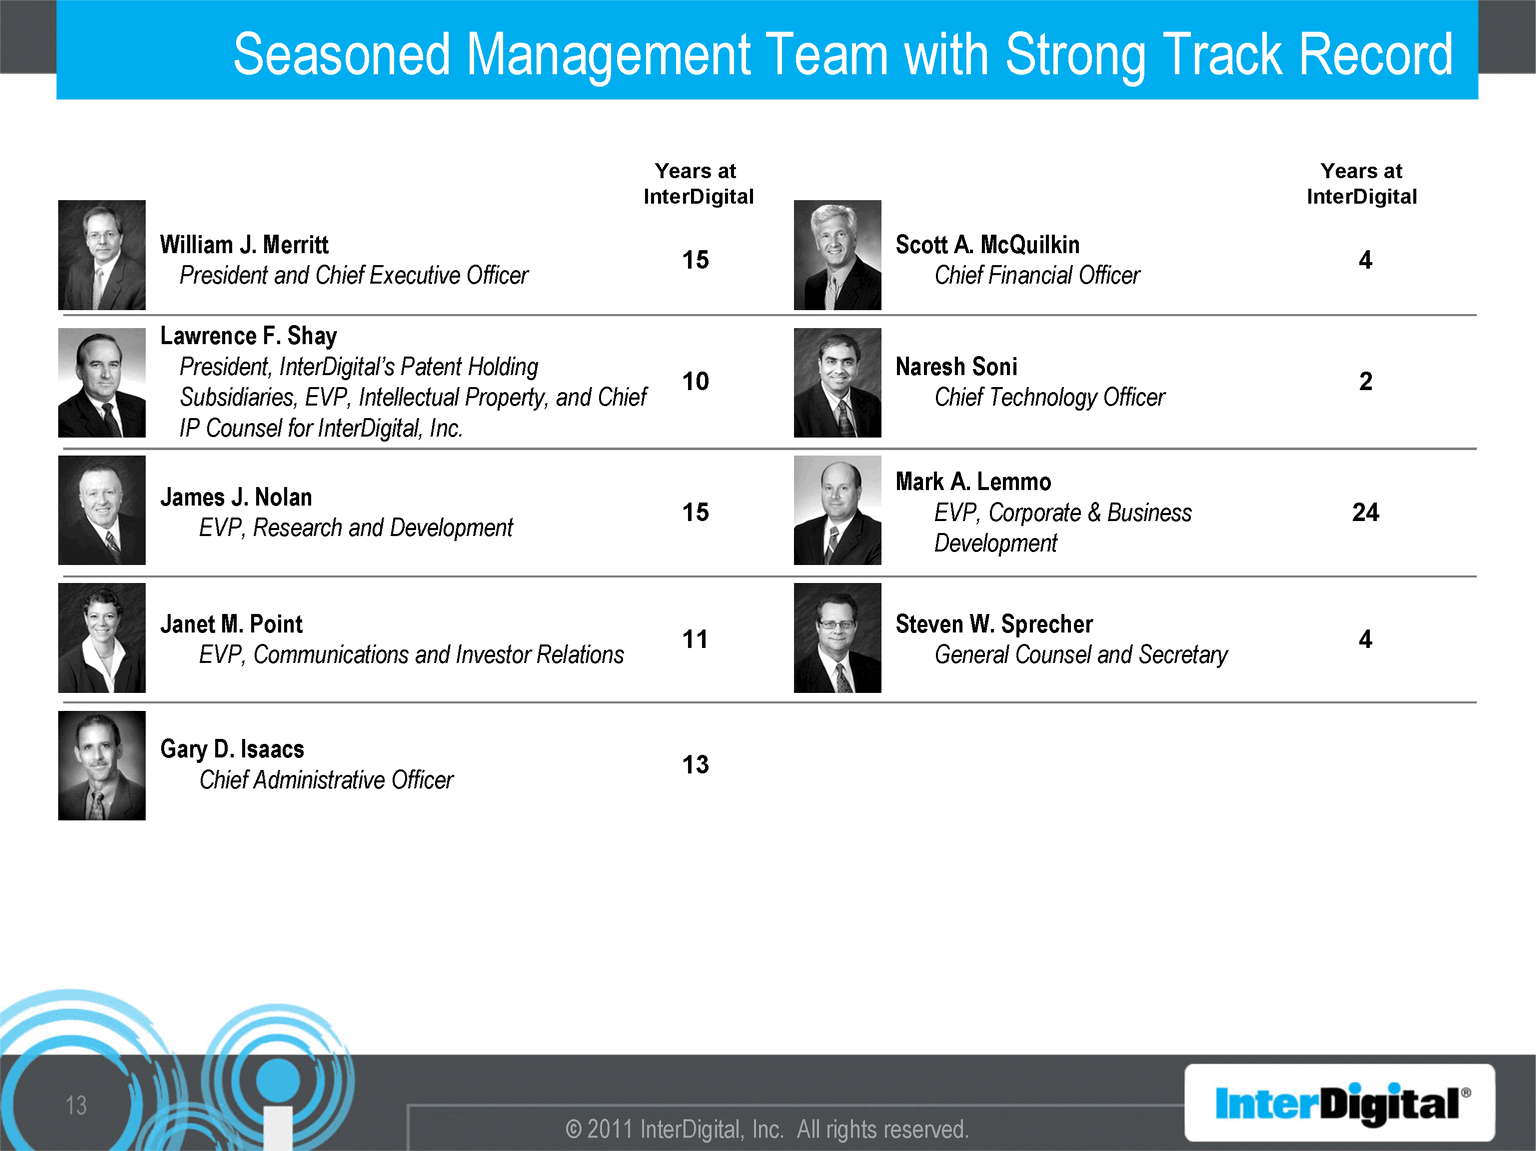
| William J. Merritt President and Chief Executive Officer 15 Scott A. McQuilkin Chief Financial Officer 4 Lawrence F. Shay President, InterDigital's Patent Holding Subsidiaries, EVP, Intellectual Property, and Chief IP Counsel for InterDigital, Inc. 10 Naresh Soni Chief Technology Officer 2 James J. Nolan EVP, Research and Development 15 Mark A. Lemmo EVP, Corporate & Business Development 24 Janet M. Point EVP, Communications and Investor Relations 11 Steven W. Sprecher General Counsel and Secretary 4 Gary D. Isaacs Chief Administrative Officer 13 Seasoned Management Team with Strong Track Record Years at InterDigital 13 Years at InterDigital |

| Financial Highlights Strong balance sheet Cash and short term investments of $527 million as of March 31, 2011 $230 million in senior convertible notes issued on April 4, 2011 in private placement transaction $78.5 million of revenues, net income of $23.3 million in first quarter 2011 Predictable revenues based on existing licensing contracts Momentum from new agreements Acer, Inc. (covers 2G, 3G, and 4G wireless technologies) Significant operating leverage 14 |

| Demonstrated Steady Revenue Growth Series 1 2001 52.6 2002 87.9 2003 114.6 2004 103.7 2005 163.1 2006 227.5 253 480.5 2007 234.2 2008 228.5 2009 297.4 2010 394.5 Historical Revenue Performance ___________________________ Red dotted bar represents $253mm of revenue recognition related to resolution of patent licensing matters with Nokia. 2001 - 2010 CAGR: +25% 15 |

| Net Margin 2007 0.09 2008 0.11 2009 0.29 2010 0.39 EPS 2007 0.4 2008 0.57 2009 1.97 2010 3.43 Secular Revenue Growth and Strong Leverage Revenues EPS 2007 234.2 -0.2 2008 228.5 0.59 2009 297.4 0.7 2010 394.5 0.88 ($ in Millions) Historical Revenues Historical Net Margins(1) 16 (% of Revenues) ($) Historical Diluted EPS ___________________________ Note: All metrics are GAAP. Source: InterDigital financial statements. Net margins represent net income applicable to common shareholders divided by revenues. |

| 17 R&D Spending By Selected Technology Licensing Companies Annual R&D Spending (2007 - 2010) 2007 2008 2009 2010 Series 5 Series 6 Series 7 Series 8 IDCC 85.2 98.9 64 71.5 2876 1297 466 267 TSRA 37.5 61.6 65.9 74.1 2876 1027 1333 303 ACTG 0.9 0.9 1.7 2.1 RMBS 82.9 76.2 67.3 92.7 ARMH 136 141.8 181.7 226.3 DLB 49.2 79.1 88.8 110.5 QCOM 1900 2374 2432 2624 2007 2008 2009 2010 Series 5 Series 6 Series 7 Series 8 IDCC 0.364 0.433 0.215 0.181 2876 1297 466 267 QCOM 0.204 0.212 0.23 0.225 2876 1027 1333 303 TSRA 0.192 0.248 0.22 0.246 ACTG 0.017 0.019 0.025 0.016 RMBS 0.461 0.535 0.595 0.287 ARMH 0.324 0.293 0.368 0.344 DLB 0.093 0.118 0.117 0.117 (1) ($ in Millions) (% of Revenues) R&D Spending as a % of Revenues (2007 - 2010) ___________________________ Source: Company filings. Note: All figures calendar year. 1. Converted to USD at spot exchange rate as of 3/25/2011. QCOM R&D Spending is 10~20x higher than "peers" 2007 2008 2009 2010 Series 5 Series 6 Series 7 Series 8 IDCC 85.2 98.9 64 71.5 2876 1297 466 267 TSRA 37.5 61.6 65.9 74.1 2876 1027 1333 303 ACTG 0.9 0.9 1.7 2.1 RMBS 82.9 76.2 67.3 92.7 ARMH 135.9 141.7 181.5 226.1 DLB 49.2 79.1 88.8 110.5 QCOM 1900 2374 2432 2624 ($ in Millions) |

| 18 R&D Investment Well-Aligned to Business Priorities Source: Company Management R&D Investment = Planned 2011 R&D Spending and Related Capex, CTO Office and Platform Development Cellular Evolution 41% Incubation 17% Advanced Networks 42% Core (51%) Adjacent (49%) R&D Investment |
| End |
