Attached files
| file | filename |
|---|---|
| 8-K - FORM 8-K - HERITAGE FINANCIAL CORP /WA/ | d8k.htm |
 Exhibit 99.1 |
 Forward Looking
Statements 2
“Safe Harbor” statement under the Private Securities Litigation Reform Act of 1995:
This presentation contains forward-looking statements that are subject to risks and
uncertainties, including, but not limited to: the credit risks of lending activities,
including changes in the level and trend of loan delinquencies and write-offs and changes in our
allowance for loan losses and provision for loan losses that may be impacted by deterioration
in the housing and commercial real estate markets; changes in general economic
conditions, either nationally or in our market areas; changes in the levels of general
interest rates, and the relative differences between short and long term interest rates, deposit
interest rates, our net interest margin and funding sources; fluctuations in the demand for
loans, the number of unsold homes and other properties and fluctuations in real estate
values in our market areas; results of examinations of us by the Board of Governors of the
Federal Reserve System (the “Federal Reserve Board”) and of our bank subsidiaries by
the Federal Deposit Insurance Corporation (the “FDIC”), the Washington State
Department of Financial Institutions, Division of Banks (the “Washington DFI”) or other regulatory
authorities, including the possibility that any such regulatory authority may, among other
things, require us to increase our reserve for loan losses, write-down assets, change our
regulatory capital position or affect our ability to borrow funds or maintain or increase
deposits, which could adversely affect our liquidity and earnings; legislative or regulatory
changes that adversely affect our business including changes in regulatory policies and
principles, including the interpretation of regulatory capital or other rules, the
interpretation of regulatory capital or other rules including changes from the Dodd-Frank
Act and regulations that have been or will be promulgated thereunder; our ability to
control operating costs and expenses; the use of estimates in determining fair value of
certain of our assets, which estimates may prove to be incorrect and result in significant
declines in valuation; difficulties in reducing risk associated with the loans on our balance
sheet; staffing fluctuations in response to product demand or the implementation of
corporate strategies that affect our workforce and potential associated charges; computer
systems on which we depend could fail or experience a security breach; our ability to
retain key members of our senior management team; costs and effects of litigation, including
settlements and judgments; our ability to implement our branch expansion strategy; our
ability to implement our expansion strategy; our ability to successfully integrate any assets, liabilities, customers, systems, and management personnel we have acquired
including the Cowlitz Bank and Pierce Commercial Bank transactions or may in the future
acquire into our operations and our ability to realize related revenue synergies and cost
savings within expected time frames and any goodwill charges related thereto; or may in the
future acquire into our operations and our ability to realize related revenue synergies
and cost savings within expected time frames and any goodwill charges related thereto; risks relating to acquiring assets or entering markets in which we have not
previously operated and may not be familiar, changes in consumer spending, borrowing and
savings habits; the availability of resources to address changes in laws, rules, or
regulations or to respond to regulatory actions; adverse changes in the securities markets;
inability of key third-party providers to perform their obligations to us; changes in
accounting policies and practices, as may be adopted by the financial institution regulatory
agencies or the Financial Accounting Standards Board, including additional guidance and
interpretation on accounting issues and details of the implementation of new accounting methods; other economic, competitive, governmental, regulatory, and technological
factors affecting our operations, pricing, products and services; and other risks detailed
from time to time in our filings with the Securities and Exchange Commission.
The Company cautions readers not to place undue reliance on any forward-looking
statements. Moreover, you should treat these statements as speaking only as of the date they
are made and based only on information then actually known to the Company. The Company does
not undertake and specifically disclaims any obligation to revise any forward-
looking statements to reflect the occurrence of anticipated or unanticipated events or
circumstances after the date of such statements. These risks could cause our actual results
for 2011 and beyond to differ materially from those expressed in any forward-looking
statements by, or on behalf of, us, and could negatively affect the Company’s operating and
stock price performance. |
 Overview
Company & Economic Information
Recent Achievements
Financial Performance
Peer Group Analysis
Continuing Strategies
3 |
 4
|
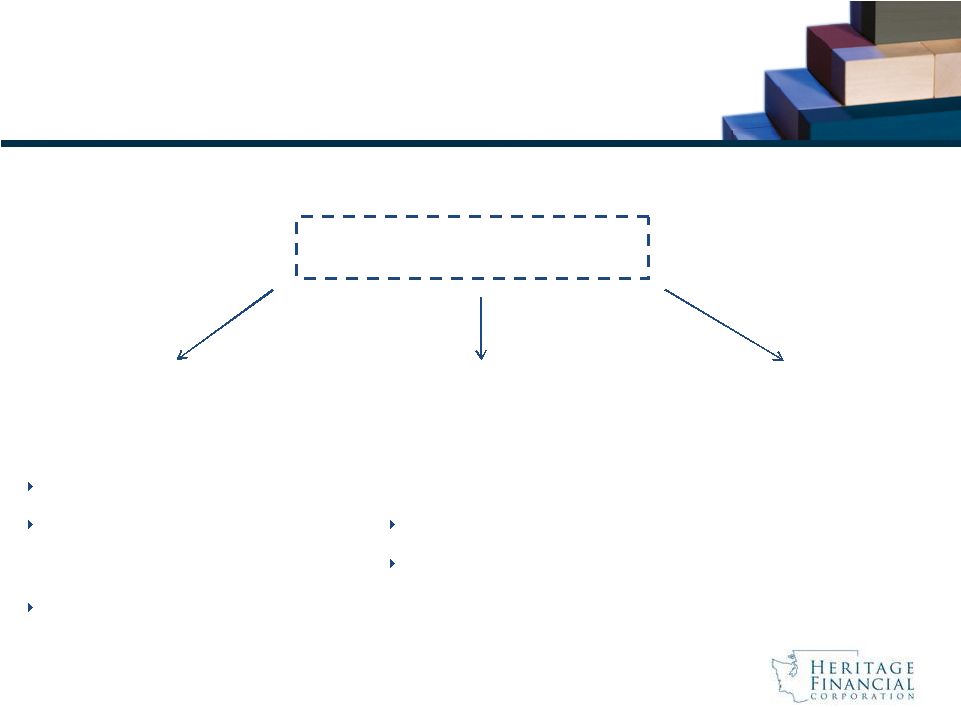
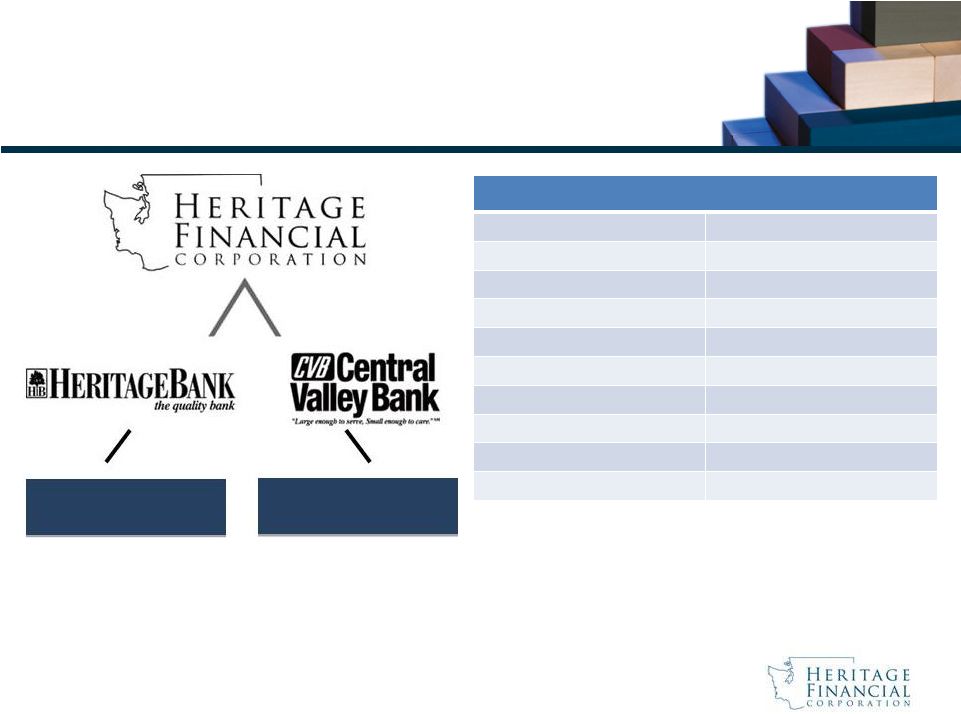 Corporate
Structure Total assets: $1.17 billion
Branches: 26
Total assets: $160.0 million
Branches: 6
Financial Highlights
Total Assets
$1.34 billion
Net Loans
$965 million
Total Deposits
$1.1 billion
Tangible Common Equity
$188.5 million
Loan/Deposit Ratio
87.8%
Coverage Ratio (1)
83.2%
Core Deposit Ratio (2)
81.6%
Net Interest Margin
5.08% (Q1’11) 4.78% (FY2010)
Cost of Funds
0.82% (Q1’11) 1.02% (FY2010)
PTPP ROAA (3)
1.63% (Q1’11) 2.76% (FY2010)
(1) Allowance for loan loss/nonperforming loans (originated loans only)
(2) All deposits less brokered CDs and CDs over $100,000
(3) Pre-tax, pre-provision return on average assets
Note: Numbers rounded for presentation purposes only
Financial data as of March 31, 2011 unless otherwise indicated
5 |
 Economic
Outlook We have not yet achieved measurable and
sustainable economic growth in the Pacific
Northwest
Our local economy will continue to struggle
until unemployment and real estate values
improve
However, we are beginning to see signs of
improvement in some areas
6 |
 |
 Award
Recognition 8
Washington Best Workplaces –
Bronze Award -
2010
(Puget Sound Business
Journal)
Silver Award -
2009
Top Places to Work –
Large Company and Equity Award -
2009
(Business Examiner)
Best Bank in the South Sound –
2008, 2010
(The Olympian)
Best of the Northwest for 2009
Top 20 Companies of the Decade
Publically
Traded
PNW
Companies
-
Debt
Free
for
2009
(The Seattle Times)
Washington State Financial Services Champion of the Year –
2009, 2010
(Seattle District of the US Small Business Administration)
The 100
Best
Companies
to
Work
For
–
2
nd
Midsized
Companies
-
2010
(Seattle Business Magazine) |
 Raised $54
million in net proceeds from December 2010 public offering
Redeemed $24 million TARP preferred
securities in December 2010
Capital
9 |
 Where We Were
(June 30, 2010) Where We Are Now
(Existing Branches) -
Total Branches 20
20 Legacy Heritage / Central
Valley branches
2 Organic de novo branches
in Pierce County
9 Acquired Cowlitz branches
1 Acquired Pierce
Commercial branch
Acquisition strategy –
continue to execute on our strategic growth goals
Due to continuing Pacific Northwest market turmoil we expected opportunities like these would
be coming, and have been preparing accordingly:
Evaluating and prioritizing targets
Scaling infrastructure to support growth
Sharpening operating focus, execution, and integration
To date we have completed two FDIC-assisted acquisitions
Positioned for further growth in two of the largest markets in the Pacific Northwest (Seattle
and Portland) Recently announced Kent branch acquisition expected to be completed
in June 2011 Expanding our Markets
(New Branches) -
Total Branches 32
10 |
 11
FDIC-Assisted Acquisitions
Cowlitz Bank / Bay Bank
Pierce Commercial Bank
Date of acquisition -
July 30, 2010
Date of acquisition -
November 5, 2010
Nine branches
One branch
Entered into two largest markets in the Pacific
NW: Seattle/Bellevue & Portland/Vancouver
Increased market position in Pierce County
(Tacoma) to the 2
nd
largest community bank
(based on deposits)
Acquired $145 million in loans & $166 million in
deposits (excluding wholesale CDs) at fair value
Acquired $143 million in loans & $125 million in
deposits (excluding wholesale CDs) at fair value
Modified whole bank with loss share structure
(excluded NPAs as of bid valuation date)
Whole bank without loss share
$8.8 million negative asset bid with a 1% deposit
premium resulting in an after-tax gain on
acquisition of $285,000
$41.2 million negative asset bid with a 1% deposit
premium resulting in an after-tax gain on
acquisition of $7.4 million
Systems conversion completed in November
Systems conversion completed in March |
 De Novo
Branching Opened Sumner Branch in 2008
Opened Puyallup, WA branch in September 2010
Opened Gig Harbor, WA in February 2011
Plan to acquire/build 1-2 branches per year in strategic growth locations
2010/2011 Talent Recruitment
Since September we have hired 9 new lenders
A team of 3 lenders in Pierce County (Puyallup)
3 new lenders for King Co. (Seattle/Bellevue/Kent)
2 new lenders for Vancouver WA/Portland OR
1 new lender for Olympia
Continue to seek first-class seasoned C&I bankers to join our team
12
Organic Growth |
 Largest State
Banks Source: Puget Sound Business Journal: April 1 –
7, 2011
The largest banks based in Washington State are ranked by total
assets as of Dec. 31, 2010
* Announced Sale
13 |
 |
 Loan and Deposit
Growth 15 |
 16
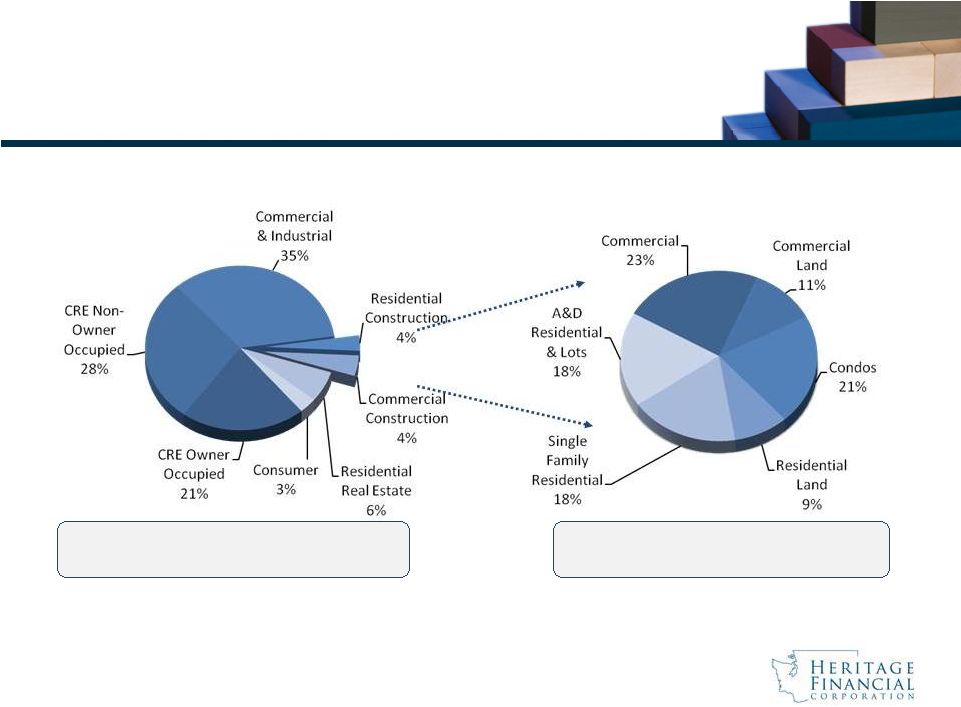
Originated Loan Portfolio
Construction Portfolio
Financial data as of March 31, 2011 and does not include loans purchased in the
Cowlitz Bank and Pierce Commercial Bank acquisitions.
Total Originated Loans: $755 million
Total Construction Loans: $60 million
Diversified Loan Portfolio |
 Deposit Composition (June 30, 2010)
Attractive Deposit Base
Deposit Composition (December 31, 2010)
Financial Data as of March 31, 2011
–
Total Deposits
$1.1 billion
–
Total Non-Maturity Deposits
$741 million
–
Non-Maturity Deposits / Total Dep.
67.4%
–
Non-Int. Bearing Dep. / Total Dep.
17.2%
–
Cost of Int. Bear. Deposits
0.82%
–
Cost of Deposits
0.68%
17 |
 Quarterly
Earnings Annual Earnings
Annual Earnings
18 |
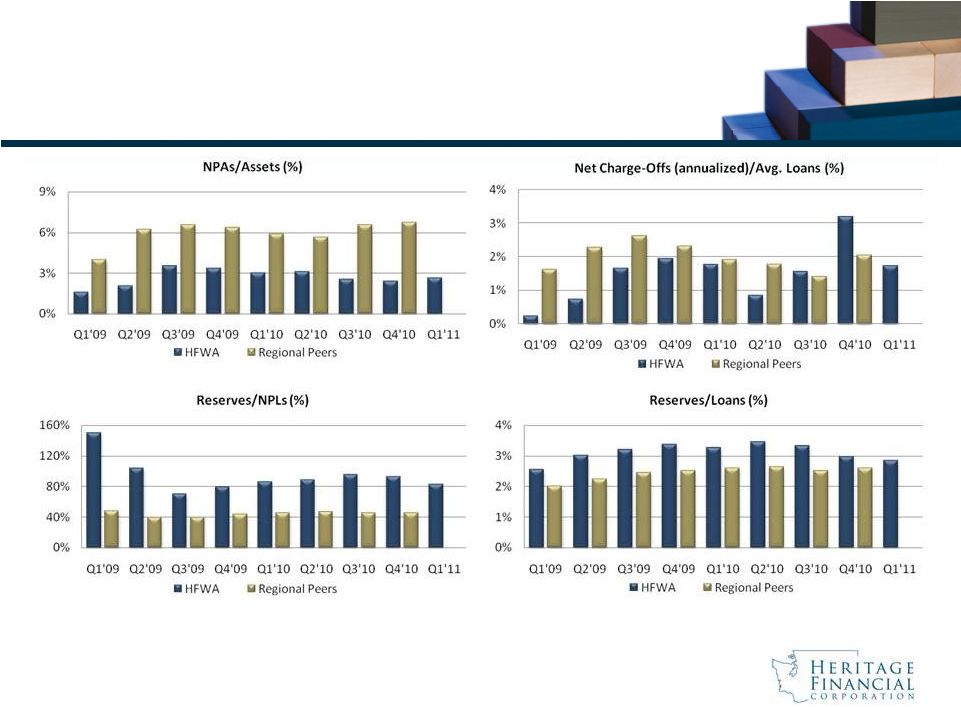 Peer Source:
SNL Financial Regional Peer Group (13): Ticker Symbols –
BANR, CACB, CASB, COLB, FFNW, HOME, NRIM, PCBK, PRWT,
RVSB, TSBK, WBCO, WCBO.
Loan Provisioning
19 |
 Equity
Growth 2008 –
Issued $24 million preferred securities in TARP
2009 –
Raised $47 million in common equity
2010 –
Raised $54 million in common equity and re-purchased TARP
20 |
 Strong Capital
Levels 21
Peer Source: SNL Financial
Regional Peer Group (13)
All Ratios as of December 31, 2010 |
 Dividend
Announcement The Board has approved a $0.03 dividend for
shareholders of record on May 13, 2011 and
payable on May 27, 2011
22 |
 |
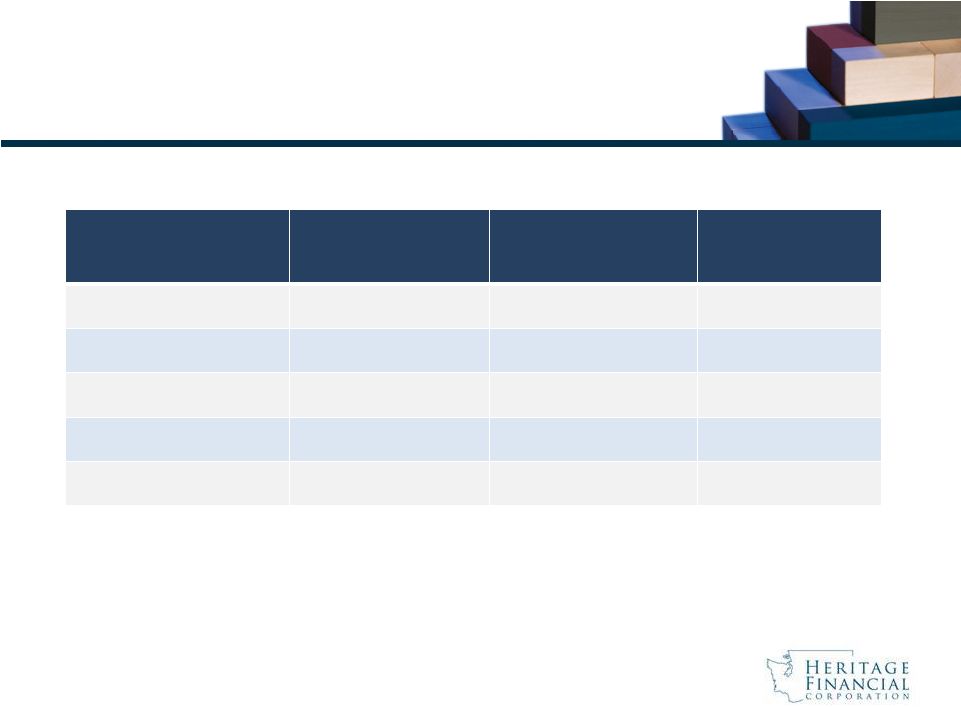 Peer Group
Analysis 24
Peer Source: SNL Financial
*Stock pricing as of 4/29/2011
Heritage Financial
(3/31/11)
Heritage Financial
(12/31/10)
Peer Group Median
(12/31/10)
TCE Ratio (%)
14.3
13.8
8.8
NPLs/Loans (%)
3.4
3.2
5.4
Reserves/NPLs (%)
83.2
93.2
46.7
ROAA (%)
0.23
1.16
(0.34)
Price/Tangible Book (%)*
122.4
119.4
92.7 |
 |
 26
Growth Strategy
We believe in a three pronged approach to our growth strategy.
Our Approach
Open Bank Acquisitions
Will Opportunistically Review
Organic Growth
De Novo Branching
Capitalizing On Market
Dislocations
Increase market share
Attract new talent
FDIC-Assisted Acquisitions
Experienced and Disciplined
Bidder
Two winning bids
Multiple deals in which we
bid we were not the winning
bidder
Decided not to bid on
multiple deals after
conducting due diligence |
 27
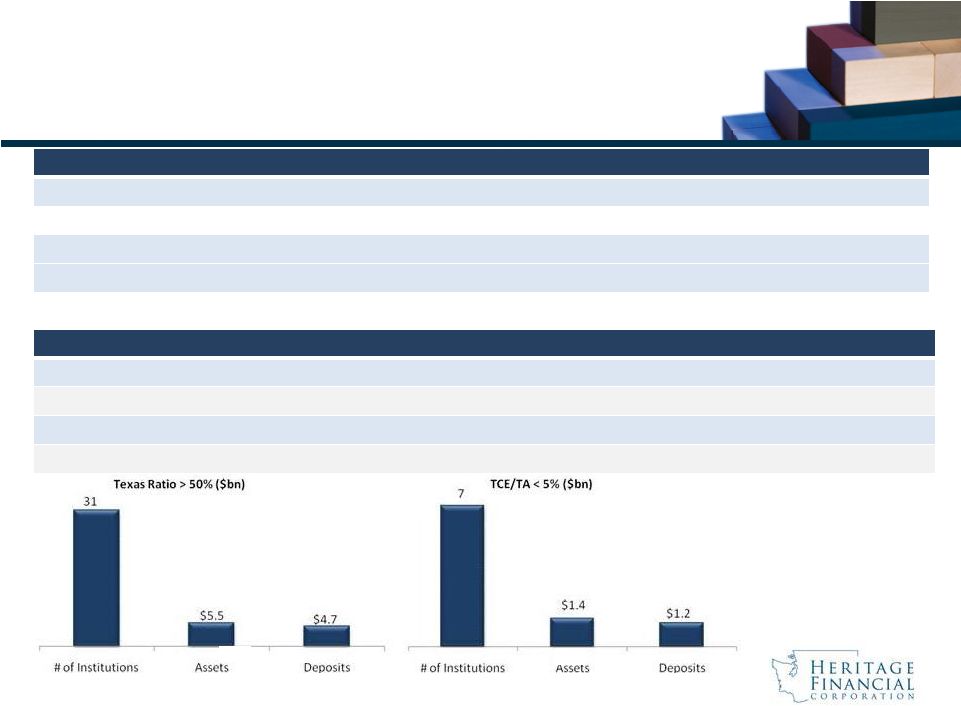
Acquisition Considerations
Fill in or expand geographic footprint
Opportunity to take advantage of FDIC loss share agreements
Strengthen market share
Potential to significantly grow our company
Source: SNL Financial data as of December 31, 2010. Data from charts above is
from WA & OR banks and thrifts with a Texas Ratio* greater than 50%
and assets under $500 million *(Non performing loans + Real Estate Owned)
divided by the sum of tangible common equity capital and loan loss reserves Potential
Acquisitions Summary of Analysis
18
Washington & Oregon banks and thrifts with a Texas Ratio* greater than
100% 14 Washington & Oregon banks and thrifts with a Texas Ratio*
greater than 100% and assets under $500 million 31 Washington & Oregon
banks and thrifts with a Texas Ratio* greater than 50% and assets under $500 million
28 Washington & Oregon banks and thrifts with a Texas Ratio* greater than
50% and assets under $300 million 7 Washington & Oregon banks and
thrifts with TCE / TA less than 5% and assets under $500 million |
 Experienced
management team with a proven track record
Building long-term franchise value while positioning
the Company for sustainable profitability
Legacy franchise remains intact with favorable
financial performance trends; allows us to continue
to play offense
Well positioned for continued growth in the Pacific
Northwest markets
Summary
28 |
 |