Attached files
| file | filename |
|---|---|
| 8-K - FIRST UNITED CORP/MD/ | v222085_8k.htm |
Exhibit 99.1
Slide 1: Welcome
FIRST UNITED CORPORATION
Management’s Presentation - 2011 Annual Meeting of Shareholders
May 12, 2011
Slide 2: Bill Grant
Good Morning fellow shareholders, and welcome to the 2011 Shareholders’ Meeting.
Slide 3: Forward looking Statements
Before starting, I do want to direct your attention to the Forward Looking Statement Disclaimer displayed for you.
Our presentation will be different this morning. Rather than hearing about the various areas within your Company, we will focus on a number of topics which, I believe, may be of greater interest to you today. Part of the presentation will follow along the lines of my Annual Letter to you. That is, we will review the circumstances that led to our challenges over the last three years, together with a review of the steps that put us on that path. We will then explore where we are today, and Carissa Rodeheaver, Executive Vice President and Chief Financial Officer, will guide you through several charts that illustrate both the financial performance and asset quality of the Company. We will then provide you with responses to a series of questions which we think may be on the minds of some of you. The questions were derived from actual questions that we have received from shareholders and customers over the last several months, together with questions we anticipate may be relevant. Finally, we will give you insight on where the Company is going and the plans for its return to strength and success in the future.
1
Slide 4: Corporate Overview
For some of you that attended last year’s meeting, the rationale behind our path that led to difficulties will be a review. It is important however to lay it out again so that we have the proper context. Going back to 2006 and 2007, your Company embarked on expansions into new growth markets through branch expansions into Morgantown and Martinsburg WV, and Frederick and Hagerstown, MD. The reason for expansion was to foster profitable growth in these growing markets. Growth within the traditional markets where the Bank had been became slow and stagnant. The efforts in the new areas would provide growth opportunities. There would, however, be a “ramp-up” period where we would have the expenses associated with the new branches, but the offsetting growth would take a while.
In an effort to temporarily offset this lag in earnings, effort would be made to grow our earning assets through the acquisition of institutional quality securities called trust preferreds, and participation interests in select loans made by other banks. These steps were designed to bridge our earnings growth over the 3-4 year period needed to reap the benefits of expansion into the new growth regions.
As we modeled these moves, it did increase slightly the risk portfolio of the Company. What could not be modeled was the severity and speed of the Great Recession. The speed of deterioration of the trust preferreds was beyond any modeling. As I mentioned last year, the rating agencies abruptly dropped most of them in an unprecedented five classifications at one time. The onset of difficulties within our loans also came on much more quickly than we or industry experts projected. Recall, if you please, my presentation from last year’s meeting which recounted the national and global issues that surfaced very quickly. This year, I would like to offer a different perspective on this matter.
2
One of my interests outside of banking is American History, and I think it has provided me with an excellent analogy as where the Company is. The last three years have been WWII for First United. WWI for the Company was the Great Depression, and I will comment on that later. This war began on April 3, 2008; the day the Company was notified that the rating agencies unexpectedly decided to drop the ratings on the trust preferreds in our investment portfolio five classifications overnight. This dropped them below investment grade without time to analyze any course or strategy that would have allowed reasoned evaluation or exit from the securities. Once investments fall below investment grade, a vastly greater portion of our capital must be assigned to these assets through a process known as risk rating. The consequence was that your Company went from having an abundance of capital to having just enough. As I mentioned in my letter, we have always been “well” capitalized as defined by the regulators.
On the heels of this, we witnessed many of our customers struggling to meet their financial obligations. We also witnessed deterioration in some of the loan participations we had. Two industries which had long served the Company were especially hard hit – those of land development and hospitality. Through 2008 and 2009, we saw a steady climb in our classified assets – loans and investments with varying degrees of challenges. The substantial increase in our loan loss provision, coupled with investment losses, resulted in net losses for your Company. Beginning in the second half of 2010, we saw that trend begin to level, and as you know by now, we enjoyed earnings in this 1st Quarter.
3
With the benefit of 20/20 hindsight, anyone can say that they would have done things differently, and I am sure there are certain things we could have done differently in implementing our strategies that might have cushioned the impact of the recession. I believe that our strategies were well conceived and thought out, and, in fact, our regulators told us this. Regrettably, the blows of the mighty recession indicate otherwise.
I return to my WWII analogy. So, we are in our third year of this war on our earnings and capital. There has been pain, loss and sacrifice by everyone in this room. However, it is my firm conviction that, just like America in 1944, the outcome is not in doubt. America knew by December of 1944 – the third anniversary of Pearl Harbor – that it would succeed. It was not clear as to when or how many more battles it would take. And so it is with us. We are confident of the Company’s strength to see us through. There may still be some challenges ahead – good customers who just can’t make it through. And there will be “reconstruction” as we cleanse the balance sheet of some of the non-performing loans, or of real estate that we now own because of defaults in loans.
As I noted in my letter to you, we are taking steps this year to right size our Company. As our capital base contracted, it became important to adjust the size of the Company’s balance sheet to reflect our capital levels. Much of this will be accomplished through using our excess liquidity to pay off wholesale borrowings.
Beyond that, we will continue to work diligently to improve our asset quality. As Carissa’s presentation will indicate, we have made substantial progress on this over the past year.
4
Slide 5: Strategic Strengths
As we emerge from this war, First United possesses strategic strengths that I believe will lead to our success in the future. We have spoken before of our unique size within our market and how this helps us be closer to our customers than the big banks, while at the same time offering an array of products that many of our smaller competitors cannot provide. We told you that much of our focus would be on the community oriented business owners located throughout our markets. This keen focus is paying off. Over the last two years, the number of community oriented businesses we serve has grown from 4,175 to 4,940.
I would now like to turn the podium over to Carissa Rodeheaver who will provide an overview of our financial performance and our asset quality.
CARISSA RODEHEAVER
Slide 6: Carissa Rodeheaver
Good Morning!
5
Slide 7: Aftermath of the Recession
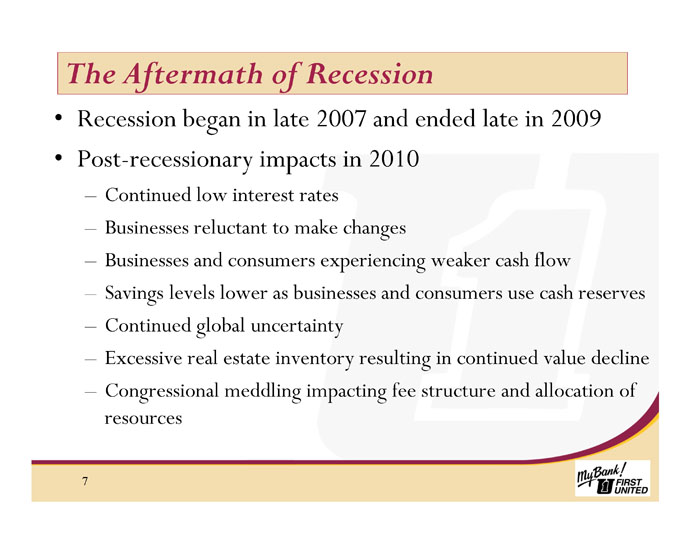
For First United Corporation, 2010 and 2011 will be thought of as years of rebuilding. Last year, I discussed the negative impact of the recession which included a weakened U.S. economy, low consumer confidence and fear, plunging stock and bond markets and a historically low interest rate environment. In this post-recessionary time period when both consumers and businesses have found themselves with weaker cash flows, slower sales and diminished reserves, First United Corporation also finds itself recovering from the hard felt blows of the recession. We, like many of our peers in the banking industry, have experienced deterioration in our investment and loan portfolios and are now focused on rebuilding our balance sheet and core earnings. As is prudent during difficult periods in banking, over the last couple of years we have built our levels of liquidity, built a higher allowance for loan losses, built higher capital ratios and have worked diligently to adopt new accounting and regulatory guidance. As we move through 2011, our goal is to restructure the balance sheet to build a strong foundation for future growth and profits.
Today, I will review our financial performance for 2010 and I will briefly discuss the results of our first quarter in 2011. For more detail, I encourage you to read the discussion of our financial results and condition in our most recent Annual Report on Form 10-K and our most recent quarterly report on Form 10-Q which are available to all shareholders on our website.
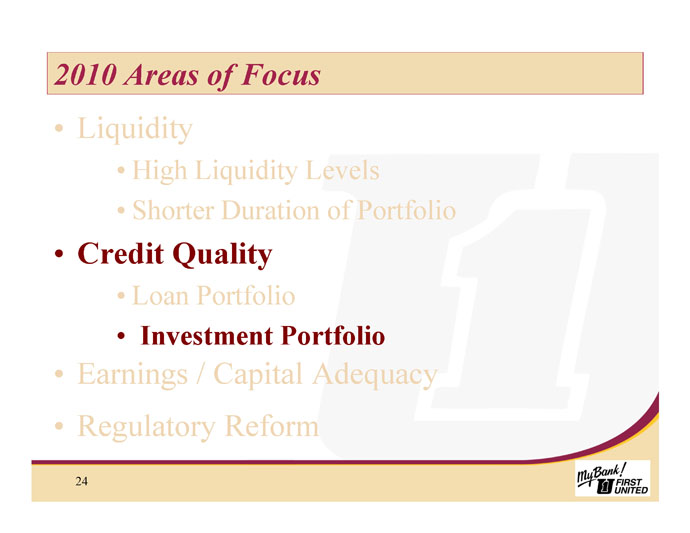
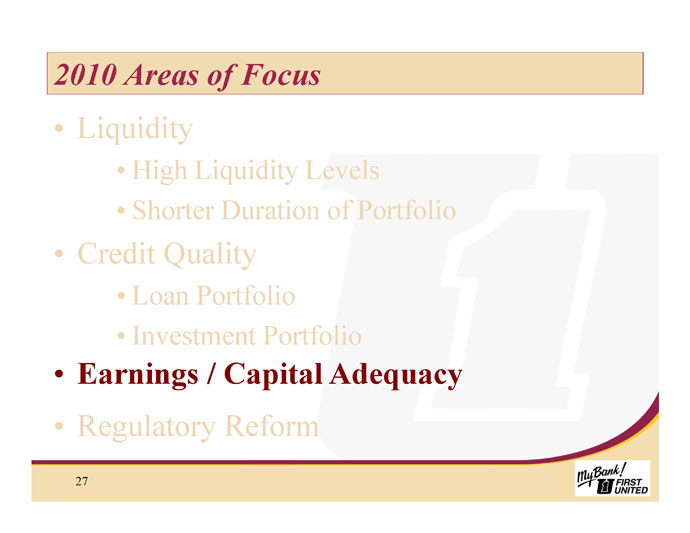
Slide 8: 2010 Areas of Focus
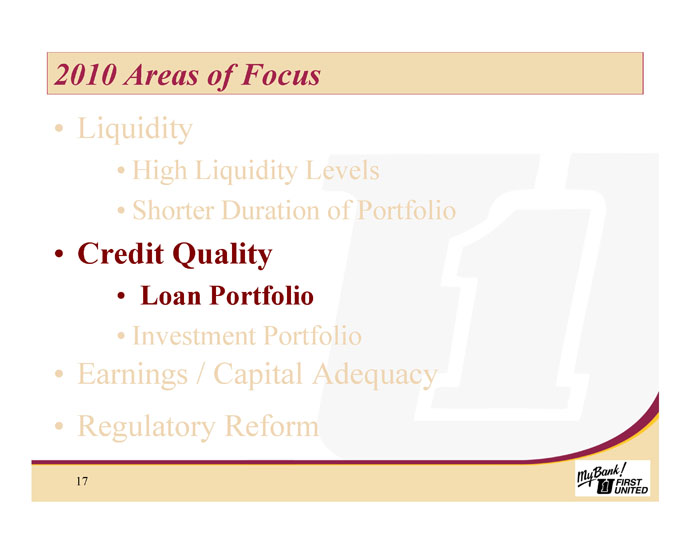
As our Board of Directors and management team planned for 2010, several areas surfaced for continued and renewed focus. First, we focused on holding the proper levels of liquidity and maintaining a short duration for our loans and investments in anticipation of a flat to rising interest rate environment. Next, we continued our focus on improving our credit quality in both the investment and loan portfolios. In some cases, this meant realizing losses in our income statement. We will discuss those losses later in the presentation. As a result of the weakened asset quality, we focused on continuing to increase our capital ratios above the regulatory requirements to be considered a well-capitalized institution in order to provide a cushion for potential future losses. The final area of focus was on the adoption of the multitude of regulatory and accounting changes brought about by congressional influence.
6
Slide 9: Areas of Focus – Liquidity
To begin looking at these areas, we will review the balance sheet and discuss some of the strategic changes instituted in 2010.
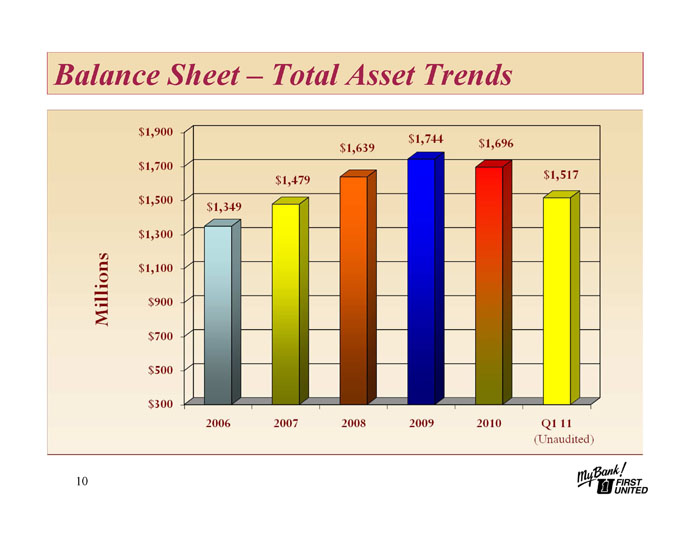
Slide 10: Balance Sheet- Total Asset Trends
At December 31, 2010, total assets were just under $1.70 billion, representing a decrease of $48 million, or 2.8%, when compared to assets at December 31, 2009. The decline in total assets was primarily due to a reduction of $112 million in loans and a decline of $44 million in our investment portfolio, offset by growth of approximately $110 million in cash. During 2009 and throughout 2010, we began to increase cash levels as we chose not to reinvest maturing or called investments and as we seized on opportunities to sell investments which showed signs of weakening credit quality. As we will see in future slides, core deposit growth also added to our cash position. The result was the continued growth in cash to a high of approximately $362 million at September 30, 2010.
7
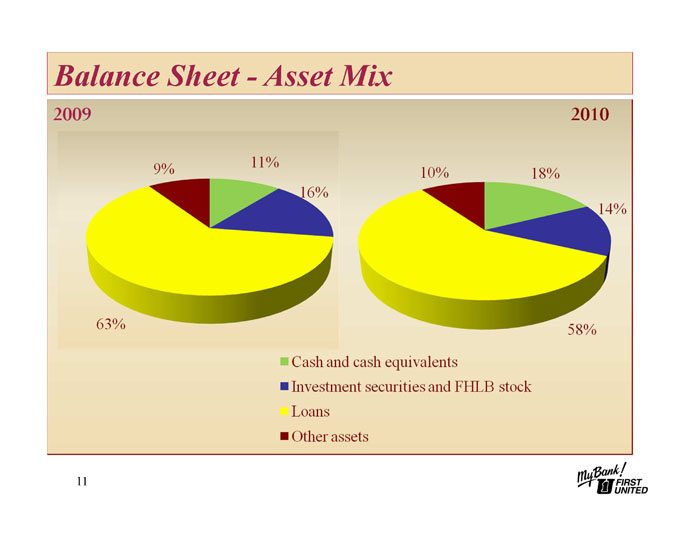
Slide 11: Balance Sheet- Asset Mix
Having seen a leveling in the credit quality of our investment and loan portfolios during the second and third quarters of 2010, the Board and management embarked on a strategy to reduce the level of assets to better match our current levels of capital. During the fourth quarter, cash was used to repay approximately $84 million in wholesale deposits, bringing total cash to $299 million, or 18% of total assets at December 31, 2010. It is our intent to continue this plan throughout 2011 as we experience maturities of wholesale deposits and borrowings. We will continue to test our liquidity levels and ensure that proper levels of liquidity are maintained given our current asset quality and the continued uncertainty in the economy.
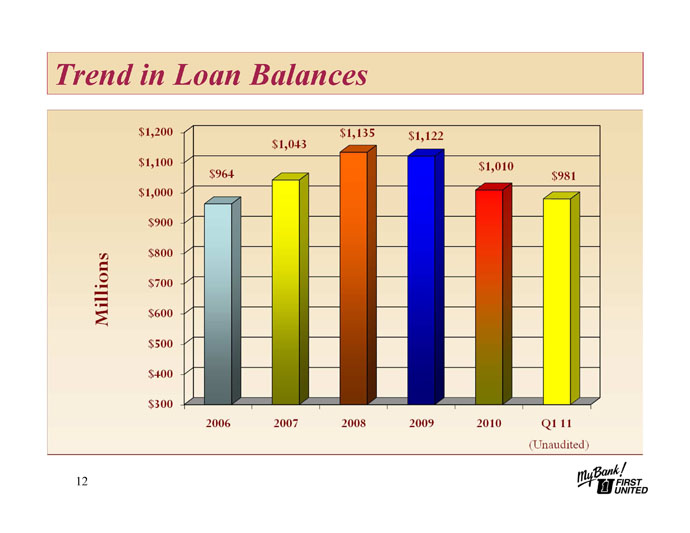
Slide 12: Trend in Loan Balances
During 2010, loan balances declined by approximately $112 million as we saw continued caution by both consumers and businesses as they continued to cut costs by reducing debt and delaying major purchases or expansion plans. The mortgage loan portfolio decreased by $16 million due to increased levels of refinancings into fixed rate loans for which we use secondary market outlets. Consumer loans decreased by $32 million as repayment activity in our indirect auto portfolio exceeded new production due to management’s decision not to compete with the special financing offered by the large national banks and the automobile manufacturers. Acquisition and development loans decreased by $75 million and commercial and industrial loans declined by $11 million. These declines were offset by growth in other commercial real estate loans of $22 million. Although we saw an overall decline in loan balances, we remained committed to our core business of lending and our loan officers were active in producing loans in our local market areas.
8
On May 6, 2011, the Bank consummated the sale of approximately $32.5 million of indirect auto loans at a premium price. The sale of these short duration loans should have a positive impact on earnings and capital and will reduce our regulatory risk weighted assets. The premium on this sale also provides the opportunity for us to explore other balance sheet transactions to enhance our future capital ratios.
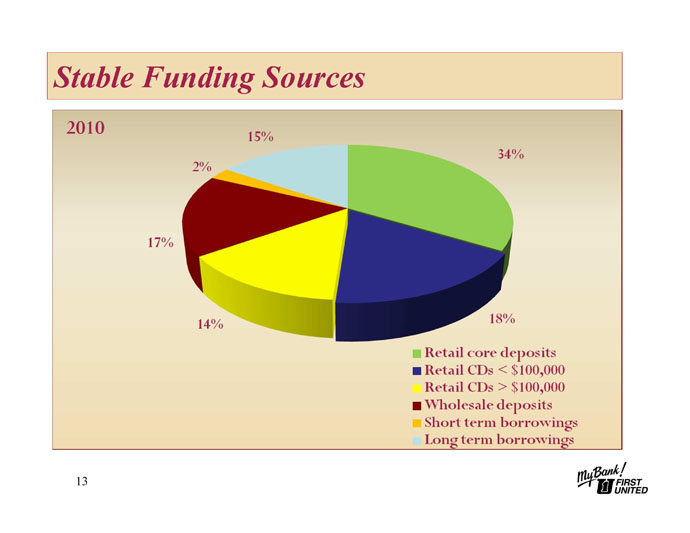
Slide 13: Stable Funding Sources
The asset side of the balance sheet is funded through stable funding sources. Core deposits and retail certificates of deposit total 66% of our funding sources and wholesale deposits represent 17%. Short term borrowings such as overnight borrowings or funds from repurchase agreements are less than 3% of funding, and long-term borrowings complete the picture at 15%.
Slide 14: Retail Deposit Composition
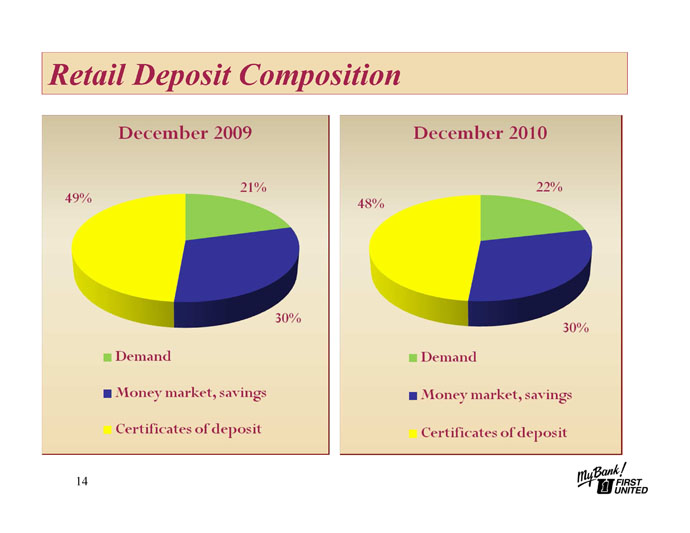
Retail deposit growth was strong during 2010, reflecting an increase of $37 million during the year. Our retail branch network was very successful in deepening relationships with our existing customers and our new market areas successfully attracted new customers as we saw our demand deposit accounts grow by $14 million, savings and money markets grow by $7 million and retail certificates of deposit grow by $16 million. As shown on this slide, 22% of our retail deposits are in demand deposit transaction accounts. Savings and money market accounts comprise 30% and retail certificates of deposit make up the remaining 48%. During 2011, in order to reduce our cost of funds and enhance our net interest margin, we have implemented strategies to grow the demand deposit, savings and money market accounts while reducing our exposure to certificates of deposit for non-relationship customers.
9
Slide 15: Trends in Deposits
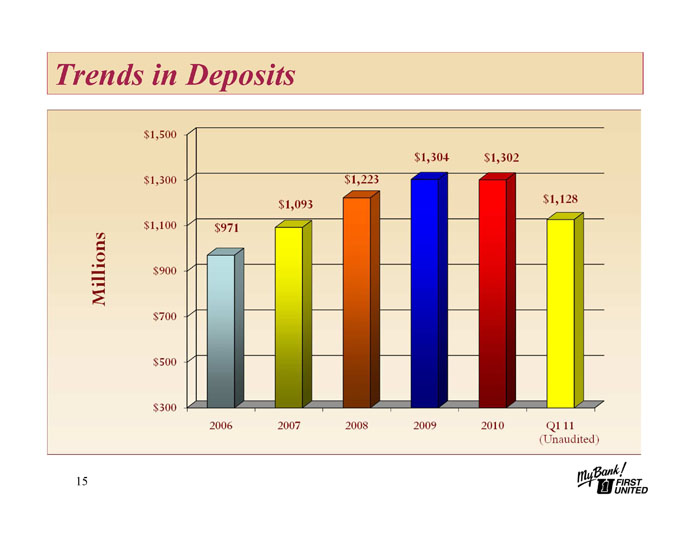
The retail growth was offset as we embarked on our strategy to right-size our balance sheet and we used our cash to repay $30 million in long-term debt and $64 million in wholesale brokered deposits during the year. The net result was relatively flat growth in deposits from 2009 to 2010.
Slide 16: Deposit Market Share
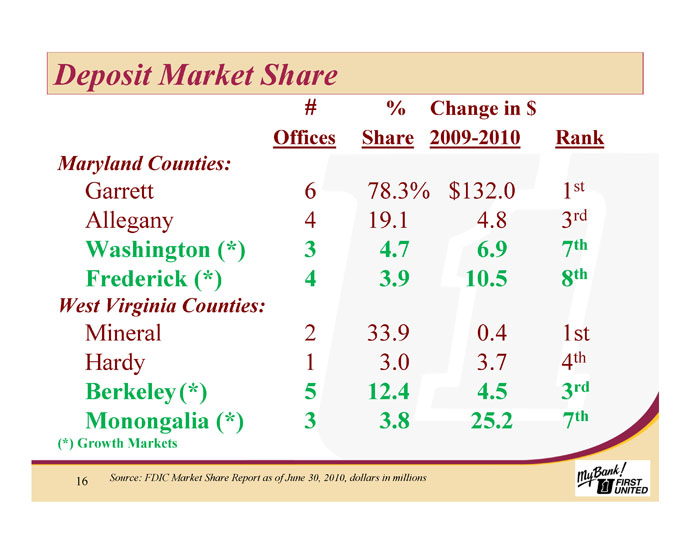
The next slide shows our share of deposits in each of the counties in which we operate. Those counties shown in green are the newer markets in which we operate. We are pleased to report deposit growth in each of these markets. The stand outs are the areas where we added branches in 2009, namely Frederick County in Maryland and Monongalia County in West Virginia. These branches have performed favorably to our projections and have given us the opportunity to develop new customers and deepen relationships with customers within those market areas.
10
Slide 17: 2011 Areas of Focus – Credit Quality Loan Portfolio
Working with our borrowers to improve the credit quality of our loan portfolio continued to be a high priority for our lenders and credit quality departments during 2010. In keeping with Bill’s war theme, loan workout resembles the triage process. We worked diligently to identify those loans with the largest financial impact to the Bank and either identified and implemented a plan for repayment or proceeded with the next step of foreclosure to allow the Bank the opportunity to recoup our investment through the sale of the collateral. As we continue to work through our troubled credits, we anticipate that, like many of our peer banks, our other real estate owned portfolio will remain at a much higher level than we have historically experienced. We have a team dedicated to inspecting and creating marketing plans to prepare this real estate to be sold as quickly as possible in the markets.
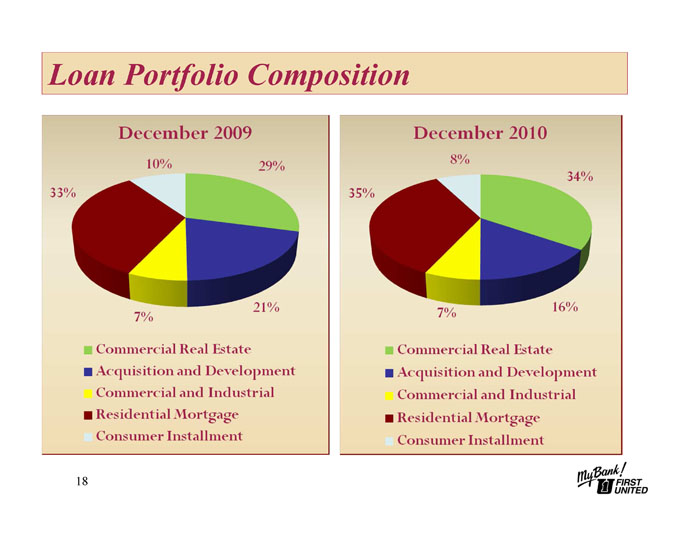
Slide 18: Loan Portfolio Composition
The next slide demonstrates the composition of our loan portfolio. Residential mortgages and commercial real estate loans make up the majority of our loan balances at 35% and 34%, respectively, up slightly from the prior year. The acquisition and development sector declined from 2009 balances due to charged-off balances, foreclosures and working some troubled credits out of the Bank. In addition, certain projects financed as acquisition and development loans were completed and moved to permanent financing.
11
Slide 19: Commercial Real Estate Loans
Our commercial loan portfolio continues to be well-diversified throughout our market areas and the underlying collateral is diversified among the various property types. Non-residential and owner occupied collateral together make up 64% of our collateral pool. This type of collateral is representative of an operating business generating cash flows as opposed to the loans secured by non-income producing land. Land development represents 27% of our collateral and the construction segment represents 4%. Those loans under construction will move from this pool into other collateral segments as the projects are completed. With respect to the location of collateral, no locality represents over 25%, minimizing concentration risk. Those loans, many of which are in the hospitality industry located outside of our market, represent approximately 16% of the portfolio and have provided the most challenge to us as we have worked through troubled credits. In many cases, our investment constituted participation interests in loans made by other banks and our ability to communicate and work directly with the borrowers has been hindered by disengaged, non-bank servicers with different business objectives. We have implemented strategies to reduce this exposure but anticipate that we may experience losses as part of the remediation strategy. Where necessary, we have specifically allocated a portion of our allowance for loan losses to these credits.
12
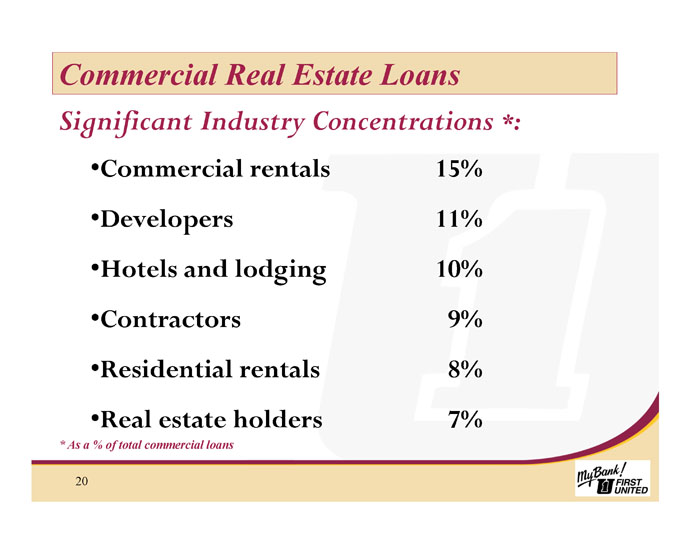
Slide 20: Industry Concentrations
The next slide shows the industries where we have the most concentration. The hospitality, or hotel and lodging industry, and the developers have experienced the most challenges from the recent recession. The lack of sales of land and residential homes and the high inventories in the markets have caused sales for developers to come to a near stand-still. Most of these loans have been placed on principal and interest payments in order to reduce balances. Many of these loans are in the non-accrual numbers that we will review in later slides, which means we are not recognizing interest income on the loans but, rather, are reducing principal with all cash flows received in order to minimize loss exposure to the Company. The hospitality loans make up the majority of our out of market loans discussed earlier. These borrowers have experienced slower revenue streams as consumers and businesses have cut back their travel over the past few years.
13
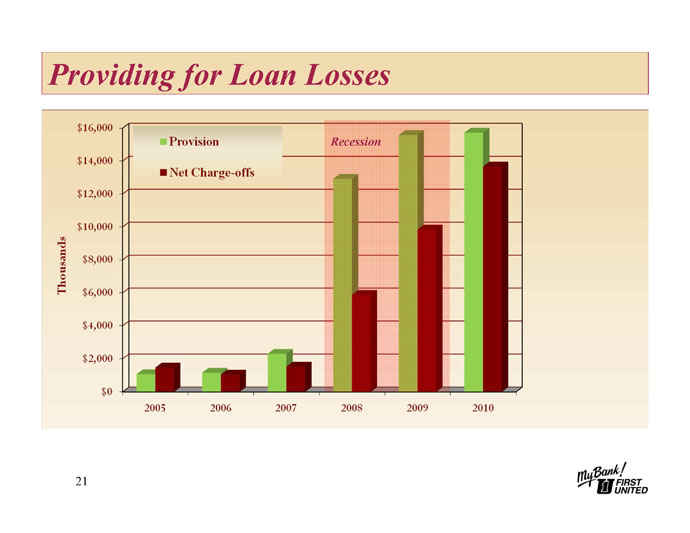
Slide 21: Providing for Loan Losses
Having looked at the composition and diversification of our loan portfolio, we will now turn our attention to the credit quality of this portfolio and I will discuss some of the trends we have experienced over the last several quarters. As we saw little improvement in the economy during 2010, our borrowers continued to experience weak cash flows, lay-offs and job loss, and developers continued to be plagued by the lack of residential lot and housing sales. In order to protect our investors from future losses, we fund an allowance for loan losses to absorb actual losses as they occur. As you will note on this chart, prior to 2008, provision expense and net charge-offs were relatively low. The pink area represents the recessionary time period and the green bar shows management’s efforts to provide for future loan losses as we continued to see charge-offs increase. As we move from 2009 to 2010, the green bar now has stabilized while charge-offs have continued to increase. A loan is charged-off when management determines that it is probable that we will not be able to collect the full amount of principal owed on the loan. In most cases, this means that the borrower is experiencing financial hardship and we have been unable to work out a remedy for the loan. When a loan is charged-off, we charge the loss to the allowance for loan losses which reduces the allowance. So, in order to maintain the level of allowance as you see happening in the green bar, it is necessary for us to provide more funds. This is called provision expense and is considered an expense to the Bank that has an immediate impact on earnings. In 2010, we charged-off approximately $13.7 million net of recoveries and provided a total of $15.7 million to maintain our allowance for loan losses.
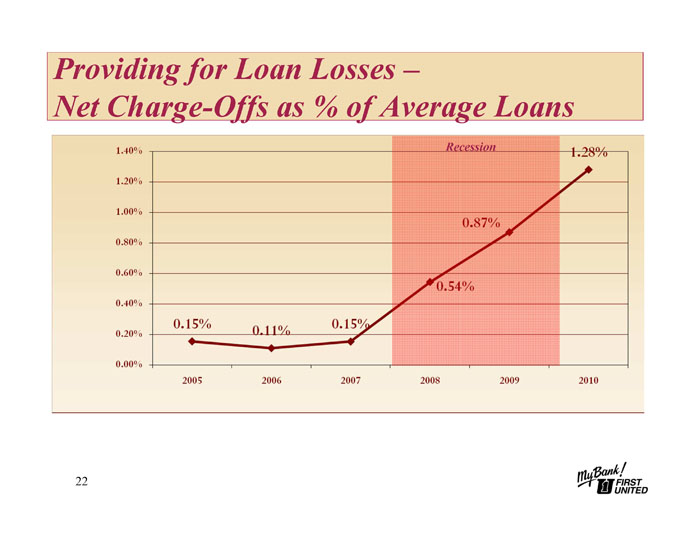
Slide 22: Net Charge-Offs
The net charge-offs in 2010 of approximately $13.7 million equates to about 1.28% of our total loan portfolio. As this slide demonstrates, the charge-off percentage continued to increase in 2010. The charge-off represents the difference between the new appraised value of the collateral underlying the loan and the actual loan balance. In some cases, we will have the opportunity to recover some of the charge off as the property is sold at foreclosure or we pursue other assets of the guarantor on the loan. As we continue to cleanse our balance sheet of the troubled credits, it is likely we will continue to see high charge-offs in 2011 due to the decreased property values resulting from the recession.
14
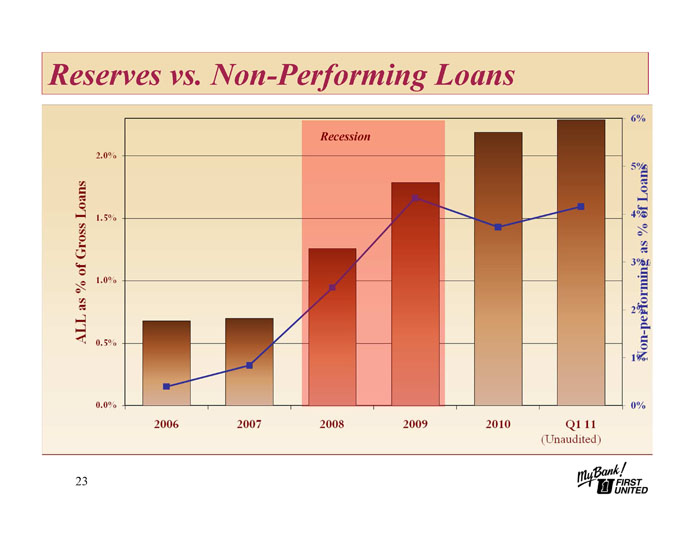
Slide 23: Reserves vs. Non-performing Loans
Because we have seen higher charge-offs due to lower collateral values, we have continued to experience a high provision expense and have pushed the level of our allowance for loan losses to a historical high. This chart shows the level of our allowance for loan losses relative to the amount of non-performing loans in our loan portfolio. The blue line represents the non-performing loans as a percentage of gross loans and the brown bar shows the total allowance for loan losses as a percentage of gross loans. As you will note, the percentage of non-performing loans declined during 2010 and the level of the allowance continued to increase and then stabilize. This demonstrates that management and the Board have actively managed our loan portfolio, setting aside reserves to cover loan losses that we believe are inherent in the portfolio. Our credit quality department has spent numerous hours working with our troubled borrowers to eliminate or minimize losses to the Bank on deteriorating credits. If these trends continue, our need to provide for losses should be lower in future years, resulting in higher earnings. Our first quarter results were reflective of the lower provision expenses needed while we still maintained high reserves for future losses.
15
Slide 24: 2010 Areas of Focus- Investment Portfolio
To fully understand the credit quality at the Bank, we must now turn our attention to the investment portfolio. Our investment portfolio serves several purposes, the first of which is to provide liquidity. While loans cannot easily be sold if the Bank should need higher levels of cash, investments can typically be converted to cash overnight. The next objective for the portfolio is to provide a tool to balance the interest rate risk of the Bank. For instance, if deposits have become very short in duration but borrowers are wishing to extend maturities because they fear rising rates, we may want to use very short term investments to balance our interest rate sensitivity. The last objective for our investment portfolio is to provide a supplement to our core earnings.
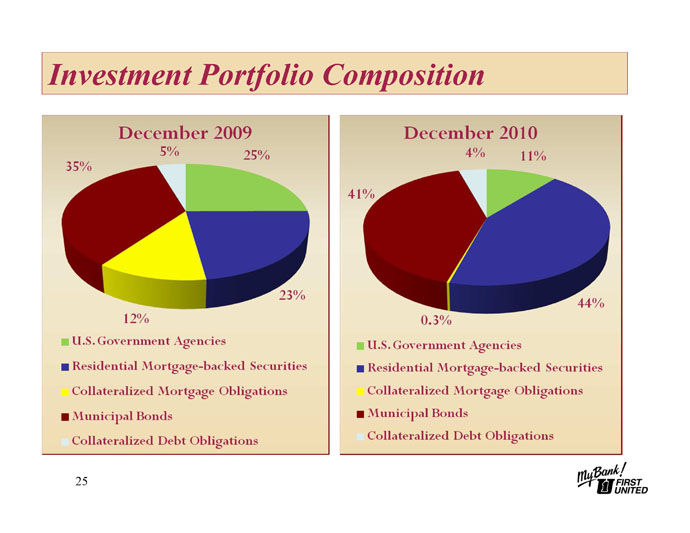
Slide 25: Investment Portfolio Composition
This chart shows the change in the composition of our investment portfolio from 2009 to 2010. The yellow slice represents private label collateralized mortgage obligation bonds which were all at the highest investment grade of AAA as rated by the rating agencies at the time of purchase. These bonds were backed by mortgages. Due to the recession and the housing crisis, we saw these bonds downgraded to levels below investment grade and a significant decline in the market values during 2009. To protect our portfolio from further deterioration, we made the decision to sell all of the downgraded bonds early in 2010 as part of an investment restructuring. The result was a net loss of approximately $2.2 million in 2010. The green and dark blue sections represent 55% of the portfolio which is U.S government agencies and mortgage backed securities. The red section, at approximately 41%, represents municipal bonds. The growth in the government mortgage backed securities and the municipal bond sectors in 2010 is a result of our investment portfolio restructuring efforts as we invested in more conservative investments with shorter durations and regular cash flows. The light blue section, representing 4% of the portfolio in 2010, is comprised of the collateralized debt obligations which were responsible for the other-than-temporary impairment losses.
16
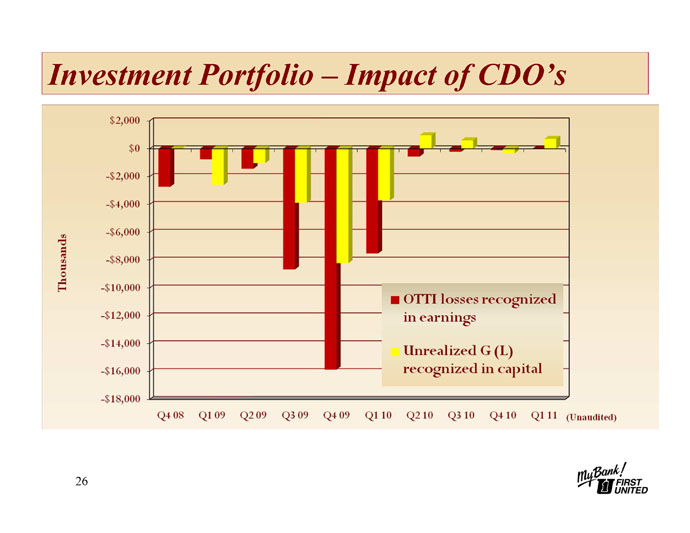
Slide 26: Impact of CDO’s
Due to the distressed financial industry and our exposure to this industry in the collateralized debt obligation portfolio, the Bank recorded non-cash charges of approximately $3 million in 2008, $27 million in 2009 and $8 million in 2010 as a result of other-than-temporary impairment analysis performed on our investment portfolio throughout each year. This represents credit deterioration in these bonds and as a result, a charge against earnings. We provide an in-depth discussion regarding our valuation techniques and impairment testing in our 2010 Annual Report on Form 10-K and in our March 31, 2011 Quarterly Report on Form 10-Q. As this slide demonstrates, we saw a peak in these charges, represented by the red bar, in late 2009 and the first quarter of 2010 and then saw a declining trend throughout the remainder of 2010 and into the first quarter of 2011. This is a positive trend that if continued should positively impact our earnings stream.
Slide 27: 2010 Areas of Focus - Earnings/Capital Adequacy
At this time, I will discuss the effects of the asset quality and the transitioning balance sheet on the earnings and capital of the Company. The result of the increased loan provision expense and the other-than-temporary impairment charge on our investment portfolio was several quarters of losses for our company.
17
Slide 28: Net Income
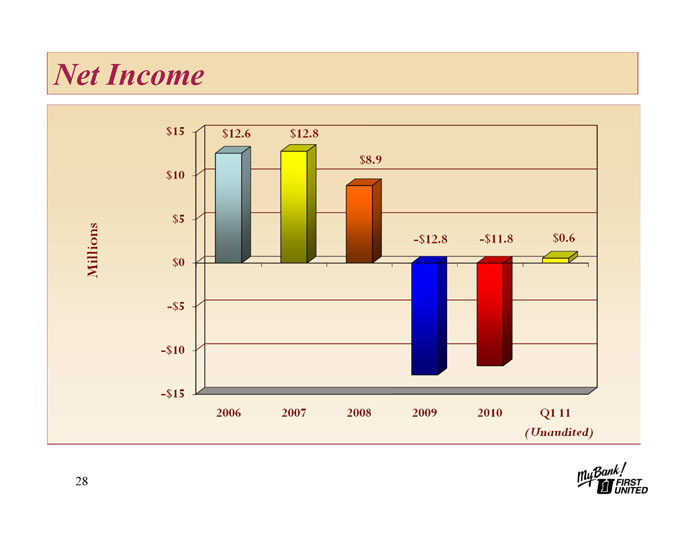
Consolidated net loss attributable to common shareholders for the year ended December 31, 2010 was $11.8 million, compared to the net loss of $12.8 million in 2009. The net loss was a result of reduced net interest income, losses on the restructuring of our investment portfolio, losses and write-downs associated with the other real estate owned and the high loan provision expense and non-cash other-than-temporary impairment charges discussed earlier. Your Company returned to profitability in the first quarter of 2011, posting consolidated net income available to common shareholders of $.6 million. This reflects the leveling in provision expense and the minimal impairment charges recognized during the quarter.
Slide 29: Components of Pre-Tax Earnings
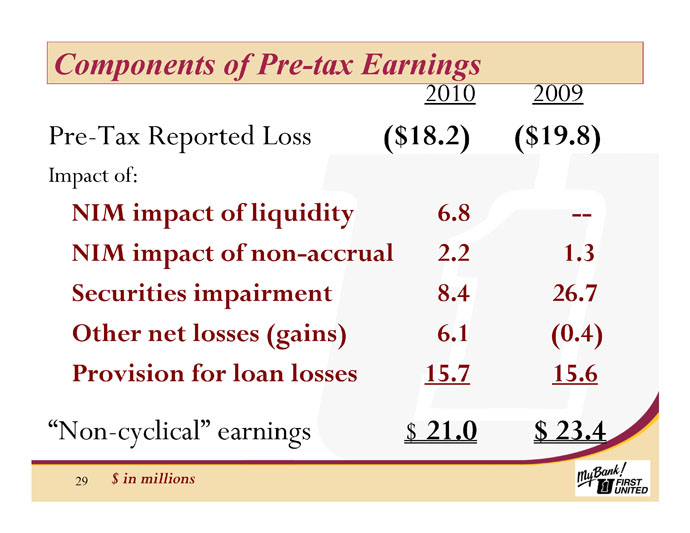
This chart reflects the main issues I have focused on today as the drivers of the losses sustained in the last two years – high levels of liquidity at a cost of approximately $6.8 million in 2010, reduced interest income of $2.2 million as a result of the increase in the non-accrual assets, losses associated with the investment portfolio and the high provision expense. Exclusive of these charges, non-cyclical pre-tax earnings would have been approximately $21 million in 2010 and $23.45 million in 2009. As we continue our efforts to right-size the balance sheet, we don’t expect to fully recover the earnings associated with the liquidity. However, if we are able to continue the trends of lower provision expense and low charges associated with other-than-temporary impairment, we should continue to see positive trends in earnings.
18
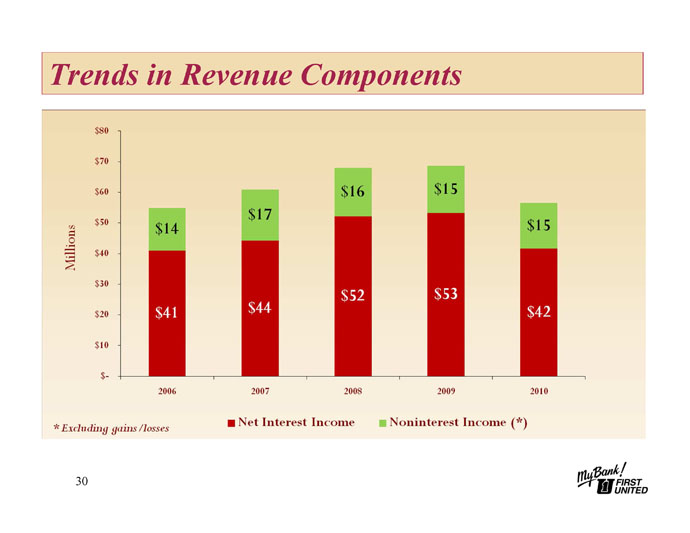
Slide 30: Trends in Revenue Components
Non-interest income, represented by the green portion of the bar on this chart, has remained relatively steady for the past five years, peaking in 2007 prior to the onset of the recession which impacted our trust and insurance departments and the levels of service charge income. Net interest income, as can be seen in the red portion of the bar, continues to represent the majority of our total revenue. The cost of carrying high levels of cash, the non-accrual assets and the lower yield on our investment portfolio had a negative impact on net interest income in 2010.
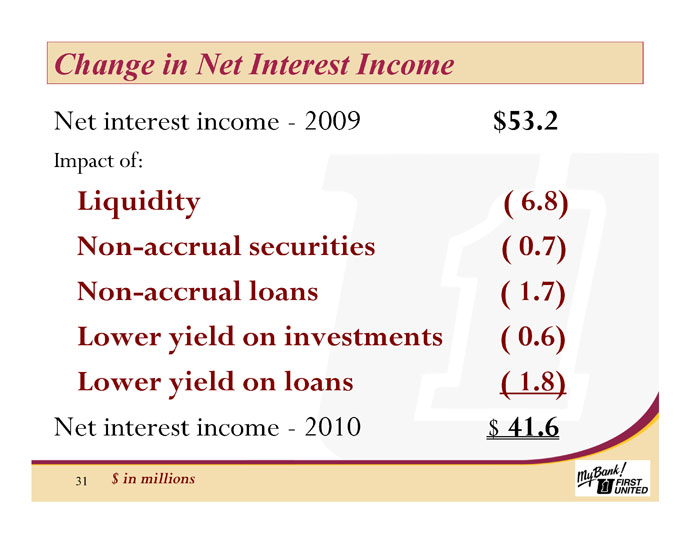
Slide 31: Net Interest Income
Net interest income is the difference between the interest we earn on loans and investments and the interest that we pay for deposits and other borrowings. Net interest income hit a record high of $53.2 million in 2009 but was significantly reduced in 2010 as many loans and investments reset at lower interest rates due to the continued flat interest rate environment. In addition, we saw a reduction in loan and investment balances and an increase in non-accrual assets. Non-performing loans are loans which have been placed on non-accrual or are 90 days or more past due. For these loans, the Bank does not book any interest income. The historically high levels of cash at very low rates also impacted our interest income as compared to prior years in which we maintained very low levels of cash. Management continued to manage our cost of funds through pricing and controlling the deposit and borrowing mix.
19
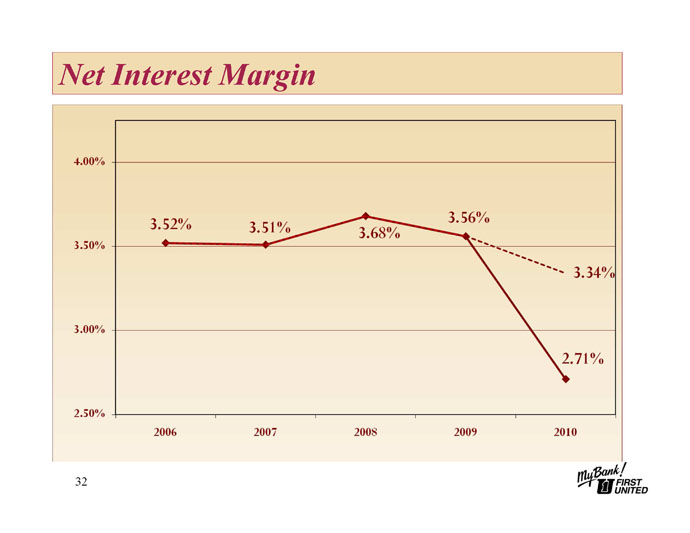
Slide 32: Net Interest Margin
Traditional banking services, resulting in the generation of net interest income, continue to be our primary source of revenue. As I mentioned last year, pressure on the net interest margin continued in 2010. The largest single factor impacting the margin in 2010 was the high level of cash held as we worked to increase capital levels commensurate with the credit quality of our loan and investment portfolios. The dotted line on this chart approximates what the margin would have been had we not experienced the negative spread on these high cash levels. While still lower than historical levels, it is closer to margin levels experienced by peer banks. In order to better match our total assets and our capital levels, we began to decrease our levels of cash by repaying brokered deposits and long-term borrowings as they matured during the fourth quarter of 2010 and through the first quarter of 2011. We anticipate the margin will begin to reflect this reduction of cash as we move into the second quarter of this year. Managing our net interest margin remains a high priority for our Treasury team. While we are not planning overall deposit growth in 2011, our focus will be to change the mix of our deposit base to increase our core deposits and allow single service CD customers to roll off the books. We will continue to make special pricing available to those customers who choose to have full banking relationships with First United, those who view us as their primary bank and who value the high level of service that we strive to provide. Adherence to our pricing discipline, a change in the composition of our deposit base, reduced levels of low-yielding cash, and continued efforts to lend to our community oriented business owners should all have a positive impact on our net interest margin in 2011.
20
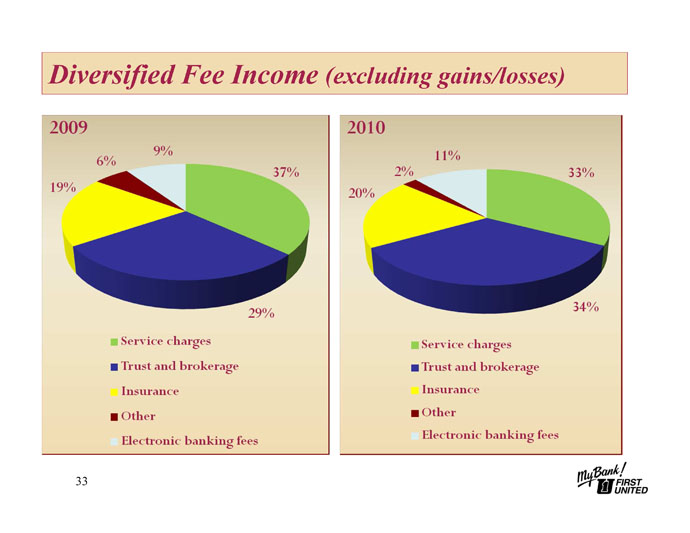
Slide 33: Diversified Fee Income
While not the primary driver of income, non-interest income continues to play an important role for the income statement of First United Corporation. Excluding the securities losses and other-than-temporary impairment charges discussed earlier, we recorded $14.9 million in non-interest income in 2010. We continue to see nice growth in our trust and investment services as it represented 34% of fee income at year end and the trust department surpassed $600 million in assets under management during the first quarter of 2011. Service charge income continues to contribute a large portion of our fee income, but it was lower in 2010 than in prior years as we saw a reduction in non-sufficient funds income due to new government regulations implemented in July of 2010. As our customers become more and more dependent on technology, we continue to see increases in our electronic banking fees. However, there is pending legislation that could alter our income stream from interchange fees in the future. The degree of this financial impact is unknown at this time. Gross revenues from our insurance agency remained stable from year to year as the insurance industry continued to experience a soft market and as contingency income, which is based on claims filed during the year, remained level from year to year.
21
Slide 34: Operating Expenses
Other operating expense for 2010 decreased by $2.1 million, or 4%, as compared to 2009. FDIC premiums remained relatively steady from year to year and we saw a slight increase in occupancy and data processing costs year over year. Salaries and employee benefits decreased by $1.6 million, or 7%, due to reduced costs for our pension plan, lower production-based incentive pay and reduced headcount. The other expense category includes items such as marketing costs, legal and auditing fees and licenses. We continue to focus on cost control and the right-sizing of our operating costs relative to the size of our balance sheet.
Slide 35: Capital Ratios
In order to provide additional capital to protect against the loan and investment losses inherent in our portfolios, in January 2009, First United Corporation elected to participate in the Troubled Asset Relief Program - Capital Purchase Program, better known as TARP CPP. The proceeds of $30 million received from the U.S. Treasury are includable in our tier one capital. During the first five years, the Company will pay a 5% cash dividend on this capital and will pay 9% for the remaining term that the securities are outstanding. In addition to our participation in the Capital Purchase Program, we sold $10.5 million of trust preferred securities through a private placement in December 2009 and January 2010 to current customers, shareholders and individuals in our market areas who qualified as accredited investors. The proceeds from the sale of these securities also qualify as tier one capital and provide further insulation from potential loan and security losses as a result of the anticipated slow economic recovery.
22
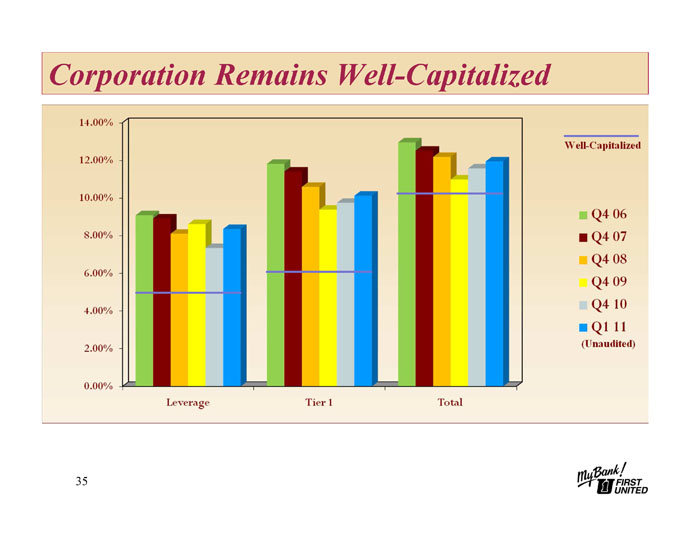
On November 15, 2010, the Company elected, at the request of the Federal Reserve Board, to cease making cash dividend payments on our common stock and to defer regularly scheduled quarterly cash dividend payments under the Capital Purchase Program starting with the dividend payment due November 15, 2010. On December 15, 2010, at the request of the Federal Reserve Board, the Company elected to defer regularly scheduled quarterly interest payments on the debt underlying our trust preferred securities starting with the interest payments due in March 2011. Both the deferral of dividends on the CPP and the deferral of interest on the trust preferred debt are permitted under the terms of those securities and do not constitute events of default. However, during the deferral periods, dividends on the CPP and the trust preferred debt continue to accrue and must be paid at the time the Company recommences regular payments. It is our intent to periodically reevaluate the deferral of these payments, and, in consultation with our regulators, consider reinstating them when appropriate. We believe that we will have the opportunity to recommence these payments once the Company has posted several quarters of core earnings and has continued to see stabilization in our asset quality. This slide shows the trends from 2006 through March 31, 2011 for each of our regulatory capital ratios. The blue line on each group shows the point at which we are considered well-capitalized by regulatory standards. As of March 31, 2011, First United Corporation remains well-capitalized in all ratios.
Slide 36: 2010 Areas of Focus - Regulatory Reform
As our nation recovers from the financial meltdown which began in late 2007, our government has responded with a host of new regulations aimed at lowering the systemic risk a few large financial companies and a multitude of unregulated mortgage brokers unleashed at the end of 2007.
23
Slide 37: Regulatory Reform
The government has continued to insist that the regulations are not aimed at community banks. However, the Dodd-Frank Wall Street Reform and Consumer Protection Act is responsible for the introduction of over 800 pages of new regulations that touch all banks – both large and small. Overdraft income and interchange income have been targeted and our regulators have introduced pages of best practices. The accounting industry is in a state of flux as the United States works with the International Accounting Standards Board to develop universal accounting standards. New SEC disclosure requirements have been released with regularity throughout 2009 and 2010 to provide information to shareholders and investors. Your management and board have dedicated teams of employees and special board committees to reading, understanding and developing policies and procedures to ensure that our Company is fully compliant with all new regulations, accounting pronouncements, disclosure requirements and regulatory best practices.
24
Slide 38: Rebuilding and Restructuring
In conclusion, 2010 was a year of rebuilding for your Company. We built our cash levels to provide adequate liquidity as we worked to build our capital ratios. We built our allowance for loan losses to protect the Bank from potential losses in our loan portfolio. We built our risk management systems to ensure compliance with new regulation and accounting guidance. We built our retail deposits to allow us to repay wholesale and brokered funding. Now, we are focused on restructuring our balance sheet to build a stronger asset base to enhance interest income and on building solid relationships with our customers which should result in a different composition in our deposit base and ultimately a lower cost of funds. We expect this stronger balance sheet to produce a stronger net interest margin and higher fee income which should translate to earnings for our Company and growth in our core capital. According to Khalil Gibran, “Progress lies not in enhancing what is, but in advancing toward what will be.” The Board and management of your Company are focused on progressing towards a profitable future. Thank you for your attention. At this time, I will turn it back over to Bill.
BILL GRANT
Slide 39: Bill Grant
Slide 40: Frequently Asked Questions
Thank you, Carissa. At last year’s Shareholders Meeting, we introduced a portion of our presentation designed to respond to questions posed to us by investors and customers and some questions which we think are important. I received several comments following last year’s meeting that this was a very useful part of the presentation, so we have decided to do the same this year. A couple of the questions are similar to those presented last year, while the others address developments since last year’s meeting.
25
Slide 41: Question 1
|
|
1.
|
What are the Company’s plans regarding the Capital Purchase Program?
|
As we discussed at last year’s meeting, First United, with encouragement from its regulators, elected to participate in the Capital Purchase Program, which was part of the Troubled Asset Repurchase Program legislated by Congress in late 2008. The program was designed to bolster strong banks, and provide additional capital to foster lending. As you may know, we are required to pay a 5% dividend to the U.S. Treasury for the $30 million investment. We do, with the consent of our regulators, have the right to repay this amount at any time. The rate of 5% continues for the first five years, and then goes to 9%. At either rate, it represents reasonably priced capital for your Company. The CPP investment has served your Company well. In addition to its reasonable rate, it has allowed us to bolster capital through the recession. This was part of the intent of Congress. It was made available only to banks that the Treasury thought strong enough to weather the storm. Of the 707 banks that participated in CPP, only 8 have failed.
The other goal of Congress was to spur loans for America through its investment in CPP securities. Since receiving the CPP investment, First United has provided over 3,500 loans, totaling more than $200 million dollars.
We will continue to explore our strategies for capital enhancement, which could include internally generated capital through earnings and the possibility of public and/or private offerings of our securities in the years to come. These courses could put us on the path of repaying the CPP.
26
Slide 42: Question 2
|
|
2.
|
What are the Company’s plans regarding the dividend to shareholders of the common stock?
|
As we previously indicated, the decision to reduce and then eliminate the common dividend was a painful one for the Board, and I know a painful one for all of you. At this point in time, I cannot provide you with any absolute timeframe as to when the dividend will start again. As First United gains strength, and returns to normalized earnings, I believe it likely that the Board will choose to retain earnings for a period of time so that we can build capital. After that point, the Board, in collaboration with our regulators, will revisit the dividend policy with an eye towards providing some level of payout.
Slide 43: Question 3
|
|
3.
|
We understand that payments were suspended on the dividends for both the CPP and the trust preferred securities which the Company issued. Can you comment on this?
|
I mentioned earlier the 5% dividend we pay on the Treasury’s CPP investment in First United. In addition, First United issued trust preferred securities into syndicated pools in 2004 and directly to investors in late 2009 and early 2010. Both our CPP securities and our trust preferred securities have a preferred dividend which is ahead of the common dividend. Also, the dividends on these securities can be deferred, but not eliminated.
27
Because the Company posted losses in four consecutive quarters, we were asked by the Federal Reserve to defer payment of these dividends. What is important to note is that we continue to accrue the dividends on our outstanding trust preferred securities, and the expense for these is netted against, or reflected in, our current earnings. Further, we account for the CPP dividend in reporting earnings available for shareholders. I am very pleased to tell you that, after our first quarter, we had sufficient earnings for shareholders to cover all deferred payments.
Slide 44: Question 4
|
|
4.
|
How can you justify paying 5% on the CPP and over 9% on the privately-issued trust preferred securities? You could get deposits in the market at a much lower rate.
|
This is a great question, and gives us the opportunity to discuss the differences between capital and deposits, and why they are priced differently.
Capital represents an investment in the Company – whether that comes from your investment in common stock, investments in the trust preferreds by our private investors, or investments by the Treasury pursuant to its Capital Purchase Program. These investments build the capital base of the Company that Carissa showed you in an earlier slide.
28
All banks will leverage this capital to a much higher level on assets in order to provide a return on the investment. Let me share an example: A bank may decide to leverage $1.00 of capital into $12.00 of earning assets. This would be normal in the banking industry. If that dollar comes from our CPP, we will pay a nickel of interest on it. If we invest the $12.00 in securities or loans that average 4%, then we have interest income of $0.48.
The second part of the discussion is the actual funding of the loans or securities. This is where deposits come in. While the $1.00 of capital supports $12.00 of earning assets, we would still need to obtain $11.00 of deposits to fund the loans or investments. If we pay an average of 2% on the deposits, that will reduce our interest income by $0.22.
There are, of course, other expenses that are applied to the income, but this example was to illustrate for you the difference between capital and deposits.
Slide 45: Question 5
|
|
5.
|
You mentioned last year that the Company made significant investments in new markets. How is that working out?
|
We believe it is working out well for us. In our markets to the east – which would include Hagerstown, Frederick and Martinsburg – we now serve over 5,500 households. Despite the recession, deposits have grown by over 26% in the last five years. Because of the recession, loans over that period of time grew at a more modest 6%. To top it off, our Trust Department grew assets under management by nearly $60 million over that same period of time.
29
Looking westward to Morgantown, a market we entered not through acquisition but by three strategically located branches, we now serve over 2,000 households. Our deposits stand at $87 million, and we have loan balances of over $61 million. Trust assets exceed $13 million.
Slide 46: Question 6
|
|
6.
|
I read in the 10-Q that First United sold a significant portion of its indirect portfolio? Please tell us why this was done.
|
Our indirect portfolio represents those auto loans which come to us from auto dealers. At one time, this was a significant percentage of our loan portfolio. In recent years, however, the car manufacturers and their dealers have made large inroads into this business. All of us have seen the 0% financing offers. More recently, your Company has been financing 1 – 2 year old used vehicles to customers with high credit scores. Even this arena has become very competitive. As we analyzed this portfolio, we recognized that the rate of payoffs was occurring at a much faster rate than the loan documents called for. This was due to increased auto sales as the economy slowly recovers. We had the opportunity to sell this portfolio for a significant gain. More importantly, the sale allows us to further enhance our capital.
30
Slide 47: Question 7
|
|
7.
|
I noticed in the proxy statement that the Company now has a “Lead Director”. Can you explain what that is, and why the position was created?
|
For nearly three decades, First United has had the combined role of CEO and Chairman. This has allowed for a singular focus of strategy and accountability. This approach was counterbalanced by a strong and independent Board of Directors. Historically, the Board has been somewhat large to assure a breadth of business, accounting and legal experience. As of this meeting, the Board includes four independent financial experts, as defined by Sarbanes-Oxley.
Last year, the Board, through its independent Nominations and Governance Committee, conducted a comprehensive study to determine if this form of governance still made sense for the Company. An independent consultant was retained to help guide them through this study. They concluded that the combined roles continues to make sense for First United, and the Board concurred with this finding. To further solidify its independence, the Board decided to establish the role of Lead Director that would be filled by the Director who chairs the independent Nominations and Governance Committee. This individual would chair the periodic executive sessions and serve as a resource for Directors – and Shareholders – who wish to raise issues that, for whatever reason, they are not inclined to put in front of the Board Chairman.
31
We are excited about this additional step which has been taken to heighten, even further, the independence if your Board. This role is currently filled by Don Moran.
Slide 48: Question 8
|
|
8.
|
Aside from building your capital position, can you describe your strategy for restoring the Bank to good health, even if the economy remains stagnant? Or, is your strategy primarily dependent on a recovering economy?
|
As Carissa discussed, one of our primary focuses will indeed focus on preserving and building capital. But, there is much more to First United than building and preserving capital. Our strategy is to leverage the unique strengths which the Company possesses to build profitable market share. As we have discussed before, a major focus has been to serve the needs of community oriented business owners throughout our markets. We distinctly say community oriented business owners because we believe we are one as well. We look not only to their business needs, but to their individual needs as well. This strategy naturally helps us serve all non-business customers as well. We believe that we are uniquely positioned to execute on this strategy because of our size and team focus. This is what I mentioned in several previous discussions known as our Tweener size. We believe our size allows us to be closer to our customers than many of the larger money centered or regional banks. We believe that we can bring a team of specialists to meet with customers more quickly and more effectively than our larger competitors. Conversely, we are larger than several smaller community banks, which permits us to deliver a broader array of services, ranging from trust and investments to insurance and cash management.
32
We believe that our approach to customer service is working. Each year, we receive reports showing our percentage of a particular county market, as measured by total deposits within that county. In six of the eight counties we serve, we have seen gains in First United’s market share. Amazingly, First United has increased its market share in Garrett County in the last four years by 13%. First United now has over 78% of the market. This is a tribute to our associates, and is evidence of our level of customer service – because we have certainly seen some new competitors moving in over the last few years.
Of course, our recovery will be somewhat impacted by the speed of economic recovery. A robust economy should more quickly propel our earnings. A stagnant economy or a double dip recession will obviously slow the pace of our recovery. Our strategy, however, remains consistent. Some of the examples I referred to earlier illustrate our ability to execute this strategy and acquire business in this current downturn.
33
Slide 49: Question 9
|
|
9.
|
We have noticed a number of recent purchases of First United Corporation common stock by First United insiders. What is up with that?
|
|
|
Several of our directors and executive officers have recently purchased shares of our stock. Unlike the common investor, our insiders are subject to company-imposed “blackout” periods during which times they are prohibited by company policy from buying or selling our stock. In fact, in 2010, the insiders were in “blackout” for most of the 365 days. These blackout periods are imposed toward the end of every quarter and at any other time when insiders, because of their roles in transactions or other material events, are in possession of material nonpublic information. Once we issue our earnings release for the quarter, or once information about other events are released to the public, these blackouts are lifted. Typically, the trading window between blackout periods is very short, so insiders have only a limited opportunity to trade in our stock.
|
|
|
Shortly after we released our 1st Quarter earnings, many insiders decided to purchase stock. There is nothing more or nothing less to these transactions than a desire on the part of these insiders to invest in First United. There is nothing else afoot. If there were, we would still be in blackout.
|
34
Slide 50: The Difference
As we begin to look to our future, we are beginning to see a slow but steady increase in loan demand. The ravages of the recession are seared into the minds of many of our community oriented business owners. They have been rightfully cautious about borrowing. They are working with First United as we together build solutions which will meet their needs and provide a good quality loan for the Bank. As our funding is deployed into loans, we should see an increase in earnings to the bottom line.
Throughout the organization, there is a renewed focus on building core deposits. The easiest way to think of core deposits is that they are products which do not have maturities, such as Certificate of Deposits (CD). As such, they represent a lower cost of funding for the Company. As we grow in number of core accounts for both our branch and commercial companies, we should be able to both lower our interest costs and be in a great position to build strong relations with our customers. The core checking account is generally a customer’s primary account, and services can be added, which does several things.
As we have more of the customer’s business, we have a much better opportunity of helping them reach their financial goals. We understand their goals and objectives, and can tailor services to meet their needs. It is also well known that the more services customers have with their bank, the more likely they are to stay with the bank. And, importantly, when customers stay with their bank, that bank generally does better. As our loans grow, and our core deposits expand, we should see growth in our net interest income. This is the source of most of our income.
35
Supplementing this revenue stream is non-interest income. Charges associated with deposit accounts are under full assault by our regulators. In recent years we have seen declines in many of these categories. We will continue to explore opportunities to staunch this decline and implement new value-based charges where appropriate.
Our trust and investment area continues to show both good growth and strong earnings. Gene Helbig and his team have done a remarkable job in delivering value in terms of investment returns, financial education and excellent customer service. They now have over $600 million in assets under management. To put that in perspective, you may know I began my career in the trust department in 1978 – at that time, we had $6 million in assets.
As our sources of revenue expand, we will continue to be vigilant about controlling costs and managing expenses. As a testament to that, we have seen a decrease of over 46 employees in the last two years.
As we begin to come out of this recession, and win this war, we are encouraged by our 5 year projections, which are based on various internally-developed estimates and assumptions. Although I am not able to share these projections with you, suffice to say that we will have a lot of hard work in both cleansing our balance sheet and repositioning it for the future. But, then again, the associates working for you at First United have never been afraid of hard work. They are totally dedicated to this task.
36
Your Board, as well, is committed to this task. Their hard work and counsel has been vital to our steering through these challenges. I do want to recognize two of our directors, who will be retiring as of this meeting. Both Ray Hinkle and Faye Cannon will be missed. Their guidance, wisdom and insights will be missed, and we wish them the best in retirement.
As I conclude my thoughts for this year’s meeting, I want to share thoughts of a letter from a wonderful shareholder from Myersville, MD. Her letter reminded me that this was not the first time that the banks which make up First United had been down this path. There was a common thread between the Myersville Bank, The First National Bank of Piedmont, Cumberland Savings Bank, The First National Bank of Barton, Citizens National Bank, The First National Bank of Friendsville and First National Bank of Oakland. This common thread of the banks which represent the ancestry of First United was a desire to survive the Depression, thrive in the recovery, and continue serving their communities, customers and shareholders. The letter I referred to told of a strategy Mr. Waters used at the Myersville Bank during the depression. The depositors agreed to forego interest on all their deposits.
I am told also of a banker in Baltimore that kept mortgages current if the customer could pay any amount. These are the steps which Mr. Waters, Mr. Naughton, Mr. Littman and others followed to keep their banks moving forward in much less regulated environment that what we have today. I am not here to lament the high level of regulation – although it is tempting. Rather, it is to point up the shared commitment we have with these bankers of the past. While I have no idea of the earnings of the banks through the depression, or how it impacted stock prices, it would be reasonable to assume that it might not be much different than today.
37
Just like these bankers of old, we are excited about our future and chaffing for the battles to be over so that we can be fully focused on serving customers, communities and shareholders.
We thank you, our shareholders, for your support and look forward to serving you in the years to come. Thank you.
Slide 51: Thank you.
38