Attached files
| file | filename |
|---|---|
| 8-K - FORM 8-K - Encompass Health Corp | form8k_baml05102011.htm |

Bank of America Merrill Lynch 2011 Healthcare
Conference
Las Vegas, NV| May 10-12, 2011
Conference
Las Vegas, NV| May 10-12, 2011
Jay Grinney, President and Chief Executive Officer
Exhibit 99.1

The information contained in this presentation includes certain estimates, projections and other forward-
looking information that reflect our current views with respect to future events, strategy, capital
expenditures and financial performance. These estimates, projections and other forward-looking
information are based on assumptions that HealthSouth believes, as of the date hereof, are reasonable.
Inevitably, there will be differences between such estimates and actual events or results, and those
differences may be material.
There can be no assurance that any estimates, projections or forward-looking information will be realized.
All such estimates, projections and forward-looking information speak only as of the date hereof.
HealthSouth undertakes no duty to publicly update or revise the information contained herein.
HealthSouth undertakes no duty to publicly update or revise the information contained herein.
You are cautioned not to place undue reliance on the estimates, projections and other forward-looking
information in this presentation as they are based on current expectations and general assumptions and
are subject to various risks, uncertainties and other factors, including those set forth in the Form 10-K for the
year ended December 31, 2010, our Form10-Q for quarter ended March 31, 2011, and in other documents
we previously filed with the SEC, many of which are beyond our control, that may cause actual events or
results to differ materially from the views, beliefs and estimates expressed herein.
Note Regarding Presentation of Non-GAAP Financial Measures
The following presentation includes certain “non-GAAP financial measures” as defined in Regulation G
under the Securities Exchange Act of 1934. Schedules are attached that reconcile the non-GAAP financial
measures included in the following presentation to the most directly comparable financial measures
calculated and presented in accordance with Generally Accepted Accounting Principles in the United
States. Our Form 8-K, dated May 10, 2011, to which the following supplemental slides are attached as
Exhibit 99.1, provides further explanation and disclosure regarding our use of non-GAAP financial measures
and should be read in conjunction with these supplemental slides.
Forward-Looking Statements
2
Exhibit 99.1

|
Inpatient Rehabilitation Hospitals (“IRF”)
|
|
|
Outpatient Rehabilitation Satellite Clinics
|
|
|
Long-Term Acute Care Hospitals (“LTCH”)
|
|
|
Hospital-Based Home Health Agencies
|
|
|
Employees
|
|
|
Revenue in 2010
|
|
|
Inpatient Discharges in 2010
|
|
|
Outpatient Visits in 2010
|
|
|
Number of States
|
|
|
Exchange (Symbol)
|
|
3
Largest Provider of Inpatient Rehabilitative Healthcare Services in the U.S.
Our Company
|
Marketshare
|
|
~ 8% of IRFs
~ 17% of Licensed Beds ~ 22% of Patients Served |
Drake acquisition in Cincinnati,
OH; expect to close Q4 2011
OH; expect to close Q4 2011
CON approved for Ocala, FL;
expect to be operational Q1
2013
expect to be operational Q1
2013
Exhibit 99.1
Our Hospitals
Major Services
• Rehabilitation Physicians: manage and treat medical needs of patients
• Rehabilitation Nurses: oversee treatment programs of patients
• Physical Therapists: address physical function, mobility, safety
• Occupational Therapists: promote independence and re-integration
• Speech-Language Therapists: treat communication & swallowing disorders
• Case Managers: coordinate care plan with physician, caregivers and family
• Post-discharge services: outpatient therapy and home health
4
Exhibit 99.1
Our Patients
5
Most Common Conditions (Q1 2011)
1.Stroke 17.3%
2.Neurological 16.4%
3.Debility 11.4%
4.Fracture of the lower extremity 11.2%
5.Knee/Hip replacement 8.3%
6.Other orthopedic conditions 9.4%
7.Brain injury 7.3%
8.Cardiac conditions 4.4%
9.Spinal cord injury 3.3%
10.All other 11.0%
Referral Sources
94% Acute Care Hospitals
5% Physician Offices
1% Skilled Nursing Facilities
Admission to an IRF
• Physicians and acute care
hospital case managers are key
decision-makers.
hospital case managers are key
decision-makers.
• All IRF patients must meet
reasonable and necessary criteria
and must be admitted by a
physician.
reasonable and necessary criteria
and must be admitted by a
physician.
• All IRF patients must be medically
stable and have potential to
tolerate three hours of therapy per
day (minimum).
stable and have potential to
tolerate three hours of therapy per
day (minimum).
• IRF patients receive 24-hour, 7
days a week nursing care.
days a week nursing care.
• Average length of stay (ALOS) =
~14 days
~14 days
Exhibit 99.1

Our Payors (Q1 2011)
Prospective Payment System (“PPS”)
• Payments based on Case Mix Groups
(“CMGs”)
(“CMGs”)
– Diagnosis of patient’s illness
• Fixed payment per CMG adjusted for:
– Acuity/severity
– Regional wage differential
• Per diems for “short stays”
Per Diem or CMG
• Negotiated rate
• Some are “tiered” for acuity/severity
Variety of methodologies
Varies by state
Variety of methodologies
Medicare
Managed Care
• Includes managed
Medicare
Medicare
Other Third-Party Payors
Medicaid
Workers’ Comp./
Patients/Other
Patients/Other
Payment Methodology
Payor Source
6
71.2%
20.0%
2.3%
4.8%
1.7%
Exhibit 99.1
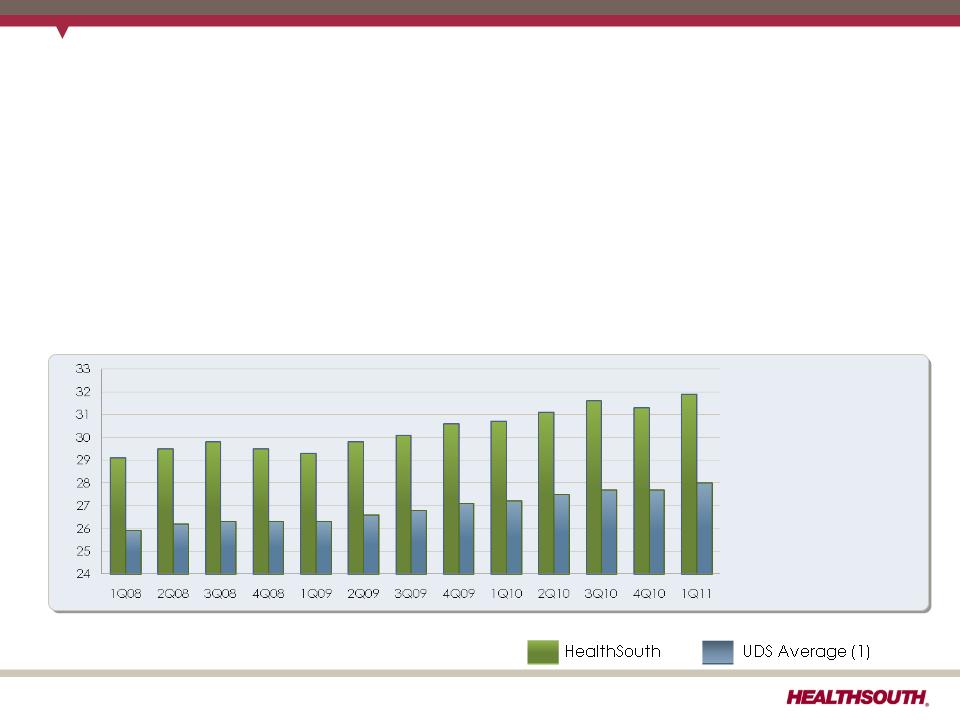
Our Quality
FIM Gain
Change in
Functional
Independence
Measurement
(based on an 18
point assessment)
from admission to
discharge
Functional
Independence
Measurement
(based on an 18
point assessment)
from admission to
discharge
7
(1) Average = Expected, Risk-adjusted
• Inpatient rehabilitation hospitals evaluate all patients at admission and upon
discharge to determine their functional status.
discharge to determine their functional status.
− The Functional Independence Measurement (“FIM”) patient assessment
instrument is used for these evaluations.
instrument is used for these evaluations.
• The difference between the FIM scores at admission and upon discharge is called
the “FIM Gain.”
the “FIM Gain.”
− The greater the FIM Gain, the greater the patient’s level of independence, the
better the patient outcome.
better the patient outcome.
Exhibit 99.1
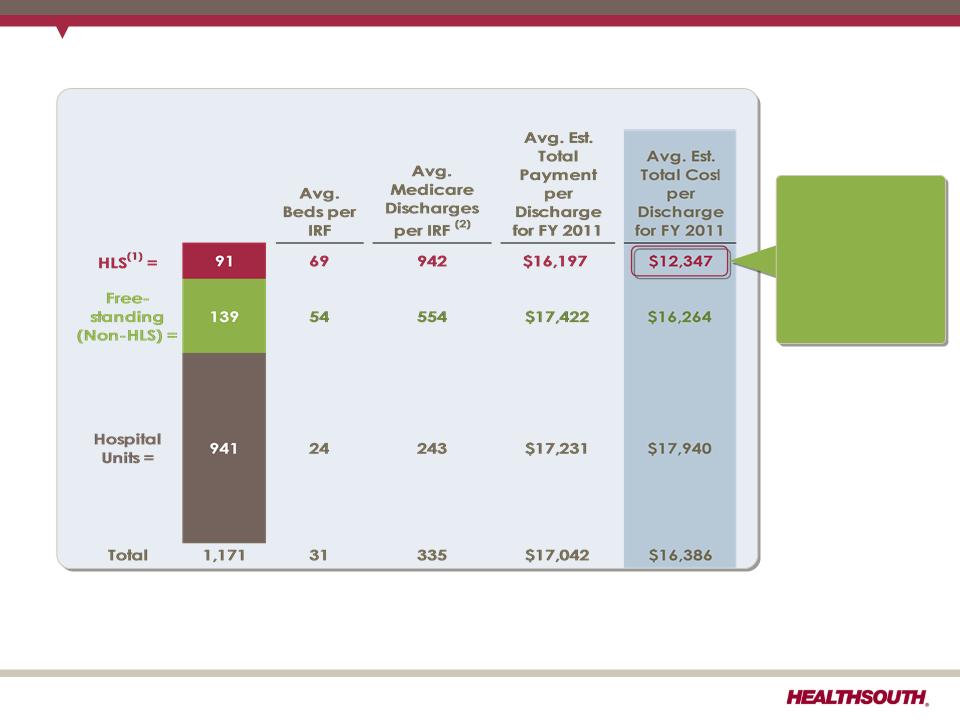
(1) The 1,171 total and the 91 for HLS do not include HealthSouth Rehabilitation Hospital of Northern Virginia; Rehabilitation Hospital of Southwest Virginia;
Rehabilitation Hospital of Mesa, AZ; and Rehabilitation Hospital of Fredericksburg, VA. that were opened after the data collection. Desert Canyon
Rehabilitation Hospital and HealthSouth Sugar Land Rehabilitation Hospital, currently owned by HLS, were included in the 139 non-HLS freestanding.
Rehabilitation Hospital of Mesa, AZ; and Rehabilitation Hospital of Fredericksburg, VA. that were opened after the data collection. Desert Canyon
Rehabilitation Hospital and HealthSouth Sugar Land Rehabilitation Hospital, currently owned by HLS, were included in the 139 non-HLS freestanding.
(2) In 2009, HealthSouth averaged 1,177 total Medicare and non-Medicare discharges in its 90 consolidated hospitals and 6 long-term acute care hospitals.
Sources: FY 2011 CMS Rate Setting File - see slide 27
8
Total Inpatient Rehabilitation Facilities (IRFs): 1,171 (1)
Our Cost-Effectiveness
HealthSouth
differentiates
itself by
providing
superior quality
care at a
differentiates
itself by
providing
superior quality
care at a
lower cost.
Exhibit 99.1
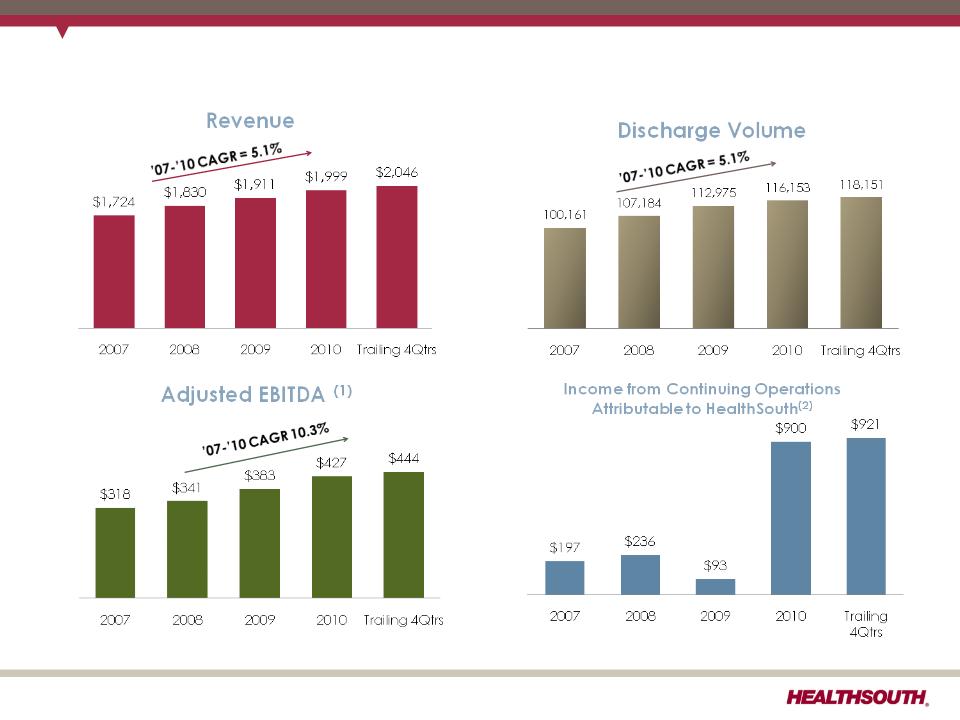
Our Track Record
($ in millions)
(1) Reconciliation to GAAP provided on slides 28-33 and 37.
(2) 2010 and Trailing 4Qtrs both include a tax benefit of ~$825 million for the reversal of the valuation allowance.
9
Exhibit 99.1
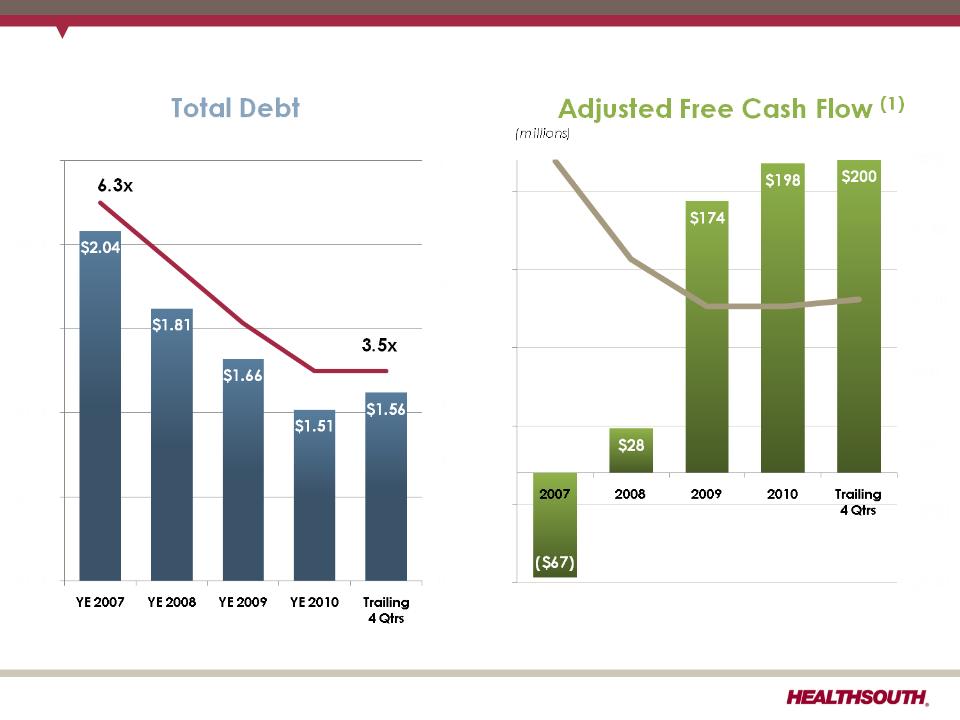
Our Track Record
10
Leverage Ratio(1)
(billions)
(1) Reconciliation to GAAP provided on slides 28-33, 36, and 37.
Interest Expense
$229
$131
Exhibit 99.1

Q1 2011 Highlights (Q1 2011 vs. Q1 2010)
ü Revenue growth of 9.6%
― Inpatient revenue growth of 9.2% driven by volume and price
§ Discharge growth 7.1%; same-store discharge growth 4.5%
• Against soft volume growth in Q1 2010
• Continued positive contribution from hospitals opened or acquired in the last
12 months
12 months
ü Adjusted EBITDA(1) grew 16.0%.
― Revenue growth driven by volume and pricing, disciplined expense
management, lower general and administrative expense, and lower bad
debt expense
management, lower general and administrative expense, and lower bad
debt expense
― Net benefit related to state provider taxes of net $1.1 million
ü Strong adjusted free cash flow generation (2)
― Higher Adjusted EBITDA
― Offset by anticipated increase in working capital, interest expense, and
maintenance capital expenditures
maintenance capital expenditures
― The final swap payment of $10.9 million was made in March 2011.
11
(1) Reconciliation to GAAP provided on slides 28, 29, 33, and 37.
(2) Reconciliation to GAAP provided on slide 36.
Exhibit 99.1
2011 Guidance - Adjusted EBITDA
Adjusted EBITDA (1)
$440 million to $450 million
(1) Reconciliation to GAAP provided on slides 28, 29, 33, and 37.
Considerations:
ü2010 bad debt expense was 0.9% of revenue; expect 2011 bad debt expense to
be approximately 1.4% of revenue, in line with historical average
be approximately 1.4% of revenue, in line with historical average
üMedicare pricing in Q4 2011 will be reduced by a 120 basis point productivity
adjustment.
adjustment.
üOutpatient revenues subject to approximately $1.4 million reduction related to
the 25% rate reduction for reimbursement of therapy expenses for multiple therapy
services (Medicare physician fee schedule for calendar year 2011CMS).
the 25% rate reduction for reimbursement of therapy expenses for multiple therapy
services (Medicare physician fee schedule for calendar year 2011CMS).
Based on strong results for Q1 2011, HealthSouth expects
its 2011 full-year results to be at the high end of, or
greater than, this guidance range.
its 2011 full-year results to be at the high end of, or
greater than, this guidance range.
12
Exhibit 99.1
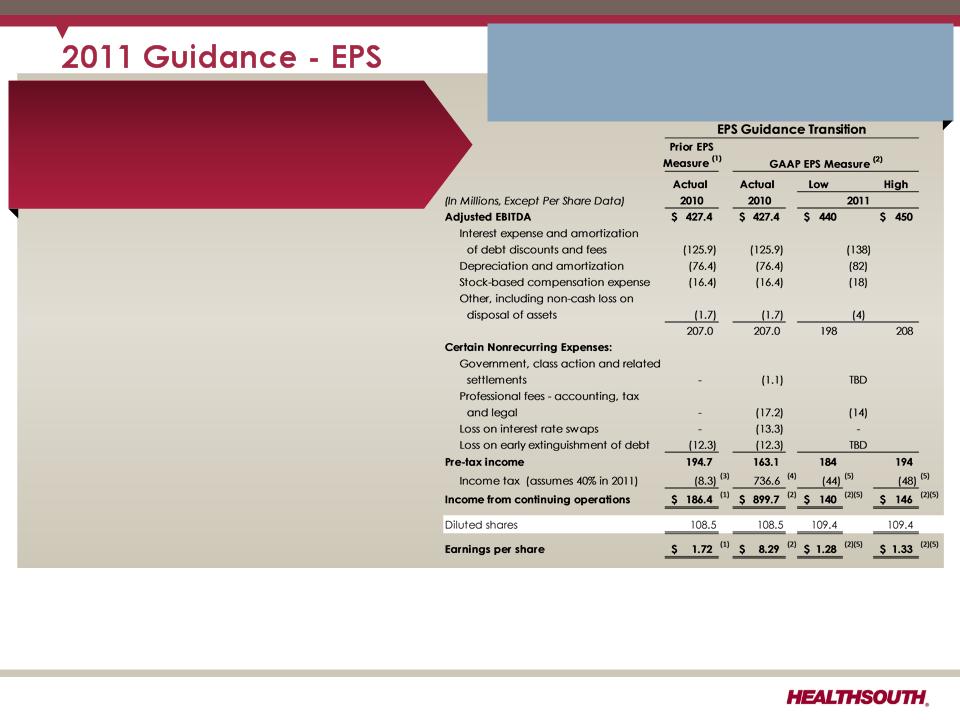
Diluted Earnings per Share from
Continuing Operations Attributable
to HealthSouth (2)
Continuing Operations Attributable
to HealthSouth (2)
$1.28 to $1.33 (5)
Considerations:
ü Includes $0.27 per diluted share benefit for Q1
2011 and assumes provision for income tax of
40% for the remainder of 2011; cash taxes
expected to be $7-$10 million.
2011 and assumes provision for income tax of
40% for the remainder of 2011; cash taxes
expected to be $7-$10 million.
üGuidance does not include any
repayment/refinancing of the 10.75% senior notes
callable in June 2011, which would affect the
following items:
repayment/refinancing of the 10.75% senior notes
callable in June 2011, which would affect the
following items:
• Interest expense will be approximately $10
million higher in the first half of 2011 vs. prior
period in 2010.
million higher in the first half of 2011 vs. prior
period in 2010.
• Does not include “loss on early extinguishment of
debt” (non-cash)
debt” (non-cash)
• Depreciation is estimated to be higher as a result
of capital expenditures in prior periods.
of capital expenditures in prior periods.
Based on strong results for Q1 2011, HealthSouth
expects its 2011 full-year results to be at the
high end of, or greater than, this guidance
range.
expects its 2011 full-year results to be at the
high end of, or greater than, this guidance
range.
(1) Adjusted income from continuing operations. This non-GAAP measure was part of our historical guidance. A reconciliation of adjusted income from
continuing operations to the corresponding GAAP measure can be found on slides 34 and 35.
continuing operations to the corresponding GAAP measure can be found on slides 34 and 35.
(2) Income from continuing operations attributable to HealthSouth
(3) Current period amounts in income tax provision; see slides 34 and 35
(4) Total income tax provision for full-year 2010, including the reversal of a substantial portion of the Company's valuation allowance against deferred tax assets.
(5) Includes a $0.27 per diluted share benefit related to the Company’s settlement with the IRS for tax years 2007 and 2008, and a reduction in unrecognized tax
benefits due to the lapse of the statute of limitations for certain federal and state claims.
benefits due to the lapse of the statute of limitations for certain federal and state claims.
13
Exhibit 99.1
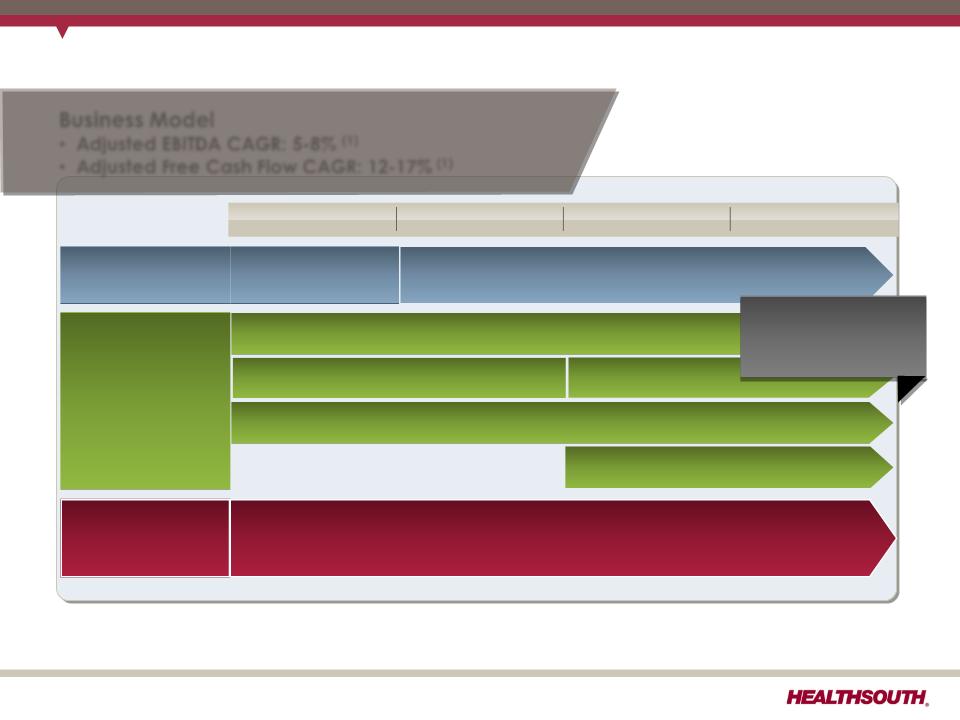
Business Outlook: 2011 to 2013
Business Model
• Adjusted EBITDA CAGR: 5-8% (1)
• Adjusted Free Cash Flow CAGR: 12-17% (1)
Strategy
2010
2011
2012
2013
Deleveraging
(2)
(2)
Achieved 3.5x
debt to EBITDA
debt to EBITDA
Longer-Term Goal: ~ 3.0x debt to EBITDA
Growth
Organic growth (includes capacity expansions)
De novos (~4-6/year)
IRF acquisitions (~ 2-3/year)
Opportunistic, disciplined acquisitions
of complementary post-acute services
of complementary post-acute services
Key Operational
Initiatives
Initiatives
• Beacon (Management Reporting Software) = Labor / outcomes / quality optimization
• TeamWorks = Care Management
• “CPR” (Comfort, Professionalism, Respect) Initiative
(1) Reconciliation to GAAP provided on slides 28 - 33, 36, and 37.
(2) Exclusive of any E&Y recovery.
14
De novos (~2-3/year)
Increased
De novo growth
to ~4-6/year
De novo growth
to ~4-6/year
Exhibit 99.1
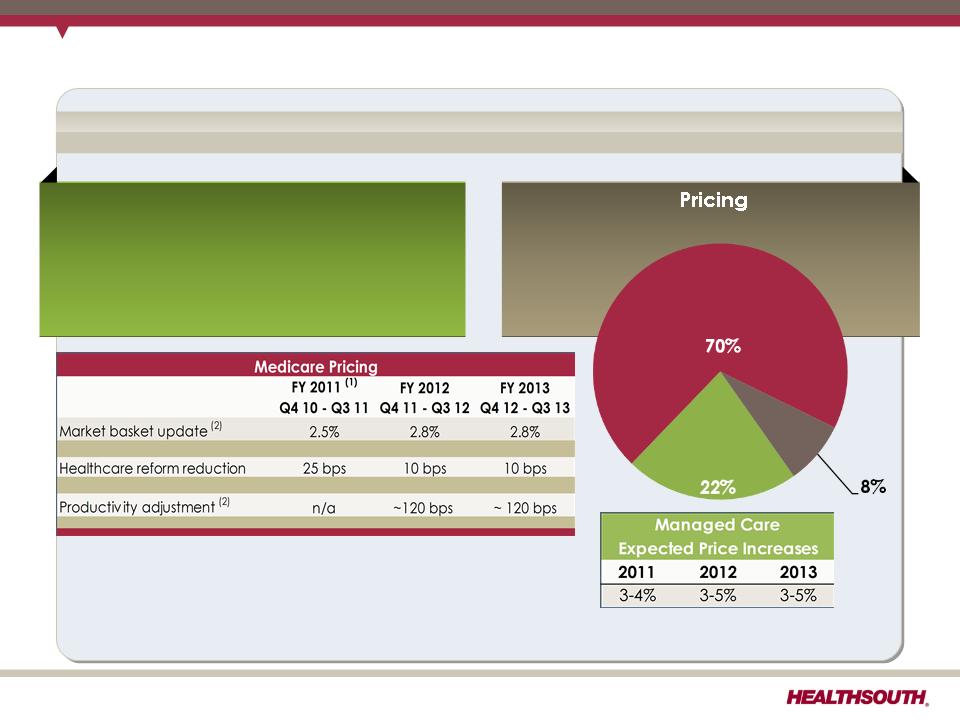
Business Outlook: Revenue Assumptions
Revenue
Volume
•2.5% to 3.5% annual growth (excludes
acquisitions)
acquisitions)
•Includes bed expansions, de novos
and unit consolidations
and unit consolidations
Medicare
Managed
Care
Care
Other
(1) We believe based on the 2011 Medicare rule for IRFs, HealthSouth should realize an increase of approximately 2.1% annually.
(2) CMS proposed IRF Rule for FY 2012 and management estimates for FY 2013
15
Exhibit 99.1
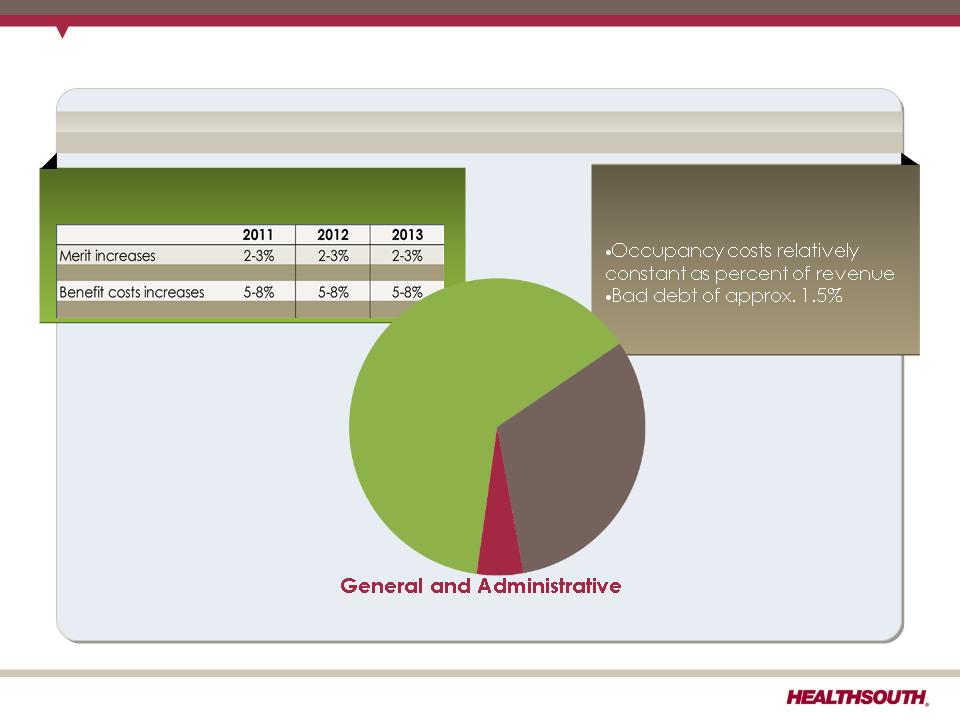
Business Outlook: Expense Assumptions
Expense
Salaries & Benefits (1)
Hospital Expenses
•Other operating and supplies
tracking with inflation
tracking with inflation
4.5% of revenue
(excludes stock-based compensation)
Salaries
& Benefits
Hospital
Expenses
Expenses
(1) Salaries, Wages and Benefits: 85% Salaries and Wages; 15% Benefits
16
Exhibit 99.1
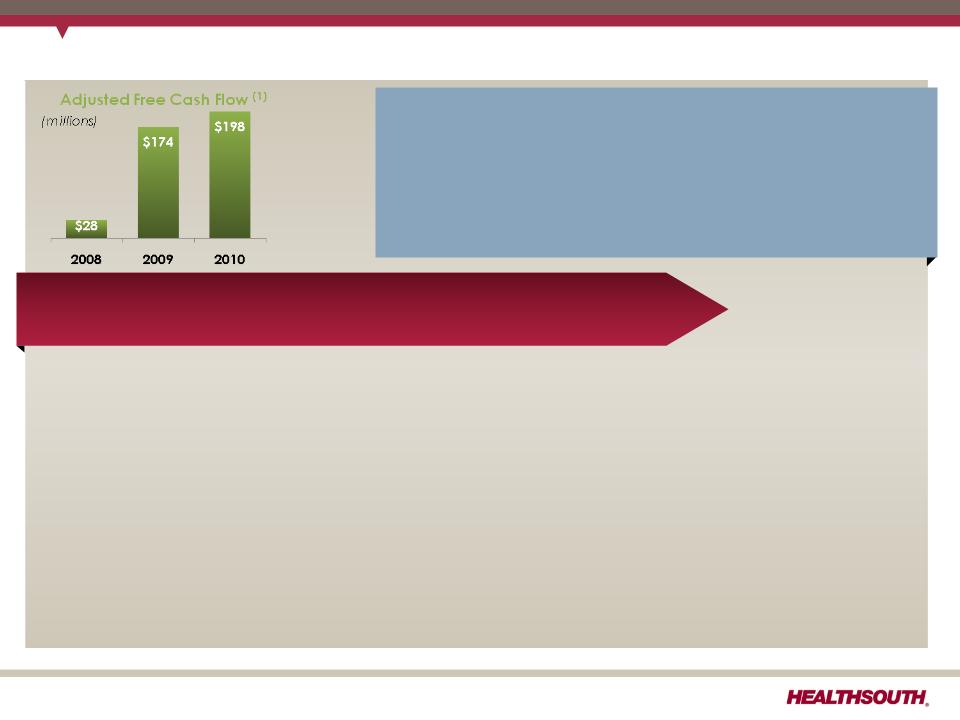
Business Outlook: Adjusted Free Cash Flow (1)
(1) Reconciliation to GAAP provided on slide 36.
• Items that will affect Adjusted Free Cash Flow in 2011:
+ Cash settlements for interest rate swaps will be $33.8 million lower in 2011.
+ Interest expense will be reduced by ~$12 million in the second half of 2011 as a result of a
plan to call $285 million of the 10.75% senior notes callable in June 2011.
plan to call $285 million of the 10.75% senior notes callable in June 2011.
– Maintenance capital expenditures are estimated to be approximately $20 million higher
in 2011 than 2010.
in 2011 than 2010.
– Interest expense will be approximately $10 million higher in the first half of 2011 versus
prior period, preceding the repayment/refinancing of $285 million of the 10.75% senior
notes.
prior period, preceding the repayment/refinancing of $285 million of the 10.75% senior
notes.
• 2010 working capital benefited from a shift in timing of interest payments related to the
refinancing in Q4 2010, offset by the $6.9 million unwind fee related to the termination of
the two forward-starting interest rate swaps.
refinancing in Q4 2010, offset by the $6.9 million unwind fee related to the termination of
the two forward-starting interest rate swaps.
HealthSouth’s GAAP income statement will be affected by a
number of items that will not affect cash flow from operating
activities or adjusted free cash flow:
number of items that will not affect cash flow from operating
activities or adjusted free cash flow:
•Normalized GAAP tax rate resulting from the valuation
allowance reversal in Q4 2010.
allowance reversal in Q4 2010.
•Loss on early extinguishment of debt
Multi-Year Adjusted Free Cash Flow 12% to 17% CAGR
17
Exhibit 99.1
Free Cash Flow Reinvestment
18
• $500 million of 10.75% notes callable June 2011
• Growth in core business
• Bed expansions
• De novo hospitals
• Hospital acquisitions
• Acute care IRF unit acquisition/consolidation
• Purchase properties under operating leases
• Lower capital cost
• Greater control of property, CON and/or license
• Share repurchase
• Offset shares underlying convertible preferred shares
• Offset shares issued in settlement of securities litigation
Business Model: Adjusted free cash flow CAGR: 12-17%
• Acquisitions of complementary businesses
Exhibit 99.1

(1) Does not include $387.4 million of convertible perpetual preferred stock and ~$123 million of capital leases and other note payables.
Initial Call of the 10.75% Senior Notes
19
Call schedule:
June 15, 2011 (price 105.375);
June 15, 2012 (price 103.583);
June 15, 2013 (price 101.792);
June 15, 2014 and thereafter
(price 100.000)
(price 100.000)
As of March 31, 2011
$49 LC
$500
Revolver
L+350
§Plan to call $285 million in principal on June 15, 2011
§Cash use of approx. $300 million ($223 million revolver and $77 million cash)
• Interest savings for second half of 2011 will be ~$12 million
• Loss on early extinguishment of debt is expected to be ~$23 million.
Debt Maturity Profile (1)
Exhibit 99.1

Accelerated IRF De Novo Strategy
• Targeting to at least double the number of de novos per year
– Highest and best use of cash and available capital
– Reflects success of recent de novo activity
– High returns and relatively low risk
– Incremental capital of approx. $20 million per IRF
• Driven by availability of capital and refined market analysis
– Proprietary screening tool remains at the core of market selection
– Market analysis refined based on recent de novo history and analysis of
legacy HealthSouth IRF’s
legacy HealthSouth IRF’s
• Cautious approach toward diversifying into other post-acute services
– ACO direction unclear
– Regulatory uncertainty remains
20
Exhibit 99.1
(1) Reconciliation to GAAP provided on slides 28 - 33, 36, and 37.
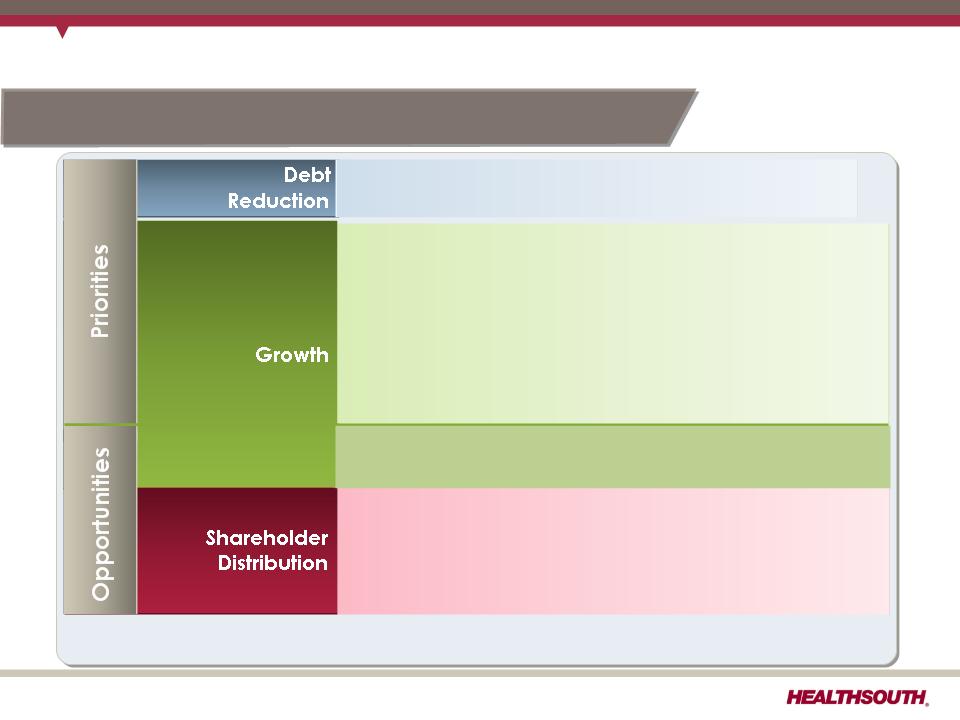
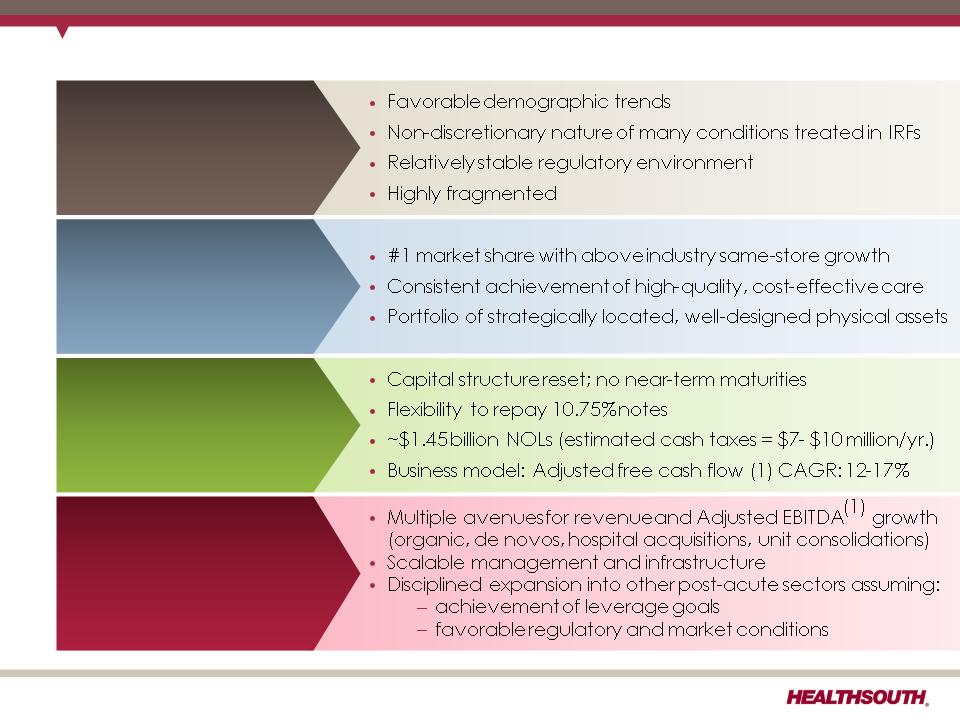
The HealthSouth Value Proposition
Poised for Growth
Financial Strength/Strong
Cash Flow Generation
Cash Flow Generation
Industry Leading Position
Attractive Healthcare Sector
21
Exhibit 99.1

Appendix
22
Exhibit 99.1

Business Outlook: Income Tax Considerations
|
GAAP Considerations:
• As of 3/31/11, the Company had a remaining valuation allowance of approximately
$106 million, primarily related to state NOLs. • Q1 2011 tax provision reflects a tax benefit of $0.27 per diluted share related to the
Company’s settlement with the IRS for tax years 2007 and 2008 and a reduction in unrecognized tax benefits due to the lapse of the statute of limitations for certain federal and state claims. The settlement resulted in an increase to our federal NOLs, which had an ending balance of approx. $1.45 billion as of 3/31/11. • Expect effective tax rate of ~40% going forward
Future Cash Tax Payments:
• The Company expects to pay approximately $7-$10 million per year of income tax.
•The Company does not expect to pay significant federal income taxes for up to 10
years. •HealthSouth is not currently subject to an annual use limitation (“AUL”) under Internal
Revenue Code Section 382 (“Section 382”). A “change of ownership,” as defined by Section 382, would subject us to an AUL, which is equal to the market capitalization of the Company at the time of the “change of ownership” multiplied by the long-term tax exempt rate. |
23
Exhibit 99.1
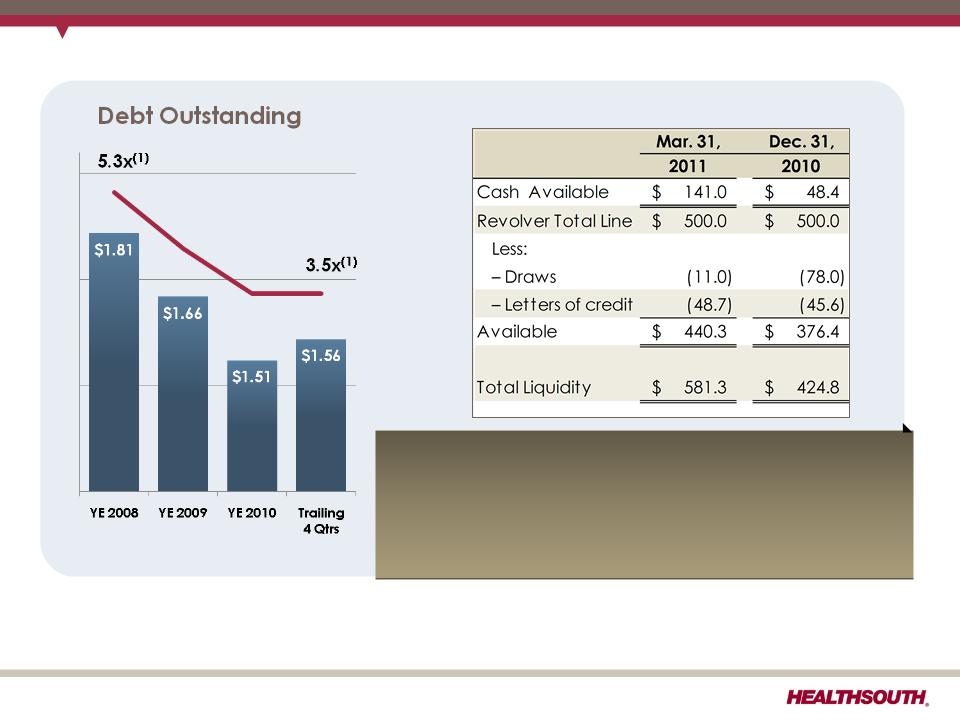
(1) Based on 2008 and trailing 4 quarter Adjusted EBITDA of $341.2 million and $444.4 million, respectively; reconciliation to GAAP provided
on slides 28 - 31, 33, and 37.
on slides 28 - 31, 33, and 37.
(2) Cash settlements flow through investing activities for swaps that do not qualify for hedge accounting. Net notional amount of $884 million
received 3-month LIBOR and paid 5.22% fixed until expiration in March of 2011.
received 3-month LIBOR and paid 5.22% fixed until expiration in March of 2011.
Debt, Liquidity, and Swaps
Swaps (2)
The final cash settlement on our net $884 million swaps
for $10.9 million was made in Q1 2011.
for $10.9 million was made in Q1 2011.
Liquidity
24
Exhibit 99.1
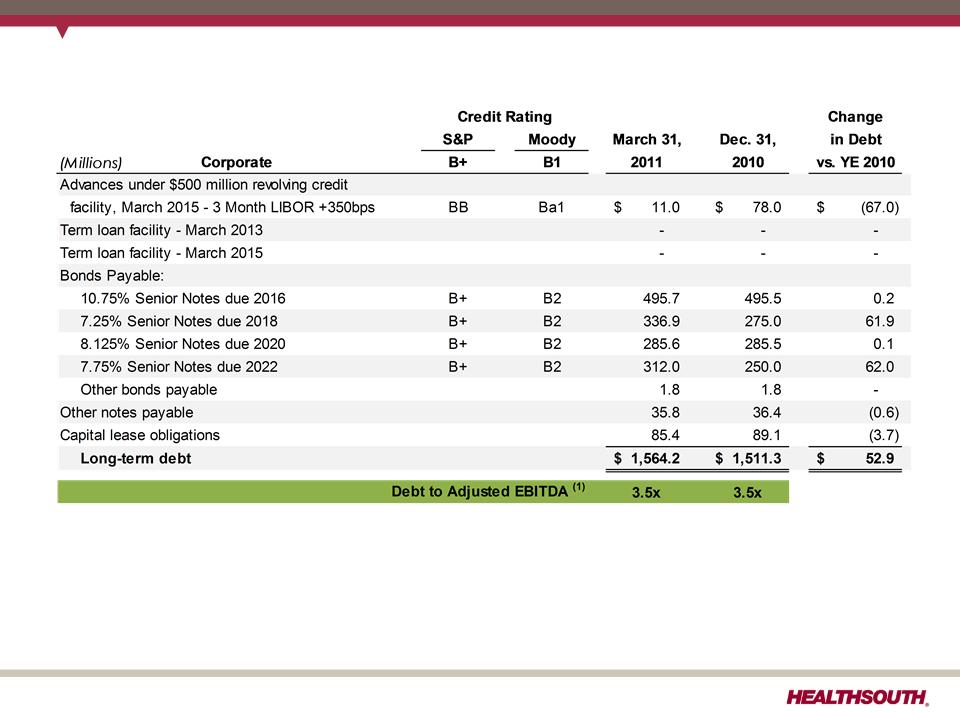
Debt Schedule
(1) Based on 4 quarter trailing and 2010 Adjusted EBITDA of $444.4 million and $427.4 million, respectively; reconciliation to GAAP provided
on slides 28, 29, 33, and 37.
on slides 28, 29, 33, and 37.
25
Exhibit 99.1
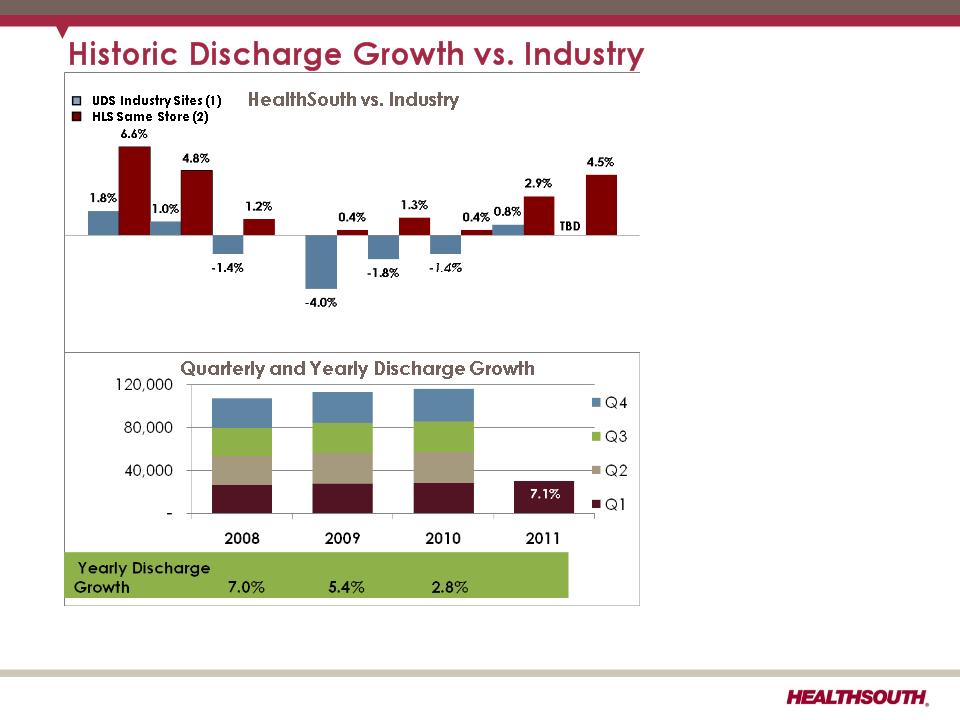
(1) Data provided by UDSMR, a data gathering and analysis organization for the rehabilitation industry; represents ~ 65-70% of industry,
including HealthSouth sites.
including HealthSouth sites.
(2) Includes consolidated HealthSouth inpatient rehabilitation hospitals and long-term acute care hospitals classified as same store during
that time period.
that time period.
• HealthSouth’s
volume growth has
outpaced
competitors’.
volume growth has
outpaced
competitors’.
• TeamWorks =
standardized and
enhanced sales &
marketing
standardized and
enhanced sales &
marketing
• Bed additions will
help facilitate
continued organic
growth.
help facilitate
continued organic
growth.
10.7%
9.4%
5.6%
2.6%
4.6%
5.5%
5.8%
5.8%
5.3%
2.5%
2.2%
1.1%
26
2008 vs. 2009 vs. 2010 vs. Q110 vs. Q210 vs. Q310 vs. Q410 vs. Q111 vs.
2007 2008 2009 Q109 Q209 Q309 Q409 Q110
Exhibit 99.1

CMS Fiscal Year 2011 IRF Rate Setting File Analysis
Notes:
(1) All data provided was filtered and compiled from the Centers for Medicare and
Medicaid Services (CMS) Fiscal Year 2011 IRF rate setting Final Rule file found at
http://www.cms.hhs.gov/InpatientRehabFacPPS/07_DataFiles.asp#TopOfPage. The
data presented was developed entirely by CMS and is based on its definitions
which are different in form and substance from the criteria HealthSouth uses for
external reporting purposes. Because CMS does not provide its detailed
methodology, HealthSouth is not able to reconstruct the CMS projections or the
calculation.
(2) The CMS file contains data for each of the 1,171 inpatient rehabilitation facilities
used to estimate the policy updates for the FY 2011 IRF-PPS Final Rule. Most of the
data represents historical information from the CMS fiscal year 2009 period and
does not reflect the same HealthSouth hospitals in operation today. The data
presented was separated into three categories: Freestanding, Units, and
HealthSouth. HealthSouth is a subset of Freestanding and the Total.
27
Exhibit 99.1
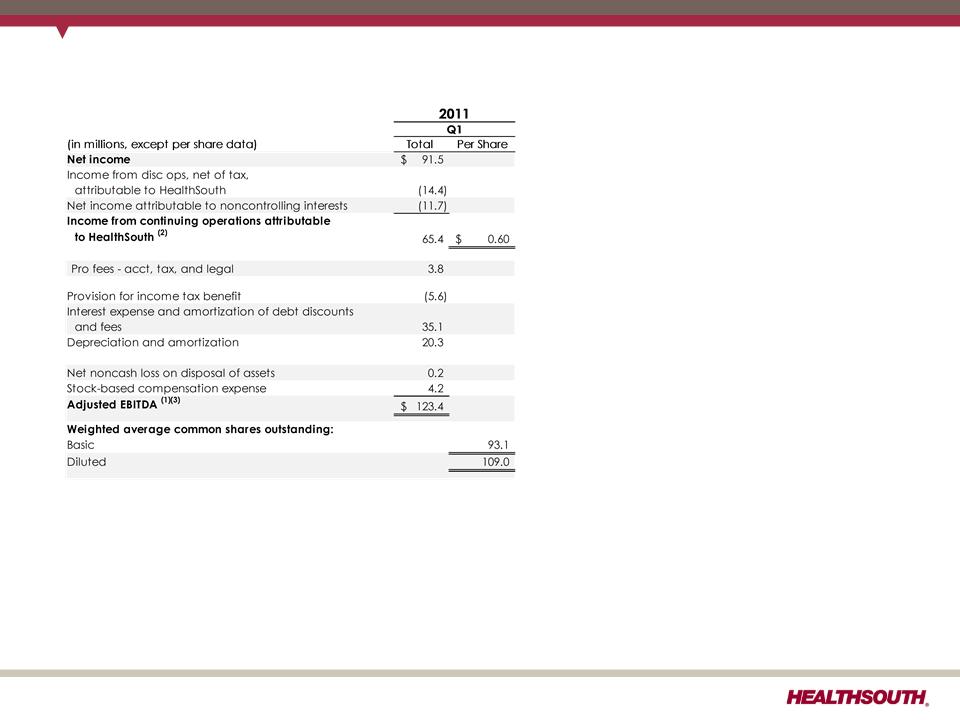
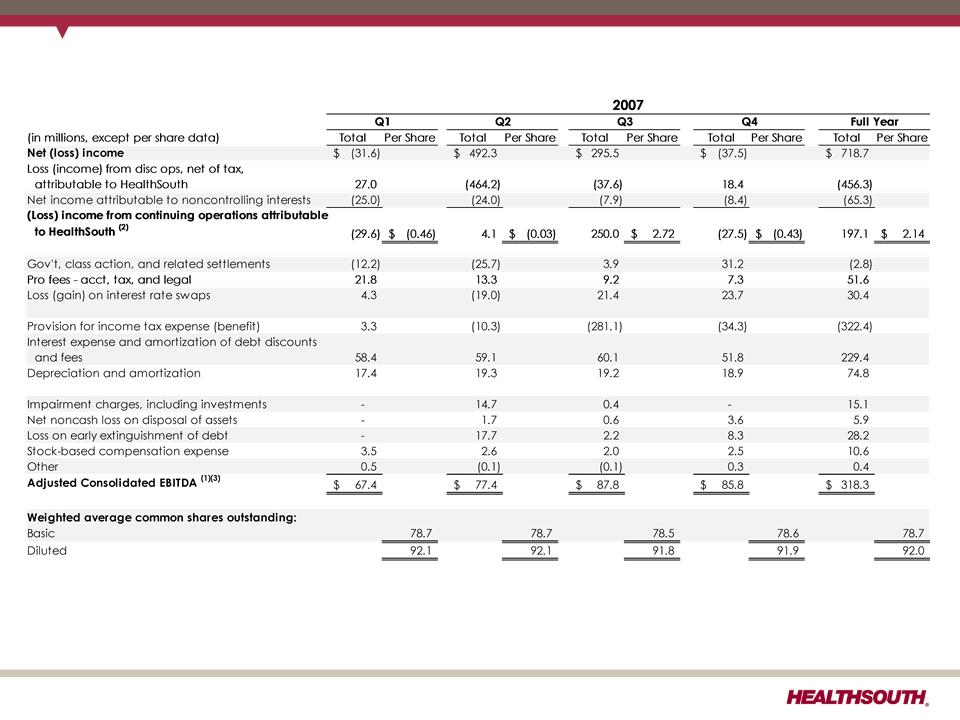
Reconciliation of Net Income to Adjusted EBITDA (1)(3)
(1) (2) (3) - Notes on page 33.
28
Exhibit 99.1
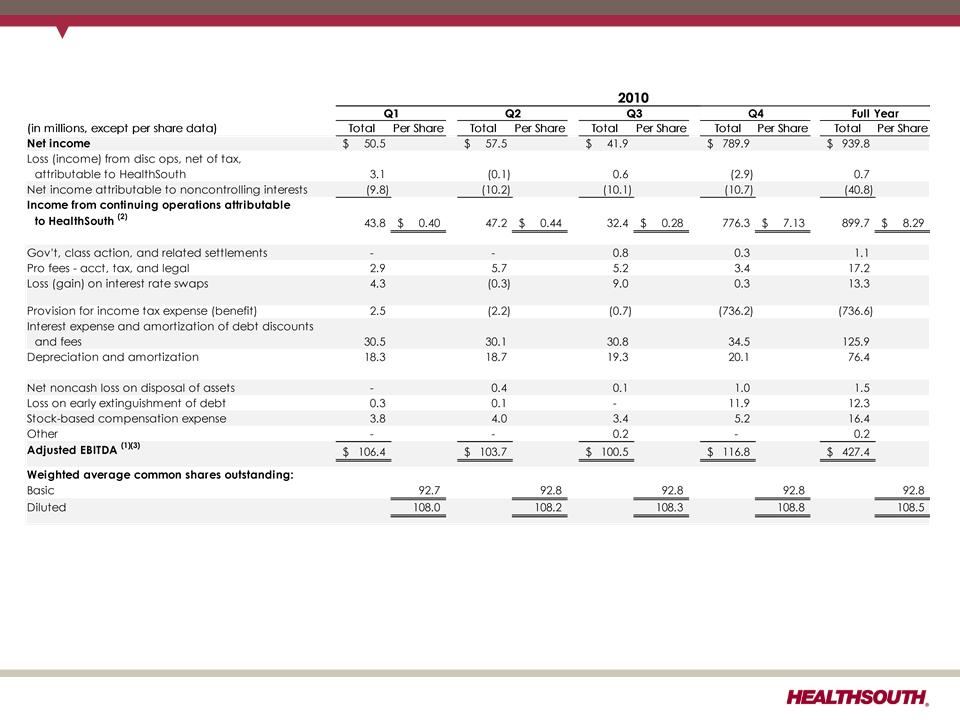
Reconciliation of Net Income to Adjusted EBITDA (1)(3)
(1) (2) (3) - Notes on page 33.
29
Exhibit 99.1
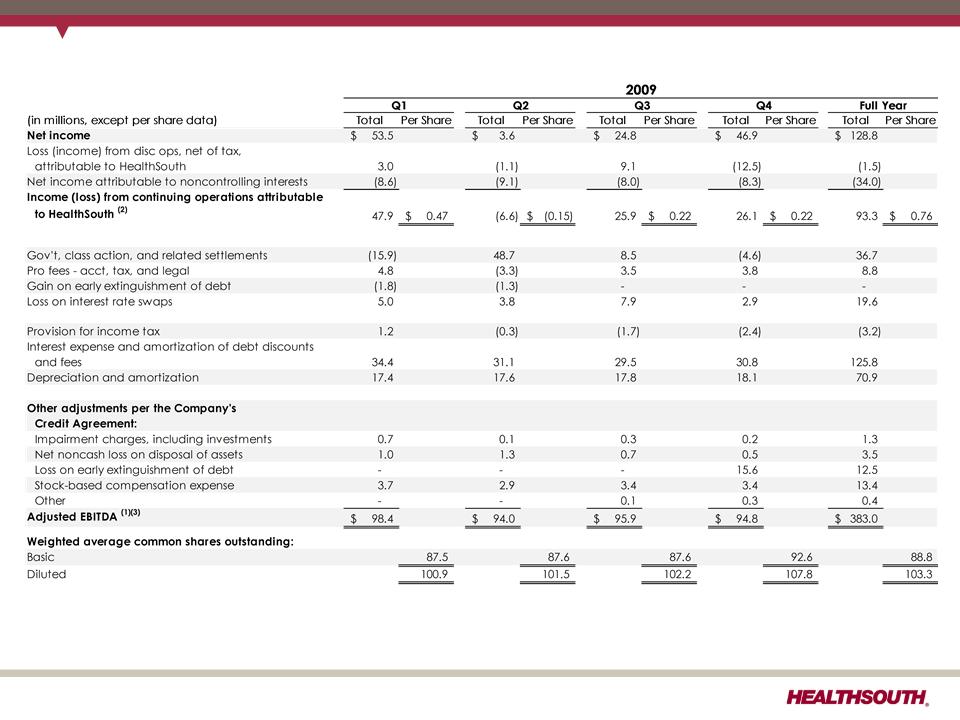
Reconciliation of Net Income to Adjusted EBITDA (1) (3)
(1) (2) (3) - Notes on page 33.
30
Exhibit 99.1
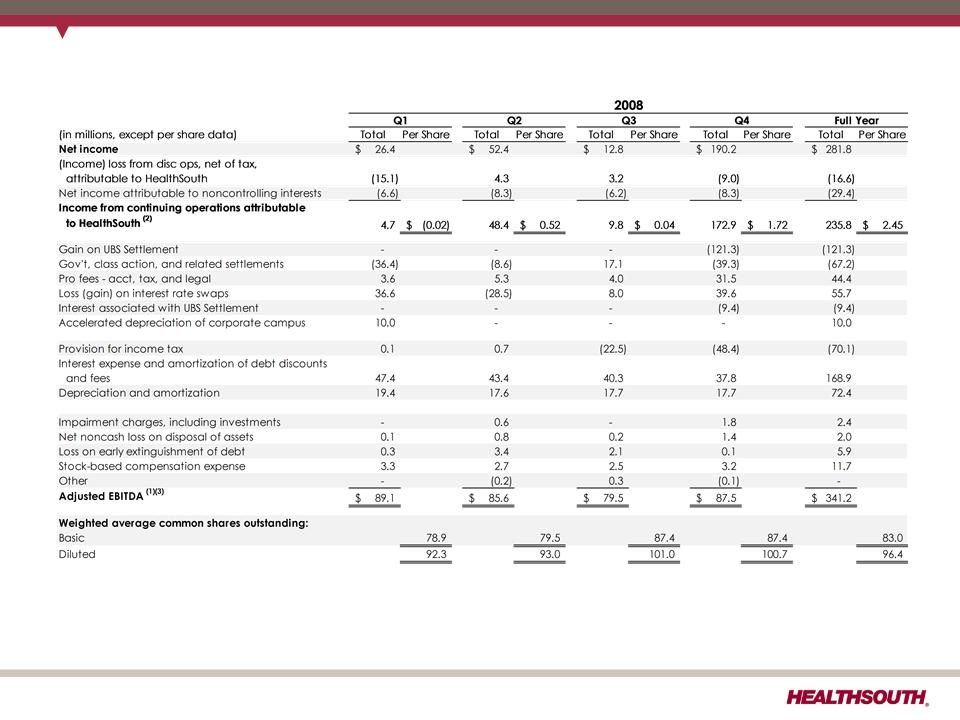
Reconciliation of Net Income to Adjusted EBITDA (1) (3)
(1) (2) (3) - Notes on page 33.
31
Exhibit 99.1
32
Reconciliation of Net Income to Adjusted EBITDA (1) (3)
(1) (2) (3) - Notes on page 33.
Exhibit 99.1

Reconciliation Notes for Slides 28-32
1. Adjusted EBITDA is a non-GAAP financial measure. The Company’s leverage ratio (total
consolidated debt to Adjusted EBITDA for the trailing four quarters) is, likewise, a non-
GAAP financial measure. Management and some members of the investment
community utilize Adjusted EBITDA as a financial measure and the leverage ratio as a
liquidity measure on an ongoing basis. These measures are not recognized in
accordance with GAAP and should not be viewed as an alternative to GAAP
measures of performance or liquidity. In evaluating Adjusted EBITDA, the reader should
be aware that in the future HealthSouth may incur expenses similar to the adjustments
set forth above.
2. Per share amounts for each period presented are based on diluted weighted average
shares outstanding unless the amounts are antidilutive, in which case the per share
amount is calculated using the basic share count after subtracting the $6.5 million per
quarter dividend on the convertible perpetual preferred stock. The difference in shares
between the basic and diluted shares outstanding is primarily related to our
convertible perpetual preferred stock.
3. Adjusted EBITDA is a component of our guidance.
33
Exhibit 99.1
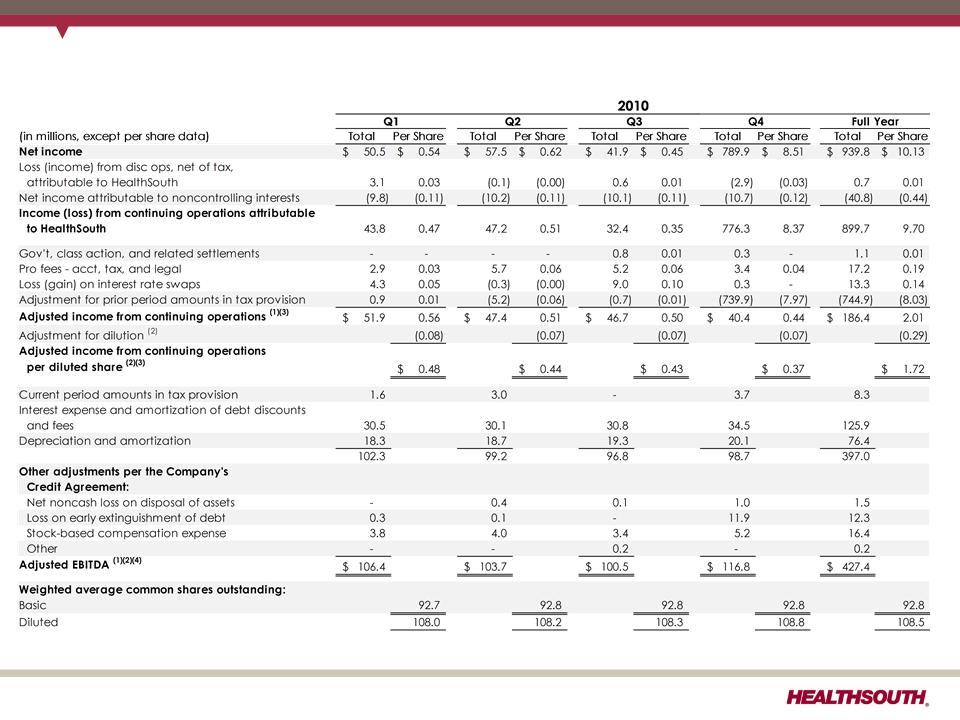
Reconciliation of Net Income to Adjusted Income from Continuing Operations and
Adjusted EBITDA (1) (3) (4)
Adjusted EBITDA (1) (3) (4)
(1) (2) (3) (4) - Notes on page 35.
34
Exhibit 99.1

Reconciliation Notes for Slide 34
1. Adjusted income from continuing operations and Adjusted EBITDA are non-GAAP
financial measure. The Company’s leverage ratio (total consolidated debt to Adjusted
EBITDA for the trailing four quarters) is, likewise, a non-GAAP financial measure.
Management and some members of the investment community utilize adjusted
income from continuing operations as a financial measure and Adjusted EBITDA and
the leverage ratio as liquidity measures on an ongoing basis. These measures are not
recognized in accordance with GAAP and should not be viewed as an alternative to
GAAP measures of performance or liquidity. In evaluating these adjusted measures,
the reader should be aware that in the future HealthSouth may incur expenses similar
to the adjustments set forth above.
2. Per share amounts for each period presented are based on basic weighted average
common shares outstanding for all amounts except adjusted income from continuing
operations per diluted share, which is based on diluted weighted average shares
outstanding. The difference in shares between the basic and diluted shares
outstanding is primarily related to our convertible perpetual preferred stock.
3. Adjusted income from continuing operations per diluted share and Adjusted EBITDA
are two components of our historical guidance.
are two components of our historical guidance.
4. The Company’s credit agreement allows certain other items to be added to arrive at
Adjusted EBITDA, and there may be certain other deductions required.
Adjusted EBITDA, and there may be certain other deductions required.
35
Exhibit 99.1
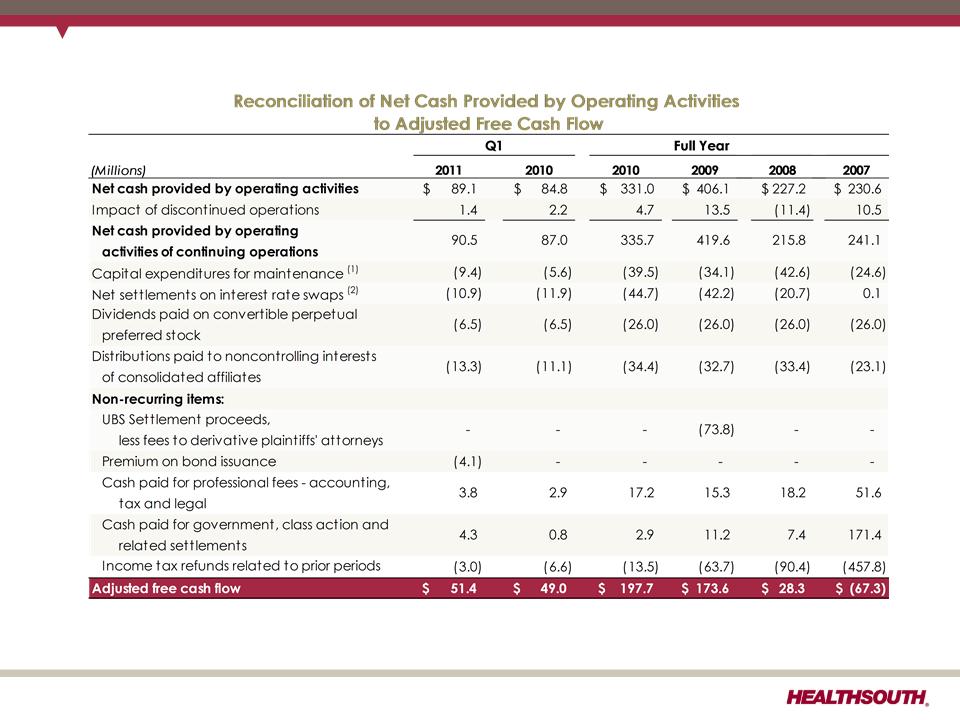
Adjusted Free Cash Flow
(1) Maintenance capital expenditures are expected to be $20 million higher in 2011 than in 2010.
(2) Final swap payment of $10.9 million was made in March 2011.
36
Exhibit 99.1
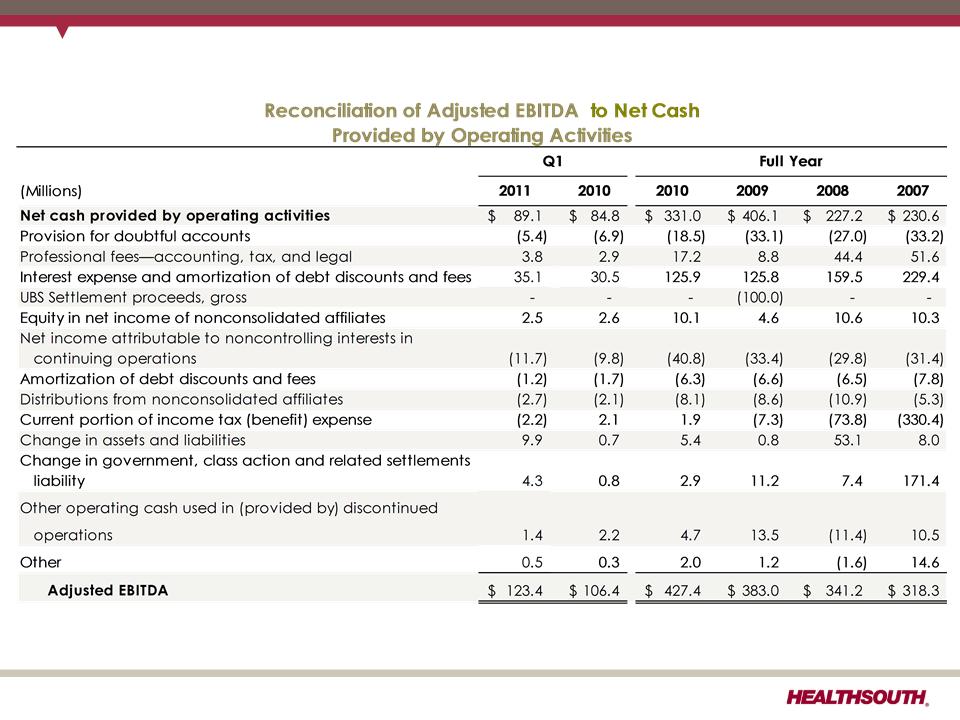
Net Cash Provided by Operating Activities
37
Exhibit 99.1