Attached files
UNITED STATES
SECURITIES AND EXCHANGE COMMISSION
Washington, D.C. 20549
FORM 10-K
(Mark One)
|
[ X ]
|
ANNUAL REPORT PURSUANT TO SECTION 13 OR 15 (d) OF THE SECURITIES EXCHANGE ACT OF 1934
|
For the fiscal year ended February 26, 2011
OR
|
[ ]
|
TRANSITION REPORT PURSUANT TO SECTION 13 OR 15 (d) OF THE SECURITIES EXCHANGE ACT OF 1934
|
For the transition period from ____________________ to ____________________
Commission file number 1-4141
THE GREAT ATLANTIC & PACIFIC TEA COMPANY, INC.
(Exact name of registrant as specified in its charter)
Maryland 13-1890974
(State or other jurisdiction of (I.R.S. Employer
incorporation or organization) Identification No.)
2 Paragon Drive
Montvale, New Jersey 07645
(Address of principal executive offices)
Registrant’s telephone number, including area code: 201-573-9700
_________________________________
Securities registered pursuant to Section 12 (b) of the Act:
Title of each class Name of each exchange on which registered
Common Stock - $1 par value OTC Markets, Inc.
9.375% Notes, due August 1, 2039 OTC Markets, Inc.
Securities registered pursuant to Section 12 (g) of the Act: None
_________________________________
Indicate by check mark if the registrant is a well-known seasoned issuer, as defined by Rule 405 of the Securities Act. Yes [ ] No [X]
Indicate by check mark if the registrant is not required to file reports pursuant to Section 13 of Section 15(d) of the Act. Yes [ ] No [X]
Indicate by check mark whether the Registrant (1) has filed all reports required to be filed by Section 13 or 15 (d) of the Securities Exchange Act of 1934 during the preceding 12 months (or for such shorter period that the Registrant was required to file such reports), and (2) has been subject to such filing requirements for the past 90 days. Yes [ X ] No [ ]
Indicate by check mark whether the registrant has submitted electronically and posted on its corporate website, if any, every Interactive Data File required to be submitted and posted pursuant to Rule 405 of Regulation S-T (§232.405 of this chapter) during the preceding 12 months (or for such shorter period that the registrant was required to submit and post such files. Yes [ ] No [ ]
Indicate by check mark if disclosure of delinquent filers pursuant to Item 405 of Regulation S-K (§229.405 of this chapter) is not contained herein, and will not be contained, to the best of registrant’s knowledge, in definitive proxy or information statements incorporated by reference in Part III of this Form 10-K or any amendment to this Form 10-K. [ X ]
Indicate by check mark whether the registrant is a large accelerated filer, an accelerated filer, a non-accelerated filer, or a smaller reporting company. See the definitions of “large accelerated filer,” “accelerated filer” and “smaller reporting company” in Rule 12b-2 of the Exchange Act.
Large accelerated filer ________ Accelerated filer X Non-accelerated filer _________ Smaller reporting company__________
Indicate by check mark whether the registrant is a shell company (as defined in Exchange Act Rule 12b-2). Yes [ ] No [ X ]
Indicate by check mark whether the registrant has filed all documents and reports required to be filed by section 12, 13, or 15(d) of the Securities Exchange Act of 1934 subsequent to the distribution of securities under a plan confirmed by a court. Yes [ ] No [ ]
The aggregate market value of the voting stock held by non-affiliates of the Registrant as of the close of business on September 11, 2010, the last business day of the registrant’s most recently completed second fiscal quarter, was $23,170,101.
The number of shares of common stock outstanding as of the close of business on April 29, 2011 was 53,852,470.
DOCUMENTS INCORPORATED BY REFERENCE
The information required by Part III, Items 10, 11, 12, 13, and 14, and Part IV, Item 15 are incorporated by reference in an amendment to this Annual Report on Form 10-K, which will be filed by the registrant within 120 days after the close of its 2010 fiscal year.
PART I
ITEM 1 – Business
General
The Great Atlantic & Pacific Tea Company, Inc. (“A&P”, “we”, “our”, “us” or “our Company”) is engaged in the retail food business. We operated 393 stores averaging approximately 42,000 square feet per store as of February 26, 2011.
Operating under the trade names A&P®, SuperFresh®, Waldbaum’s®, Super Foodmart®, Food Basics®, The Food Emporium®, Best Cellars®, Best Cellars at A&P®, Pathmark® and Pathmark Sav-A-Center®, we sell groceries, meat, fresh produce and other items commonly offered in supermarkets and wine, beer and spirits in our Best Cellars® and Best Cellars at A&P® locations. In addition, many of our stores offer bakeries, delicatessens, pharmacies, floral departments, fresh seafood and cheese departments and on-site banking. National, regional and local brands are sold as well as a selection of our private label brands. In support of our retail operations, we sell private label products in our stores under other brand names of our Company which include, without limitation, America’s Choice®, America’s Choice Gold®, America’s Choice Healthy Kids®, Hartford Reserve®, Smart Price®, Green Way®, Via Roma®, and Live Better Wellness®.
Building upon a broad base of supermarkets, our Company has historically expanded and diversified within the retail food business through the acquisition of other supermarket chains and the development of several alternative store types. We now operate our stores with merchandise, pricing and identities tailored to appeal to different segments of the market, including buyers seeking gourmet and ethnic foods, a wide variety of premium quality private label goods and health and beauty aids along with the array of traditional grocery products.
Our Internet address is www.aptea.com. We make available free of charge through our Internet website our annual reports as soon as reasonably practicable after we electronically file such material with, or furnish them to, the Securities and Exchange Commission. All of such materials are located at the “Investors” page. We also provide through our Internet website a hyperlink to the Securities and Exchange Commission (“SEC”) website, where the Company’s quarterly reports on Form 10-Q, current reports on Form 8-K, and Forms 3, 4 and 5 filed with respect to our equity securities under Section 16(a) of the Securities Exchange Act of 1934, as amended, may be accessed electronically. The information found on our website shall not be deemed incorporated by reference by any general statement incorporating by reference this report into any filing under the Securities Act of 1933, as amended, or under the Securities Exchange Act of 1934, as amended (collectively, the ”Acts”), and shall not otherwise be deemed filed under the Acts.
Bankruptcy Filing
On December 12, 2010 (the "Petition Date"), our Company and all of our U.S. subsidiaries (the “Debtors”) filed voluntary petitions for relief (the “Bankruptcy Filing”) under chapter 11 of title 11 of the United States Bankruptcy Code (the “Bankruptcy Code”) in the United States Bankruptcy Court for the Southern District of New York in White Plains (the “Bankruptcy Court”), case number 10-24549. Management's decision to make the Bankruptcy Filing was in response to, among other things, our Company’s deteriorating liquidity and management's conclusion that the challenges of successfully implementing additional financing initiatives and of obtaining necessary cost concessions from our Company’s business and labor partners, was negatively impacting our Company’s ability to implement our previously announced turnaround strategy. Our Company’s non-U.S. subsidiaries, which are immaterial on a consolidated basis and have no retail operations, were not part of the Bankruptcy Filing.
Our Company was required to apply the FASB’s provisions of Reorganizations effective on the Petition Date, which is applicable to companies in chapter 11, which generally does not change the manner in which financial statements are prepared. However, it does require that the financial statements for periods subsequent to the filing of the Bankruptcy Filing petition distinguish transactions and events that are directly associated with the reorganization from the ongoing operations of the business. The balance sheet must distinguish prepetition liabilities subject to compromise from both those prepetition liabilities that are not subject to compromise and from post-petition liabilities. As discussed in Note 9 to our Consolidated Financial Statements - Indebtedness and Other Financial Liabilities, currently the Superpriority Debtor-in-Possession Credit Agreement is senior to all debt. The Senior Secured Notes totaling $260.0 million have priority over the unsecured creditors of our Company. Based upon the uncertainty surrounding the ultimate treatment of the Notes in our reorganization plan, including the potential that these Notes may be impaired, these notes are classified as Liabilities subject to compromise on our Consolidated Balance Sheets. Our Company continues to evaluate creditors' claims for other claims that may also have priority over unsecured creditors. Liabilities that may be affected by a plan of reorganization must be reported at the amounts expected to be approved by the Bankruptcy Court, even if they may be settled for lesser amounts as a result of the plan or reorganization. In addition, cash provided by reorganization items must be disclosed separately in the Consolidated Statements of Cash Flows. Lastly, these accompanying consolidated financial statements do not reflect any adjustments of the carrying value of assets and liabilities which may result from any plan of reorganization adopted by our Company.
Reporting Requirements
As a result of the Bankruptcy Filing, our Company is now required to file various documents with, and provide certain information to, the Bankruptcy Court and various third parties, including statements of financial affairs, schedules of assets and liabilities, and monthly operating reports in forms prescribed by federal bankruptcy law, as well as certain financial information on an unconsolidated basis. Such materials will be prepared according to requirements of federal bankruptcy law. Although such materials accurately provide then-current information required under federal bankruptcy law, they are nonetheless unconsolidated, unaudited, and are prepared in a format different from that used in our Company's consolidated financial statements filed under the securities laws. Accordingly, our Company believes that the substance and format do not allow meaningful comparison with its regular publicly disclosed consolidated financial statements. Moreover, the materials filed with the Bankruptcy Court are not prepared for the purpose of providing a basis for an investment decision relating to our Company's securities, or for comparison with other financial information filed with the SEC.
Notifications
Shortly after the Petition Date, our Company began notifying current or potential creditors of the Bankruptcy Filing. Subject to certain exceptions under the Bankruptcy Code, the Bankruptcy Filing automatically enjoined, or stayed, the continuation of any judicial or administrative proceedings or other actions against our Company or their property to recover on, collect or secure a claim arising prior to the Petition Date. Thus, for example, most creditor actions to obtain possession of property from our Company, or to create, perfect or enforce any lien against the property of our Company, or to collect on monies owed or otherwise exercise rights or remedies with respect to a claim arising prior to the Petition Date are enjoined unless and until the Bankruptcy Court lifts the automatic stay. Vendors are being paid for goods furnished and services provided after the Petition Date in the ordinary course of business. Certain creditors and other parties in interest have filed motions for relief from the automatic stay with the Bankruptcy Court, although no such motions have been granted (or resolved consensually with our Company) on a basis that would have a material effect on our Company’s businesses. Nonetheless, there can be no assurance that the Bankruptcy Court will not at some future date grant relief from the automatic stay, or other similar creditor relief, that would have a material, adverse effect on our Company’s businesses.
Creditors' Committee
As required by the Bankruptcy Code, the United States trustee for the Southern District of New York appointed the Creditors' Committee. The Creditors' Committee and its legal representatives have a right to be heard on all matters that come before the Bankruptcy Court with respect to our Company. There can be no assurance that the Creditors' Committee will support our Company’s positions on matters to be presented to the Bankruptcy Court in the future or on any plan of reorganization, and the Creditors' Committee in fact has taken positions adverse to our Company in proceedings related to the Chapter 11 Filing. Disagreements between the Company and the Creditors' Committee could protract the court proceedings, negatively impact our Company’s ability to operate and delay the Company’s emergence from Chapter 11.
Executory Contracts — Section 365
Under section 365 and other relevant sections of the Bankruptcy Code, our Company may assume, assume and assign, or reject certain executory contracts and unexpired leases, including, without limitation, leases of real property, subject to the approval of the Bankruptcy Court and certain other conditions. Any description of an executory contract or unexpired lease in this Form 10-K, including, where applicable, our Company’s express termination rights or a quantification of our obligations, must be read in conjunction with, and is qualified by, any overriding rejection rights our Company have under section 365 of the Bankruptcy Code. Claims may arise as a result of rejecting any executory contract. At this time, we are unable to estimate precisely the rejection damages that may result from rejecting any leases or other executory contracts.
Plan of Reorganization
In order to emerge successfully from bankruptcy, our Company will need to propose and obtain confirmation by the Bankruptcy Court of a plan of reorganization that satisfies the requirements of the Bankruptcy Code. A plan of reorganization would, among other things, resolve our Company obligations arising prior to the Petition Date, set forth the revised capital structure of the newly reorganized entities and establish the framework for corporate governance subsequent to exit from bankruptcy.
Automatically, upon commencing the Chapter 11 Filing, our Company under the Bankruptcy Code had the exclusive right for 120 days after the Petition Date to file a plan of reorganization. Our Company has since obtained court approval extending this exclusivity through August 31, 2011. If we do file a plan, our Company will be entitled to 60 additional days to obtain necessary acceptances of our plan.
In addition to being voted on by holders of impaired claims and equity interests, a plan of reorganization must satisfy certain requirements of the Bankruptcy Code and must be approved, or confirmed, by the Bankruptcy Court in order to become effective.
A plan of reorganization will be deemed accepted by holders of claims against and equity interests in our Company if (1) at least one-half in number and two-thirds in dollar amount of claims actually voting in each impaired class of claims have voted to accept the plan, and (2) at least two-thirds in amount of equity interests actually voting in each impaired class of equity interests has voted to accept the plan. Under certain circumstances, however, the Bankruptcy Court may confirm a plan even if such plan has not been accepted by all impaired classes of claims and equity interests. A class of claims or equity interests that does not receive or retain any property under the plan on account of such claims or interests is deemed to have voted to reject the plan. The precise requirements and evidentiary showing for confirming a plan, notwithstanding its rejection by one or more impaired classes of claims or equity interests, depends upon a number of factors including without limitation, the status and seniority of the claims or equity interests in the rejecting class (i.e., secured claims or unsecured claims, subordinated or senior claims, preferred or common stock). Generally, with respect to a class of claim holders, a plan may be "crammed down" even if such class receives no recovery if the proponent of the plan demonstrates that (1) no class junior to such class is receiving or retaining property under the plan, and (2) no class of claims or interests senior to the "crammed down" class is being paid more than in full.
Reorganization Costs
Revenues, expenses, realized gains and losses, and provisions for losses that can be directly associated with the reorganization and restructuring of the business must be reported separately as reorganization items in the Consolidated Statements of Operations beginning in the year ended February 26, 2011. We have incurred and will continue to incur significant costs associated with the reorganization. The amount of these costs, which are being expensed as incurred, are expected to significantly affect our results of operations.
Risks and Uncertainties
The ability of our Company, both during and after the Bankruptcy Court proceedings, to continue as a going concern, is dependent upon, among other things, (i) the ability of our Company to maintain adequate liquidity, including the generation of cash from operations, and (ii) the ability of our Company to confirm a plan of reorganization under the Bankruptcy Code. Uncertainty as to the outcome of these factors raises substantial doubt about our Company’s ability to continue as a going concern. The accompanying consolidated financial statements do not include any adjustments to reflect or provide for the consequences of the bankruptcy proceedings, except for unsecured claims allowed by the Bankruptcy Court. In particular, such financial statements do not purport to show (a) as to assets, their realization value on a liquidation basis or their availability to satisfy liabilities, (b) as to liabilities arising prior to the Petition Date, the amounts that may be allowed for claims or contingencies, or the status and priority thereof, (c) as to stockholder accounts, the effect of any changes that may be made in the capitalization of our Company, or (d) as to operations, the effects of any changes that may be made in the underlying business. A plan of reorganization would likely cause material changes to the amounts currently disclosed in the consolidated financial statements.
Negative events associated with the Bankruptcy Filing could adversely affect revenues and our Company’s relationship with customers, as well as with vendors and employees, which in turn could adversely affect our Company’s operations and financial condition, particularly if the Bankruptcy Court proceedings become more protracted. Also, transactions outside of the ordinary course of business are subject to the prior approval of the Bankruptcy Court, which may limit our Company’s ability to respond timely to certain events or take advantage of certain opportunities. Because of the risks and uncertainties associated with the Bankruptcy Court proceedings, the ultimate impact that events that occur during these proceedings will have on our Company’s business, financial condition and results of operations cannot be predicted or quantified accurately, and until such issues are resolved, there remains substantial doubt about our Company’s ability to continue as a going concern.
As a result of the Bankruptcy Filing, realization of assets and liquidation of liabilities are subject to uncertainty. While operating as a debtor-in-possession under the protection of Bankruptcy Code and subject to Bankruptcy Court approval or otherwise as permitted in the normal course of business, our Company may sell or otherwise dispose of assets and liquidate or settle liabilities for amounts other than those reflected in the consolidated financial statements. Further, a plan of reorganization could materially change the amounts and classifications reported in the consolidated historical financial statements, which do not give effect to any adjustments to the carrying value of assets or amounts of liabilities that might be necessary as a consequence of confirmation of a plan of reorganization.
Under the priority scheme established by the Bankruptcy Code, certain post-petition liabilities and pre-petition liabilities need to be satisfied before shareholders are entitled to receive any distribution. The ultimate recovery to creditors, convertible preferred securities holders and/or common shareholders, if any will not be determined until confirmation of a plan or plans of reorganization. No assurance can be given as to what values, if any, will be ascribed in the bankruptcy proceedings to each of these constituencies. A plan of reorganization could also result in holders of preferred and common stock receiving no value for their interests. Because of such possibilities, the value of the common stock is highly speculative. Accordingly, the Company urges that appropriate caution be exercised with respect to existing and future investments in any of these liabilities and/or securities. Amounts reflected in our Consolidated Financial Statements relative to these constituencies are not intended to represent the fair value or redemption values that will be realized by these constituencies under the bankruptcy proceedings.
Fresh Start Accounting
As required by the FASB’s provisions of Reorganizations, we will adopt fresh start accounting upon the conclusion of the Bankruptcy Filing. The consolidated financial statements for the periods ended February 26, 2011 and prior do not include the effect of any changes in our capital structure or changes in the fair value of assets and liabilities as a result of fresh start accounting.
Sources of Supply
Our Company currently acquires a majority of our saleable inventory from one supplier, C&S Wholesale Grocers, Inc. (“C&S”). Under our March 7, 2008 agreement with C&S, C&S provides warehousing, logistics, procurement and purchasing services (the “Services”) in support of our Company's entire supply chain. This agreement expires on September 29, 2018. The agreement defines the parties' respective responsibilities for the procurement and purchase of merchandise intended for use or resale at our Company's stores, as well as the parties' respective remuneration for warehousing and procurement/purchasing activities. In consideration for its services, C&S is paid an annual fee and has incentive income opportunities based upon our cost savings and increases in retail sales volume. The agreement also provides that we will purchase virtually our entire warehoused inventory from C&S. We are rebidding the Services to ensure that the structure and cost and costs of our entire supply chain are more closely aligned with the needs of our business. The rebidding of the Services may result in a rejection or termination of our agreement with C&S in Bankruptcy Court. We anticipate that the rebidding process will result in significant cost savings in fiscal 2011 and beyond, but there can be no assurance that these efforts will be successful or will result in any savings or improvements.
Licenses and Trademarks
Our stores require a variety of licenses and permits that are renewed on an annual basis. Payment of a fee is generally the only condition to maintaining such licenses and permits. We maintain registered trademarks for nearly all of our store banner trade names and private label brand names. Trademarks are generally renewable on a 10 year cycle. We consider trademarks an important way to establish and protect our Company brands in a competitive environment.
Employees
As of February 26, 2011, we had approximately 39,000 employees, of which 68% were employed on a part-time basis. Approximately 92% of our employees are covered by union contracts. We believe that we have good relationships with our labor union partners.
Competition
The supermarket business is highly competitive throughout the marketing areas served by our Company and is generally characterized by low profit margins on sales with earnings primarily dependent upon rapid inventory turnover, effective cost controls and the ability to achieve high sales volume. We compete for sales and store locations with a number of national and regional chains, as well as with many independent and cooperative stores and markets.
Segment Information
The segment information required is contained within Item 8 under the caption “Note 20 – Segments” in the Notes to Consolidated Financial Statement and is herein incorporated by reference.
ITEM 1A – Risk Factors
Our future performance is subject to uncertainties and other risk factors that could have a negative impact on our business and cause actual results to differ materially from our expectations. Various factors could have a negative effect on our Company’s financial position and results of operations. These risk factors include, among others, the following:
|
·
|
Failure to execute on our turnaround plan could adversely affect our Company’s liquidity, financial condition and results of operations.
|
We are currently operating pursuant to the Bankruptcy Filing and continuation of our Company as a going-concern is contingent upon, among other things, the Debtors’ ability (i) to comply with the terms and conditions of the Debtor-In-Possession Credit Agreement (“DIP Credit Agreement”) described in Note 9 to our Consolidated Financial Statements – Indebtedness and Other Financial Liabilities; (ii) to develop a plan of reorganization and obtain confirmation under the Bankruptcy Code; (iii) to reduce debt and other liabilities through the bankruptcy process; (iv) to return to profitability, including necessary near-term cost concession from our business and labor partners beginning as early as June 2011 with the benefits reflected in our results shortly thereafter; (v) to generate sufficient cash flow from operations; and (vi) to obtain financing sources to meet our future obligations. The uncertainty regarding these matters raises substantial doubt about our ability to continue as a going concern.
|
·
|
As a result of the Bankruptcy Filing, our historical financial information may not be indicative of our future financial performance.
|
Our capital structure will likely be significantly altered under any plan of reorganization ultimately confirmed by the Bankruptcy Court. Under fresh-start reporting rules that may apply to the Debtor upon the effective date of a plan of reorganization, our assets and liabilities would be adjusted to fair values and our accumulated deficit would be restated to zero. Accordingly, if fresh-start reporting rules apply, our financial condition and results of operations following our emergence from the Bankruptcy Filing would not be comparable to the financial condition and results of operations reflected in our historical financial statements. In connection with the Bankruptcy Filing and the development of a plan of reorganization, it is also possible that additional restructuring and related charges may be identified and recorded in future periods. Such charges could be material to our consolidated financial position and results of operations in any given period.
|
·
|
Operating during the Bankruptcy Filing may restrict our ability to pursue our strategic and operational initiatives.
|
Under the Bankruptcy Filing, transactions outside the ordinary course of business are subject to the prior approval of the Bankruptcy Court, which may limit our ability to respond in a timely manner to certain events or take advantage of certain opportunities. Additionally, the terms of the DIP Credit Agreement limit our ability to undertake certain business initiatives. These limitations include, among other things, our ability to:
|
·
|
incur indebtedness;
|
||
|
|
·
|
incur or create liens;
|
|
|
|
·
|
dispose of assets;
|
|
|
·
|
prepay certain indebtedness and make other restricted payments;
|
||
|
·
|
enter into sale and leaseback transactions; and
|
||
|
·
|
modify the terms of certain indebtedness and certain material contracts.
|
|
·
|
The pursuit of the Bankruptcy Filing may have an adverse effect on our business and results of operations.
|
The requirements of the Bankruptcy Filing have consumed and will continue to consume a substantial portion of our corporate management’s time and attention and leave them with less time to devote to the operation of our business. This diversion of attention may materially and adversely affect the conduct of our business, and, as a result, on our financial condition and results of operations, particularly if the Bankruptcy Filing is protracted.
Furthermore, we have incurred and will continue to incur during the pendency of the Bankruptcy Filing substantial costs for professional fees and other expenses associated with the administration of the Bankruptcy Filing. A prolonged continuation of the Bankruptcy Filing may also require us to seek additional financing. If we require additional financing during the pendency of the Bankruptcy Filing and we are unable to obtain the financing on favorable terms or at all, our chances of successfully reorganizing our businesses may be seriously jeopardized, and as a result, any securities in our Company could become devalued or become worthless.
|
·
|
We may not be able to remain in compliance with the requirements of the DIP Credit Agreement therefore the lending commitments under the DIP Credit Agreement may be terminated by the DIP Lender.
|
The DIP Credit Agreement also contains certain financial covenants, including a minimum excess availability covenant of $100.0 million, minimum liquidity covenant of $100.0 million and minimum cumulative EBITDA covenant as defined in the DIP Credit Agreement. Minimum cumulative EBITDA measured beginning on April 24, 2011 is as follows (in millions):
|
Date
|
Minimum Cumulative EBITDA
|
|
August 13, 2011
|
$ -
|
|
September 10, 2011
|
10.0
|
|
October 8, 2011
|
20.0
|
|
November 5, 2011
|
35.0
|
|
December 3, 2011
|
50.0
|
|
December 31, 2011
|
65.0
|
|
January 28, 2012
|
90.0
|
|
February 25, 2012
|
100.0
|
|
March 24, 2012
|
110.0
|
|
April 21, 2012
|
125.0
|
|
May 19, 2012
|
150.0
|
|
June 16, 2012
|
175.0
|
We are currently in compliance with all covenants. Meeting our EBITDA covenant requires increasing levels of performance throughout the year. Achieving this improving performance will require our Company to successfully implement our business improvement initiatives beginning as early as June 2011 with the benefits reflected in our results shortly thereafter. The DIP Credit Agreement matures upon the earliest to occur of (a) June 14, 2012, (b) the acceleration of the loans and the termination of the commitment thereunder, and (c) the substantial consummation (as defined in Section 1101(2) of the Bankruptcy Code, which for purposes hereof shall be no later than the effective date thereof) of a plan of reorganization that is confirmed pursuant to an order entered by the Bankruptcy Court. The Bankruptcy Court entered a final order approving the DIP Credit Agreement on January 11, 2011.
If, as a result of our breach of the terms thereof, the DIP Credit Agreement is terminated or our access to funding thereunder is restricted or terminated, we may not have sufficient cash availability to meet our operating needs or satisfy our obligations as they fall due, in which instance we could be required to seek a sale of our Company or certain of its material assets pursuant to Section 363 of the Bankruptcy Code, or to convert the Bankruptcy Filing into a liquidation under Chapter 7 of the Bankruptcy Code.
|
·
|
If we are unable to implement a plan of reorganization or if sufficient debtor-in-possession financing is not available we could be required to seek a sale of our Company or certain of its material assets pursuant to Section 363 of the Bankruptcy Code, or liquidate under Chapter 7 of the Bankruptcy Code.
|
There can be no assurance that the Bankruptcy Court will approve a proposed plan or that the DIP Credit Agreement will not be terminated by the DIP Lender for our breach thereof. If either of these events were to occur we could be forced to liquidate under Chapter 7 of the Bankruptcy Code.
|
·
|
As a result of approval and implementation of a proposed plan, should such occur, certain changes in ownership of our Company could occur, which could adversely affect our ability to utilize our significant net operating loss carry-forwards upon our emergence from the Bankruptcy Filing.
|
There are certain tax attributes, such as net operating loss carry-forwards, that may be limited or lost altogether in the event of an ownership change as defined under Section 382 of the Internal Revenue Code. If a change of ownership were to occur as a result of the implementation of the proposed plan, upon our emergence from the Bankruptcy Filing there could be significant valuation allowances placed on deferred tax assets.
|
·
|
We may experience increased levels of employee attrition.
|
During the pendency of the Bankruptcy Filing, we may experience increased levels of employee attrition, and our employees are facing considerable distraction and uncertainty. A loss of key personnel or material erosion of employee morale, at the corporate, field and store levels, could have a materially adverse affect on our ability to meet customer, trade partner and strategic partner expectations, thereby adversely affecting our business and results of operations. Our ability to engage, motivate and retain key employees or take other measures intended to motivate and incent key employees to remain with us through the pendency of the Bankruptcy Filing is limited during the Bankruptcy Filing by restrictions on implementation of retention programs.
|
·
|
Trading in our securities during the pendency of the Bankruptcy Filing is highly speculative and poses substantial risks. Our common stock may be cancelled and holders of such common stock may not receive any distribution with respect to, or be able to recover any portion of, their investments.
|
It is unclear at this stage of the Bankruptcy Filing if any plan of reorganization would allow for distributions with respect to our common stock. It is likely that these equity interests will be cancelled and extinguished in connection with confirmation of a plan of reorganization by the Bankruptcy Court and the holders thereof would not be entitled to receive, and would not receive or retain, any property or interest in property on account of such equity interests. In the event of cancellation of these equity interests, amounts invested by such holders in our outstanding equity securities will not be recoverable. As a result, our currently outstanding common stock would have no value. Trading prices for our common stock may bear little or no relationship to the actual recovery, if any, by the holders thereof in the Bankruptcy Filing. Accordingly, we urge extreme caution with respect to existing and future investments in our equity securities and any of our other securities.
|
·
|
Our common stock and 9 3/8% senior quarterly interest bonds are no longer listed on a national securities exchange and are quoted only on the Pink Sheets, which could negatively affect our stock price, bond price and marketplace liquidity.
|
As of December 13, 2010, our common stock and 9 3/8% senior quarterly interest bonds (“9 3/8% bonds”) trade exclusively on the Pink OTCQB market (the “Pink Sheets”) and are currently traded under the symbols GAPTQ and GAJTQ, respectively. The Pink Sheets is a significantly more limited market than the NYSE, and the quotation of our common stock and 9 3/8% bonds on the Pink Sheets may result in a less liquid market available for existing and potential stockholders and bondholders, respectively, to trade in our common stock and 9 3/8% bonds. This could further depress the trading price of our common stock and 9 3/8% bonds.
|
·
|
Various operating factors and general economic conditions affecting the food industry may affect our business and may adversely affect our operating results.
|
The retail food and food distribution industries and the operation of our business, specifically in the New York, New Jersey and Philadelphia regions, are sensitive to a number of economic conditions and other factors such as: (i) food price deflation or inflation, (ii) softness in local and national economies, (iii) the availability of favorable credit and trade terms, (iv) changes in business plans, operations, results and prospects, and (v) other economic conditions that may affect consumer buying habits. Any one or more of these economic conditions can affect our retail sales, the demand for products we distribute to our retail customers, our operating costs and other aspects of our business. Failure to achieve sufficient levels of cash flow at reporting units could also result in additional impairment charges on goodwill, intangible assets and/or long-lived assets.
Changes in the general business and economic conditions in our markets, including the rate of inflation, population growth, the fluctuating prices of oil and gas, the nature and extent of continued consolidation in the food industry and the unemployment rate in the markets in which we operate, may negatively affect earnings and sales growth. General economic changes may also affect the shopping habits and buying patterns of our customers, which could affect sales and earnings.
Our ability to achieve profitability will be affected by, among other things: (i) our success in executing our category management and purchasing programs, which are designed to improve our gross margins and reduce product costs, (ii) the effectiveness of efforts to improve our value proposition for our customers through our merchandising and marketing programs and to enhance customers’ experience in our stores, (iii) our ability to achieve productivity improvements and reduce shrink in our stores, (iv) our success in generating efficiencies in our supporting activities, (v) our ability to eliminate or maintain a minimum level of supply and/or quality control problems with our vendors, (vi) the rebidding of our warehousing, logistics, procurement, and purchasing services; and (vii) the results of negotiations with our union partners to alter existing collective bargaining agreements.
|
·
|
We face a high level of competition, including the threat of further consolidation in the food industry, which could adversely affect our sales and future profits.
|
The retail food business is extremely competitive and is characterized by high inventory turnover and narrow profit margins. The retail food business is subject to competitive practices that may affect the prices at which we are able to sell products at our retail locations, sales volume, and our ability to attract and retain customers. In addition, the nature and extent of consolidation in the retail food industry could affect our competitive position in the markets we serve.
Our retail food business and the grocery retailing industry continue to experience aggressive competition from mass merchandisers, warehouse clubs, drug stores, convenience stores, discount merchandisers, dollar stores, restaurants, other retail chains, nontraditional competitors and emerging alternative formats in the markets where we have retail operations. Competition with these outlets is based on price, store location, advertising and promotion, product mix, quality and service. Some of these competitors may have greater financial resources, lower merchandise acquisition costs and lower operating expenses than we do, and we may be unable to compete successfully in the future. Increasingly competitive markets have made it difficult generally for grocery store operators to achieve comparable store sales gains. Because sales growth has been difficult to attain, our competitors have attempted to maintain market share through increased levels of promotional activities and discount pricing, creating a more difficult environment in which to consistently increase year-over-year sales. Price-based competition has also, from time to time, adversely affected our operating margins. Competitors’ greater financial strengths enable them to participate in aggressive pricing strategies such as selling inventory below costs to drive overall increased sales. Our continued success is dependent upon our ability to effectively compete in this industry and to reduce operating expenses, including managing health care and pension costs contained in our collective bargaining agreements. The competitive practices and pricing in the food industry generally and particularly in our principal markets may cause us to reduce our prices in order to gain or maintain our market share of sales, thus reducing margins.
Our in-store pharmacy business is also subject to intense competition. In particular, an adverse trend for drug retailing has been the significant growth in mail-order and Internet-based prescription processors, including importation from Canada and other countries. Due to the rapid rise in drug costs experienced in recent years, mail-order prescription distribution methods are perceived by employers and insurers as being less costly than traditional distribution methods and are being mandated by an increasing number of third party pharmacy benefit managers, many of which also own and manage mail-order distribution operations. As a result, some labor unions and employers are requiring, and others may encourage, that their members or employees obtain medications from mail-order pharmacies which offer drug prescriptions at prices that are lower than we are able to offer. In addition to these forms of mail-order distribution, there has also been increasing competition from a number of Internet-based prescription distributors, which specialize in offering certain high demand lifestyle drugs at deeply discounted prices, and importers from Canada and other foreign countries. These alternate distribution channels have acted to restrain the rate of sales growth for traditional chain drug retailers in the last few years. There can be no assurance that our efforts to offset the effects of alternate distribution channels and eligibility changes will be successful.
|
·
|
We are concentrated in the New York, New Jersey and Philadelphia metropolitan areas and, as a result, our business is significantly influenced by the economic conditions and other characteristics of these areas.
|
We are vulnerable to economic downturns in the New York, New Jersey and Philadelphia metropolitan areas, in addition to those that may affect the country as a whole, as well as other factors that may impact that region, such as the regulatory environment, the cost of real estate, insurance, taxes and rent, reliance on the financial industry, increasing unemployment, weather and natural catastrophes, demographics, the availability of labor, and geopolitical factors.
We cannot predict economic conditions in this region, and factors such as interest rates, energy costs and unemployment rates may adversely affect our sales which may lead to higher losses. Any unforeseen events or circumstances that affect the area could also materially adversely affect our revenues and profitability. Further, since we are concentrated in densely populated metropolitan areas, opportunities for future store expansion may be limited, which may adversely affect our business and results of operations.
|
·
|
Our vendors may shorten our payment terms, which would impair our ability to effectively manage our cash flow.
|
We have negotiated payment terms with most of our vendors. However, there can be no assurance that we will be able to maintain such terms in the future.
|
·
|
We rely on C&S for a substantial amount of our products.
|
Pursuant to the terms of a long-term supply agreement that expires on September 29, 2018, we currently acquire most of our saleable inventory, including groceries and perishables, from one supplier, C&S. During fiscal 2010, products supplied from C&S accounted for approximately 74% of our Company’s supermarket inventory purchases. Recently, we have experienced some difficulty in the supply of isolated products to certain stores and supply interruptions by C&S could occur in the future. Any significant interruption in this supply chain, either as a result of disruptions at C&S or if our supply agreement with C&S were terminated for any reason, could have a material adverse effect on our business and results of operations. We are therefore subject to the risks of C&S’s business, including potential labor disruptions at C&S facilities, increased regulatory obligations and distribution problems which may affect C&S’s ability to obtain products. While we believe that other suppliers could provide similar products on reasonable terms, they are limited in number. In addition, a change in suppliers could cause a delay in distribution and a possible loss of sales, which would affect operating results adversely.
We are rebidding the Services to ensure that the structure and cost and costs of our entire supply chain are more closely aligned with the needs of our business. The rebidding of the Services may result in a rejection or termination of our agreement with C&S in Bankruptcy Court. We anticipate that the rebidding process will result in significant cost savings in fiscal 2011 and beyond, but there can be no assurance that these efforts will be successful or will result in any savings or improvements.
|
·
|
We may be adversely affected by unexpected changes in the insurance market or changes in factors affecting our self-insurance reserve estimates.
|
We use a combination of self-insurance and insurance coverage to provide for the potential liabilities for general liability, property losses, fleet liability, workers’ compensation, employee benefits and directors and officers. There is no assurance that we will be able to continue to maintain our insurance coverage or obtain comparable coverage at a reasonable cost. Self-insurance reserves are determined based on actual claims experience and actuarially estimated claims incurred but not reported. Actuarial projections are subject to a high degree of variability, due to fluctuations in future interest and inflation rates, future economic conditions, litigation trends, benefit level changes, changes in state regulations, and changes in other factors. An increase in the frequency of claims, cost of claims or changes in actuarial assumptions could adversely affect our results of operations and financial condition.
|
·
|
We may be adversely affected by rising utility and fuel costs.
|
Rising fuel costs may adversely affect our operating costs since we incur the cost of fuel in connection with the transportation of goods from our warehouse and distribution facilities to our stores. In addition, operations at our stores are sensitive to rising utility fuel costs due to the amount of electricity and gas required to operate our stores. In the event of rising fuel costs, we may not be able to recover rising utility and fuel costs through increased prices charged to our customers. Oil prices directly affect our product transportation costs and fuel costs due to the amount of electricity and gas required to operate our stores as well as our utility and petroleum-based supply costs, including plastic bags.
|
·
|
Current economic conditions have been, and may continue to be volatile.
|
Many financial institutions have in the past reduced and, in some cases, ceased to provide funding to borrowers. Based on information available to us, we have no indication that the financial institutions acting as lenders under our credit facility would be unable to fulfill their commitments. Continued turbulence in the global credit markets and U.S. economy may adversely affect our results of operations, financial condition and liquidity.
|
·
|
We have certain substantial equity holders that may support strategies that are opposed to your interests or with which you disagree.
|
Tengelmann, our Company’s former majority stockholder, owns beneficially and of record a substantial percentage of our common stock on a fully diluted basis. As a result of this equity ownership and our stockholder agreement with Tengelmann, Tengelmann has the power to significantly influence the results of stockholder votes and the election of our board of directors, as well as transactions involving a potential change of control of our Company. Tengelmann may support strategies and directions for our Company which are in its best interests but which are opposed to other stakeholders. So long as Tengelmann retains sufficient ownership of our Company’s voting power, Tengelmann has rights to board representation, as well as consent rights in connection with certain major Company actions including changes to Company policies and organizational documents, dispositions and financing activity.
Yucaipa is a significant holder of our common stock on a fully diluted basis. According to the stockholder’s agreement with Yucaipa, as long as Yucaipa retains sufficient ownership of our Company’s voting power, Yucaipa has rights to board representation, as well as consent rights in connection with certain major Company actions including changes to Company policies and organizational documents, dispositions and financing activity. Yucaipa may support strategies and directions for our Company which are in its best interests but which are opposed to other stakeholders.
|
·
|
We could be affected if consumers lose confidence in the food supply chain or the quality and safety of our products.
|
We could be adversely affected if consumers lose confidence in the safety and quality of the food supply chain. Adverse publicity about these concerns, whether or not ultimately based on fact, and whether or not involving products sold at our stores, could discourage consumers from buying our products. The real or perceived sale of contaminated food products by us could result in a loss of consumer confidence and product liability claims, which could have a material adverse effect on our sales and operations.
To the extent that we are unable to maintain appropriate sanitation and quality standards in our stores, food safety and quality issues could involve expense and damage to our various brand names. Additionally, concerns about the safety or effectiveness of certain drugs or negative publicity surrounding certain categories of drugs may have a negative impact on our pharmacy sales.
|
·
|
Threats or potential threats to security of food and drug safety may adversely affect our business.
|
Acts or threats of war or terror or other criminal activity directed at the grocery or drug store industry, the transportation industry, or computer or communications systems, whether or not directly involving our stores, could increase our security costs, adversely affect our operations, or impact general consumer behavior and spending as well as customer orders and our supply chain. Other events that give rise to actual or potential food contamination, drug contamination, or food-borne illnesses could have an adverse effect on our operating results.
|
·
|
Various aspects of our business are subject to federal, state and local laws and regulations. Our compliance with these regulations may require additional expenditures and could adversely affect our ability to conduct our business as planned. Changes in these laws and regulations could increase our compliance costs.
|
We are subject to federal, state and local laws and regulations relating to zoning, land use, environmental protection, work place safety, public health, community right-to-know, beer and wine sales, pharmaceutical sales and gasoline station operations. A number of states and local jurisdictions regulate the licensing of supermarkets, including beer and wine license grants. In addition, under certain local regulations, we are prohibited from selling beer and wine in certain of our stores. Employers are also subject to laws governing their relationship with employees, including minimum wage requirements, overtime, working conditions, disabled access and work permit requirements. Compliance with these laws could reduce the revenue and profitability of our supermarkets and could otherwise adversely affect our business, financial condition or results of operations. In addition, any changes in these laws or regulations could significantly increase our compliance costs and adversely affect our results of operations, financial condition and liquidity.
A number of federal, state and local laws exist that impose burdens or restrictions on owners with respect to access by disabled persons. Our compliance with these laws may result in modifications to our properties, or prevent us from performing certain further renovations.
Our pharmacy business is subject to certain government laws and regulations, including those administered and enforced by Medicare, Medicaid, the Drug Enforcement Administration (“DEA”), Consumer Product Safety Commission, U.S. Federal Trade Commission and Food and Drug Administration. For example, the conversion of various prescription drugs to over-the-counter medications may reduce our pharmacy sales, and if the rate at which new prescription drugs become available slows or if new prescription drugs that are introduced into the market fail to achieve popularity, our pharmacy sales may be adversely affected. The withdrawal of certain drugs from the market may also adversely affect our pharmacy business. Changes in third party reimbursement levels for prescription drugs, including changes in Medicare Part D or state Medicaid programs, could also reduce our margins and have a material adverse effect on our business. In order to dispense controlled substances, we are required to register our pharmacies with the DEA and to comply with security, recordkeeping, inventory control and labeling standards.
In addition, our pharmacy business is subject to local regulations in the states where our pharmacies are located, applicable Medicare and Medicaid regulations and state and federal prohibitions against certain payments intended to induce referrals of patients or other health care business. Failure to properly adhere to these and other applicable regulations could result in the imposition of civil, administrative and criminal penalties including suspension of payments from government programs; loss of required government certifications; loss of authorizations to participate in, or exclusion from, government reimbursement programs such as Medicare and Medicaid; loss of licenses; significant fines or monetary penalties for anti-kickback law violations, submission of false claims or other failures to meet reimbursement program requirements and could adversely affect the continued operation of our business. Our pharmacy business is also subject to the Health Insurance Portability and Accountability Act, including its obligations to protect the confidentiality of certain patient information and other obligations. Failure to properly adhere to these requirements could result in the imposition of civil as well as criminal penalties.
|
·
|
Certain risks are inherent in providing pharmacy services, and our insurance may not be adequate to cover any claims against us.
|
Pharmacies are exposed to risks inherent in the packaging and distribution of pharmaceuticals and other healthcare products, such as risks of liability for products which cause harm to consumers. Although we maintain professional liability insurance and errors and omissions liability insurance, we cannot assure you that the coverage limits under our insurance programs will be adequate to protect us against future claims, or that we will be able to maintain this insurance on acceptable terms in the future. Our results of operations, financial condition or cash flows may be adversely affected if in the future our insurance coverage proves to be inadequate or unavailable, or there is an increase in liability for which we self-insure, or we suffer harm to our reputation as a result of an error or omission.
|
·
|
Litigation, legal or administrative proceedings and other claims could expose us to significant liabilities and thus negatively affect our financial results.
|
We are, from time to time, subject to various claims, administrative proceedings and litigation, which if determined adversely to us could negatively affect our financial results. We have estimated our exposure to claims, administrative proceedings and litigation and believe we have made adequate provisions for them, where appropriate. Unexpected outcomes in both the costs and effects of these matters could result in an adverse effect on our business and our results of operation and earnings.
|
·
|
We are affected by increasing labor, benefit and other operating costs and a competitive labor market and are subject to the risk of workforce disruptions.
|
Our financial performance is greatly influenced by increasing wage and benefit costs, including pension and health care costs, a competitive labor market and the risk of labor disruption of our highly unionized workforce.
We have approximately 39,000 employees, of which approximately 68% are employed on a part-time basis. Over the last few years, increased benefit costs have caused our Company’s labor costs to increase. We cannot assure you that our labor costs will not continue to increase, or that any such increases would be offset through increased prices of products in our stores. Any significant failure to attract and retain qualified employees, to control our labor costs or to recover any increased labor costs through increased prices charged to customers could have a material adverse effect on our results of operations.
As of February 26, 2011, approximately 92% of our employees were represented by unions and covered by collective bargaining or similar agreements that are subject to periodic renegotiations. Although we believe that we will successfully negotiate new collective bargaining agreements, these negotiations may not prove successful, may result in a significant increase in the cost of labor or may result in the disruption of our operations.
We believe that we have good relationships with our union partners. To reorganize as a viable business, our Company believes it needs to secure cost savings in multiple areas, including obligations arising under our collective bargaining agreements. Our Company is currently seeking to negotiate with its union partners to obtain consensual modifications to its collective bargaining agreements that are necessary for our Company’s successful reorganization. Our Company’s goal is to consensually modify its collective bargaining obligations by agreement with each of its union partners, although our Company cannot guaranty whether such outcome can be achieved.
If our Company is unable to obtain cost savings from its labor partners on a consensual basis, our Company may need to avail itself of certain rights and remedies under the Bankruptcy Code with regard to its collective bargaining obligations. In particular, Section 1113(c) of the Bankruptcy Code permits our Company to reject its collective bargaining agreements if our Company first satisfies a number of substantive and procedural requirements and the Bankruptcy Court determines, among other things, that the “balance of the equities clearly favors rejection.” Our Company has not sought to reject any of its collective bargaining agreements at this time.
There can be no assurance that our Company will succeed in obtaining necessary labor cost savings or that work stoppages or labor disturbances will not occur as a result of this process.
|
·
|
We participate in various multi-employer pension plans for substantially all employees represented by unions.
|
We will be required to make contributions to these multi-employer pension plans in amounts established under collective bargaining agreements. Pension expenses for these plans, which are recognized as contributions, are currently funded. Benefits generally are based on a fixed amount for each year of service. We contributed $56.6 million, $62.3 million and $48.2 million to multi-employer pension plans in fiscal 2010, fiscal 2009 and fiscal 2008, respectively. We could, under certain circumstances, be liable for unfunded vested benefits or other expenses of jointly administered union/management plans, which benefits could be significant and material for us. To date, we have not established any liabilities for future withdrawals because such withdrawals from these plans are not probable and the amount cannot be estimated. As a result, we expect that contributions to these plans may increase. Additionally, the benefit levels and related items will be issues in the negotiation of future collective bargaining agreements. Under current law, an employer that withdraws or partially withdraws from a multi-employer pension plan may incur withdrawal liability to the plan, which represents the portion of the plan’s underfunding that is allocable to the withdrawing employer under complex actuarial and allocation rules. The amount of any increase or decrease in our required contributions to these multi-employer pension plans will depend upon the outcome of collective bargaining, actions taken by trustees who manage the plans affecting the costs of future service benefits, government regulations and the actual return on assets held in the plans, among other factors.
|
·
|
We face the risk of being held liable for environmental damages that have or may occur.
|
Our operations subject us to various laws and regulations relating to the protection of the environment, including those governing the management and disposal of hazardous materials and the cleanup of contaminated sites. Under some environmental laws, such as the Comprehensive Environmental Response, Compensation, and Liability Act of 1980, also known as CERCLA or the Superfund law, and similar state statutes, responsibility for the entire cost of cleanup of a contaminated site can be imposed upon any current or former site owners or operators, or upon any party who sent waste to the site, regardless of the lawfulness of the original activities that led to the contamination. From time to time we have been named as one of many potentially responsible parties at Superfund sites, although our share of liability has typically been de minimis. Although we believe that we are currently in substantial compliance with applicable environmental requirements, future developments such as more aggressive enforcement policies, new laws or discoveries of unknown conditions may require expenditures that may have a material adverse effect on our business and financial condition.
|
·
|
The loss of key personnel could negatively affect our business.
|
We are dependent upon a number of key personnel and members of management. If we were to lose the services of a significant number of key personnel or management within a short period of time, this could have a material adverse effect on our operations. We do not maintain key person insurance on any personnel or management. Our continued success is also dependent upon our ability to attract and retain qualified personnel to meet our future growth needs. We face intense competition for qualified personnel, many of whom are subject to offers from competing employers. We may not be able to attract and retain necessary team members to operate our business.
|
·
|
Any difficulties we experience with respect to our information technology systems could lead to significant costs or losses.
|
We have large, complex information technology systems that are important to our business operations. We could encounter difficulties developing new systems or maintaining and upgrading existing systems. Such difficulties could lead to significant expenses or losses due to disruption in our business operations.
Despite our considerable efforts to secure and maintain our computer network, security could be compromised, confidential information could be misappropriated, or system disruptions could occur. This could lead to disruption of operations, loss of sales or profits or cause us to incur significant costs to reimburse third parties for damages.
|
·
|
Our substantial indebtedness could impair our financial condition and our ability to fulfill our debt obligations, including our obligations under the notes.
|
We have substantial indebtedness. As of February 26, 2011, we had total indebtedness of $1,376.5 million, consisting of approximately $350.0 million outstanding under our debtor-in-possession financing, $260.0 million of senior secured notes – subject to compromise, $645.4 million of other outstanding notes – subject to compromise, approximately $121.1 million outstanding under capital lease obligations – subject to compromise. Our indebtedness could have important consequences to you. For example, it could: (i) make it more difficult for us to satisfy our obligations with respect to the notes and our other indebtedness, which could in turn result in an event of default on the notes or such other indebtedness, (ii) require us to dedicate a substantial portion of our cash flow from operations to debt service payments, thereby reducing the availability of cash for working capital, capital expenditures, acquisitions, general corporate purposes or other purposes, (iii) impair our ability to obtain additional financing in the future for working capital, capital expenditures, acquisitions, general corporate purposes or other purposes, (iv) diminish our ability to withstand a downturn in our business, the industry in which we operate or the economy generally, (v) limit our flexibility in planning for, or reacting to, changes in our business and the industry in which we operate, and (vi) place us at a competitive disadvantage compared to certain competitors that have proportionately less debt.
ITEM 1B – Unresolved Staff Comments
None.
ITEM 2 – Properties
At February 26, 2011, we owned 51 properties consisting of the following:
|
Stores, Not Including Stores in Owned Shopping Centers
|
|
|
Land and building owned
|
6
|
|
Building owned and land leased
|
22
|
|
Total stores
|
28
|
|
Shopping Centers
|
|
|
Land and building owned
|
4
|
|
Building owned and land leased
|
1
|
|
Total stores
|
5
|
|
Administrative and Other Properties
|
|
|
Land and building owned
|
6
|
|
Undeveloped land
|
12
|
|
Total other properties
|
18
|
|
Total Properties
|
51
|
Seventeen of these properties are pledged under our Company’s Amended and Restated Superpriority Debtor-In-Possession Credit agreement and six of these properties are pledged under our 11.375% Senior Secured Notes, which are subject to compromise.
At February 26, 2011, we operated 393 retail stores, of which 10 were owned and 383 were leased. These stores are geographically located as follows:
|
Company Stores:
|
|
|
Connecticut
|
16
|
|
District of Columbia
|
1
|
|
Delaware
|
13
|
|
Maryland
|
25
|
|
New Jersey
|
136
|
|
New York
|
164
|
|
Pennsylvania
|
37
|
|
Virginia
|
1
|
|
Total Stores
|
393
|
The total area of all of our operated retail stores is 16.5 million square feet averaging approximately 42,000 square feet per store. Excluding our Wine, Beer and Spirits stores and The Food Emporiumâ stores, which are generally smaller in size, the average store size is approximately 45,000 square feet. With the exception of our Wine, Beer and Spirits stores, our stores built over the past several years and those planned in the future generally range in size from 40,000 to 60,000 square feet. The selling area of new stores ranges from approximately 60% to 75% of the total square footage.
Our Company considers our stores, warehouses, and other facilities adequate for our operations.
ITEM 3 – Legal Proceedings
The information required is contained within Item 8 under the caption “Note 22 – Commitments and Contingencies” in the Notes to Consolidated Financial Statements and is herein incorporated by reference.
ITEM 4 – [Removed and Reserved]
PART II
ITEM 5 – Market for Registrant’s Common Equity, Related Stockholder Matters and Issuer Purchases of Equity Securities
The information required is contained within Item 6 – Selected Financial Data and under Item 12 - Security Ownership of Certain Beneficial Owners and Management and Related Stockholder Matters of this Annual Report on Form 10-K and is herein incorporated by reference.
The high and low market price of our Company’s stock by quarter for fiscal 2010 and 2009 are as follows:
|
First Quarter
|
Second Quarter
|
Third Quarter
|
Fourth Quarter
|
|||||
|
Fiscal Year 2010
|
||||||||
|
High
|
$8.86
|
$4.74
|
$4.36
|
$3.32
|
||||
|
Low
|
$4.04
|
$2.61
|
$2.86
|
$0.16
|
||||
|
Fiscal Year 2009
|
||||||||
|
High
|
$7.47
|
$7.02
|
$12.31
|
$12.89
|
||||
|
Low
|
$3.02
|
$3.63
|
$6.35
|
$7.27
|
As of December 13, 2010, our common stock trades exclusively on the Pink OTCQB market (the “Pink Sheets”) and are currently traded under the symbol GAPTQ. The Pink Sheets is a significantly more limited market than the New York Stock Exchange, and the quotation of our common stock on the Pink Sheets may result in a less liquid market available for existing and potential stockholders to trade in our common stock. This could further depress the trading price of our common stock.
Stock Performance Graph
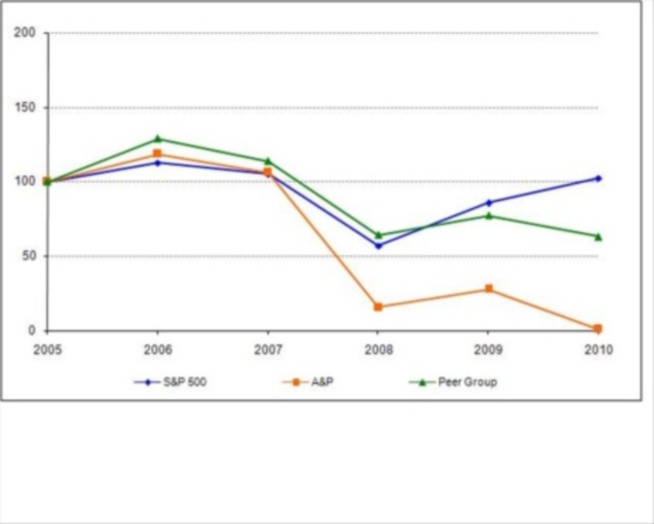
The following performance graph compares the five-year cumulative total stockholder return (assuming reinvestment of dividends) of the Company's Common Stock to the Standard & Poor's 500 Index and the Company's Peer Group which consists of the Company, Supervalu Inc., Safeway, Inc. and The Kroger Co. The “Peer Group” for the purposes of the Stock Performance Graph is a subset of, and should not be confused for, the peer group list of companies used to benchmark executive compensation as will be discussed in an amendment to this Annual Report on Form 10-K that will be filed within 120 days after the close of our Company’s 2010 fiscal year. The performance graph assumes $100 is invested in the Company's Common Stock, the Standard & Poor's 500 Index and the Company's Peer Group on February 24, 2006, and that dividends paid during the period were reinvested to purchase additional shares. The Company’s fiscal year ends the last Saturday in February.
|
Last Business Day of Fiscal Year
|
S&P 500
|
A&P
|
Peer Group
|
|
$
|
$
|
$
|
|
|
02/24/06
|
100
|
100
|
100
|
|
02/23/07
|
113
|
118
|
129
|
|
02/22/08
|
105
|
106
|
114
|
|
02/28/09
|
57
|
15
|
64
|
|
02/27/10
|
86
|
28
|
77
|
|
02/26/11
|
102
|
1
|
63
|
The performance graph above is being furnished solely to accompany this Annual Report on Form 10-K pursuant to Item 201(e) of Regulation S-K, and is not being filed for purposes of Section 18 of the Securities Exchange Act of 1934, as amended, and is not to be incorporated by reference into any filing of our Company, whether made before or after the date hereof, regardless of any general incorporation language in such filing.
ITEM 6 – Selected Financial Data
Five Year Summary of Selected Financial Data
| Fiscal 2007 | ||||||||||||||||||||
|
Fiscal 2010(j)
|
Fiscal 2009(j)
|
Fiscal 2008(h)
|
(a)(b)(c)(h)
|
Fiscal 2006
|
||||||||||||||||
|
(52 Weeks)
|
(52 Weeks)
|
(53 Weeks)
|
(52 Weeks)
|
(52 Weeks)
|
||||||||||||||||
|
(Dollars in thousands, except per share amounts)
|
||||||||||||||||||||
|
Operating Results
|
||||||||||||||||||||
|
Sales
|
$ | 8,078,455 | $ | 8,813,568 | $ | 9,516,186 | $ | 6,401,130 | $ | 5,369,203 | ||||||||||
|
Loss from operations
|
(450,621 | ) | (600,574 | ) | (75,063 | ) | (39,240 | ) | (27,170 | ) | ||||||||||
|
Depreciation and amortization
|
(218,398 | ) | (245,460 | ) | (260,991 | ) | (178,152 | ) | (148,762 | ) | ||||||||||
|
Loss on sale of Canadian operations
|
- | - | - | (436 | ) | (1,299 | ) | |||||||||||||
|
Gain on sale of Metro, Inc.
|
- | - | - | 184,451 | - | |||||||||||||||
|
Interest expense (d)
|
(218,409 | ) | (193,058 | ) | (157,591 | ) | (112,218 | ) | (65,884 | ) | ||||||||||
|
(Loss) income from continuing operations
|
(673,400 | ) | (780,650 | ) | (117,882 | ) | 86,578 | 12,751 | ||||||||||||
|
Income (loss) from discontinued operations
|
74,825 | (95,848 | ) | (53,730 | ) | (247,660 | ) | 14,142 | ||||||||||||
|
Net (loss) income
|
(598,575 | ) | (876,498 | ) | (171,612 | ) | (161,082 | ) | 26,893 | |||||||||||
|
Per Share Data
|
||||||||||||||||||||
|
(Loss) income from continuing operations – basic
|
(12.84 | ) | (14.79 | ) | (2.31 | ) | 1.99 | 0.31 | ||||||||||||
|
Income (loss) from discontinued operations – basic
|
1.39 | (1.80 | ) | (1.05 | ) | (5.69 | ) | 0.34 | ||||||||||||
|
Net (loss) income – basic
|
(11.45 | ) | (16.59 | ) | (3.36 | ) | (3.70 | ) | 0.65 | |||||||||||
|
(Loss) income from continuing operations – diluted
|
(277.17 | ) | (26.12 | ) | (4.90 | ) | 1.36 | 0.30 | ||||||||||||
|
Income (loss) from discontinued operations – diluted
|
29.48 | (3.22 | ) | (1.06 | ) | (5.59 | ) | 0.34 | ||||||||||||
|
Net (loss) income – diluted
|
(247.69 | ) | (29.34 | ) | (5.96 | ) | (4.23 | ) | 0.64 | |||||||||||
|
Cash dividends – common stock (g)
|
- | - | - | - | 7.25 | |||||||||||||||
|
Book value per share (e)
|
(21.19 | ) | (9.47 | ) | 5.03 | 7.78 | 10.36 | |||||||||||||
| Fiscal 2007 | ||||||||||||||||||||
|
Fiscal 2010
|
Fiscal 2009
|
Fiscal 2008(h)
|
(a)(b)(c)(h)
|
Fiscal 2006
|
||||||||||||||||
|
(52 Weeks)
|
(52 Weeks)
|
(53 Weeks)
|
(52 Weeks)
|
(52 Weeks)
|
||||||||||||||||
|
(Dollars in thousands, except per share amounts)
|
||||||||||||||||||||
|
Financial Position
|
||||||||||||||||||||
|
Current assets
|
$ | 1,041,593 | $ | 940,706 | $ | 918,522 | $ | 886,245 | $ | 748,908 | ||||||||||
|
Current liabilities
|
343,618 | 729,845 | 746,535 | 771,815 | 558,391 | |||||||||||||||
|
Working capital (e)
|
697,975 | 210,861 | 171,987 | 114,430 | 190,517 | |||||||||||||||
|
Current ratio (e)
|
3.03 | 1.29 | 1.23 | 1.15 | 1.34 | |||||||||||||||
|
Expenditures for property
|
71,070 | 86,378 | 115,994 | 122,850 | 208,159 | |||||||||||||||
|
Total assets
|
2,644,849 | 2,836,760 | 3,526,697 | 3,622,633 | 2,111,623 | |||||||||||||||
|
Current portion of long-term debt (f)
|
- | 191 | 5,283 | 11,875 | 32,069 | |||||||||||||||
|
Current portion of capital lease obligations
|
- | 13,702 | 11,574 | 10,716 | 1,554 | |||||||||||||||
|
Long-term debt (d) (i) (k)
|
350,000 | 990,359 | 919,364 | 732,172 | 284,214 | |||||||||||||||
|
Long-term portion of capital lease obligations
|
- | 136,880 | 147,921 | 157,430 | 29,938 | |||||||||||||||
|
Liabilities subject to compromise (l)
|
2,874,734 | - | - | - | - | |||||||||||||||
|
Total debt (e)
|
1,376,442 | 1,141,132 | 1,084,142 | 912,193 | 347,775 | |||||||||||||||
|
Debt to total capitalization (e)
|
585 | % | 186 | % | 79 | % | 67 | % | 45 | % | ||||||||||
|
Series A redeemable preferred stock (i)
|
143,299 | 132,757 | - | - | - | |||||||||||||||
|
Equity
|
||||||||||||||||||||
|
Stockholders’ (deficit) equity (g)
|
(1,140,964 | ) | (529,203 | ) | 289,893 | 444,120 | 430,670 | |||||||||||||
|
Weighted average shares outstanding – basic
|
53,719,700 | 53,203,741 | 50,948,194 | 43,551,459 | 41,430,600 | |||||||||||||||
|
Weighted average shares outstanding – diluted
|
2,538,236 | 29,771,904 | 50,883,221 | 44,295,214 | 41,902,358 | |||||||||||||||
|
Number of registered stockholders (e)
|
5,242 | 5,485 | 5,677 | 5,856 | 4,649 | |||||||||||||||
|
Other (e)
|
||||||||||||||||||||
|
Number of employees
|
39,000 | 45,000 | 48,000 | 51,000 | 38,000 | |||||||||||||||
|
New store openings
|
1 | 5 | 1 | 10 | 10 | |||||||||||||||
|
Total number of stores at year end
|
393 | 429 | 436 | 447 | 406 | |||||||||||||||
|
Total store area (square feet)
|
16,512,891 | 18,106,877 | 18,385,645 | 18,813,135 | 16,538,410 | |||||||||||||||
|
(a)
|
On December 3, 2007, our Company completed the acquisition of Pathmark Stores, Inc.
|
|
(b)
|
As of February 23, 2008 our Midwest and Greater New Orleans operations were classified as discontinued operations.
|
|
(c)
|
In November 2007, our Company completely disposed of our investment in Metro, Inc.
|
|
(d)
|
In December 2007, we issued $165 million 5.125% convertible notes due June 15, 2011 and $255 million 6.75% convertible notes due December 15, 2012. These notes are subject to compromise as of February 26, 2011. In addition, in December 2007, we entered into a new $675 million credit agreement, which was later amended in July 2009 to $655 million. On December 14, 2010, we satisfied all of the conditions to the effectiveness of the DIP Credit Agreement and refinanced the $655 million credit agreement.
|
|
(e)
|
Unaudited.
|
|
(f)
|
In April 2007, our 7.75% Notes become due and payable in full.
|
|
(g)
|
On April 25, 2006, our Company paid a special one-time dividend to our stockholders of record on April 17, 2006 equal to $7.25 per share. This dividend payout totaling $299.1 million was recorded as a reduction of “Additional paid in capital” in our Consolidated Balance Sheets at February 24, 2007.
|
|
(h)
|
Our 6.750% Convertible Notes are subject to new accounting guidance for convertible debt instruments with cash settlement features, As a result of adopting this guidance during fiscal 2009, we reclassified $26.4 million of debt and deferred financing costs to “Additional paid-in capital”, net of deferred taxes. We also retrospectively recognized additional non-cash interest expense of $0.4 million for fiscal 2007 and $3.5 million for fiscal 2008.
|
|
(i)
|
On August 4, 2009, we issued $260.0 million of 11.375% senior secured notes due 2015 and 175,000 shares of 8.0% Cumulative Convertible Preferred Stock for approximately $162.8 million, net of closing and issuance costs. The senior secured notes are subject to compromise as of February 26, 2011.
|
|
(j)
|
During fiscal 2010, we recorded trademark impairment charges of $12.7 million, long-lived asset impairment charges of $45.3 million, resulting from our interim impairment testing and long-lived asset impairment charges of $56.2 million from store closures during third quarter 2010 and first quarter 2011, respectively. During fiscal 2009, we recorded goodwill impairment charges of $345.5 million, trademark impairment charges of $66.4 million and long-lived asset impairment charges of $65.2 million, resulting from our interim and annual impairment testing.
|
|
(k)
|
As of February 26, 2011, we have a $350.0 million term loan outstanding from the DIP Credit Agreement.
|
|
(l)
|
Refer to Note 10 to our Consolidated Financial Statements.
|
|
|
|
|
ITEM 7 – Management's Discussion and Analysis of Financial Condition and Results of Operation
|
INTRODUCTION
The following Management’s Discussion and Analysis is intended to help the reader understand the financial position, operating results, and cash flows of The Great Atlantic and Pacific Tea Company, Inc. (“We”, “Our”, “Us”, “A&P”, or “our Company”). It should be read in conjunction with our financial statements and the accompanying notes (“Notes”). It discusses matters that Management considers relevant to understanding the business environment, financial position, results of operations and our Company’s liquidity and capital resources. These items are presented as follows:
|
·
|
Basis of Presentation — a description of our Company’s fiscal years.
|
|
·
|
Overview — a general description of our business.
|
|
·
|
Operating Results — a summary discussion of operating results during fiscal 2010, addressing the value drivers of our business; measurements; opportunities; challenges and risks; and initiatives.
|
|
·
|
Outlook — a discussion of certain trends or business initiatives for the upcoming year that Management wishes to share with the reader to assist in understanding the business.
|
|
·
|
Review of Operations and Liquidity and Capital Resources – a discussion of results for fiscal 2010, fiscal 2009 and fiscal 2008, significant business initiatives, current and expected future liquidity.
|
|
·
|
Critical Accounting Estimates — a discussion of significant estimates made by Management.
|
|
·
|
Market Risk — a discussion of the impact of market changes on our consolidated financial statements.
|
BASIS OF PRESENTATION
Our fiscal year ends on the last Saturday in February. Fiscal 2010 and fiscal 2009 were each comprised of 52 weeks. Fiscal 2008 was comprised of 53 weeks consisting of 12 four-week periods and one five-week period. Except where noted, all amounts are presented in millions.
OVERVIEW
Our Company is based in Montvale, New Jersey, operates conventional supermarkets, combination food and drug stores, and limited assortment food stores in 7 U.S. states and the District of Columbia under the A&P®, SuperFresh®, Waldbaum’s®, Super Foodmart®, Food Basics®, The Food Emporium®, Best Cellars®, Best Cellars at A&P®, Pathmark®, and Pathmark Sav-A-Center® trade names. Our Company’s business consists strictly of our retail operations, which totaled 393 stores as of February 26, 2011.
We have four reportable segments: Fresh, Pathmark, Gourmet and Other. Our Other segment includes our Discount and Wine, Beer & Spirits businesses.
OPERATING RESULTS
This fiscal year brought with it major shifts in our business strategy as a result of our comprehensive turnaround plan that we announced during our second quarter. Key elements of our turnaround plan included changes within our executive management team and further enhancement of value for our customers and their shopping experience in our stores through our broad selection of food products and superior customer service.
The five key elements, or building blocks, of our turnaround plan are:
|
·
|
Installing a strong executive management team;
|
|
·
|
Reducing our structural and operating costs;
|
|
·
|
Improving our value proposition for our customers;
|
|
·
|
Enhancing our customers’ experience in our stores; and
|
|
·
|
Emerging from Chapter 11.
|
During our second quarter, we put in place a new senior management team with the operating and financial experience that the Company needs to drive our turnaround. As part of our plan, we closed 25 non-productive and sold seven non-core stores in Connecticut during the third quarter.
Despite these efforts, on December 12, 2010, our Company filed voluntary petitions (“Bankruptcy Filing”) under Chapter 11 of the U.S. Bankruptcy Code in the U.S. Bankruptcy Court for the Southern District of New York. We took this difficult but necessary step to enable our Company to fully implement our comprehensive financial and operational restructuring. While we have made substantial progress on the operational and merchandising aspects of our turnaround plan, we concluded that we could not complete our turnaround without availing ourselves of the Bankruptcy Filing. We intend for this allow us to restructure our debt, reduce our structural costs, and address our legacy issues. In connection with the Bankruptcy filing, on December 13, 2010 we obtained $800.0 million Debtor-in-Possession (“DIP”) financing provided by JPMorgan Chase Bank, N.A. Of the total DIP facility, a $350.0 million term loan was immediately funded to our Company.
Our Fresh and Pathmark segments continued to have lower revenue and operating income in fiscal 2010 as compared to fiscal 2009. Our management team has begun to address these challenges by making the difficult decision to close underperforming stores during fiscal 2010 and fiscal 2011.
Our Gourmet stores located in Manhattan, New York continued to deliver among the best results in the industry, despite a decline in comparable store sales, scheduled cash rent increases and increased utility costs, which contributed to a reduced segment income from fiscal 2009.
Our Discount business experienced an increase in comparable store sales, partially offset by year-over-year increases in operating costs, primarily relating to labor and occupancy costs attributable to scheduled rent increases.
Our Wine, Beer & Spirits businesses continue to perform well with a year-over-year increase in segment income attributable primarily to positive comparable same store sales.
OUTLOOK
We closed an additional 32 stores in six states during our first quarter 2011 and announced plans to market an additional 25 stores for sale. We continue to evaluate the need to close or sell underperforming stores.
Our Company currently acquires a majority of our saleable inventory from one supplier, C&S Wholesale Grocers, Inc. (“C&S”). Under our March 7, 2008 agreement with C&S, C&S provides warehousing, logistics, procurement and purchasing services (the “Services”) in support of our Company’s entire supply chain. We are rebidding the Services to ensure that the structure and costs of our entire supply chain are more closely aligned with the needs of our business. The rebidding of Services may result in a rejection or termination of our agreement with C&S in Bankruptcy Court. We anticipate that the rebidding process will result in significant cost savings in fiscal 2011 and beyond, but there can be no assurances that these efforts will be successful or will result in any savings or improvements.
We believe that we have good relationships with our union partners. To reorganize as a viable business, our Company believes it needs to secure cost savings in multiple areas, including obligations arising under our collective bargaining agreements. Our Company is currently seeking to negotiate with its union partners to obtain consensual modifications to its collective bargaining agreements that are necessary for our Company’s successful reorganization. Our Company’s goal is to consensually modify its collective bargaining obligations by agreement with each of its union partners, although our Company cannot guaranty whether such outcome can be achieved.
If our Company is unable to obtain cost savings from its labor partners on a consensual basis, our Company may need to avail itself of certain rights and remedies under the Bankruptcy Code with regard to its collective bargaining obligations. In particular, Section 1113(c) of the Bankruptcy Code permits our Company to reject its collective bargaining agreements if our Company first satisfies a number of substantive and procedural requirements and the Bankruptcy Court determines, among other things, that the “balance of the equities clearly favors rejection.” Our Company has not sought to reject any of its collective bargaining agreements at this time.
There can be no assurance that our Company will succeed in obtaining necessary labor cost savings or that work stoppages or labor disturbances will not occur as a result of this process.
The Bankruptcy Filing provides our Company the resources to implement our comprehensive financial and operational restructuring. We remain committed to implementing our turnaround strategy while operating our business during the Chapter 11 restructuring process. However, there can be no assurance regarding these matters. Further deterioration of comparable store revenues beyond what is contemplated in our current plans in fiscal 2011 would negatively impact our anticipated profitability and cash flows from operations. While reversing negative consumer trends is a very difficult process and the timing and success of these measures cannot be assured, we anticipate that our initiatives to lower retail prices and improve our customers’ shopping experience will reverse the decreasing customer count and comparable store sales decline that we have been experiencing. There can be no assurance that our operational and financial turnaround strategy will be successful or that the DIP Lenders or the Bankruptcy Court will approve the proposed plan, and under such circumstances we could be forced to consider other alternatives to maximize potential recovery for our various creditor constituencies, including a possible sale of material assets, pursuant to section 363 of the Bankruptcy Code. The uncertainty regarding these matters raises substantial doubt about our Company’s ability to continue as a going concern.
REVIEW OF OPERATIONS AND LIQUIDITY AND CAPITAL RESOURCES
Our consolidated financial information presents the results related to our operations of discontinued businesses separate from the results of our continuing operations.
FISCAL 2010 COMPARED WITH FISCAL 2009
The following table summarizes our results of operations for fiscal 2010 compared to fiscal 2009:
|
Fiscal 2010
|
Fiscal 2009
|
Favorable (unfavorable)
|
% Change
|
|||||||||||||
|
(in millions, except percentages and per share data)
|
||||||||||||||||
|
Sales
|
$
|
8,078.5
|
$
|
8,813.6
|
$
|
(735.1
|
)
|
(8.3
|
%)
|
|||||||
|
Decrease in comparable store sales
|
(5.3
|
%)
|
(4.3
|
%)
|
NA
|
NA
|
||||||||||
|
Loss from continuing operations
|
$
|
(673.4
|
)
|
$
|
(780.7
|
)
|
$
|
107.3
|
13.7
|
%
|
||||||
|
Income (loss) from discontinued operations
|
$
|
74.8
|
$
|
(95.8
|
)
|
$
|
170.6
|
>100
|
%
|
|||||||
|
Net loss
|
$
|
(598.6
|
)
|
$
|
(876.5
|
)
|
$
|
277.9
|
31.7
|
%
|
||||||
|
Net loss per share - basic
|
$
|
(11.45
|
)
|
$
|
(16.59
|
)
|
$
|
5.14
|
31.0
|
%
|
||||||
|
Net loss per share - diluted
|
$
|
(247.69
|
)
|
$
|
(29.34
|
)
|
$
|
(218.35
|
)
|
>(100
|
%)
|
|||||
Average weekly sales per supermarket were approximately $391.7 thousand for fiscal 2010 versus $411.2 thousand for the corresponding period of the prior year, a decrease of 4.7% primarily due to the overall decline in our sales resulting from the current economic environment and its negative effect on consumer spending.
SALES
|
Fiscal 2010
|
Fiscal 2009
|
||
|
(in thousands)
|
|||
|
Sales
|
|||
|
Fresh
|
$ 4,060,958
|
$ 4,402,044
|
|
|
Pathmark
|
3,451,876
|
3,855,251
|
|
|
Gourmet
|
266,003
|
273,060
|
|
|
Other
|
299,618
|
283,213
|
|
|
Total Sales
|
$ 8,078,455
|
$ 8,813,568
|
|
Sales decreased by $735.1 million, from $8,813.6 million in fiscal 2009 to $8,078.5 million in fiscal 2010, primarily due to a decline in comparable store sales of $463.1 million, reflecting decreased volume, and store closures of $283.8 million, partially offset by sales from one new store of $11.8 million.
The sales decline in our Fresh segment of $341.0 million was primarily related to a decline of $207.1 million in comparable store sales due to reduced volume and store closures of $145.7 million, partially offset by an increase in sales from new stores of $11.8 million. The decrease in sales in our Pathmark segment of $403.4 million was primarily attributed to a decline of $267.6 million in comparable store sales due to reduced volume and store closures of $135.8 million. Sales generated by our Gourmet segment decreased by $7.1 million, due to a decline in comparable store sales as a result of decreasing volume. Sales increased by $16.4 million in our Other segment, representing our Discount and our Wine, Beer & Spirits businesses, primarily driven by increased comparable sales generated by our Discount business, due to increased volume, partially offset by store closures in our Wine, Beer & Spirits business of $2.2 million. Refer to Note 20 to our Consolidated Financial Statements – Segments for further discussion of our reportable segments.
GROSS MARGIN
Gross margin as a percentage of sales decreased 54 basis points from 30.26% in fiscal 2009 to 29.72% for fiscal 2010.
The following table details how volume and rate impact the gross margin dollar decrease from fiscal 2009 to fiscal 2010 (in millions):
Sales Volume Rate Total
Total Company $ (222.4) $ (43.7) $ (266.1)
STORE OPERATING, GENERAL AND ADMINISTRATIVE EXPENSE
Store operating, general and administrative (“SG&A”) expense was $2,737.1 million or 33.88% as a percentage of sales for fiscal 2010, as compared to $2,790.2 million or 31.66% as a percentage of sales for fiscal 2009.
SG&A expenses for fiscal 2010 included (i) insurance reserve adjustment of $88.3 million, or 109 basis points, (ii) net real estate related costs of $60.0 million, or 74 basis points (iii) net restructuring and other costs of $26.1 million, or 33 basis points, and (iv) stock-based compensation of $1.3 million, or 2 basis points.
SG&A expenses for fiscal 2009 included (i) insurance reserve adjustment of $38.3 million, or 44 basis points, (ii) net real estate related costs of $37.1 million, or 42 basis points, (iii) net restructuring and other costs of $16.7 million, or 19 basis points (which includes $14.6 million of severance costs relating to labor rationalization initiatives during fiscal 2009), (iv) stock-based compensation of $5.7 million, or 6 basis points and (v) pension withdrawal costs of $2.4 million, or 3 basis points.
Excluding the items listed above, SG&A as a percentage of sales increased by 119 basis points during fiscal 2010, as compared to fiscal 2009. Despite decreases in labor and occupancy expenditures of $68.3 million and $35.8 million, respectively, the corresponding rates as a percentage of sales increased by 63 basis points and 32 basis points, respectively. In addition, corporate and banner administrative expenses increased by $28.1 million, or 47 basis points, as the decline in corporate and administrative costs resulting from restructuring activities was more than offset by an increase in corporate costs attributable to store-related activities, primarily benefits and occupancy costs. The increases in rate to sales were partially offset by reductions of 23 basis points in various other operating expenses and non-allocated corporate overhead.
During fiscal 2010 and fiscal 2009, we recorded impairment losses on long-lived assets relating to closure or conversion of stores in the normal course of business of $7.2 million and $6.5 million, respectively. The effects of changes in estimates of useful lives were not material to ongoing depreciation expense. If current operating levels do not improve, there may be a need to take further actions which may result in additional future impairments on long-lived assets, including impairment of assets that are held and used.
GOODWILL, TRADEMARK AND LONG-LIVED ASSET IMPAIRMENT
During fiscal 2010 we recorded long-lived asset impairment charges aggregating $101.5 million as a result of the following:
|
·
|
As a result of experiencing cash flow losses at certain stores, we determined that triggering events had occurred that required us to test the related long-lived assets for potential impairment. We recorded impairment charges of $45.3 million during fiscal 2010 to partially write down these stores’ long-lived assets, which consist of favorable leases, capital leases, and land and buildings, with a carrying amount of $114.9 million to their fair value of $69.6 million for fiscal 2010.
|
|
·
|
In August 2010, our Company announced a plan to close 25 stores in five states as we began the implementation and execution phase of our comprehensive turnaround. The affected stores include locations in close proximity to other Company stores, those facing real estate and cost issues, and underperforming non-core stores. In February 2011, our company filed a motion seeking approval to close 32 stores in six states as we continue to fully implement our comprehensive financial and operational restructuring. These store closures were completed on April 16, 2011. As a result, we recorded a total impairment charge for closed stores of $56.2 million during fiscal 2010.
|
Refer to Note 4 to our Consolidated Financial Statements – Valuation of Long-Lived Assets for additional information.
As we worked through our turnaround plan during the third quarter, we experienced significant impediments to lowering our operating costs, leading to revised projections and triggering a requirement for an interim impairment analysis. As a result of our testing, we concluded that no goodwill impairment was required; however an impairment of $12.7 million for our Pathmark trademark was recorded. We performed our annual impairment tests during our fourth quarter noting no further impairments. Refer to Note 2 to our Consolidated Financial Statements – Goodwill and Other Intangible Assets for additional information.
We believe our estimates used to perform the impairment analysis of our goodwill, trademark and long-lived assets are appropriate given the current market conditions; however, future impairment charges could be required due to changes in the market conditions or other factors relating to our performance.
SEGMENT (LOSS) INCOME
|
Fiscal 2010
|
Fiscal 2009
|
|||||||
|
(in thousands)
|
||||||||
|
Segment (loss) income
|
||||||||
|
Fresh
|
$ | 41,573 | $ | 111,582 | ||||
|
Pathmark*
|
(84,017 | ) | (46,326 | ) | ||||
|
Gourmet
|
20,419 | 25,691 | ||||||
|
Other
|
1,822 | 1,472 | ||||||
|
Total Segment (loss) income
|
$ | (20,203 | ) | $ | 92,419 | |||
* Includes results from A&P stores that have been subsequently converted to Pathmark stores.
Segment income decreased $112.6 million from income of $92.4 million for fiscal 2009 to a loss of $20.2 million for 2010. Our Fresh and Pathmark segments experienced segment income declines of $70.0 million and $37.7 million, respectively, primarily attributable to declines in sales and lower gross margins, partially offset by reduced labor, operating and occupancy expenses. Segment income from our Gourmet business declined by $5.3 million, due to a decline in sales and gross margins. Segment income for our Other segment, representing our Discount and Wine, Beer and Spirits businesses, increased by approximately $0.4 million, primarily driven by labor utilization in our Wine, Beer and Spirits business. Refer to Note 20 to our Consolidated Financial Statements – Segments for further discussion of our reportable operating segments.
NONOPERATING INCOME
During fiscal 2010 and fiscal 2009, we recorded favorable fair value adjustments of $13.8 million and unfavorable fair value adjustments of $9.2 million, respectively, relating to our Series B warrants acquired in connection with our purchase of Pathmark. These adjustments are primarily a function of fluctuations in the market price of our Company’s common stock.
INTEREST EXPENSE, NET
Interest expense, net increased $25.5 million from $192.9 million in fiscal 2009 to $218.4 million in fiscal 2010, primarily attributable to the $35.7 million in financing fees and $7.8 million in contractual interest from the DIP Credit Agreement in fiscal 2010. During fiscal 2010, we also recorded $29.5 million of interest expense and bond issue cost amortization relating to our $260 million 11.375% senior secured notes due 2015 that were issued in August 2009, an increase of $12.8 million from fiscal 2009.
These increases in interest expense were partially offset by a decrease of $9.8 million of non-cash interest expense recorded during fiscal 2010, to reflect the impact of the lower discount rate used to revalue our GHI contractual obligation at February 26, 2011 than at February 27, 2010, which is derived each period from published zero-coupon AA corporate bond yields, as well as a decrease in interest expense of $3.5 million from our $655 million Credit Agreement, which was paid off with proceeds from the DIP Credit Agreement during fourth quarter 2010. During fiscal 2010, dividends on our Series A Redeemable Preferred Stock was charged to Additional paid-in capital as opposed to interest expense as had been previously done during fiscal 2009 for $3.5 million. During fiscal 2010, we also had aggregate decreases in contractual interest expense of $9.7 million for our Related Party Promissory Note, due August 18, 2011, 9.125% Senior Notes, due December 15, 2011, 5.125% Convertible Senior Notes, due June 15, 2011, 6.750% Convertible Senior Notes, due December 15, 2012, and 9.375% Notes, due August 1, 2039, all of which are unsecured obligations that we ceased accruing interest for during the fourth quarter 2010 as a result of the Bankruptcy Filing. Lastly, we had aggregate decreases of interest expense of approximately $3.9 million attributed to amortization of deferred financing fees and discounts on unsecured obligations that we ceased amortizing as a result of the Bankruptcy Filing.
REORGANIZATION ITEMS, NET
Reorganization items, net represent amounts incurred as a direct result of the Bankruptcy Filing. We have rejected 98 of our leases and adjusted the reserve balance associated with these leases to the allowable claim for damages, of which $59.4 million was attributed to continuing operations. Debt discounts and deferred financing fees for secured and unsecured pre-petition indebtedness were reclassified against the book value of the related debt and adjustments of $15.6 million and $35.8 million, respectively, were made to adjust the debt to face value. After our Company’s Bankruptcy Filing, we repaid our pre-existing first lien credit facility with a balance of $140.5 million with the proceeds from the $350.0 million term loan under the DIP Credit Agreement. As a result of the repayment, we immediately expensed financing fees of approximately $10.7 million which were previously capitalized in connection with the first lien credit facility. We paid approximately $3.4 million for professional fees during fiscal 2010 related to our Bankruptcy Filing. Professional fees of $11.7 million were accrued. Other financing fees of $3.8 million were paid prior to the Bankruptcy Filing for a proposed financing arrangement that was not executed. U.S. Trustee fees of approximately $0.4 million were incurred.
INCOME TAXES
Benefit from income taxes from continuing operations for fiscal 2010 was $3.8 million and $22.0 million for fiscal 2009. Consistent with the prior year, we continue to record a valuation allowance against our net deferred tax assets.
The effective tax rates on continuing operations of (0.6%) for fiscal 2010 varied from the statutory rate of 35%, primarily due to state and local income taxes, an increase in our valuation allowance, and the impact of the Pathmark financing and fiscal 2010 impairments. Approximately $3.1 million of the net income tax benefit resulted from the write-off of the deferred tax liability associated with the Pathmark trademark, an indefinite-lived intangible asset, as a result of its impairment during fiscal 2010.
The effective tax rate on continuing operations of (2.7)% for fiscal 2009 varied from the statutory rate of 35%, primarily due to state and local income taxes, an increase in our valuation allowance the remeasurement of our uncertain tax positions, and the impact of the Pathmark financing and fiscal 2009 impairments. Approximately $16.0 million of the net income tax benefit resulted from the write-off of the deferred tax liability associated with the Pathmark trademark, an indefinite-lived intangible asset, as a result of its impairment during fiscal 2009.
DISCONTINUED OPERATIONS
Income from discontinued operations for fiscal 2010 of $74.8 million increased from a loss from discontinued operations of $95.8 million for fiscal 2009, primarily due to the rejection of property leases and the corresponding adjustment to the reserve balance associated with these leases to the allowable claims for damages, of which $133.3 million was attributed to discontinued operations. Fiscal 2010 income from discontinued operations was partially offset by smaller adjustments in estimated occupancy reserves recorded during fiscal 2010 due to changes in our estimation of such costs resulting from continuing deteriorating conditions in the Midwest real estate market, as well as a $24.9 million increase in our worker’s compensation and general liability reserves relating to discontinued operations, which was associated primarily with a negative development of prior year claims and the related state assessment for such claims.
FISCAL 2009 COMPARED WITH FISCAL 2008
The following table summarizes our results of operations for fiscal 2009 compared to fiscal 2008:
|
Fiscal 2009
|
Fiscal 2008 (1)
|
Favorable
(unfavorable)
|
% Change
|
||||||||||||
|
(in millions, except percentages and per share data)
|
|||||||||||||||
|
Sales
|
$ | 8,813.6 | $ | 9,516.2 | $ | (702.6 | ) | (7.4%) | |||||||
|
(Decrease) increase in comparable store sales
|
(4.3 | %) | 2.0 | % |
NA
|
NA
|
|||||||||
|
Loss from continuing operations
|
$ | (780.7 | ) | $ | (117.9 | ) | $ | (662.8 | ) |
>(100%)
|
|||||
|
Loss from discontinued operations
|
$ | (95.8 | ) | $ | (53.7 | ) | $ | (42.1 | ) | (78.4%) | |||||
|
Net loss
|
$ | (876.5 | ) | $ | (171.6 | ) | $ | (704.9 | ) |
>(100%)
|
|||||
|
Net loss per share - basic
|
$ | (16.59 | ) | $ | (3.36 | ) | $ | (13.23 | ) |
>(100%)
|
|||||
|
Net loss per share - diluted
|
$ | (29.34 | ) | $ | (5.96 | ) | $ | (23.38 | ) |
>(100%)
|
|||||
|
(1)
|
Fiscal 2008 reflects increased interest expense of $3.5 million for our 6.750% convertible senior notes from the amount recorded in our Form 10-K for fiscal 2008 as a result of the retrospective application of the new accounting guidance relating to convertible debt, which we adopted during the first quarter of fiscal 2009. Refer to Note 9 to our Consolidated Financial Statements – Indebtedness and Other Financial Liabilities for more information.
|
Average weekly sales per supermarket were approximately $411.2 thousand for fiscal 2009 versus $423.8 thousand for the corresponding period of the prior year, a decrease of 3.0% primarily due to the overall decline in our sales resulting from the current economic environment and its negative effect on consumer spending, as well as a lower rate of inflation.
SALES
|
Fiscal 2009
|
Fiscal 2008
|
||||
|
Sales
|
(in thousands)
|
||||
|
Fresh
|
$ 4,402,044
|
$ 4,806,467
|
|||
|
Pathmark
|
3,855,251
|
4,173,017
|
|||
|
Gourmet
|
273,060
|
281,767
|
|||
|
Other
|
283,213
|
254,935
|
|||
|
Total sales
|
$ 8,813,568
|
$ 9,516,186
|
|||
Sales decreased by $702.6 million, from $9,516.2 million in fiscal 2008 to $8,813.6 million in fiscal 2009, primarily due to a decline in comparable store sales, reflecting decreased volume and the impact of accelerated retail price deflation mainly resulting from increased promotional spending during fiscal 2009. The decrease in sales during fiscal 2009 was also attributable to the absence of sales resulting from store closures and sales generated during the 53rd week included in fiscal 2008, partially offset by sales generated by our new stores.
The sales decline in our Fresh segment of $404.4 million was primarily related to a decline in the comparable store sales of $231.8 million, the absence of sales resulting from store closures of $88.8 million and the absence of the additional sales recorded during the 53rd week in fiscal 2008 of $83.8 million. The decrease in sales in our Pathmark segment of $317.8 million was primarily due to a decline in comparable store sales of $181.6 million, the absence of sales resulting from store closures of $104.5 million, and the absence of sales recorded during the 53rd week in fiscal 2008 of $74.9 million, partially offset by an increase in sales from new stores of $43.2 million. Sales generated by our Gourmet segment decreased by $8.7 million, primarily due to the absence of sales recorded during the 53rd week in fiscal 2008 of $5.5 million and a decline in comparable store sales of $3.2 million. The sales increase of $28.3 million in our Other segment, representing our Discount and our Wine, Beer & Spirits businesses, was primarily driven by increased sales generated by our Discount business, primarily attributable to sales from three new stores of $21.1 million and increased comparable store sales of $10.1 million. Refer to Note 20 to our Consolidated Financial Statements – Segments for further discussion of our reportable segments.
GROSS MARGIN
Gross margin as a percentage of sales decreased 25 basis points from 30.51% in fiscal 2008 to 30.26% for fiscal 2009, reflecting lower margins from our Pathmark segment, partially offset by improved margin rates from our Fresh and Gourmet segments.
The following table details how volume and rate impact the gross margin dollar decrease from fiscal 2008 to fiscal 2009:
Sales Volume Rate Total
Total Company $ (214.4) (21.9) $ (236.3)
STORE OPERATING, GENERAL AND ADMINISTRATIVE EXPENSE
Store operating, general and administrative (“SG&A”) expense was $2,790.2 million or 31.66% as a percentage of sales for fiscal 2009, as compared to $2,978.1 million or 31.30% as a percentage of sales for fiscal 2008.
SG&A expenses for fiscal 2009 included (i) insurance reserve adjustment of $38.3 million, or 44 basis points, (ii) net real estate related costs of $37.1 million, or 42 basis points, (iii) net restructuring and other costs of $16.7 million, or 19 basis points (which includes $14.6 million of severance costs relating to labor rationalization initiatives during fiscal 2009), (iv) stock-based compensation of $5.7 million, or 6 basis points and (v) pension withdrawal costs of $2.4 million, or 3 basis points.
SG&A expenses for fiscal 2008 included (i) net restructuring and other costs of $66.7 million, or 71 basis points, (ii) net real estate related costs of $40.2 million, or 42 basis points, (iii) pension obligation costs of $28.9 million, or 30 basis points, recorded in connection with our withdrawal from the UFCW Local 342 Amalgamated Pension Plan, and (iv) stock-based compensation costs of $5.7 million, or 6 basis points. These expenses were offset by (v) an insurance reserve recovery of $2.7 million, or 3 basis points.
Excluding the items listed above, SG&A as a percentage of sales increased 69 basis points for fiscal 2009 as compared to fiscal 2008, primarily due to lower sales leverage on fixed costs, including increased labor costs of 57 basis points, increased advertising related costs of 13 basis points and increased occupancy expenses of 8 basis points, partially offset by a decrease in corporate and banner administrative expenses of 20 basis points.
During fiscal 2009 and fiscal 2008, we recorded impairment losses on long-lived assets relating to closure or conversion of stores in the normal course of business of $6.5 million and $14.1 million, respectively. The effects of changes in estimates of useful lives were not material to ongoing depreciation expense. If current operating levels do not improve, there may be a need to take further actions which may result in additional future impairments on long-lived assets, including impairment of assets that are held and used.
GOODWILL, TRADEMARK AND LONG-LIVED ASSET IMPAIRMENT
As a result of experiencing increasing cash flow losses within certain asset groupings, we determined that triggering events occurred during the third and fourth quarters of fiscal 2009 for testing the related asset groups’ long-lived assets for potential impairment. As a result of our testing, we recorded impairment charges aggregating $65.2 million, primarily attributable to favorable leases and other owned property, $40.8 million of which was recorded in the third quarter and $24.4 million of which was recorded in the fourth quarter of fiscal 2009. Refer to Note 4 to our Consolidated Financial Statements – Valuation of Long-Lived Assets for additional information.
During fiscal 2009, we recorded goodwill impairment charges of $345.5 million and impaired our Pathmark trademark by $66.4 million. During the third quarter of fiscal 2009, due to the severity and duration of operating losses within the Pathmark reporting unit, changes in our management’s long-term forecasts relating to the Pathmark reporting unit, and the significant impairment of long-lived assets within the Pathmark reporting unit, we concluded that an interim triggering event had occurred for purposes of determining whether any portion of our goodwill and trademark balance recorded within our Pathmark segment has been impaired. As a result, we impaired the entire $321.8 million goodwill balance and $49.9 million of the trademark balance of $127.3 million within our Pathmark reporting unit. During the fourth quarter of fiscal 2009, we performed our annual goodwill impairment testing for our remaining reporting units (other than Pathmark), which resulted in impairing the entire $23.7 million goodwill balance attributable to our South (SuperFresh) reporting unit. In addition, we performed our annual impairment testing of our indefinite-lived intangible asset, and as a result of further lowering our anticipated revenue projections, we concluded that an additional impairment of $16.5 million was required for our Pathmark trademark. Refer to Note 2 to our Consolidated Financial Statements – Goodwill and Other Intangible Assets for additional information.
We believe our estimates used to perform the impairment analysis of our goodwill, trademark and long-lived assets are appropriate given the current market conditions; however, future impairment charges could be required due to changes in the market conditions or other factors relating to our performance.
SEGMENT INCOME
|
Fiscal 2009
|
Fiscal 2008
|
|||||||
| ( in thousands) | ||||||||
|
Segment income
|
||||||||
|
Fresh
|
$ | 111,582 | $ | 148,617 | ||||
|
Pathmark*
|
(46,326 | ) | 19,012 | |||||
|
Gourmet
|
25,691 | 24,866 | ||||||
|
Other
|
1,472 | 2,184 | ||||||
|
Total segment income
|
$ | 92,419 | $ | 194,679 | ||||
* Includes results from A&P stores that have been subsequently converted to Pathmark stores.
Segment income decreased $102.3 million from $194.7 million in fiscal 2008 to $92.4 million in fiscal 2009. The decrease in segment income of $37.0 million for our Fresh segment was primarily driven by lower sales and gross margin, partially offset by negotiated cost reductions and reduced labor and occupancy costs. Our Pathmark segment experienced a decline in segment income of $65.3 million, which was attributable to lower sales and gross margins, primarily resulting from higher promotional spending and reductions in everyday prices for this segment, partially offset by reduced productive labor and occupancy costs. Segment income for our Gourmet business improved by $0.8 million, as the decline in sales was more than offset by the improved gross margin rate and reduced productive labor and occupancy costs. Segment income in our Other segment, representing our Discount and our Wine, Beer & Spirits businesses, declined by $0.7 million, as the increase in its sales was more than offset by increased expenses, including productive labor and occupancy costs. Refer to Note 20 to our Consolidated Financial Statements – Segments for further discussion of our reportable operating segments.
NONOPERATING INCOME
During fiscal 2009 and fiscal 2008, we recorded unfavorable fair value adjustments of $9.2 million and favorable fair value adjustments $101.3 million, respectively, relating to our Series B warrants acquired in connection with our purchase of Pathmark. In addition, during fiscal 2008, we recorded $15.6 million of favorable fair value adjustments associated with our Series A warrants that were exercised on May 7, 2008, the conversion features related to our 5.125% convertible senior notes, our 6.750% convertible senior notes, and our financing warrants issued in connection with our convertible senior notes, which were marked to market until stockholder approval authorizing sufficient shares to be available for their issuance was obtained on June 26, 2008. These adjustments are primarily a function of fluctuations in the market price of our Company’s common stock.
INTEREST EXPENSE, NET
Interest expense, net increased $35.9 million from $157.0 million in fiscal 2008 to $192.9 million in fiscal 2009, primarily due to $17.6 million of interest expense recorded during fiscal 2009, to reflect the impact of the lower discount rate used to revalue our GHI contractual obligation at February 27, 2010 than at February 28, 2009, which is derived each period from published zero-coupon AA corporate bond yields, as well as interest accretion relating to this obligation. During fiscal 2009, we also recorded $18.3 million of interest expense and bond issue cost amortization relating to our $260 million 11.375% senior secured notes due 2015 that were issued in August 2009 and $3.9 million of interest expense relating to dividends and issuance cost amortization on the portion of our preferred stock issued in August 2009 that was classified as a liability prior to obtaining shareholder approval authorizing its convertibility on December 15, 2009. These increases in interest expense were partially offset by $6.5 million of reduced interest expense relating to bank borrowings resulting from our repayments of a portion of our variable debt using proceeds from the August 2009 offerings of senior notes and preferred stock.
During fiscal 2009 and fiscal 2008, we recorded additional non-cash interest expense of $4.2 million and $3.5 million, respectively, relating to our $255 million aggregate principal amount of the 6.750% Convertible Senior Notes that were issued in December 2007, as a result of our retrospective adoption of the new accounting guidance relating to convertible debt instruments with cash settlement features during fiscal 2009. Refer to Note 9 of our Consolidated Financial Statements – Indebtedness and Other Financial Liabilities for additional information.
INCOME TAXES
Benefit from income taxes from continuing operations for fiscal 2009 was $22.0 million compared to a provision of $2.7 million for fiscal 2008. Consistent with the prior year, we continue to record a valuation allowance against our net deferred tax assets.
The effective tax rates on continuing operations of (2.7%) for fiscal 2009 varied from the statutory rate of 35%, primarily due to state and local income taxes, an increase in our valuation allowance, the remeasurement of our uncertain tax positions, and the impact of the Pathmark financing and fiscal 2009 impairments. Approximately $16 million of the net income tax benefit resulted from the write-off of the deferred tax liability associated with the Pathmark trademark, an indefinite-lived intangible asset, as a result of its impairment during fiscal 2009.
The effective tax rate on continuing operations of 2.3% for fiscal 2008 varied from the statutory rate of 35%, primarily due to state and local income taxes, an increase in our valuation allowance and the impact of the Pathmark financing.
DISCONTINUED OPERATIONS
The loss from operations of discontinued businesses for fiscal 2009 of $95.8 million increased from loss from operations of discontinued business of $58.4 million for fiscal 2008, primarily due to higher occupancy related expenses recorded during fiscal 2009 due to changes in our estimation of such costs resulting from continuing deteriorating conditions in the Midwest real estate market, as well as a $13.0 million increase in our worker’s compensation and general liability reserves relating to discontinued operations, which was associated with a negative development of prior year claims and the related state assessment for such claims. The $4.7 million gain on disposal of discontinued operations for fiscal 2008 primarily consisted of a $2.6 million gain related to the sale of our Eight O’Clock Coffee business in fiscal 2003 due to the settlement of a contingent note whose value was based upon certain elements of the future performance of the Eight O’Clock Coffee business and was not originally recorded in the gain during fiscal 2003. In addition, during fiscal 2008, we recorded a gain of $1.8 million relating to the sale of land in the Greater New Orleans area.
FINANCIAL POSITION, LIQUIDITY AND CAPITAL RESOURCES
Cash Flows
The following table presents excerpts from our Consolidated Statements of Cash Flows (in thousands):
|
Fiscal 2010
|
Fiscal 2009
|
Fiscal 2008
|
||||||||||
|
Net cash used in operating activities
|
$ | (80,970 | ) | $ | (41,917 | ) | $ | (1,299 | ) | |||
|
Net cash used in investing activities
|
(26,064 | ) | (62,966 | ) | (64,530 | ) | ||||||
|
Net cash provided by financing activities
|
207,215 | 181,934 | 140,549 | |||||||||
Net Cash Used in Operating Activities
Net cash used in operating activities increased by $39.1 million during fiscal 2010 as compared to fiscal 2009. The increase in cash used in operations is primarily the result of declining core operating results as reflected in our $185.2 million increase in net loss adjusted by non-cash charges, which is due to lower comparable store revenues, decreased volume at the stores, and the results of underperforming stores, some of which were closed in the latter part of fiscal 2010. Partially offsetting the impact of lost income was an improvement in working capital items subject to compromise, which are stayed in bankruptcy, of approximately $133.4 million. Additionally, we paid approximately $41.3 million less for closed store obligations in fiscal 2010.
Net cash used in operating activities increased by $40.6 million during fiscal 2009 as compared to fiscal 2008. The increase in cash used in operations is primarily driven by lower sales and the related margin income as reflected in our $72.9 million decrease in net loss adjusted by non-cash charges. Management has been able to partially reduce the impact of lost income through a reduction in non-cash working capital of approximately $6.6 million. We also experienced a reduction in self-insurance payments from 2008 of approximately $12.0 million, primarily due to prior year insurance payments including settlements related to Pathmark that had been delayed during transition of the acquisition.
Net Cash Used in Investing Activities
Net cash used in investing activities decreased by $36.9 million during fiscal 2010 when compared to fiscal 2009. The decrease in cash used in investing activities is primarily due to $15.3 million decrease in property expenditures, $20.8 million increase in proceeds from the sale of property and $6.4 million in proceeds from flood insurance. The decrease is partially offset by the respective absences of $5.6 million in proceeds from maturities of marketable securities that were received during fiscal 2009. During fiscal 2010, property expenditures totaled $71.1 million, which relates to one off-site replacement and one remodel, as compared to $86.4 million during fiscal 2009, reflecting 5 new stores, 6 remodels and 4 store conversions.
Net cash used in investing activities decreased by $1.6 million from fiscal 2008 to fiscal 2009, primarily due to a $29.6 million decrease in property expenditures and $5.9 million received during fiscal 2009 from the sale of a joint venture, partially offset by a $26.0 million decrease in proceeds from disposal of property and a $6.7 million decrease in proceeds from maturities of marketable securities. During fiscal 2009, property expenditures totaled $86.4 million, reflecting 5 new stores, 6 remodels and 4 store conversions, as compared to $116.0 million during fiscal 2008, which included 1 new store, 13 remodels, 16 major remodels, 1 major enlargement and 2 store conversions. Our planned capital expenditures for fiscal 2010 are expected to be between $75 million and $100 million and will focus primarily on improving our existing supermarkets.
Net Cash Provided by Financing Activities
Net cash provided by financing activities increased by $25.3 million during fiscal 2010 when compared to fiscal 2009. The increase in cash provided by financing activities is primarily due to $350.0 million in proceeds under our debtor-in-possession financing and $663.4 million in proceeds under our revolving lines of credit (Refer to Debt Obligations discussion below for additional information). In addition, we also received $89.9 million in proceeds from sale-leaseback transactions, which relates to the six properties sold during fiscal 2010. The increase in net cash provided by financing activities was partially offset by an increase in principal payments of $558.0 million on our revolving lines, the respective absences of the proceeds from issuance of long-term debt of $253.2 million and proceeds from the issuance of preferred stock of $175.0 million during fiscal 2009. Also partially offsetting the increase in net cash provided by financing activities were decreased book overdrafts of $36.7 million.
Net cash provided by financing activities increased $41.4 million from fiscal 2008 to fiscal 2009, primarily due to $253.2 million in proceeds from the issuance of long-term debt and $175.0 million from the issuance of preferred stock in fiscal 2009 (Refer to Debt Obligations discussion below for additional information), as well as the absence of the fiscal 2008 payment of $45.7 million upon our settlement of the Series A warrants. The increase in net cash provided by financing activities was partially offset by net principal payments of $360.8 million on our revolving lines of credit, primarily attributable to using a portion of the proceeds from the fiscal 2009 issuances of long-term debt and preferred stock to repay some of the outstanding borrowings, and payments of $27.6 million relating to the associated deferred financing costs. Also partially offsetting the increase in net cash provided by financing activities were decreased book overdrafts of $24.8 million, and the absence of the fiscal 2008 proceeds from a promissory note of $10.0 million.
Working Capital
At February 26, 2011, we had working capital of $698.0 million, excluding liabilities considered subject to compromise. Considering working capital type items classified as "Liabilities subject to compromise" on our Consolidated Balance Sheets, we had working capital of $177.9 million at February 26, 2011 compared to working capital of $210.9 million at February 27, 2010. We had cash and cash equivalents aggregating $352.6 million at February 26, 2011 compared to $252.4 million at February 27, 2010 primarily due to proceeds from the $350.0 million term loan under the DIP Credit Agreement, partially offset by the repayment of our Credit Agreement with a balance of $140.5 million. The decrease in working capital after considering the impact of "Liabilities subject to compromise" on our Consolidated Balance Sheets was attributable primarily to the following:
|
·
|
A decline in inventories primarily related to lower sales volume and a reduced number of open locations; and
|
|
·
|
An increase in accounts payable and other accruals, largely attributed to amounts stayed in bankruptcy.
|
Partially offset by the following:
|
·
|
A decrease in accrued salaries, wages and benefits primarily attributable to payments made for benefits to administrative employees for benefits that were not renewed in fiscal 2010; and
|
|
·
|
An increase in receivables, primarily related to slower collections from vendors.
|
Debt Obligations
Our debt obligations consisted of the following (in thousands):
|
At
|
At
|
|||||||
|
Feb. 26, 2011
|
Feb. 27, 2010
|
|||||||
|
Debtor-in-Possession Credit Agreement, due June 14, 2012
|
$ | 350,000 | $ | - | ||||
|
Related Party Promissory Note, due August 18, 2011
|
10,000 | 10,000 | ||||||
|
5.125% Convertible Senior Notes, due June 15, 2011 (1)
|
165,000 | 155,333 | ||||||
|
9.125% Senior Notes, due December 15, 2011 (1)
|
12,840 | 12,840 | ||||||
|
6.750% Convertible Senior Notes, due December 15, 2012 (1)
|
255,000 | 223,838 | ||||||
|
11.375% Senior Secured Notes, due August 4, 2015
|
260,000 | 253,668 | ||||||
|
9.375% Notes, due August 1, 2039 (1)
|
200,000 | 200,000 | ||||||
|
Borrowings under Credit Agreement
|
- | 132,900 | ||||||
|
Other
|
2,544 | 1,971 | ||||||
| 1,255,384 | 990,550 | |||||||
|
Less current portion of long-term debt – subject to compromise
|
(159 | ) | (191 | ) | ||||
|
Less long-term debt - subject to compromise
|
(905,225 | ) | - | |||||
|
Long-term debt
|
$ | 350,000 | $ | 990,359 | ||||
|
(1)
|
Represents public debt obligations.
|
Debtor-in-Possession Credit Agreement
On December 12, 2010, our Company and all of its U.S. subsidiaries (the “Debtors”) filed voluntary petitions for relief (the “Bankruptcy Filing”) under chapter 11 of title 11 of the United States Bankruptcy Code (the “Bankruptcy Code”) in the United States Bankruptcy Court for the Southern District of New York in White Plains (the “Bankruptcy Court”), case number 10-24549. Management's decision to make the Bankruptcy Filing was in response to, among other things, our Company’s deteriorating liquidity and management's conclusion in the third quarter that the challenges of successfully implementing additional financing initiatives and of obtaining necessary cost concessions from our Company’s business and labor partners, was negatively impacting our Company’s ability to implement its previously announced turnaround strategy. The Debtors will continue to operate their businesses in the ordinary course of business as “debtors-in-possession” under the jurisdiction of the Bankruptcy Court and in accordance with the applicable provisions of the Bankruptcy Code and the orders of the Bankruptcy Court. Our Company’s non-U.S. subsidiaries were not part of the Bankruptcy Filing and will continue to operate in the ordinary course of business.
In connection with the Bankruptcy Filing, on December 13, 2010, the Bankruptcy Court entered its interim financing order, among other things, permitting the Debtors to enter into a Superpriority Debtor-in-Possession Credit Agreement (as amended and restated by that certain Amended and Restated Superpriority Debtor-in-Possession Credit Agreement dated as of December 21, 2010 and further amended by that certain First Amendment thereto dated January 10, 2011, the “DIP Credit Agreement”) with JPMorgan Chase Bank, N.A., as administrative agent and as collateral agent (in such capacity, the “Agent”), the lenders from time to time party thereto (collectively, the “DIP Lenders”) and our Company and certain subsidiaries as borrowers thereunder. On December 14, 2010, the Debtors satisfied all of the conditions to the effectiveness of the DIP Credit Agreement and consummated the transactions contemplated thereunder including the refinancing in full of our Company’s and its applicable subsidiaries’ obligations under the pre-existing first lien credit facility evidenced by the Credit Agreement (refer to Note 9 to our Consolidated Financial Statements – Indebtedness and Other Financial Liabilities). Pursuant to the terms of the DIP Credit Agreement:
|
·
|
the DIP Lenders agreed to lend up to $800.0 million in the form of a $350.0 million term loan and a $450.0 million revolving credit facility with a $250.0 million sublimit for letters of credit, in each case subject to the terms and conditions therein;
|
|
·
|
our Company’s and the Subsidiary Borrower’s obligations under the DIP Credit Agreement and the other specified loan documents are guaranteed by our Company’s certain other subsidiaries that are Debtors (“Subsidiary Guarantors” and, together with our Company and the Subsidiary Borrowers, the “Loan Parties”); and
|
|
·
|
the Loan Parties’ obligations under the DIP Credit Agreement and such other specified loan documents are secured by a security interest in, and lien upon, substantially all of the Loan Parties’ existing and after-acquired personal and real property, having the priority and subject to the terms therein and in the order(s) entered into by the Bankruptcy Court, as applicable.
|
Our Company will have the option to have interest on the revolving loans under the revolving credit facility provided under the DIP Credit Agreement accrue at an alternate base rate plus 200 basis points or at adjusted LIBOR plus 300 basis points. Our Company will have the option to have interest on the term loan provided under the DIP Credit Agreement accrue at an alternate base rate plus 600 basis points or at adjusted LIBOR (with a floor of 175 basis points) plus 700 basis points. The DIP Credit Agreement limits, among other things, our Company’s and the other Loan Parties’ ability to (i) incur indebtedness, (ii) incur or create liens, (iii) dispose of assets, (iv) prepay certain indebtedness and make other restricted payments, (v) enter into sale and leaseback transactions and (vi) modify the terms of certain indebtedness and certain material contracts.
The DIP Credit Agreement also contains certain financial covenants, including a minimum excess availability covenant of $100.0 million, minimum liquidity covenant of $100.0 million and minimum cumulative EBITDA covenant as defined in the DIP Credit Agreement. Minimum cumulative EBITDA measured beginning on April 24, 2011 is as follows (in millions):
|
Date
|
Minimum Cumulative EBITDA
|
|
August 13, 2011
|
$ -
|
|
September 10, 2011
|
10.0
|
|
October 8, 2011
|
20.0
|
|
November 5, 2011
|
35.0
|
|
December 3, 2011
|
50.0
|
|
December 31, 2011
|
65.0
|
|
January 28, 2012
|
90.0
|
|
February 25, 2012
|
100.0
|
|
March 24, 2012
|
110.0
|
|
April 21, 2012
|
125.0
|
|
May 19, 2012
|
150.0
|
|
June 16, 2012
|
175.0
|
We are currently in compliance with all covenants. Meeting our EBITDA covenant requires increasing levels of performance throughout the year. Achieving this improving performance will require our Company to successfully implement our business improvement initiatives beginning as early as June 2011 with the benefits reflected in our results shortly thereafter. The DIP Credit Agreement matures upon the earliest to occur of (a) June 14, 2012, (b) the acceleration of the loans and the termination of the commitment thereunder, and (c) the substantial consummation (as defined in Section 1101(2) of the Bankruptcy Code, which for purposes hereof shall be no later than the effective date thereof) of a plan of reorganization that is confirmed pursuant to an order entered by the Bankruptcy Court. The Bankruptcy Court entered a final order approving the DIP Credit Agreement on January 11, 2011.
The Bankruptcy Filing constituted an event of default with respect to the debt obligations described within Note 9 to our Consolidated Financial Statements – Indebtedness and Other Financial Liabilities.
We are currently operating pursuant to Bankruptcy Filing and continuation of our Company as a going-concern is contingent upon, among other things, the Debtors’ ability (i) to comply with the terms and conditions of the DIP Credit Agreement described in Note 9 to our Consolidated Financial Statements – Indebtedness and Other Financial Liabilities; (ii) to develop a plan of reorganization and obtain confirmation under the Bankruptcy Code; (iii) to reduce debt and other liabilities through the bankruptcy process; (iv) to return to profitability, including necessary near-term cost concessions from our business and labor partners beginning as early as June 2011 with the benefits reflected in our results shortly thereafter; (v) to generate sufficient cash flow from operations; and (vi) to obtain financing sources to meet our future obligations. The uncertainty regarding these matters raises substantial doubt about our ability to continue as a going concern.
After our Company’s Bankruptcy Filing on December 12, 2010, we repaid our $655.0 million Credit Agreement with a balance of $140.5 million with the proceeds from the $350.0 million term loan under the DIP Credit Agreement. As of February 26, 2011, we held excess cash not utilized in our store operations of $257.4 million. At January 10, 2011, we received court approval to draw down on the $450.0 million revolver which provided, after adjusting for letters of credit and borrowing base collateral requirements, an additional $184.3 million of availability as of February 26, 2011. The $184.3 million of availability is further subject to a current minimum availability covenant of $100.0 million. Based on our investable excess cash balance and this additional availability, we believe we have enough cash to operate for the next 12 months.
Redeemable Preferred Stock
On August 4, 2009, our Company issued 60,000 shares of 8.0% Cumulative Convertible Preferred Stock, Series A-T, without par value, to affiliates of Tengelmann Warenhandelsgesellschaft KG (“Tengelmann”) and 115,000 shares of 8.0% Cumulative Convertible Preferred Stock, Series A-Y, without par value, to affiliates of Yucaipa Companies LLC (“Yucaipa”), together referred to as the “Preferred Stock,” for approximately $162.8 million, after deducting approximately $12.2 million in closing and issuance costs. Each share of the Preferred Stock has an initial liquidation preference of one thousand dollars, subject to adjustment.
The Preferred Stock is convertible into shares of our Company’s common stock, par value $1.00 per share (the “Common Stock”), at an initial conversion price of $5.00 per share of Common Stock. The Preferred Stock was convertible upon the one-year anniversary of the issuance of Preferred Stock, or August 5, 2010, provided that prior to receiving shareholder approval, the Preferred Stock was not exercisable into greater than 19.99% of the Common Stock outstanding prior to the issuance of the Preferred Stock. The 57,750 shares that were originally convertible without shareholder approval were recorded within temporary stockholders’ equity upon issuance since the shares are (i) redeemable at the option of the holder and (ii) have conditions for redemption which are not solely within the control of the Company. The 117,250 shares that originally required shareholder approval in order to become convertible were initially recorded as a “Preferred stock liability”. On December 15, 2009, we obtained shareholder approval authorizing the convertibility of the shares originally recorded within “Preferred stock liability”, and reclassified $109.5 million to temporary equity, representing the book value of the liability on December 15, 2009 net of the related debt issuance costs. As of February 26, 2011, the entire Preferred Stock issuance was recorded within temporary stockholders’ equity.
The holders of our Convertible Preferred Stock have the right to cast votes together with the holders of our common stock on an as-converted basis. Our Company is required to redeem all of the outstanding Preferred Stock on August 1, 2016 (the “Maturity Date”), at 100.0% of the liquidation preference, plus all accrued and unpaid dividends. Subject to the repurchase rights of the investors, the Preferred Stock is not redeemable prior to the Maturity Date. At any time after December 3, 2012, in the event of any fundamental change, the investors may elect to require our Company to repurchase the Preferred Stock in cash at 101.0% of the liquidation preference amount plus any accrued and unpaid dividends.
The holders of the Preferred Stock are entitled under a pre-bankruptcy agreement to an 8.0% dividend, payable quarterly in arrears in cash or in additional shares of Preferred Stock if our Company does not meet the liquidity levels required to pay the dividends. However, all dividends have been stayed during the pendency of the bankruptcy case. Dividends and deferred financing fees amortization relating to preferred stock that was classified as a liability prior to receiving shareholder approval, were recorded within “Interest expense.”
During fiscal 2010, we accrued Preferred Stock dividends of $11.5 million within “Additional paid-in capital,” and paid Preferred Stock dividends of $10.5 million. On November 24, 2010 our Company’s Board of Directors authorized a payment-in-kind (“PIK”) dividend on our Redeemable Preferred Stock, payable on December 15, 2010 to holders of record on November 15, 2010 (“Record Date”). Dividends are required to be PIK in the event our Company does not have the ability to pay the dividends in cash. As of the Record Date, we did not have the ability to pay the dividends in cash. The calculation of PIK dividends on our Redeemable Preferred Stock is based upon the rate defined by the original terms of the Redeemable Preferred Stock at 9.5% per annum. The PIK dividends of approximately $4.0 million are included in Redeemable Preferred Stock on the Consolidated Balance Sheets. The PIK dividend due on December 15, 2010 was never made by our Company due to the Bankruptcy Filing.
During fiscal 2009, we accrued Preferred Stock dividends of $8.1 million, of which $3.5 million was recorded within “Interest expense” and the remaining $4.6 million was recorded within “Additional paid-in capital,” and paid Preferred Stock dividends of $5.1 million.
As a result of Shareholder authorization, during fiscal 2010, we recorded $2.0 million of deferred financing fees amortization within “Additional paid-in capital”. Prior to this Shareholder authorization, during fiscal 2009, we recorded $1.0 million of deferred financing fees amortization, of which $0.4 million was recorded within “Interest expense” and the remaining $0.6 million was recorded within “Additional paid-in capital”.
Share Lending Agreements
We had share lending agreements with certain financial institutions, pursuant to which we loaned 8,134,002 shares of our stock of which 6,300,752 shares were sold to the public on December 18, 2007 in a public offering to facilitate hedging transactions relating to the issuance of our 5.125% and 6.750% Senior Convertible Notes. We did not receive any proceeds from the sale of the borrowed shares. We received a nominal lending fee from the financial institutions pursuant to the share lending agreements. Any shares we loan are considered issued and outstanding. Investors that purchase borrowed shares are entitled to the same voting and dividend rights as any other holders of our common stock; however, the financial institutions do not have rights pursuant to the share lending agreements. During fiscal 2010 and fiscal 2009, Bank of America, N.A., who was a party to our share lending agreement, returned 2,427,944 and 2,500,000 shares, respectively. As of February 26, 2011, there were no shares outstanding under our share lending agreement with Bank of America, N.A.
On September 15, 2008, Lehman and certain of its subsidiaries, including Lehman Europe, filed a petition under Chapter 11 of the U.S. Bankruptcy Code with the United States Bankruptcy Court and/or commenced equivalent proceedings in jurisdictions outside of the United States (collectively, the “Lehman Bankruptcy”). Lehman Europe is party to a 3,206,058 share lending agreement with our Company. Due to the circumstances of the Lehman Bankruptcy, we have recorded these loaned shares as issued and outstanding effective September 15, 2008, for purposes of computing and reporting our Company’s basic and diluted weighted average shares and earnings per share.
Summary of Contractual Obligations and Commitments:
As of February 26, 2011, we had the following contractual obligations and commitments which are based on the contractual payment dates and have not been adjusted as a result of the Bankruptcy filing:
|
Payments Due by Period (in millions)
|
||||||||||||||||||||
|
Contractual
|
Less than
|
|||||||||||||||||||
|
Obligations
|
Total
|
1 Year
|
1 – 3 Years
|
4 – 5 Years
|
Thereafter
|
|||||||||||||||
|
Debtor-in-Possession Term Loan (1)
|
$
|
350.0
|
$
|
-
|
$
|
350.0
|
$
|
-
|
$
|
-
|
||||||||||
|
Other Debt (2)
|
905.5
|
188.2
|
255.6
|
260.7
|
201.0
|
|||||||||||||||
|
Capital Leases (3)
|
193.3
|
24.0
|
42.7
|
35.4
|
91.2
|
|||||||||||||||
|
Operating Leases (3)
|
1,428.3
|
180.8
|
336.6
|
283.4
|
627.5
|
|||||||||||||||
|
Long-term Real Estate Liabilities (3)
|
618.5
|
41.1
|
82.8
|
86.2
|
408.4
|
|||||||||||||||
|
Pension Obligations (4)
|
185.5
|
7.2
|
14.1
|
14.4
|
149.8
|
|||||||||||||||
|
Postretirement Obligations (5)
|
99.4
|
2.1
|
4.7
|
5.3
|
87.3
|
|||||||||||||||
|
Occupancy Payments (6)
|
137.2
|
18.0
|
36.9
|
29.8
|
52.5
|
|||||||||||||||
|
Severance Payments (7)
|
8.6
|
8.1
|
0.5
|
-
|
-
|
|||||||||||||||
|
Pension Withdrawal Payments (8)
|
139.0
|
13.2
|
37.2
|
20.0
|
68.6
|
|||||||||||||||
|
Interest (9)
|
738.4
|
100.0
|
119.8
|
79.5
|
439.1
|
|||||||||||||||
|
Postemployment Obligations (10)
|
11.2
|
3.4
|
2.3
|
1.5
|
4.0
|
|||||||||||||||
|
Defined Contribution Plans (11)
|
0.5
|
0.5
|
-
|
-
|
-
|
|||||||||||||||
|
Multi-employer Pension Plans (11)
|
56.6
|
56.6
|
-
|
-
|
-
|
|||||||||||||||
|
Purchase Commitments (12)
|
||||||||||||||||||||
|
Equipment Purchases
|
8.8
|
8.8
|
-
|
-
|
-
|
|||||||||||||||
|
Equipment Rentals
|
0.4
|
0.1
|
0.3
|
-
|
-
|
|||||||||||||||
|
Suppliers
|
789.5
|
468.8
|
93.5
|
97.0
|
130.2
|
|||||||||||||||
|
Manufacturers/Vendors
|
47.5
|
8.7
|
13.1
|
11.8
|
13.9
|
|||||||||||||||
|
Service Contracts
|
47.0
|
32.7
|
14.3
|
-
|
-
|
|||||||||||||||
|
Marketing Contracts
|
66.6
|
66.5
|
0.1
|
-
|
-
|
|||||||||||||||
|
Consulting
|
3.6
|
3.6
|
-
|
-
|
-
|
|||||||||||||||
|
Total (13)
|
$
|
5,835.4
|
$
|
1,232.4
|
$
|
1,404.5
|
$
|
925.0
|
$
|
2,273.5
|
||||||||||
|
(1)
|
Refer to Note 9 to our Consolidated Financial Statements – Indebtedness and Other Financial Liabilities for information regarding debtor-in-possession term loan. We expect to settle the debtor-in-possession term loan by several methods, including cash flows from operations.
|
|
(2)
|
Amounts represent contractual amounts due and do not reflect current balance sheet classification as a result of the Bankruptcy Filing. Refer to Note 9 to our Consolidated Financial Statements – Indebtedness and Other Financial Liabilities for information regarding long-term debt. We expect to settle such long-term debt by several methods, including cash flows from operations.
|
|
(3)
|
Amounts represent contractual amounts due and do not reflect current balance sheet classification as a result of the Bankruptcy Filing. Refer to Note 11 to our Consolidated Financial Statements - Lease Obligations for information regarding capital leases, operating leases and long-term real estate liabilities.
|
|
(4)
|
Amounts represent expected future cash contributions to our non-qualified defined benefit pension plans and do not reflect current balance sheet classification as a result of the Bankruptcy Filing. Refer to Note 13 to our Consolidated Financial Statements – Retirement Plans and Benefits for information regarding our defined benefit pension plans.
|
|
(5)
|
Amounts represent future benefit payments that were actuarially determined for our postretirement benefit obligation and do not reflect current balance sheet classification as a result of the Bankruptcy Filing. Refer to Note 13 to our Consolidated Financial Statements – Retirement Plans and Benefits for information regarding our postretirement benefits.
|
|
(6)
|
Amounts represent our future occupancy payments primarily relating to our asset disposition initiatives (refer to Note 6 to our Consolidated Financial Statements), discontinued operations (refer to Note 5 to our Consolidated Financial Statements) and store closures made during the normal course of business and do not reflect current balance sheet classification as a result of the Bankruptcy Filing.
|
|
(7)
|
Amounts primarily represent our severance obligations primarily resulting from store closures and do not reflect current balance sheet classification as a result of the Bankruptcy Filing.
|
|
(8)
|
Amount represents our pension withdrawal payments from multiemployer plans and do not reflect current balance sheet classification as a result of the Bankruptcy Filing.
|
|
(9)
|
Amounts represent contractual amounts due and do not reflect current balance sheet classification as a result of the Bankruptcy Filing. Refer to Note 9 to our Consolidated Financial Statements for information regarding our interest payments. Note that amounts presented exclude estimates on current and future variable interest rate payments as these amounts cannot be estimated as of the balance sheet date due to the variability in our expected borrowings. Included within these amounts are interest rate payments for the debtor-in-possession term loan based upon a LIBOR floor.
|
|
(10)
|
Amounts represent our future benefit payments that were actuarially determined for our short and long term disability programs and do not reflect current balance sheet classification as a result of the Bankruptcy Filing. Refer to Note 13 to our Consolidated Financial Statements – Retirement Plans and Benefits for information regarding our postemployment obligations.
|
|
(11)
|
Amounts represent our best estimate of our immediate funding requirements of defined contribution and multiemployer plans in which we participate and do not reflect current balance sheet classification as a result of the Bankruptcy Filing. Defined contribution plan requirement primarily relates to our Company’s 4% employer pension contribution relating to calendar 2010 which will be paid in fiscal 2011. Refer to Note 13 to our Consolidated Financial Statements – Retirement Plans and Benefits for information regarding these obligations.
|
|
(12)
|
The purchase commitments include agreements to purchase goods or services that are enforceable and legally binding and that specify all significant terms, including open purchase orders. We expect to fund these commitments with cash flows from operations.
|
|
(13)
|
The above table detailing our contractual obligations excludes our FIN 48 liability relating to our uncertain tax positions due to the fact that it will be settled with our net operating loss carryforwards and will not require the use of cash. As of February 26, 2011, we had gross unrecognized tax benefits of $0.6 million. We currently do not expect that this amount will significantly change in the next 12 months.
|
We have not repurchased any of our common stock and our Company’s policy is to not pay dividends on common stock. As such, we have not made dividend payments in the previous four years. Additionally, the terms of our DIP Credit Agreement restrict the Company’s ability to pay cash dividends on common shares. Holders of our Preferred Stock were entitled to dividend payments; however, all dividends are stayed during the bankruptcy period.
CRITICAL ACCOUNTING ESTIMATES
Critical accounting estimates are those accounting estimates that we believe are important to the portrayal of our financial condition and results of operations and require our most difficult, subjective or complex judgments, often as a result of the need to make estimates about the effect of matters that are inherently uncertain.
The preparation of financial statements in conformity with accounting principles generally accepted in the United States of America (“U.S. GAAP”) requires us to make estimates and assumptions that affect the reported amounts of assets and liabilities and disclosures of contingent assets and liabilities at the date of the financial statements, and the reported amounts of revenues and expenses during the reporting period. Actual results could differ from those estimates.
Self-Insurance Reserves
Our Consolidated Balance Sheets include liabilities with respect to self-insured workers’ compensation and general liability claims. We estimate the required liability of such claims on a discounted basis, utilizing an actuarial method, which is based upon various assumptions, which include, but are not limited to, our historical loss experience, projected loss development factors, actual payroll, legal costs and other data. Legal expenses incurred in connection with workers’ compensation and general liability claims are charged to the specific claim to which costs pertain. The required liability is also subject to adjustment in the future based upon the changes in claims experience, including changes in the number of incidents (frequency) and changes in the ultimate cost per incident (severity). The total liability for self-insurance reserves recorded at February 26, 2011 and February 27, 2010 was $414.7 million and $292.2 million, respectively. Of this amount, approximately $14.5 million is not classified as Liabilities subject to compromise, as approximately $11.8 million is considered to have arisen subsequent to the Bankruptcy Filing and approximately $2.7 million is an obligation of a non-Debtor entity. Of the $14.5 million obligation that was incurred subsequent to the Bankruptcy Filing and is not classified as Liabilities subject to compromise on our Consolidated Balance Sheets, $2.3 million is estimated to be paid within the next 12 months and the remaining $12.2 million is considered noncurrent. The discount rate used at February 26, 2011 and February 27, 2010 was 4.0%, and was based on the timing of the projected cash flows of future payments to be made for claims. A 1% increase in the discount rate would decrease the required liability by approximately $19.2 million and $9.3 million as of February 26, 2011 and February 27, 2010, respectively. Conversely, a 1% decrease in the discount rate would increase the required liability for the same periods by approximately $21.8 million and $10.3 million, respectively.
During fiscal 2010, our worker’s compensation and general liability reserves increased by approximately $122.5 million ($97.6 million for continuing operations and $24.9 million for discontinued operations). Approximately $76.0 million is due to negative development, including the evolving impact of changes in legislation, a change in the estimated ultimate losses related to the New York area permanent partial disability claims and the continued shift in the mix of open claims to the New York area from less costly geographic areas. In addition, certain actuarial assumptions were updated to reflect these changing development factors. Approximately $37.2 million of the increase is related to our estimate of workers compensation state assessments, which are funds provided to the states to support state insurance regulatory bodies. These estimates are determined by actuarial projections of losses. During fiscal 2009, our worker’s compensation and general liability reserves increased by approximately $60.8 million ($47.8 million for continuing operations and $13.0 million for discontinued operations), primarily due to a change in estimate of approximately $45.6 million related to the negative development of prior year claims and the change in the mix of claims between our continuing and discontinued operations, and the related state assessment for such claims of approximately $5.6 million. These estimates are determined by actuarial projections of losses. During fiscal 2008, the increase in our worker’s compensation and general liability reserves was primarily related to a $24.7 million adjustment for Pathmark’s opening balance sheet liabilities for self-insurance reserves based on information we obtained regarding facts and circumstances that existed as of the acquisition date that, if known, would have affected the measurement of the amounts recognized on that date, partially offset by payments made during fiscal 2008. There have been no other significant adjustments to our estimate and while we expect the estimates may change in the future due to the reasons previously stated, we believe our current liability is adequate.
Long-Lived Assets and Finite-Lived Intangibles
We review the carrying values of our long-lived assets and finite-lived intangible assets for possible impairment whenever events or changes in circumstances indicate that the carrying amount of assets may not be recoverable. Such review is primarily based upon groups of assets and the undiscounted estimated future cash flows from such assets over the life of the primary asset within the asset group. If such review indicates impairment, we estimate the fair value of the assets within the group based on a variety of methods; including estimating market rents as a percentage of sales to value lease contracts and observation of market values based on third party information for land and buildings. We measure such impairment of long-lived assets as the difference between the carrying value and the fair value of the assets.
Impairments due to closure or conversion in the normal course of business
During fiscal 2010, fiscal 2009 and fiscal 2008, we reported impairments due to store closures or conversions in the normal course of business of $7.2 million, $6.5 million and $14.1 million, respectively. These charges were recorded within “Store Operating, general and administrative expense” in our Consolidated Statements of Operations. An additional $0.5 million of impairment was incurred during fiscal 2010 and recorded within “discontinued operations” in our Consolidated Statements of Operations.
Impairments due to store closures
Included within “Goodwill, trademark and long-lived asset impairment” in our Consolidated Statements of Operations for fiscal 2010, in August 2010, our Company announced a plan to close 25 stores in five states as we began the implementation and execution phase of our comprehensive turnaround. The affected stores include locations in close proximity to other Company stores, those facing real estate and cost issues, and underperforming non-core stores. These store closures were completed by October 15, 2010. In February 2011, our company filed a motion seeking approval to close 32 stores in six states as we continue to fully implement our comprehensive financial and operational restructuring. These store closures were completed by April 16, 2011. As a result, we recorded a total impairment charge for closed stores of $56.2 million during fiscal 2010.
Impairments due to unrecoverable assets
During fiscal 2010, as a result of experiencing increasing cash flow losses within certain asset groupings, we determined that triggering events occurred that required us to test the related asset groups’ long-lived assets for potential impairment. We estimated the future cash flows for these asset groups based on an internal analysis performed by management. The carrying value was not recoverable from their undiscounted future cash flows. We determined the fair value of these assets and, as a result, we recorded an impairment charge for these asset groups’ long-lived assets, primarily consisting of favorable leases and other owned property of $45.3 million, $44.4 million of which related to Pathmark and $0.9 million of which related to our SuperFresh reporting unit. These charges were recorded within “Goodwill, trademark and long-lived asset impairment” in our Consolidated Statements of Operations for fiscal 2010.
We believe that our estimates are appropriate based upon the current assumptions. The effects of changes in estimates of useful lives were not material to ongoing depreciation and amortization expense. We will continue to monitor our operating results in future periods to determine whether additional impairment testing is warranted for any of our asset groups experiencing operating losses. If current operating levels do not improve, we may have to record impairments of long-lived assets in the future.
Goodwill and Other Indefinite-Lived Intangible Assets
We test goodwill and other indefinite-lived intangibles for impairment in the fourth quarter of each fiscal year, unless events or changes in circumstances indicate that impairment may have occurred in an interim period. A significant amount of judgment is involved in determining if an indicator of impairment has occurred. Possible indicators of impairment include, but are not limited to: sustained operating losses or poor operating performance trends, a significant decline in our expected future cash flows for a reporting unit, a decrease in our market capitalization below our book value for a sustained period of time, and an expectation that a reporting unit will be disposed of or sold.
A two-step impairment test is performed for goodwill. The first step of the impairment analysis is performed by comparing the estimated fair value of each reporting unit to the related carrying value. We have seven reporting units, five of which have goodwill and are assessed for impairment: A&P, Waldbaum’s and SuperFresh, which comprise our Fresh reportable segment; Gourmet; and Discount and Wine, Beer & Sprits, which comprise our Other reportable Segment. In determining fair value, we make various assumptions, including our expectations of future cash flows based on projections or forecasts derived from its analysis of business prospects, economic or market trends and any regulatory changes that may occur. We estimate the fair value of the reporting unit using a net present value methodology, which is dependent on significant assumptions related to estimated future discounted cash flows, discount rates and tax rates. Our assumptions for our annual impairment included a decline in revenue of approximately 6% in fiscal 2011, an increase of approximately 1% in fiscal 2012, remaining flat in years thereafter and the impact of closures of certain unprofitable stores. Assumptions also include an estimate for business improvement initiatives for restructuring-related activities in excess of $200 million upon emerging from bankruptcy and a perpetual growth rate for cash flow in the terminal year of approximately 1.5%. We assumed a market-based weighted average cost of capital of 11.0% to discount cash flows and a blended federal and state tax rate of 42.0%. We determined that our fair value exceeded our carrying value in our reporting units with goodwill.
We determined that the fair values of each of the reporting units comprising our Fresh and Gourmet reportable segments, as well as our Discount reporting unit, exceeded the related carrying values, inclusive of goodwill of $92.3 million, $12.1 million, and $4.1 million, respectively, by over 100%. The fair value of our Wine, Beer & Spirits reporting unit exceeded its carrying value, inclusive of $1.8 million of goodwill, in excess of 40%. Thus, a significant decrease in fair value would be required before the goodwill balance at these reporting units would have a carrying value in excess of the fair value. There is significant risk of future impairment if restructuring related activities are not achieved.
Our only other indefinite-lived intangible asset is the Pathmark trademark. Impairment loss is recognized when the estimated fair value of the indefinite-lived intangible asset is less than its carrying value. We evaluated the fair value of the Pathmark trademark using the relief-from-royalty method with assumptions consistent with those used to fair value goodwill.
During the third quarter of fiscal 2010, based on the lower revenues within our Pathmark reporting unit coupled with lower near term profitability projections and lower estimated market royalty rate expectations due to current general economic conditions, we concluded that a triggering event had occurred for an interim impairment test. The carrying value exceeded the indicated fair value of the Pathmark trademark, resulting in an impairment charge of $12.7 million during the third quarter of fiscal 2010. During the fourth quarter of fiscal 2010, we completed our annual impairment test of our Pathmark trademark and concluded there was no Pathmark trademark impairment during the fourth quarter of fiscal 2010. Our estimates assumed a decline in revenues of approximately 6% in fiscal 2011 and an increase of 1% in fiscal 2012, respectively, with revenues remaining flat for fiscal years thereafter, and an annual pre-tax royalty savings rate of 20 basis points. We currently estimate that the fair value of our trademark decreases by approximately $14.0 million for each 5 basis point decrease in the market royalty rate and by approximately $7.0 million for each 10% decline in revenue from our current projections. We believe that our estimates are appropriate based upon our current assumptions. However, we may be required to record impairment charges in future periods if our revenues differ from our current projections.
Closed Store and Closed Warehouse Reserves
For closed stores and warehouses that are under long-term leases, we adjust the charges originally accrued for these events for (i) interest accretion, (ii) settlements on leases or sold properties, and (iii) changes in estimates in future sublease rental assumptions. Net adjustments, all of which have been disclosed in the Notes to the Consolidated Financial Statements, for changes have been cumulatively approximately 7% from the date of inception. Total adjustments for settlements on leases or sold properties and changes in estimates resulted in expenses of $63.1 million for continuing operations and $13.5 million for discontinued operations in fiscal 2010 due to significant declines in values in the real estate market resulting from deepening economic recession; expenses of $36.5 million for continuing operations and $62.8 million for discontinued operations in fiscal 2009, and expense of $26.4 million for continuing operations and income of $29.6 million for discontinued operations in fiscal 2008. Adjustments are predominantly due to fluctuations in the real estate market from the time the original charges are incurred until the properties are actually settled. Also, we have rejected 98 of our leases through the bankruptcy process and reduced the reserve balance associated with these leases by $192.7 million, net to the allowable claim for damages of $130.2 million. This adjustment is not included in the above amounts. The remaining closed store reserve balance of $27.0 million relates to locations for which the leases have not been rejected as of fiscal year end.
As of February 26, 2011, we had recorded liabilities for estimated probable obligations of $157.2 million. Of this amount, $41.3 million relates to stores closed in the normal course of business, $36.7 million relates to stores and warehouses closed as part of the asset disposition initiatives (refer to Note 6 to our Consolidated Financial Statements), and $79.2 million relates to stores closed as part of our discontinued operations (refer to Note 5 to our Consolidated Financial Statements).
Due to the long-term nature of the lease commitments, it is possible that current accruals, which are based on estimates of vacancy costs and sublease income, will change in the future as economic conditions change in the real estate market; however, we are unable to estimate the impact of such changes at this time and the existing obligations are our best estimate of these obligations at this time.
Warrant Liability
We issued warrants, which are recorded as liabilities in our financial statements and marked to market each reporting period using the Black-Scholes option pricing model. The value of these liabilities change as a result of changes in our stock price, volatility, the remaining time until maturity, and the current risk-free interest rate.
Pension and Other Benefit Plans
The determination of our obligation and expense for pension and other postretirement benefits is dependent, in part, on our selection of certain assumptions used by our actuaries in calculating these amounts. These assumptions include the weighted average discount rate at which obligations can be effectively settled, the anticipated rate of future increases in compensation levels, the expected long-term rate of return on plan assets, increases or trends in health care cost, and certain employee related factors, such as turnover, retirement age and mortality.
The discount rate is determined by taking into account the actual pattern of maturity of the benefit obligations. To generate the year-end discount rate, a single rate is developed using a yield curve which is derived from multiple high quality corporate bonds, discounting each future year’s projected cash flow, and determining the equivalent single discount rate. We use independent actuaries to assist us in determining the discount rate assumption and measuring our plans’ obligations.
The rate of compensation increase is determined based upon a scale of merit and promotional increases according to duration plus an economic increase per year.
The expected long-term rate of return for the plan was determined by weighing the expected returns for each asset class by the assets allocated to that class. The expected return for each asset class was based on our actuaries’ capital market assumptions for real returns on standard asset classes and a long-term annual inflation rate of 2.0%. We use independent actuaries to assist us in determining our long-term rate of return assumptions. For fiscal 2010, fiscal 2009 and fiscal 2008, we assumed return rates of 7.50%, 7.50% and 6.75%, respectively. Given the target asset allocation of 40-60% equities, 30-40% fixed income and 5-25% other, we consider the assumed return rates to be reasonable estimates of average expected long-term investment returns over the life of the plan. We will continue to examine our portfolio allocations to increase the likelihood of achieving our expected rate of return.
We believe that our current assumptions used to estimate plan obligations and annual expense are appropriate in the current economic environment. However, if economic conditions change, we may need to change some of our assumptions, and the resulting changes may materially affect our pension and other postretirement obligations in the Consolidated Balance Sheets and our future expense in the Consolidated Statements of Operations. Actual results that differ from our Company’s assumptions are accumulated and amortized over future periods into the Consolidated Statements of Operations.
The weighted average discount rate, the weighted average rate of compensation increase and the expected long-term rate of return on plan assets used in our determination of our pension expense are as follows:
|
Fiscal
2010
|
Fiscal
2009
|
Fiscal
2008
|
|||
|
Weighted average discount rate
|
6.25%
|
7.25%
|
5.75%
|
||
|
Weighted average rate of compensation increase
|
3.00%
|
3.00%
|
2.75%
|
||
|
Expected long-term rate of return on plan assets
|
7.50%
|
7.50%
|
6.75%
|
To determine our pension benefit obligation as of February 26, 2011, we used a weighted average discount rate of 5.75% and a weighted average rate of compensation increase of 3.00%.
The following illustrates the annual impact on pension expense of a 100 basis point increase or decrease from the assumptions used to determine the net cost for the fiscal year ending February 26, 2011 (in millions):
Combined (Decrease)
Weighted Average Expected Return Increase in Pension
Discount Rate on Plan Assets Expense
100 basis point increase ($1,590) ($3,900) ($5,490)
100 basis point decrease 3,790 3,900 7,690
The following illustrates the annual impact on benefit obligation of a 100 basis point increase or decrease from the discount rate used to determine the benefit obligation at February 26, 2011 (in millions):
(Decrease)/Increase
in Pension Benefit
Obligation
100 basis point increase in discount rate ($51,710)
100 basis point decrease in discount rate 62,200
To determine our postretirement benefit obligation at February 26, 2011, we used a weighted average discount rate of 5.50%. The weighted average discount rate used to determine our postretirement expense for fiscal 2009 was 6.00%. The following illustrates the annual impact on the accumulated postretirement benefit obligation (“APBO”) and postretirement benefit expense of a 100 basis point increase or decrease from the healthcare trends used to value them as of and for the year ended February 26, 2011 (in millions):
Increase/(Decrease) Increase/(Decrease)
in expense in APBO
100 basis point increase in healthcare trends $0.2 $2.9
100 basis point decrease in healthcare trends (0.2) (2.5)
Our obligation to fund pension benefits for certain employees of Grocery Haulers, Inc. (“GHI”) who handle transportation and logistics services for our Pathmark stores is accounted for as a contractual obligation at fair value. The discount rate is derived from published zero-coupon AA corporate bond yields. It is determined by considering the actual pattern of maturity of the benefit obligations of approximately fifteen years. We utilized a 5.50% discount rate to value this obligation as of February 26, 2011. Due to their long-term nature, other assumptions used to value this contractual obligation, such as compensation levels, trends in health care costs, and certain related factors, such as turnover, retirement age and mortality, are reevaluated on an annual basis and are consistent with those used to determine the Projected Benefit Obligation for our pension plans. We use independent actuaries to assist us in determining the discount rate assumptions and measuring this obligation.
The sensitivities to changes in the discount rate used to value the GHI contractual obligation as of February 26, 2011 are as follows (in millions):
Increase/(Decrease) (Decrease)/Increase
in expense in GHI Obligation
100 basis point increase in discount rate $0.2 ($9.6)
100 basis point decrease in discount rate (0.3) 11.4
Inventories
We evaluate inventory shrinkage throughout the year based on actual physical counts and record reserves based on the results of these counts to provide for estimated shrinkage between the store’s last inventory and the balance sheet date. Physical inventory counts are taken every period for fresh inventory, approximately twice per fiscal year on a staggered basis for the remaining merchandise inventory in stores, and annually for inventory in distribution centers and for supplies. The average shrinkage rate resulting from the physical inventory counts is applied to the ending inventory balance in each store as of the balance sheet date to provide for estimated shrinkage from the date of the last physical inventory count for that location. Total inventory stock loss reserves amounted to approximately $18.7 million and $18.9 million as of February 26, 2011 and February 27, 2010, respectively. Adjustments to the stock loss reserve based on physical inventories were approximately 0.1% of our ending inventory balance as of February 26, 2011.
Income Taxes
As discussed in Note 17 – Income Taxes to the Consolidated Financial Statements, we record a valuation allowance for the entire U.S. net deferred tax asset since it is more likely than not that the net deferred tax asset would not be utilized based on historical cumulative losses. This valuation allowance could be reversed in future periods if we experience improvement in our U.S. operations.
At February 26, 2011 and February 27, 2010, we had unrecognized tax benefits of $0.6 million and $1.4 million, respectively, that, if recognized would not affect the effective tax rate, as they would be offset by an increase in our valuation allowance. We do not expect that the amount of our gross unrecognized tax positions will change significantly in the next 12 months.
We recognize interest and penalties as incurred within “Benefit from (provision for) income taxes” in our Consolidated Statements of Operations. For tax positions that are more likely than not of being sustained upon audit, we recognize the largest amount of the benefit that is more likely than not of being sustained in our Consolidated Financial Statements. Our Company makes estimates of the potential liability based on our assessment of all potential tax exposures. In addition, we use factors such as applicable tax laws and regulations, current information and past experience with similar issues to make these adjustments.
CAUTIONARY NOTE
This discussion may contain forward-looking statements about the future performance of our Company, and is based on our assumptions and beliefs in light of information currently available. We assume no obligation to update this information. These forward-looking statements are subject to uncertainties and other factors that could cause actual results to differ materially from such statements, including, but not limited to: the ability of the Debtors to continue as going concerns; the ability of the Debtors to obtain Bankruptcy Court approval with respect to motions in the chapter 11 cases; the ability of the Debtors to prosecute, develop and consummate one or more plans of reorganization with respect to the chapter 11 cases; the effects of the Bankruptcy Filing on the Debtors and the interests of various creditors, equity holders and other constituents; Bankruptcy Court rulings in the chapter 11 cases and the outcome of the cases in general; the length of time the Debtors will operate under the chapter 11 cases; risks associated with third-party motions in the chapter 11 cases, which may interfere with the ability of the Debtors to develop and consummate one or more plans of reorganization once such plans are developed; the potential adverse effects of the chapter 11 proceedings on the Debtors’ liquidity or results of operations; the ability to execute Debtors’ business and restructuring plan and to timely and effectively implement the turnaround strategy; increased legal costs related to the Bankruptcy Filing and other litigation; the Debtors’ ability to maintain contracts that are critical to its operation, to obtain and maintain normal terms with customers, suppliers and service providers and to retain key executives, managers and employees; various operating factors and general economic conditions, competitive practices and pricing in the food industry generally and particularly in our principal geographic markets; our relationships with our employees; the terms of future collective bargaining agreements; the costs and other effects of lawsuits and administrative proceedings; the nature and extent of continued consolidation in the food industry; changes in the capital markets which may affect our cost of capital or the ability to access capital; supply or quality control problems with our vendors; regulatory compliance; and changes in economic conditions, which may affect the buying patterns of our customers. Refer to Risk Factors included in this annual report.
ITEM 7A – Quantitative and Qualitative Disclosures About Market Risk
Market risk represents the risk of loss from adverse market changes that may impact our consolidated financial position, results of operations or cash flows. Among other possible market risks, we are exposed to interest rate risk. From time to time, we may enter hedging agreements in order to manage risks incurred in the normal course of business.
Interest Rates
Our exposure to market risk for changes in interest rates relates primarily to our debt obligations, specifically for our DIP Credit Agreement. Our Company would have potential exposure to changes in interest rates when the adjusted LIBOR resets. During fiscal 2010, a presumed 1% change in the adjusted LIBOR would not have impacted interest expense as the combination of the LIBOR rate of 25 basis points and a 1% increase would remain below the adjusted LIBOR floor of 175 basis points. As of February 26, 2011, we did not have cash flow exposure due to rate changes on any of our other debt securities because they are at fixed interest rates ranging from 2.0% to 11.375%. Accordingly, as of February 26, 2011, we did not have exposure to variable floating interest rates. During fiscal 2009 and fiscal 2008, a presumed 1% change in the variable floating rate would have impacted interest expense by $2.1 million and $3.0 million, respectively.
Foreign Exchange Risk
As of February 26, 2011, we did not have exposure to foreign exchange risk as we did not hold any significant assets denominated in foreign currency.
ITEM 8 - Financial Statements and Supplementary Data
Report of Independent Registered Public Accounting Firm
To the Stockholders and the Board of Directors of
The Great Atlantic & Pacific Tea Company, Inc.
In our opinion, the accompanying consolidated balance sheets and the related consolidated statements of operations, stockholders' deficit and comprehensive loss, and cash flows present fairly, in all material respects, the financial position of The Great Atlantic & Pacific Tea Company, Inc. and its subsidiaries (debtor-in-possession) at February 26, 2011 and February 27, 2010, and the results of their operations and their cash flows for each of the three years in the period ended February 26, 2011 in conformity with accounting principles generally accepted in the United States of America. In addition, in our opinion, the financial statement schedule listed in Item 15(a)(2) presents fairly, in all material respects, the information set forth therein when read in conjunction with the related consolidated financial statements. Also in our opinion, the Company maintained, in all material respects, effective internal control over financial reporting as of February 26, 2011, based on criteria established in Internal Control - Integrated Framework issued by the Committee of Sponsoring Organizations of the Treadway Commission (COSO). The Company's management is responsible for these financial statements and financial statement schedule, for maintaining effective internal control over financial reporting and for its assessment of the effectiveness of internal control over financial reporting, included in Management's Annual Report on Internal Control over Financial Reporting appearing under Item 9A. Our responsibility is to express opinions on these financial statements, on the financial statement schedule, and on the Company's internal control over financial reporting based on our integrated audits. We conducted our audits in accordance with the standards of the Public Company Accounting Oversight Board (United States). Those standards require that we plan and perform the audits to obtain reasonable assurance about whether the financial statements are free of material misstatement and whether effective internal control over financial reporting was maintained in all material respects. Our audits of the financial statements included examining, on a test basis, evidence supporting the amounts and disclosures in the financial statements, assessing the accounting principles used and significant estimates made by management, and evaluating the overall financial statement presentation. Our audit of internal control over financial reporting included obtaining an understanding of internal control over financial reporting, assessing the risk that a material weakness exists, and testing and evaluating the design and operating effectiveness of internal control based on the assessed risk. Our audits also included performing such other procedures as we considered necessary in the circumstances. We believe that our audits provide a reasonable basis for our opinions.
The accompanying financial statements have been prepared assuming that the Company will continue as a going concern. However, the Company is currently operating pursuant to a Chapter 11 bankruptcy filing which, together with the uncertain outcomes of the matters discussed in Note 1 to the consolidated financial statements, raise substantial doubt about the Company’s ability to continue as a going concern. Management's plans in regard to these matters are also described in Note 1. The consolidated financial statements do not include any adjustments that might result from the outcome of these uncertainties.
As discussed in Note 1 to the consolidated financial statements, the Company changed the manner in which it accounts for share lending arrangements during fiscal 2010.
A company’s internal control over financial reporting is a process designed to provide reasonable assurance regarding the reliability of financial reporting and the preparation of financial statements for external purposes in accordance with generally accepted accounting principles. A company’s internal control over financial reporting includes those policies and procedures that (i) pertain to the maintenance of records that, in reasonable detail, accurately and fairly reflect the transactions and dispositions of the assets of the company; (ii) provide reasonable assurance that transactions are recorded as necessary to permit preparation of financial statements in accordance with generally accepted accounting principles, and that receipts and expenditures of the company are being made only in accordance with authorizations of management and directors of the company; and (iii) provide reasonable assurance regarding prevention or timely detection of unauthorized acquisition, use, or
disposition of the company’s assets that could have a material effect on the financial statements.
Because of its inherent limitations, internal control over financial reporting may not prevent or detect misstatements. Also, projections of any evaluation of effectiveness to future periods are subject to the risk that controls may become inadequate because of changes in conditions, or that the degree of compliance with the policies or procedures may deteriorate.
/s/ PricewaterhouseCoopers LLP
Florham Park, New Jersey
May 10, 2011
The Great Atlantic & Pacific Tea Company, Inc.
(Debtors-in-Possession)
Consolidated Statements of Operations
(Dollars in thousands, except per share amounts)
|
Fiscal 2010
|
Fiscal 2009
|
Fiscal 2008
|
||||||||||
|
Sales
|
$
|
8,078,455
|
$
|
8,813,568
|
$
|
9,516,186
|
||||||
|
Cost of merchandise sold
|
(5,677,800
|
)
|
(6,146,808
|
)
|
(6,613,150
|
)
|
||||||
|
Gross margin
|
2,400,655
|
2,666,760
|
2,903,036
|
|||||||||
|
Store operating, general and administrative expense
|
(2,737,093
|
)
|
(2,790,154
|
)
|
(2,978,099
|
)
|
||||||
|
Goodwill, trademark and long-lived asset impairment
|
(114,183
|
)
|
(477,180
|
)
|
-
|
|||||||
|
Loss from continuing operations before
|
||||||||||||
|
nonoperating income (loss), interest
|
||||||||||||
|
expense, net, and reorganization items, net
|
(450,621
|
)
|
(600,574
|
)
|
(75,063
|
)
|
||||||
|
Nonoperating income (loss)
|
13,777
|
(9,181
|
)
|
116,864
|
||||||||
|
Interest expense, net
|
(218,369
|
)
|
(192,889
|
)
|
(157,000
|
)
|
||||||
|
Reorganization items, net
|
(21,985
|
)
|
-
|
-
|
||||||||
|
Loss from continuing operations before income taxes
|
(677,198
|
)
|
(802,644
|
)
|
(115,199
|
)
|
||||||
|
Benefit from (provision for) income taxes
|
3,798
|
21,994
|
(2,683
|
)
|
||||||||
|
Loss from continuing operations
|
(673,400
|
)
|
(780,650
|
)
|
(117,882
|
)
|
||||||
|
Discontinued operations:
|
||||||||||||
|
Loss from operations of discontinued
|
||||||||||||
|
businesses, net of tax benefit of $0
|
||||||||||||
|
for fiscal 2010, 2009, and 2008
|
(57,992
|
)
|
(95,848
|
)
|
(58,383
|
)
|
||||||
|
Loss (gain) on disposal of discontinued
|
||||||||||||
|
operations, net of tax benefit of $0
|
||||||||||||
|
for fiscal 2010, 2009, and 2008
|
(447
|
)
|
-
|
4,653
|
||||||||
|
Reorganization items, net
|
133,264
|
-
|
-
|
|||||||||
|
Income (loss) from discontinued operations
|
74,825
|
(95,848
|
)
|
(53,730
|
)
|
|||||||
|
Net loss
|
$
|
(598,575
|
)
|
$
|
(876,498
|
)
|
$
|
(171,612
|
)
|
|||
|
Net (loss) income per share – basic:
|
||||||||||||
|
Continuing operations
|
$
|
(12.84
|
)
|
$
|
(14.79
|
)
|
$
|
(2.31
|
)
|
|||
|
Discontinued operations
|
1.39
|
(1.80
|
)
|
(1.05
|
)
|
|||||||
|
Net loss per share – basic
|
$
|
(11.45
|
)
|
$
|
(16.59
|
)
|
$
|
(3.36
|
)
|
|||
|
Net (loss) income per share – diluted:
|
||||||||||||
|
Continuing operations
|
$
|
(277.17
|
)
|
$
|
(26.12
|
)
|
$
|
(4.90
|
)
|
|||
|
Discontinued operations
|
29.48
|
(3.22
|
)
|
(1.06
|
)
|
|||||||
|
Net loss per share – diluted
|
$
|
(247.69
|
)
|
$
|
(29.34
|
)
|
$
|
(5.96
|
)
|
|||
|
Weighted average common shares outstanding:
|
||||||||||||
|
Basic
|
53,719,700
|
53,203,741
|
50,948,194
|
|||||||||
|
Diluted
|
2,538,236
|
29,771,904
|
50,883,221
|
|||||||||
|
See Notes to Consolidated Financial Statements.
|
||||||||||||
The Great Atlantic & Pacific Tea Company, Inc.
(Debtors-in-Possession)
Consolidated Statements of Stockholders’ Deficit and Comprehensive Loss
(Dollars in thousands, except share amounts)
|
Additional Paid-in Capital
|
Accumulated Other Comprehensive Loss
|
Retained Earnings (Accumulated Deficit)
|
Total Stockholders' Equity (Deficit)
|
||||||||
|
Common Stock
|
|||||||||||
|
Shares
|
Amount
|
||||||||||
|
Balance at 2/23/2008
|
57,100,955
|
$ 57,101
|
$ 399,973
|
$ (28,975)
|
$ 16,021
|
$ 444,120
|
|||||
|
Adoption of accounting guidance for share lending
|
|
|
|
|
|
|
|||||
| agreements | - | - | 28,277 | - | - | 28,277 | |||||
|
Net loss
|
-
|
-
|
-
|
-
|
(171,612)
|
(171,612)
|
|||||
|
Stock options exercised
|
107,891
|
108
|
2,105
|
-
|
-
|
2,213
|
|||||
|
Other share based awards
|
465,953
|
466
|
5,228
|
-
|
-
|
5,694
|
|||||
|
Financing warrants and conversion
|
|||||||||||
|
features relating to convertible debt
|
-
|
-
|
57,373
|
-
|
-
|
57,373
|
|||||
|
Other comprehensive loss
|
-
|
-
|
-
|
(76,172)
|
-
|
(76,172)
|
|||||
|
Balance at 2/28/2009
|
57,674,799
|
$ 57,675
|
$ 492,956
|
$ (105,147)
|
$ (155,591)
|
$ 289,893
|
|||||
|
Net loss
|
-
|
-
|
-
|
-
|
(876,498)
|
(876,498)
|
|||||
|
Beneficial conversion feature related to
|
|||||||||||
|
preferred stock, net of accretion
|
-
|
-
|
31,036
|
-
|
-
|
31,036
|
|||||
|
Dividends on preferred stock
|
-
|
-
|
(4,572)
|
-
|
-
|
(4,572)
|
|||||
|
Preferred stock financing fees amortization
|
-
|
-
|
(562)
|
-
|
-
|
(562)
|
|||||
|
Returned shares under the share lending agreement
|
(2,500,000)
|
(2,500)
|
2,500
|
-
|
-
|
-
|
|||||
|
Stock options exercised
|
19,396
|
19
|
70
|
-
|
-
|
89
|
|||||
|
Other share based awards
|
673,934
|
674
|
4,993
|
-
|
-
|
5,667
|
|||||
|
Other comprehensive loss
|
-
|
-
|
-
|
25,744
|
-
|
25,744
|
|||||
|
Balance at 2/27/2010
|
55,868,129
|
$ 55,868
|
$ 526,421
|
$ (79,403)
|
$ (1,032,089)
|
$ (529,203)
|
|||||
|
Net loss
|
-
|
(598,575)
|
(598,575)
|
||||||||
|
Beneficial conversion feature related to preferred
|
|||||||||||
|
stock, net of accretion
|
-
|
-
|
(4,813)
|
-
|
-
|
(4,813)
|
|||||
|
Dividends on preferred stock
|
-
|
-
|
(7,517)
|
-
|
-
|
(7,517)
|
|||||
|
Preferred stock financing fees amortization
|
-
|
-
|
(1,739)
|
-
|
-
|
(1,739)
|
|||||
|
Payment-in-kind dividends
|
-
|
-
|
(4,020)
|
-
|
-
|
(4,020)
|
|||||
|
Other comprehensive income
|
-
|
-
|
-
|
4,094
|
-
|
4,094
|
|||||
|
Returned shares under the share lending agreement
|
(2,427,944)
|
(2,428)
|
2,428
|
-
|
-
|
-
|
|||||
|
Stock options exercised
|
4,834
|
5
|
23
|
-
|
-
|
28
|
|||||
|
Other share based awards
|
407,451
|
407
|
374
|
-
|
-
|
781
|
|||||
|
Balance at 2/26/2011
|
53,852,470
|
$ 53,852
|
$ 511,157
|
$ (75,309)
|
$ (1,630,664)
|
$ (1,140,964)
|
|||||
|
See Notes to Consolidated Financial Statements.
|
|||||||||||
The Great Atlantic & Pacific Tea Company, Inc.
(Debtors-in-Possession)
Consolidated Statements of Stockholders’ Deficit and Comprehensive Loss - Continued
(Dollars in thousands, except share amounts)
Accumulated Other Comprehensive Loss Balances
|
Pension and Other Postretirement Benefits
|
Accumulated Other Comprehensive Loss
|
|||||
|
Balance at February 23, 2008
|
$ (28,975)
|
$ (28,975)
|
||||
|
Current period change
|
(76,172)
|
(76,172)
|
||||
|
Balance at February 28, 2009
|
(105,147)
|
(105,147)
|
||||
|
Current period change
|
25,744
|
25,744
|
||||
|
Balance at February 27, 2010
|
(79,403)
|
(79,403)
|
||||
|
Current period change
|
4,094
|
4,094
|
||||
|
Balance at February 26, 2011
|
$ (75,309)
|
$ (75,309)
|
||||
|
Comprehensive Loss
|
||||||
|
Fiscal 2010
|
Fiscal 2009
|
Fiscal 2008
|
||||
|
Net loss
|
$ (598,575)
|
$ (876,498)
|
$ (171,612)
|
|||
|
Pension and other postretirement benefits, net of tax of $0
|
4,094
|
25,744
|
(76,172)
|
|||
|
Other comprehensive income (loss), net of tax of $0
|
4,094
|
25,744
|
(76,172)
|
|||
|
Total comprehensive loss
|
$ (594,481)
|
$ (850,754)
|
$ (247,784)
|
|||
|
See Notes to Consolidated Financial Statements.
|
||||||
The Great Atlantic & Pacific Tea Company, Inc.
(Debtors-in-Possession)
Consolidated Balance Sheets
(Dollars in thousands, except share and per share amounts)
|
Assets
|
February 26, 2011
|
February 27, 2010
|
||||||
|
Current assets:
|
||||||||
|
Cash and cash equivalents
|
$ | 352,607 | $ | 252,426 | ||||
|
Restricted cash
|
1,731 | 1,993 | ||||||
|
Accounts receivable, net of allowance for doubtful accounts of $5,554 and
|
||||||||
|
$8,728 at February 26, 2011 and February 27, 2010, respectively
|
209,966 | 175,686 | ||||||
|
Inventories, net
|
440,960 | 467,227 | ||||||
|
Prepaid expenses and other current assets
|
36,329 | 43,374 | ||||||
|
Total current assets
|
1,041,593 | 940,706 | ||||||
|
Non-current assets:
|
||||||||
|
Property:
|
||||||||
|
Land
|
98,078 | 107,062 | ||||||
|
Buildings
|
349,165 | 371,605 | ||||||
|
Equipment
|
1,116,044 | 1,245,079 | ||||||
|
Leasehold improvements
|
1,227,679 | 1,325,236 | ||||||
|
Total – at cost
|
2,790,966 | 3,048,982 | ||||||
|
Less accumulated depreciation and amortization
|
(1,627,113 | ) | (1,651,011 | ) | ||||
|
Property owned, net
|
1,163,853 | 1,397,971 | ||||||
|
Property under capital leases, net
|
63,346 | 89,599 | ||||||
|
Property, net
|
1,227,199 | 1,487,570 | ||||||
|
Goodwill
|
110,412 | 115,197 | ||||||
|
Intangible assets, net
|
124,288 | 147,713 | ||||||
|
Other assets
|
141,357 | 145,574 | ||||||
|
Total assets
|
$ | 2,644,849 | $ | 2,836,760 | ||||
|
Liabilities and Stockholders’ Deficit
|
||||||||
|
Current liabilities:
|
||||||||
|
Current portion of long-term debt
|
$ | - | $ | 191 | ||||
|
Current portion of obligations under capital leases
|
- | 13,702 | ||||||
|
Current portion of real estate liabilities
|
- | 4,220 | ||||||
|
Accounts payable
|
119,245 | 227,779 | ||||||
|
Book overdrafts
|
23,722 | 60,465 | ||||||
|
Accrued salaries, wages and benefits
|
109,428 | 145,170 | ||||||
|
Accrued taxes
|
26,175 | 31,802 | ||||||
|
Other accruals
|
65,048 | 246,516 | ||||||
|
Total current liabilities
|
343,618 | 729,845 | ||||||
|
Non-current liabilities:
|
||||||||
|
Long-term debt
|
350,000 | 990,359 | ||||||
|
Long-term obligations under capital leases
|
- | 136,880 | ||||||
|
Long-term real estate liabilities
|
- | 329,363 | ||||||
|
Deferred real estate income
|
- | 87,061 | ||||||
|
Other financial liabilities
|
- | 13,946 | ||||||
|
Other non-current liabilities
|
74,162 | 945,752 | ||||||
|
Total liabilities not subject to compromise
|
767,780 | 3,233,206 | ||||||
|
Liabilities subject to compromise (Refer to Note 10)
|
2,874,734 | - | ||||||
|
Total liabilities
|
3,642,514 | 3,233,206 | ||||||
|
Series A redeemable preferred stock – no par value, $1,000 redemption value; authorized – 700,000
|
||||||||
|
shares; issued – 179,020 and 175,000 at February 26, 2011 and February 27, 2010, respectively
|
143,299 | 132,757 | ||||||
|
Commitments and contingencies (Refer to Note 22)
|
||||||||
|
Stockholders’ deficit:
|
||||||||
|
Common stock – $1 par value; authorized – 160,000,000 shares; issued and outstanding –
|
||||||||
|
53,852,470 and 55,868,129 shares at February 26, 2011 and February 27, 2010, respectively
|
53,852 | 55,868 | ||||||
|
Additional paid-in capital
|
511,157 | 498,144 | ||||||
|
Accumulated other comprehensive loss
|
(75,309 | ) | (79,403 | ) | ||||
|
Accumulated deficit
|
(1,630,664 | ) | (1,003,812 | ) | ||||
|
Total stockholders’ deficit
|
(1,140,964 | ) | (529,203 | ) | ||||
|
Total liabilities and stockholders’ deficit
|
$ | 2,644,849 | $ | 2,836,760 | ||||
See Notes to Consolidated Financial Statements.
The Great Atlantic & Pacific Tea Company, Inc.
(Debtors-in-Possession)
Consolidated Statements of Cash Flows
(Dollars in thousands)
|
Fiscal 2010
|
Fiscal 2009
|
Fiscal 2008
|
||||||||||
|
CASH FLOWS FROM OPERATING ACTIVITIES:
|
||||||||||||
|
Net loss
|
$
|
(598,575
|
)
|
$
|
(876,498
|
)
|
$
|
(171,612
|
)
|
|||
|
Adjustments to reconcile net loss to net cash used in
|
||||||||||||
|
operating activities (see next page)
|
476,202
|
939,370
|
307,410
|
|||||||||
|
Other changes in assets and liabilities, net of acquisitions:
|
||||||||||||
|
(Increase) decrease in receivables
|
(34,280
|
)
|
21,295
|
(28,625
|
)
|
|||||||
|
Decrease in inventories
|
24,223
|
7,617
|
21,889
|
|||||||||
|
Increase in prepaid expenses and other current assets
|
(3,911
|
)
|
(24,638
|
)
|
(8,081
|
)
|
||||||
|
Increase in other assets
|
(16,944
|
)
|
(11,968
|
)
|
(16,017
|
)
|
||||||
|
Increase in accounts payable
|
90,757
|
6,189
|
5,850
|
|||||||||
|
Decrease in accrued salaries, wages and benefits, and taxes
|
(41,736
|
)
|
(38,118
|
)
|
(21,177
|
)
|
||||||
|
Increase (decrease) in other accruals
|
67,761
|
(2,919
|
)
|
(6,996
|
)
|
|||||||
|
Decrease in other non-current liabilities
|
(37,397
|
)
|
(61,701
|
)
|
(85,944
|
)
|
||||||
|
Other operating activities, net
|
369
|
(546
|
)
|
2,004
|
||||||||
|
Payments for reorganization items
|
(7,439
|
)
|
-
|
-
|
||||||||
|
Net cash used in operating activities
|
(80,970
|
)
|
(41,917
|
)
|
(1,299
|
)
|
||||||
|
CASH FLOWS FROM INVESTING ACTIVITIES:
|
||||||||||||
|
Expenditures for property
|
(71,070
|
)
|
(86,378
|
)
|
(115,994
|
)
|
||||||
|
Proceeds from disposal of property
|
38,334
|
11,651
|
37,616
|
|||||||||
|
Proceeds from flood insurance
|
6,410
|
-
|
-
|
|||||||||
|
Proceeds from sale of joint venture
|
-
|
5,914
|
-
|
|||||||||
|
Decrease in restricted cash
|
262
|
221
|
1,499
|
|||||||||
|
Proceeds from maturities of marketable securities
|
-
|
5,626
|
12,349
|
|||||||||
|
Net cash used in investing activities
|
(26,064
|
)
|
(62,966
|
)
|
(64,530
|
)
|
||||||
|
CASH FLOWS FROM FINANCING ACTIVITIES:
|
||||||||||||
|
Proceeds from debtor-in-possession financing
|
350,000
|
-
|
-
|
|||||||||
|
Proceeds from issuance of long-term debt
|
800
|
253,201
|
-
|
|||||||||
|
Principal payments on long-term debt
|
(225
|
)
|
(283
|
)
|
(274
|
)
|
||||||
|
Proceeds under revolving lines of credit
|
663,400
|
39,450
|
1,683,823
|
|||||||||
|
Principal payments on revolving lines of credit
|
(796,300
|
)
|
(238,333
|
)
|
(1,521,940
|
)
|
||||||
|
Proceeds under line of credit
|
-
|
378
|
54,973
|
|||||||||
|
Principal payments on line of credit
|
-
|
(5,378
|
)
|
(61,573
|
)
|
|||||||
|
Proceeds from issuance of preferred stock
|
-
|
175,000
|
-
|
|||||||||
|
Proceeds from promissory note
|
-
|
-
|
10,000
|
|||||||||
|
Settlement of Series A warrants
|
-
|
-
|
(45,735
|
)
|
||||||||
|
Proceeds from long-term real estate liabilities
|
-
|
170
|
3,150
|
|||||||||
|
Principal payments on long-term real estate liabilities
|
(1,156
|
)
|
(1,081
|
)
|
(1,147
|
)
|
||||||
|
Proceeds from sale-leaseback transaction
|
89,830
|
3,000
|
-
|
|||||||||
|
Principal payments on capital leases
|
(11,947
|
)
|
(11,198
|
)
|
(9,015
|
)
|
||||||
|
(Decrease) increase in book overdrafts
|
(36,743
|
)
|
(370
|
)
|
24,400
|
|||||||
|
Payments of financing fees for debtor-in-possession financing
|
(34,771
|
)
|
-
|
-
|
||||||||
|
Payment of financing fees for revolving line of credit
|
(2,995
|
)
|
-
|
-
|
||||||||
|
Deferred financing fees
|
(2,206
|
)
|
(27,617
|
)
|
1,674
|
|||||||
|
Dividends paid on preferred stock
|
(10,500
|
)
|
(5,094
|
)
|
-
|
|||||||
|
Proceeds from exercises of stock options
|
28
|
89
|
2,213
|
|||||||||
|
Net cash provided by financing activities
|
207,215
|
181,934
|
140,549
|
|||||||||
|
Effect of exchange rate changes on cash and
|
||||||||||||
|
cash equivalents
|
-
|
-
|
(78
|
)
|
||||||||
|
Net increase in cash and cash equivalents
|
100,181
|
77,051
|
74,642
|
|||||||||
|
Cash and cash equivalents at beginning of year
|
252,426
|
175,375
|
100,733
|
|||||||||
|
Cash and cash equivalents at end of year
|
$
|
352,607
|
$
|
252,426
|
$
|
175,375
|
||||||
|
SUPPLEMENTAL DISCLOSURES OF CASH FLOW INFORMATION:
|
||||||||||||
|
Cash paid during the year for interest
|
$
|
129,677
|
$
|
146,174
|
$
|
131,286
|
||||||
|
Cash paid during the year for income taxes
|
$
|
243
|
$
|
6,789
|
$
|
4,650
|
||||||
See Notes to Consolidated Financial Statements.
The Great Atlantic & Pacific Tea Company, Inc.
(Debtors-in-Possession)
Consolidated Statements of Cash Flows - Continued
(Dollars in thousands)
ADJUSTMENTS TO RECONCILE NET LOSS TO NET CASH USED IN OPERATING ACTIVITIES:
|
Fiscal 2010
|
Fiscal 2009
|
Fiscal 2008
|
||||||||||
|
Depreciation and amortization
|
$
|
218,398
|
$
|
245,460
|
$
|
260,991
|
||||||
|
Impairment of goodwill and trademark
|
12,700
|
411,945
|
-
|
|||||||||
|
Impairment of long-lived assets
|
109,175
|
71,704
|
14,069
|
|||||||||
|
Nonoperating (income)/loss
|
(13,777
|
)
|
9,181
|
(116,864
|
)
|
|||||||
|
Non-cash interest expense
|
29,305
|
43,032
|
26,651
|
|||||||||
|
Stock compensation expense
|
1,267
|
5,667
|
5,694
|
|||||||||
|
Pension withdrawal costs
|
-
|
2,445
|
28,911
|
|||||||||
|
Employee benefit related costs
|
16,289
|
18,219
|
-
|
|||||||||
|
LIFO adjustment
|
2,044
|
(842
|
)
|
7,817
|
||||||||
|
Self-insurance reserve
|
106,680
|
53,452
|
-
|
|||||||||
|
Provision for deferred income taxes
|
(3,058
|
)
|
(15,985
|
)
|
-
|
|||||||
|
Asset disposition initiatives in the normal course of business
|
-
|
(2,167
|
)
|
5,898
|
||||||||
|
Asset disposition initiatives relating to discontinued operations
|
13,407
|
57,842
|
32,319
|
|||||||||
|
Non-cash occupancy charges for stores closed in the normal course of business
|
63,276
|
43,746
|
21,711
|
|||||||||
|
(Gains)/losses on disposal of owned property and write-down of property, net
|
(4,094
|
)
|
153
|
1,086
|
||||||||
|
Amortization of deferred real estate income
|
(4,992
|
)
|
(4,482
|
)
|
(4,497
|
)
|
||||||
|
Gain on disposal of discontinued operations
|
(79
|
)
|
-
|
(4,653
|
)
|
|||||||
|
Adoption of accounting guidance for share lending agreements
|
-
|
-
|
28,277
|
|||||||||
|
Reorganization items, net relating to discontinued operations
|
(133,264
|
)
|
-
|
-
|
||||||||
|
Reorganization items, net relating to continuing operations
|
21,985
|
-
|
-
|
|||||||||
|
Financing fees
|
40,940
|
-
|
-
|
|||||||||
|
Total adjustments to net loss
|
$
|
476,202
|
$
|
939,370
|
$
|
307,410
|
||||||
See Notes to Consolidated Financial Statements.
NOTE 1 — Summary of Significant Accounting Policies
Basis of Presentation and Consolidation
The consolidated financial statements include the accounts of The Great Atlantic & Pacific Tea Company, Inc. (“We,” “Our,” “Us” or “our Company”) and all subsidiaries. All intercompany accounts and transactions have been eliminated.
At February 26, 2011, we operated retail supermarkets in the United States. Our operations are mainly in the Northeastern part of the U.S. Our principal stockholder, Tengelmann Warenhandelsgesellschaft KG (“Tengelmann”) and its wholly-owned subsidiaries, owned 44.2% of our common stock as of February 26, 2011. Yucaipa Companies LLC (“Yucaipa”) owned 4.8% of our common stock as of February 26, 2011. In addition to common stock, Tengelmann and Yucaipa have beneficial ownership of 60,000 shares and 115,000 shares of preferred stock, respectively, which are convertible into 12,000,000 shares and 23,000,000 shares of our common stock, respectively. Assuming all preferred shares are converted, Tengelmann and Yucaipa would have ownership of approximately 40% and 29%, respectively, of our common stock, which also represents their voting interest. Refer to Note 12 - Redeemable Preferred Stock for additional information.
Certain reclassifications have been made to prior year amounts to conform to current year presentation. Refer to Recently Adopted Accounting Guidance later in this Note for prior period reclassifications made upon our retrospective adoption of Financial Accounting Standards Board (“FASB”) Accounting Standards Update relating to accounting for share lending agreements entered into in contemplation of a convertible debt issuance.
Fiscal Year
Our fiscal year ends on the last Saturday in February. Fiscal 2010 and fiscal 2009 were each comprised of 52 weeks, consisting of 13 four-week periods. Fiscal 2008 was comprised of 53 weeks, consisting of 12 four-week periods and one five-week period.
Bankruptcy Filing
On December 12, 2010, our Company and all of our U.S. subsidiaries (the “Debtors”) filed voluntary petitions for relief (the “Bankruptcy Filing”) under chapter 11 of title 11 of the United States Bankruptcy Code (the “Bankruptcy Code”) in the United States Bankruptcy Court for the Southern District of New York in White Plains (the “Bankruptcy Court”), case number 10-24549. Management's decision to make the Bankruptcy Filing was in response to, among other things, our Company’s deteriorating liquidity and management's conclusion that the challenges of successfully implementing additional financing initiatives and of obtaining necessary cost concessions from our Company’s business and labor partners, was negatively impacting our Company’s ability to implement our previously announced turnaround strategy. Our Company’s non-U.S. subsidiaries, which are immaterial on a consolidated basis and have no retail operations, were not part of the Bankruptcy Filing.
We are currently operating pursuant to the Bankruptcy Filing and continuation of our Company as a going-concern is contingent upon, among other things, the Debtors’ ability (i) to comply with the terms and conditions of the DIP Credit Agreement described in Note 9 – Indebtedness and Other Financial Liabilities; (ii) to develop a plan of reorganization and obtain confirmation under the Bankruptcy Code; (iii) to reduce debt and other liabilities through the bankruptcy process; (iv) to return to profitability, including necessary near-term cost concession from our business and labor partners beginning as early as June 2011 with the benefits reflected in our results shortly thereafter; (v) to generate sufficient cash flow from operations; and (vi) to obtain financing sources to meet our future obligations. The uncertainty regarding these matters raises substantial doubt about our ability to continue as a going concern.
Our Company was required to apply the FASB’s provisions of Reorganizations effective on December 12, 2010, which is applicable to companies in chapter 11, which generally does not change the manner in which financial statements are prepared. However, it does require that the financial statements for periods subsequent to the filing of the Bankruptcy Filing petition distinguish transactions and events that are directly associated with the reorganization from the ongoing operations of the business. Revenues, expenses, realized gains and losses, and provisions for losses that can be directly associated with the reorganization and restructuring of the business must be reported separately as reorganization items in the Consolidated Statements of Operations beginning in the year ended February 26, 2011. The balance sheet must distinguish prepetition liabilities subject to compromise from both those prepetition liabilities that are not subject to compromise and from post-petition liabilities. As discussed in Note 9 - Indebtedness and Other Financial Liabilities, currently the Senior Secured Notes totaling $260.0 million have priority over the unsecured creditors of our Company. Based upon the uncertainty surrounding the ultimate treatment of the Notes in our reorganization plan, including the potential that these Notes may be impaired, these notes are classified as Liabilities subject to compromise on our Consolidated Balance Sheets. Our Company continues to evaluate creditors' claims for other claims that may also have priority over unsecured creditors. Liabilities that may be affected by a plan of reorganization must be reported at the amounts expected to be approved by the Bankruptcy Court, even if they may be settled for lesser amounts as a result of the plan or reorganization. In addition, cash provided by reorganization items must be disclosed separately in the Consolidated Statements of Cash Flows.
Condensed Combined Debtor-in-Possession Financial Information
As previously disclosed, our Company’s non-U.S. subsidiaries were not part of the Bankruptcy Filing. As our non-US subsidiaries contain only the intercompany transactions discussed below with no significant income statement activity, we do not separately disclose the condensed combined financial statements of the Debtors in accordance with the requirements of reorganization accounting.
Intercompany Transactions
Intercompany transactions between Debtor entities, as well as between Debtor and non-debtor subsidiaries, include, but are not limited to, intercompany cash sweep arrangements, intercompany financing arrangements, intercompany wages and intercompany inventory procurement. The intercompany financing agreements include two loans from two of the non-debtor foreign subsidiaries to Shopwell, Inc., a Debtor of our Company; a 3.562% loan due on May 27, 2013 with an outstanding balance of principal and interest of approximately $94.0 million from A&P Bermuda Limited and a 2.85% loan due on January 15, 2014 with an outstanding balance of principal and interest of approximately $0.1 million from APTEA Hungry Liquidity Management Limited Liability Company. All payments between the Debtor and non-debtor entities have been stayed at this time. All intercompany transactions have been eliminated in the accompanying Consolidated Statements of Operations and Consolidated Balance Sheets.
Use of Estimates
The preparation of financial statements in conformity with accounting principles generally accepted in the United States of America (“U.S. GAAP”) requires us to make estimates and assumptions that affect the reported amounts of assets and liabilities and disclosures of contingent assets and liabilities at the date of the financial statements, and the reported amounts of revenues and expenses during the reporting period. Actual results could differ from those estimates.
Revenue Recognition
Retail revenue is recognized at point-of-sale. Discounts and allowances that we provide to our customers are accounted for as a reduction to sales and are recorded at point-of-sale.
Cost of Merchandise Sold
Cost of merchandise sold includes cost of inventory sold during the period, including purchasing and distribution costs. These costs include inbound freight charges, purchasing and receiving costs, warehouse inspection costs, warehousing costs, internal transfer costs and other distribution costs through C&S Wholesale Grocers, Inc. and Grocery Haulers, Inc. In addition, vendor allowance income is recorded within cost of merchandise sold.
Vendor Allowances
Vendor allowances that relate to our Company’s buying and merchandising activities consist primarily of advertising, promotional and slotting allowances. With the exception of allowances described below, all allowances are recognized when the related performance is completed and the related inventory is sold as a reduction of cost of goods sold. Lump-sum payments received for multi-year contracts are generally amortized on a straight line basis over the life of the contracts. Vendor rebates or refunds that are contingent upon our Company completing a specified level of purchases or remaining a reseller for a specified time period are recognized as a reduction of cost of goods sold based on a systematic and rational allocation of the rebate or refund to each of the underlying transactions that results in progress toward earning that rebate or refund, assuming that we can reasonably estimate the rebate or refund and it is probable that the specified target will be obtained. If we believe attaining the milestone is not probable, the rebate or refund is recognized as the milestone is achieved. Vendor reimbursement for coupons that can only be redeemed at a Company retail store are recorded as a reduction of cost of sales.
Advertising Costs
Media advertising costs are expensed in the period the advertisement is first shown. Other advertising costs, primarily costs to produce circulars and pay advertising agency fees, are expensed when incurred. We recorded advertising expense of $92.1 million for fiscal 2010, $96.7 million for fiscal 2009 and $92.0 million for fiscal 2008.
Pre-opening Costs
Non-capital expenditures incurred in opening new stores or remodeling existing stores are expensed as incurred. Rental costs incurred during the construction period are expensed.
Software Costs
We capitalize externally purchased software and amortize it over five years. Amortization expense related to software costs for fiscal 2010, fiscal 2009 and fiscal 2008 was $3.3 million, $5.6 million and $10.6 million, respectively.
We capitalize certain internally generated software costs after feasibility is reached which is concurrent (i) with the completion of the preliminary project stage, (ii) when management authorizes and commits to funding a software project, and (iii) when it is probable that the project will be completed and the software will be used to perform the function intended. In fiscal 2010, fiscal 2009 and fiscal 2008, we capitalized $0.5 million, $0.9 million and $1.8 million, respectively, of such software costs. These costs are amortized over five years. For fiscal 2010, fiscal 2009 and fiscal 2008, we recorded related amortization expense for continuing operations of $1.7 million, $2.8 million and $3.5 million, respectively. Also during fiscal 2010, fiscal 2009 and fiscal 2008, we capitalized $1.0 million, $0.6 million and $16.2 million, respectively, of externally purchased software costs. The fiscal 2008 amount was related to the acquisition of Pathmark. These costs are being amortized over five years.
Externally purchased and internally developed software are classified in “Property – Equipment” on our Consolidated Balance Sheets.
Loss Per Share
Basic loss per share is computed by dividing loss available to common shareholders by the weighted average shares outstanding for the reporting period. Diluted loss per share reflects all potential dilution, using either the treasury stock method or the “if-converted” method, and assumes that the convertible debt, stock options, restricted stock, performance restricted stock, warrants, preferred stock, and other potentially dilutive financial instruments were converted into common stock on the first day of the period. If the conversion of a potentially dilutive security yields an antidilutive result, such potential dilutive security is excluded from the diluted earnings per share calculation. Refer to Note 18 - Loss per Share for the related calculations.
Cash and Cash Equivalents
Short-term investments that are highly liquid with maturities of ninety days or less when purchased are deemed to be cash equivalents. These balances as well as credit card receivables of $35.1 million and $39.7 million at February 26, 2011 and February 27, 2010, respectively, are included in “Cash and cash equivalents” on our Consolidated Balance Sheets.
Restricted Cash
Our restricted cash balances represent monies held in escrow for services which our Company is required to perform in connection with the sale of our real estate properties.
Accounts Receivable
Our accounts receivables primarily include amounts due from vendor allowances, third party insurance billings and receivables from subtenants.
Inventories
Store inventories are stated principally at the lower of cost or market with cost determined under the retail method. Under the retail method, the valuation of inventories at cost and resulting gross margins are determined by applying a cost-to-retail ratio for various groupings of similar items to the retail value of inventories. Inherent in the retail inventory method calculations are certain management judgments and estimates, including shrinkage, which could impact the ending inventory valuation at cost as well as the resulting gross margins. Perishables and pharmacy inventories are stated at cost. Distribution center and other inventories are stated at the lower of cost or market. As of February 26, 2011 and February 27, 2010, the cost of 64.7% and 63.5% of our inventories, respectively, was determined using the first-in, first out (“FIFO”) method and the cost of 35.3% and 36.5% of our inventories, respectively, was determined using the last-in, first-out (“LIFO”) method. At February 26, 2011 and February 27, 2010, the excess of estimated current costs over LIFO carrying values, or LIFO reserves, were approximately $11.3 million and $9.3 million, respectively.
We estimate inventory shrinkage throughout the year based on the results of our periodic physical counts in our stores and distribution centers and record reserves based on the results of these counts to provide for estimated shrinkage as of the balance sheet date.
Long-Lived Assets and Finite-Lived Intangible Assets
We review the carrying values of our long-lived assets and finite-lived intangible assets for possible impairment whenever events or changes in circumstances indicate that the carrying amount of assets may not be recoverable. Such review is primarily based upon groups of assets and the undiscounted estimated future cash flows from such assets to determine if the carrying value of such assets is recoverable from their respective cash flows. If such review indicates impairment, we measure such impairment of long-lived intangible assets as the difference between the carrying value and the fair value of the assets. Refer to Note 4 - Valuation of Long-Lived Assets for impairment analyses performed and the resulting impairment charges.
Property
Depreciation and amortization are calculated on the straight-line basis over the estimated useful lives of the assets. Buildings are depreciated based on lives varying from twenty to forty years and equipment is depreciated based on lives varying from three to ten years. Leasehold improvements are amortized over the lesser of their estimated useful lives or the remaining available lease terms, up to a maximum life of 10 years. Property leased under capital leases is amortized over the lives of the respective leases or over their economic useful lives, whichever is shorter. Land is not subject to depreciation. In addition to the impairment losses discussed in Note 4 – Valuation of Long-Lived Assets, we disposed of certain assets, which resulted in a gain from continuing operations of $4.1 million during fiscal 2010 and losses from continuing operations of $0.1 million and $1.1 million, respectively, during fiscal 2009 and fiscal 2008.
Goodwill and Other Indefinite-Lived Intangible Assets
Goodwill and other intangibles with indefinite useful lives that are not subject to amortization are tested for impairment in the fourth quarter of each fiscal year, or more frequently whenever events or changes in circumstances indicate that impairment may have occurred. Possible indicators of impairment include, but are not limited to sustained operating losses or poor operating performance trends, a significant decline in our expected future cash flows for a reporting unit, a decrease in our market capitalization below our book value for a sustained period of time, significant impairment of long-lived assets, or an expectation that a reporting unit will be disposed of or sold. When indicated, we perform an evaluation to determine if impairment has occurred. If impairment is identified, we measure and record the amount of the impairment loss.
For goodwill, the first step of the impairment analysis is performed by comparing the estimated fair value of each reporting unit to the related carrying value of the net assets of that reporting unit. We have seven reporting units, five of which have goodwill and are assessed for impairment: A&P, Waldbaum’s and SuperFresh, which comprise our Fresh reportable segment; Gourmet; and Discount and Wine, Beer & Sprits, which comprise our Other reportable Segment. If the fair value of the reporting unit exceeds the carrying value of the net asset of that reporting unit, goodwill is not deemed to be impaired and no further testing is performed. If the carrying value of the net assets for a reporting unit exceeds the related fair value, the second step of the impairment test is performed to measure any potential impairment.
The second step of the goodwill impairment test compares the fair value of the reporting unit’s goodwill with the carrying value of goodwill. To determine the fair value of goodwill, the fair value of the reporting unit is allocated to all of its assets and liabilities, with the excess allocated to goodwill. If the carrying amount of a reporting unit’s goodwill exceeds the fair value of that goodwill, an impairment loss is recognized for the difference. Refer to Note 2 – Goodwill and Other Intangible Assets for impairment analyses performed and impairment charges recorded.
Our only indefinite-lived intangible asset is the Pathmark trademark. We estimate the fair value of this intangible asset using the relief-from-royalty method, which uses assumptions related to projected revenues from our annual long-range plan; assumed royalty rates that could be payable if we did not own the trademarks; and a discount rate. We recognize an impairment loss when the estimated fair value of the indefinite-lived intangible asset is less than its carrying value. Refer to Note 2 – Goodwill and Other Intangible Assets for impairment analyses performed and impairment charges recorded.
Current Liabilities
Certain accounts payable checks issued but not presented to banks frequently result in negative book balances for accounting purposes. Such amounts are classified as “Book overdrafts” on our Consolidated Balance Sheets.
Liabilities for compensated absences of $58.7 million and $58.8 million at February 26, 2011 and February 27, 2010, respectively, are included in “Accrued salaries, wages and benefits” on our Consolidated Balance Sheets. We accrue for vested vacation pay earned by our employees.
Long-Term Real Estate Liabilities
Long-term real estate liabilities include the proceeds from sale-leaseback transactions that did not qualify for sale-leaseback accounting. The proceeds received are recorded as liabilities subject to compromise on our Consolidated Balance Sheets and will not be recognized until our continuing involvement ceases.
Long-term real estate liabilities also include various leases in which our Company received landlord allowances to offset the costs of structural improvements we made to the leased space. Because we had paid directly for a substantial portion of the structural improvement costs, we were considered the owner of the building during the construction period. In all situations upon completion of the construction, we were unable to meet the accounting requirements to qualify for sale-leaseback treatment; thus, the landlord allowances have been recorded as liabilities subject to compromise on our Consolidated Balance Sheets and have been amortized over the lease term based on rent payments designated in the lease agreements. These leases have terms ranging between 13 and 25 years and effective annual percentage rates between 4.74% and 71.14%. The effective annual percentage rates were implicitly calculated based upon technical accounting guidance.
Self-Insurance Reserves
Our Consolidated Balance Sheets include liabilities with respect to self-insured workers’ compensation and general liability claims. We estimate the required liability of such claims on a discounted basis, utilizing an actuarial method, which is based upon various assumptions, which include, but are not limited to, our historical loss experience, projected loss development factors, actual payroll, legal costs and other data. Legal expenses incurred in connection with workers’ compensation and general liability claims are charged to the specific claim to which costs pertain. The required liability is also subject to adjustment in the future based upon the changes in claims experience, including changes in the number of incidents (frequency) and changes in the ultimate cost per incident (severity). The total liability for self-insurance reserves recorded at February 26, 2011 and February 27, 2010 was $414.7 million and $292.2 million, respectively. Of this amount, approximately $14.5 million is not classified as Liabilities subject to compromise, as approximately $11.8 million is considered to have arisen subsequent to the Bankruptcy Filing and approximately $2.7 million is an obligation of a non-Debtor entity. Of the $14.5 million obligation that was incurred subsequent to the Bankruptcy Filing and is not classified as Liabilities subject to compromise on our Consolidated Balance Sheets, $2.3 million is estimated to be paid within the next 12 months and the remaining $12.2 million is considered noncurrent. The discount rate used at February 26, 2011 and February 27, 2010 was 4.0%, and was based on the timing of the projected cash flows of future payments to be made for claims. A 1% increase in the discount rate would decrease the required liability by approximately $19.2 million and $9.3 million as of February 26, 2011 and February 27, 2010, respectively. Conversely, a 1% decrease in the discount rate would increase the required liability for the same periods by approximately $21.8 million and $10.3 million, respectively.
During fiscal 2010, our worker’s compensation and general liability reserves increased by approximately $122.5 million ($97.6 million for continuing operations and $24.9 million for discontinued operations). Approximately $76.0 million is due to negative development, including the evolving impact of changes in legislation, a change in the estimated ultimate losses related to the New York area permanent partial disability claims and the continued shift in the mix of open claims to the New York area from less costly geographic areas. In addition, certain actuarial assumptions were updated to reflect these changing development factors. Approximately $37.2 million of the increase is related to our estimate of workers compensation state assessments, which are funds provided to the states to support state insurance regulatory bodies. These estimates are determined by actuarial projections of losses. During fiscal 2009, our worker’s compensation and general liability reserves increased by approximately $60.8 million ($47.8 million for continuing operations and $13.0 million for discontinued operations), primarily due to a change in estimate of approximately $45.6 million related to the negative development of prior year claims and the change in the mix of claims between our continuing and discontinued operations, and the related state assessment for such claims of approximately $5.6 million. These estimates are determined by actuarial projections of losses. During fiscal 2008, the increase in our worker’s compensation and general liability reserves was primarily related to a $24.7 million adjustment for Pathmark’s opening balance sheet liabilities for self-insurance reserves based on information we obtained regarding facts and circumstances that existed as of the acquisition date that, if known, would have affected the measurement of the amounts recognized on that date, partially offset by payments made during fiscal 2008. There have been no other significant adjustments to our estimate and while we expect the estimates may change in the future due to the reasons previously stated, we believe our current liability is adequate.
Closed Store and Warehouse Reserves
For closed stores and warehouses that are under long-term leases, we record a discounted liability using a risk free rate for future minimum lease payments and related costs, such as utilities and taxes, from the date of closure to the end of the remaining lease term, net of estimated probable recoveries from projected sublease rentals. If estimated cost recoveries exceed our liability for future minimum lease payments, the excess is recognized as income over the term of the sublease. We estimate net future cash flows based on our experience in and knowledge of the market in which the closed store is located. However, these estimates project net cash flow several years into the future and are affected by variable factors such as inflation, real estate markets and economic conditions. Variation in these factors could cause changes to our estimates.
As a result of the rejection of certain leases in Bankruptcy, we have rejected 98 of our leases through the bankruptcy process and reduced the reserve balance associated with these leases by $192.7 million, net to the allowable claim for damages of $130.2 million. The remaining closed store reserve balance of $27.0 million relates to locations for which the leases have not been rejected as of fiscal year end.
Redeemable Preferred Stock
The initial carrying amount of our preferred stock issued in August 2009 was valued at fair value on the date of issuance, net of closing and issuance costs. Based on the terms of the preferred stock agreement, our preferred stock could not be converted into more than 19.99% of the common stock outstanding prior to its issuance without shareholder approval. The shares that were immediately convertible without shareholder approval were recorded within temporary stockholders’ equity, and the shares requiring shareholder approval to become convertible were classified as a liability up to the date of receiving shareholder approval. The portion of the issuance originally classified within “Preferred stock liability” was recorded at its fair value, with the related issuance cost amortization recorded within “Interest expense” over its life. Dividends relating to preferred stock originally classified as a liability were also recorded within “Interest expense”. Upon receiving the required shareholder approval authorizing the convertibility of the remaining shares on December 15, 2009, we have reclassified the book value of the liability on the date of the shareholder approval net of the related issuance costs, to temporary stockholders’ equity. Refer to Note 12 – Redeemable Preferred Stock for additional information relating to our preferred stock issuance.
Our preferred stock classified within temporary stockholders’ equity is recorded at liquidation value, net of transaction costs and the embedded beneficial conversion feature. The discount for shares classified within temporary stockholders’ equity is accreted through “Additional paid-in capital,” in the absence of retained earnings, over the period from the date of issuance to the earliest redemption date. Dividends relating to preferred stock recorded within temporary stockholders’ equity are recorded within “Additional paid-in capital,” in the absence of retained earnings.
Our preferred stock contains an embedded beneficial conversion feature since the fair value of our Company’s common stock on the date of issuance was in excess of the effective conversion price. The embedded beneficial conversion feature was recorded by allocating a portion of the proceeds equal to the intrinsic value of the feature to “Additional paid-in-capital”. The intrinsic value of the feature is calculated on the issuance date by multiplying the difference between the quoted market price of our common stock and the effective conversion price by the number of common shares into which the shares recorded within temporary stockholders’ equity convert. The resulting discount on the immediately convertible shares is recorded within “Additional paid-in capital” and is amortized over the period from the date of issuance to the stated redemption date. The additional beneficial conversion feature relating to preferred stock that became convertible and was reclassified to temporary equity upon receiving shareholder approval is amortized from December 15, 2009 through the stated redemption date. Refer to Note 12 - Redeemable Preferred Stock for additional information.
Comprehensive Loss
Our other comprehensive loss relates to changes in pension and other postretirement benefits.
Income Taxes
We provide deferred income taxes on temporary differences between amounts of assets and liabilities for financial reporting purposes and such amounts as measured by tax regulations. A valuation allowance is recorded to reduce a deferred tax asset to the amount expected to be realized. Our Company records sales and use tax on a net basis (excluded from “Sales” and included in “Store operating, general and administrative expense” in our Consolidated Statements of Operations).
Recently Adopted Accounting Guidance
Share Lending Arrangements. In June 2009, the FASB issued new guidance on accounting for one’s own-share lending arrangements entered into in contemplation of a convertible debt issuance or other financing, which requires share lending arrangements to be measured at fair value and recognized as a debt issuance cost, and amortized using the effective interest method over the life of the financing arrangement as interest cost. The loaned shares are excluded from basic and diluted earnings per share, unless a default occurs.
When a default becomes probable, an expense equal to the fair value of the unreturned loaned shares, net of any probable recoveries, must be recognized. This guidance was effective beginning with our fiscal 2010, with retrospective application required. The fair values of our share lending agreements with the Bank of America and Lehman Brothers International Europe (“Lehman Europe”) were immaterial at inception. Our share lending arrangement with Lehman Europe, who is a party to a 3,206,058 share lending agreement with our Company, is subject to this default provision guidance as a result of their September 15, 2008 bankruptcy filing. Upon our adoption of this guidance, effective during the first quarter of fiscal 2010, we recorded a retrospective adjustment of $28.3 million, or $0.55 per basic and diluted share to our fiscal 2008 financial statements by charging “Store operating, general and administrative expense” and crediting “Additional paid-in-capital”, which represents the fair value of the unreturned shares at September 15, 2008. This adjustment is reflected in our Consolidated Balance Sheets as of February 27, 2010 and February 26, 2011 as an adjustment to opening “Accumulated deficit” and “Additional paid-in capital”. We have been including the loaned shares in our Company’s basic and diluted earnings per share since September 15, 2008. As of February 26, 2011, there were no shares outstanding under our share lending agreements.
Variable Interest Entities. In June 2009, the FASB issued new accounting guidance relating to consolidation of variable interest entities (“VIEs”), which amends the current accounting guidance for determining whether an entity is a VIE and defining the primary beneficiary. This guidance also requires additional disclosures relating to involvement with a VIE. We adopted this guidance during the first quarter of our fiscal 2010. The adoption of this guidance did not have a material effect on our Consolidated Financial Statements and disclosures.
Fair Value Measurements. In January 2010, the FASB issued new accounting guidance requiring additional disclosures about the different classes of assets and liabilities measured at fair value, valuation techniques and inputs used, the activity in Level 3 fair value measurements, and the transfers between Levels 1 and 2. It also clarified guidance around disaggregation and disclosures of inputs and valuation techniques for Level 2 and Level 3 fair value measurements. The current guidance is effective beginning with the first quarter of our fiscal 2010, except for the new disclosures relating to the Level 3 reconciliation, which are effective for the first quarter of our fiscal 2011. Refer to Note 3 – Fair Value Measurements for our Company’s fair value measurements and disclosures.
NOTE 2 — Goodwill and Other Intangible Assets
Goodwill
As of February 26, 2011 and February 27, 2010, our goodwill balance was $110.4 million and $115.2 million, respectively. Changes in the carrying amount of goodwill by reportable segment during fiscal 2010 were as follows:
|
Fresh
|
Gourmet
|
Other
|
Total
|
|||||||||||||
|
Balance as of February 27, 2010:
|
||||||||||||||||
|
Goodwill
|
$ | 120,817 | $ | 12,110 | $ | 5,974 | $ | 138,901 | ||||||||
|
Accumulated impairment losses
|
(23,704 | ) | - | - | (23,704 | ) | ||||||||||
| 97,113 | 12,110 | 5,974 | 115,197 | |||||||||||||
|
Dispositions of Assets*
|
(4,785 | ) | - | - | (4,785 | ) | ||||||||||
|
Balance as of February 26, 2011:
|
||||||||||||||||
|
Goodwill
|
116,032 | 12,110 | 5,974 | 134,116 | ||||||||||||
|
Accumulated impairment losses
|
(23,704 | ) | - | - | (23,704 | ) | ||||||||||
| $ | 92,328 | $ | 12,110 | $ | 5,974 | $ | 110,412 | |||||||||
|
*
|
Relates to the sale of seven stores in Connecticut. Refer to Note 6 – Asset Disposition Initiatives.
|
During the fourth quarter of fiscal 2010, we performed our annual goodwill impairment testing for our reporting units. We performed the first step of goodwill impairment testing by estimating the fair value of the reporting units using a net present value methodology, which is dependent on significant assumptions related to estimated future discounted cash flows, discount rates and tax rates. Our assumptions for our annual impairment included a decline in revenue of approximately 6% in fiscal 2011, an increase of approximately 1% in 2012, remaining flat in years thereafter, with an estimate for improvement for business improvement initiatives for restructuring-related activities in excess of $200 million upon emerging from bankruptcy and a perpetual growth rate for cash flow in the terminal year of approximately 1.5%. We assumed a market-based weighted average cost of capital of 11.0% to discount cash flows and a blended federal and state tax rate of 42.0%. Our first step of the goodwill impairment test showed the goodwill was not impaired.
As of February 26, 2011, Goodwill for our Fresh segment was $92.3 million, of which $64.5 million was attributed to A&P and $27.8 million was attributed to Waldbaum’s. The fair value of the A&P, Waldbaum’s, Food Basics, and The Food Emporium reporting units exceeded their respective carrying values by an excess of 100%. The fair value of the Wine, Beer & Spirits reporting units exceeded its carrying values by an excess of 40%.
We believe that our estimates are appropriate based on our current trends and our expectations of negotiations resulting from the Bankruptcy Filing. However, we can provide no assurance that we will not be required to make adjustments to goodwill in the future due to market conditions or other factors related to our performance, including a decline in our forecasted results resulting from changes in projected on-going profitability, our capital investment budgets, changes in our interest rates, or favorable contract re-negotiations or expectations assumed in projections due to the Bankruptcy Filing that may not occur.
During fiscal 2009, we recorded goodwill impairment of $345.5 million related to the Pathmark and South reporting units. There were no goodwill impairment charges recorded during fiscal 2008.
Intangible Assets, net
Intangible assets, net, were acquired upon our acquisition of Pathmark in December 2007 and consisted of the following:
|
At February 26, 2011
|
At February 27, 2010
|
||||||||
|
Weighted Avg.
|
Gross
|
Gross
|
|||||||
|
Amortization
|
Carrying
|
Accumulated
|
Carrying
|
Accumulated
|
|||||
|
Period (years)
|
Amount
|
Amortization
|
Amount
|
Amortization
|
|||||
|
Loyalty card customer relationships
|
5
|
$ 19,200
|
$ 11,815
|
$ 19,200
|
$ 7,595
|
||||
|
In-store advertiser relationships
|
20
|
14,720
|
2,378
|
14,720
|
1,642
|
||||
|
Pharmacy payor relationships
|
13
|
75,000
|
18,639
|
75,000
|
12,870
|
||||
|
Pathmark trademark
|
Indefinite
|
48,200
|
-
|
60,900
|
-
|
||||
|
Total
|
$157,120
|
$ 32,832
|
$169,820
|
$ 22,107
|
|||||
During the third quarter of fiscal 2010, we determined that there was an interim triggering event requiring us to evaluate the intangible assets of the Pathmark reporting unit for possible impairment.
We evaluated the fair value of the Pathmark trademark using the relief-from-royalty method. As a result of lowered revenue expectations, the carrying value exceeded the indicated fair value of the Pathmark trademark, resulting in an impairment of $12.7 million during the third quarter of fiscal 2010, which we recorded within “Goodwill, trademark, and long-lived asset impairment” in our Consolidated Statements of Operations.
During the fourth quarter of fiscal 2010, we completed our annual impairment test of our Pathmark trademark and concluded there was no Pathmark trademark impairment during the fourth quarter of fiscal 2010. Our estimates assumed a decline in revenues of approximately 6% in fiscal 2011 and an increase of 1% in fiscal 2012, respectively, with revenues remaining flat for fiscal years thereafter, and an annual pre-tax royalty savings rate of 20 basis points. If revenues in the future decline in excess of our assumptions or fail to increase or if the royalty savings rate declines, we may be required to record impairment charges.
For our Pathmark Trademark, based on the lower revenues within our Pathmark reporting unit coupled with lower near term profitability projections and lower estimated market royalty rate expectations due to current general economic conditions, we concluded that there was an interim triggering event during the third quarter of fiscal 2009. As a result, we determined that the carrying value exceeded the indicated fair value of the Pathmark Trademark, resulting in an impairment charge of $49.9 million. An additional $16.5 million of impairment was required during the fourth quarter of fiscal 2009 for a total impairment of $66.4 million recorded during fiscal 2009. We believe that our estimates are appropriate based upon our current assumptions. However, we may be required to record impairment charges in future periods if our revenues differ from our current projections.
During the third quarter of fiscal 2010, we also determined that we had a triggering event requiring us to evaluate the recoverability of our amortizable intangible assets for possible impairment. We evaluated the expected undiscounted cash flows of the Pathmark reporting unit compared to the book value of all long-lived assets, including intangible assets other than goodwill, noting no impairment of our amortizable intangible assets. Assumptions included a decline in revenues of approximately 10% and 1% in fiscals 2011 and 2012, respectively, with revenues remaining flat for fiscal years thereafter. Revenue assumptions did not include the impact of the 32 stores we closed in April 2011, as such closures were not known at that time. We assumed that the costs of disruption to our business resulting from our Bankruptcy Filing will be offset in fiscal 2011 by expected improvements with a continuation of improved costs in fiscal 2012 and thereafter. We assumed a growth rate for cash flow beginning in 2016 of 1.5%. Additionally, we assumed a terminal sale value for the Pathmark reporting unit at the end of the life of the primary asset. Future impairment charges could be required if our operating results in future periods differ from our current assumptions. The undiscounted value of the Pathmark reporting unit exceeded its carrying values by an excess of 30%.
We believe that our amortizable intangible assets are not impaired as of February 26, 2011. Amortization expense of these finite-lived Pathmark intangible assets for fiscal 2010, fiscal 2009 and fiscal 2008 was $10.7 million, $10.7 million and $9.2 million, respectively.
The following table summarizes the estimated future amortization expense for other intangible assets:
2011 10,725
2012 9,670
2013 6,505
2014 6,505
2015 6,505
Thereafter 36,178
Favorable Lease Rights
In connection with our acquisition of Pathmark in December 2007, we also acquired net favorable lease rights of $444.6 million, which had a balance of $386.2 million and $401.2 million as of February 26, 2011 and February 27, 2010, respectively, and were recorded in “Property, net” and “Other non-current liabilities” in our Consolidated Balance Sheets. Net favorable lease rights are amortized on a straight-line basis until the end of the lease options but not more than 25 years. The weighted average life remaining of the net favorable lease rights at February 26, 2011 is 17.1 years. Amortization expense related to the net favorable lease rights was $18.7 million, $20.1 million and $20.5 million for fiscal 2010, fiscal 2009 and fiscal 2008, respectively. Estimated annual amortization expense for the next five years is as follows: fiscal 2011 - $17.8 million, fiscal 2012 - $17.5 million, fiscal 2013 - $17.3 million, fiscal 2014 - $17.6 million and fiscal 2015 - $17.2 million.
NOTE 3 – Fair Value Measurements
The accounting guidance for fair value measurement defines and establishes a framework for measuring fair value. Inputs used to measure fair value are classified based on the following three-tier fair value hierarchy:
Level 1 – Quoted prices in active markets for identical assets or liabilities.
Level 2 – Directly or indirectly observable inputs other than Level 1 quoted prices in active markets. Our Level 2 liabilities include warrants, which are valued using the Black Scholes pricing model with inputs that are observable or can be derived from or corroborated by observable market data. In addition, our investments in money market funds, which are considered cash equivalents, are classified as Level 2, as they are valued based on their reported Net Asset Value (NAV).
Level 3 – Unobservable inputs that are supported by little or no market activity whose value is determined using pricing models, discounted cash flows, or similar methodologies, as well as instruments for which the determination of fair value requires significant judgment or estimation.
A financial asset or liability’s classification within the hierarchy is determined based on the lowest level input that is significant to the fair value measurement.
The following tables provide the assets and liabilities carried at fair value measured on a recurring basis as of February 26, 2011 and February 27, 2010:
|
Fair Value Measurements at Feb. 26, 2011 Using
|
||||||||||||||||
|
Quoted Prices
|
Significant Other
|
Significant
|
||||||||||||||
|
Total Carrying
|
in Active
|
Observable
|
Unobservable
|
|||||||||||||
|
Value at
|
Markets
|
Inputs
|
Inputs
|
|||||||||||||
|
Feb. 26, 2011
|
(Level 1)
|
(Level 2)
|
(Level 3)
|
|||||||||||||
|
Assets:
|
||||||||||||||||
|
Cash equivalents
|
$
|
1,553
|
$
|
-
|
$
|
1,553
|
$
|
-
|
||||||||
|
Liabilities:
|
||||||||||||||||
|
Series B Warrant
|
$
|
170
|
$
|
-
|
$
|
170
|
$
|
-
|
||||||||
|
Fair Value Measurements at Feb. 27, 2010 Using
|
||||||||||||||||
|
Quoted Prices
|
Significant Other
|
Significant
|
||||||||||||||
|
Total Carrying
|
in Active
|
Observable
|
Unobservable
|
|||||||||||||
|
Value at
|
Markets
|
Inputs
|
Inputs
|
|||||||||||||
|
Feb. 27, 2010
|
(Level 1)
|
(Level 2)
|
(Level 3)
|
|||||||||||||
|
Assets:
|
||||||||||||||||
|
Cash equivalents
|
$
|
158,695
|
$
|
-
|
$
|
158,695
|
$
|
-
|
||||||||
|
Liabilities:
|
||||||||||||||||
|
Series B Warrant
|
$
|
13,946
|
$
|
-
|
$
|
13,946
|
$
|
-
|
||||||||
Level 3 Valuations
We did not have any financial assets or liabilities classified as Level 3 within the fair value hierarchy at February 26, 2011 and February 27, 2010.
Nonfinancial Assets and Liabilities Measured on a Nonrecurring Basis
Fair value measurements of our nonfinancial assets and nonfinancial liabilities on a nonrecurring basis using Level 3 inputs are primarily used in the impairment analyses of our goodwill and other indefinite-lived intangible assets, our long-lived assets and closed store occupancy costs. We perform our annual review of goodwill and other intangible assets for impairment in the fourth quarter of each fiscal year unless an interim triggering event has occurred indicating the possibility of an impairment. Refer to Note 2 – Goodwill and Other Intangible Assets for further information relating to the carrying value of our goodwill and other intangible assets and the goodwill impairment charge recorded during fiscal 2009. Long-lived assets and closed store occupancy costs were measured at fair value on a nonrecurring basis using Level 3 inputs, as unobservable inputs were used to measure their fair value. Refer to Note 4 – Valuation of Long-Lived Assets, Note 5 – Discontinued Operations and Note 6 – Asset Disposition Initiatives for more information relating to the valuation of these assets and liabilities and the impairment of our long-lived assets.
Long-Term Debt
The following table provides the carrying values recorded on our balance sheet and the estimated fair values of financial instruments as of February 26, 2011 and February 27, 2010:
|
As of February 26, 2011
|
As of February 27, 2010
|
|||||||||||||||
|
Carrying Amount
|
Fair
Value
|
Carrying Amount
|
Fair
Value
|
|||||||||||||
|
Current portion of long-term debt
|
$ | 159 | $ | 159 | $ | 191 | $ | 191 | ||||||||
|
Long-term debt, net of related discount
|
1,255,225 | 765,577 | 990,359 | 962,040 | ||||||||||||
Refer to Note 9 – Indebtedness and Other Financial Liabilities for additional information.
NOTE 4 – Valuation of Long-Lived Assets
We review the carrying values of our long-lived assets for possible impairment whenever events or changes in circumstances indicate that the carrying amount of assets may not be recoverable. Such review is primarily based upon groups of assets and the undiscounted estimated future cash flows from such assets to determine if the carrying value of such assets is recoverable from their respective cash flows. If such review indicates impairment exists, we measure such impairment as the difference between the fair value and carrying value of the asset.
During fiscal 2010, fiscal 2009 and fiscal 2008, we recorded property impairment losses as follows:
|
Fiscal 2010
|
Fiscal 2009
|
Fiscal 2008
|
||||||||||||||||||||||||||||||||||
|
CO (1)
|
DO (1)
|
Total
|
CO (1)
|
DO (1)
|
Total
|
CO (1)
|
DO (1)
|
Total
|
||||||||||||||||||||||||||||
|
Impairments due to closure/
|
||||||||||||||||||||||||||||||||||||
|
conversion in the normal
|
||||||||||||||||||||||||||||||||||||
|
course of business (2)
|
$
|
7,166
|
$
|
526
|
$
|
7,692
|
$
|
6,469
|
$
|
-
|
$
|
6,469
|
$
|
14,069
|
$
|
-
|
$
|
14,069
|
||||||||||||||||||
|
Impairments due to store
|
||||||||||||||||||||||||||||||||||||
|
closures
|
56,165
|
-
|
56,165
|
-
|
-
|
-
|
-
|
-
|
-
|
|||||||||||||||||||||||||||
|
Impairments due to
|
||||||||||||||||||||||||||||||||||||
|
unrecoverable assets
|
45,318
|
-
|
45,318
|
65 ,235
|
-
|
65,235
|
-
|
-
|
-
|
|||||||||||||||||||||||||||
|
Subtotal
|
108,649
|
526
|
109,175
|
71,704
|
-
|
71,704
|
14,069
|
-
|
14,069
|
|||||||||||||||||||||||||||
|
Less amounts subject
|
||||||||||||||||||||||||||||||||||||
|
to compromise
|
-
|
-
|
-
|
-
|
-
|
-
|
-
|
-
|
-
|
|||||||||||||||||||||||||||
|
Total
|
$
|
108,649
|
$
|
526
|
$
|
109,175
|
$
|
71,704
|
$
|
-
|
$
|
71,704
|
$
|
14,069
|
$
|
-
|
$
|
14,069
|
||||||||||||||||||
|
(1)
|
The headings in the tables included above have been indexed with the following abbreviations: Continuing Operations (CO) and Discontinued Operations (DO).
|
|
(2)
|
We review assets in stores planned for closure or conversion in the normal course of business for impairment upon determination that such assets will not be used for their intended useful lives. Impairment losses on the related property and equipment are recorded within “Store operating, general and administrative expense” in our Consolidated Statements of Operations.
|
Impairments due to closure or conversion in the normal course of business
We review assets in stores planned for closure or conversion for impairment upon determination that such assets will not be used for their intended useful life. During fiscal 2010, we recorded impairment losses on long-lived assets of $7.2 million related to stores that were closed or converted in the normal course of business, as compared to $6.5 million in impairment losses recorded during fiscal 2009. These amounts were recorded within “Store operating, general and administrative expense” in our Consolidated Statements of Operations. In addition, we recorded $0.5 million due to a settlement of property related to our former New Orleans operations and recorded within “(Loss) gain on disposal of discontinued businesses”.
Impairments due to store closures
In February 2011, our company filed a motion seeking approval from the United States Trustee to close 32 stores in six states as we continue to fully implement our comprehensive financial and operational restructuring. As a result, we recorded an impairment charge of $31.4 million during fiscal 2010. These store closures were completed on April 16, 2011. This amount was recorded within “Goodwill, trademark, and long-lived asset impairment” in our Consolidated Statements of Operations.
In August 2010, our Company announced a plan to close 25 stores in five states as we began the implementation and execution phase of our comprehensive turnaround. The affected stores include locations in close proximity to other Company stores, those facing real estate and cost issues, and underperforming non-core stores. As a result, we recorded an impairment charge of $23.7 million during the second quarter of fiscal 2010. The store closures were completed in our Company’s third fiscal quarter. During the third quarter, we recorded an additional impairment charge of $1.1 million. This amount was recorded within “Goodwill, trademark, and long-lived asset impairment” in our Consolidated Statements of Operations.
Impairments due to unrecoverable assets
As a result of experiencing cash flow losses at certain stores, we determined that triggering events had occurred that required us to test the related long-lived assets for potential impairment. We recorded an impairment charge of $45.3 million during fiscal 2010 to partially write down these stores’ long-lived assets, which consist of favorable leases, capital leases, and land and buildings, with a carrying amount of $114.9 million to their fair value of $69.6 million for fiscal 2010. The impairment charge of $45.3 million recorded during fiscal 2010 all related to Pathmark with the exception of $0.9 million which related to SuperFresh. During fiscal 2009, we recorded an impairment charge of $65.2 million of which $62.9 million related to Pathmark and $2.3 million related to SuperFresh. These amounts were recorded within “Goodwill, trademark, and long-lived asset impairment” in our Consolidated Statements of Operations.
.
The effects of changes in estimates of useful lives were not material to our ongoing depreciation expense. If current operating levels do not improve, there may be a need to take further actions which may result in additional future impairments on long-lived assets, including the potential for impairment of assets that are held and used.
NOTE 5 –– Discontinued Operations
We have had multiple transactions throughout the years which met the criteria for discontinued operations. These events are described based on the year the transaction was initiated.
2007 Events
On May 30, 2007, our Company announced advanced negotiations for the sale of our non-core stores located within the Greater New Orleans area, including inventory related to these stores. Our Company ceased sales operations in all stores not sold as of November 1, 2007. Planned sale transactions for these stores have been completed resulting in a loss on disposal of $16.5 million during fiscal 2007.
On April 24, 2007, based upon unsatisfactory operating trends and the need to devote resources to our expanding Northeast core business, our Company announced negotiations for the sale of our non-core stores within our Midwest operations, including inventory related to these stores. Our Company ceased sales operations in all stores not sold as of July 7, 2007. Planned sale transactions for these stores have been completed, resulting in a loss on disposal of $34.3 million during fiscal 2007.
2005 Event
During the first quarter of fiscal 2005, we announced plans for a major strategic restructuring that would consolidate efforts in the Midwest. Thus, we initiated efforts to close a total of 35 stores in the Midwest, all of which were closed as of February 25, 2006.
2003 Events
During fiscal 2003, we adopted a formal plan to exit the Wisconsin markets through the sale and/or disposal of these assets. In February 2003, we announced the sale of a portion of our non-core assets, including seven stores in Madison, Wisconsin and 23 stores in Milwaukee, Wisconsin. Also in fiscal 2003, we announced an initiative to close 6 stores and convert 13 stores to our Food Basics banner in the Detroit, Michigan and Toledo, Ohio markets.
Summarized below are the operating results for these discontinued businesses, which are included in our Consolidated Statements of Operations, under the captions “Loss from operations of discontinued businesses, net of tax”, “(Loss) gain on disposal of discontinued businesses, net of tax”, and “Reorganization items” for fiscal 2010, fiscal 2009 and fiscal 2008.
|
Fiscal 2010
|
Fiscal 2009
|
Fiscal 2008
|
||||||||||
|
Loss from operations of discontinued businesses
|
||||||||||||
|
Sales
|
$
|
-
|
$
|
-
|
$
|
-
|
||||||
|
Loss from operations of discontinued businesses, before tax
|
(57,992
|
)
|
(95,848
|
)
|
(58,383
|
)
|
||||||
|
Tax benefit
|
-
|
-
|
-
|
|||||||||
|
Loss from operations of discontinued businesses, net of tax
|
$
|
(57,992
|
)
|
$
|
(95,848
|
)
|
$
|
(58,383
|
)
|
|||
|
(Loss) Gain on disposal of discontinued businesses
|
||||||||||||
|
Property impairments
|
$
|
(526
|
)
|
$
|
-
|
$
|
-
|
|||||
|
Gain on sale of fixed assets
|
79
|
-
|
4,653
|
|||||||||
|
(Loss) Gain on disposal of discontinued operations, before tax
|
(447
|
)
|
-
|
4,653
|
||||||||
|
Tax benefit
|
-
|
-
|
-
|
|||||||||
|
(Loss) Gain on disposal of discontinued operations, net of tax
|
$
|
(447
|
)
|
$
|
-
|
$
|
4,653
|
|||||
|
Reorganization items
|
||||||||||||
|
Reorganization items
|
$
|
133,264
|
$
|
-
|
$
|
-
|
||||||
|
Provision for income taxes
|
-
|
-
|
-
|
|||||||||
|
Reorganization items
|
$
|
133,264
|
$
|
-
|
$
|
-
|
||||||
Summarized below is a reconciliation of the liabilities related to restructuring obligations resulting from these activities.
|
Fiscal 2010
|
||||||||||||||||||||
|
Balance at
|
Interest
|
Balance at
|
||||||||||||||||||
|
2/27/2010
|
Accretion (1)
|
Adjustments(2)
|
Utilization(3)
|
2/26/2011
|
||||||||||||||||
|
2007 Events
|
||||||||||||||||||||
|
Occupancy
|
$
|
96,909
|
$
|
6,176
|
$
|
(42,208
|
)
|
$
|
(11,560
|
)
|
$
|
49,317
|
||||||||
|
Pension withdrawal
|
58,015
|
3,568
|
-
|
(4,002
|
)
|
57,581
|
||||||||||||||
|
2007 events total
|
154,924
|
9,744
|
(42,208
|
)
|
(15,562
|
)
|
106,898
|
|||||||||||||
|
2005 Event
|
||||||||||||||||||||
|
Occupancy
|
58,974
|
2,552
|
(36,481
|
)
|
(3,655
|
)
|
21,390
|
|||||||||||||
|
2003 Events
|
||||||||||||||||||||
|
Occupancy
|
22,494
|
1,098
|
(13,804
|
)
|
(1,337
|
)
|
8,451
|
|||||||||||||
|
Fiscal 2010 total
|
$
|
236,392
|
$
|
13,394
|
$
|
(92,493
|
)
|
$
|
(20,554
|
)
|
$
|
136,739
|
||||||||
|
Fiscal 2009
|
||||||||||||||||||||
|
Balance at
|
Interest
|
Balance at
|
||||||||||||||||||
|
2/28/2009
|
Accretion (1)
|
Adjustments(2)
|
Utilization(3)
|
2/27/2010
|
||||||||||||||||
|
2007 Events
|
||||||||||||||||||||
|
Occupancy
|
$
|
70,583
|
$
|
8,974
|
$
|
46,075
|
$
|
(28,723
|
)
|
$
|
96,909
|
|||||||||
|
Pension withdrawal
|
59,239
|
3,674
|
37
|
(4,935
|
)
|
58,015
|
||||||||||||||
|
2007 events total
|
129,822
|
12,648
|
46,112
|
(33,658
|
)
|
154,924
|
||||||||||||||
|
2005 Event
|
||||||||||||||||||||
|
Occupancy
|
60,327
|
3,291
|
5,916
|
(10,560
|
)
|
58,974
|
||||||||||||||
|
2003 Events
|
||||||||||||||||||||
|
Occupancy
|
18,712
|
1,194
|
5,814
|
(3,226
|
)
|
22,494
|
||||||||||||||
|
Fiscal 2009 total
|
$
|
208,861
|
$
|
17,133
|
$
|
57,842
|
$
|
(47,444
|
)
|
$
|
236,392
|
|||||||||
|
Fiscal 2008
|
||||||||||||||||||||
|
Balance at
|
Interest
|
Balance at
|
||||||||||||||||||
|
2/23/2008
|
Accretion (1)
|
Adjustments(2)
|
Utilization(3)
|
2/28/2009
|
||||||||||||||||
|
2007 Events
|
||||||||||||||||||||
|
Occupancy
|
$
|
62,873
|
$
|
9,382
|
$
|
28,959
|
$
|
(30,631
|
)
|
$
|
70,583
|
|||||||||
|
Severance and pension withdrawal
|
58,520
|
2,019
|
3,730
|
(5,030
|
)
|
59,239
|
||||||||||||||
|
2007 events total
|
121,393
|
11,401
|
32,689
|
(35,661
|
)
|
129,822
|
||||||||||||||
|
2005 Event
|
||||||||||||||||||||
|
Occupancy
|
66,882
|
3,324
|
600
|
(10,479
|
)
|
60,327
|
||||||||||||||
|
2003 Events
|
||||||||||||||||||||
|
Occupancy
|
21,579
|
1,230
|
(902
|
)
|
(3,195
|
)
|
18,712
|
|||||||||||||
|
Fiscal 2008 total
|
$
|
209,854
|
$
|
15,955
|
$
|
32,387
|
$
|
(49,335
|
)
|
$
|
208,861
|
|||||||||
|
|
(1)
|
The additions to occupancy and severance represents the interest accretion on future occupancy costs and future obligations for early withdrawal from multi-employer union pension plans which were recorded at present value at the time of the original charge. Interest accretion is recorded as a component of “Loss from operations of discontinued businesses” on the Consolidated Statements of Operations.
|
|
|
(2)
|
At each balance sheet date, we assess the adequacy of the balance of the remaining liability to determine if any adjustments are required as a result of changes in circumstances and/or estimates. Adjustments are recorded as a component of “Loss from operations of discontinued businesses” on the Consolidated Statements of Operations.
|
|
|
Fiscal 2010
|
|
|
During fiscal 2010, we recorded adjustments for the 2007, 2005, and 2003 events to reduce occupancy liabilities by $42.2 million, $36.5 million and $13.8 million, respectively, primarily due to an estimated allowable claim amount for property leases that were rejected in bankruptcy court during the fourth quarter.
|
|
|
Fiscal 2009
|
|
|
The charge to occupancy for the 2007, 2005 and 2003 events represents adjustments for additional occupancy related costs of $46.1 million, $5.9 million and $5.8 million, respectively, due to changes in our estimation of such future costs due to the continuing deteriorating economic conditions in the Midwest real estate market including the recent bankruptcies in the auto industry. We now expect our occupancy costs to be higher as the current economic conditions affecting the Midwest real estate market are expected to persist for some time and subleased properties in the area have been occurring at heavily discounted rates as compared to the related contractual agreements.
|
|
|
Fiscal 2008
|
|
|
The charge to occupancy for the 2007 and 2005 events represents adjustments for additional occupancy related costs for our properties of $29.0 million and $0.6 million, respectively, due to changes in our estimation of such future costs due to continuing deteriorating conditions in the Midwest real estate market. The charge to severance for the 2007 events represents an adjustment of $3.7 million for future obligations for early withdrawal from multi-employer union pension plans. We also recorded an adjustment of $0.9 million to reduce occupancy related costs for the 2003 events due to changes in our estimation of such future costs.
|
|
|
(3)
|
Occupancy utilization represents payments made during those periods for rent. Severance utilization represents payments made to terminated employees during the period.
|
Summarized below are the payments made to date from the time of the original charge and expected future payments related to these events:
|
2007
|
2005
|
2003
|
||||||||||||||
|
Events
|
Event
|
Event
|
Total
|
|||||||||||||
|
Total severance payments made to date
|
$
|
37,089
|
$
|
2,650
|
$
|
22,528
|
$
|
62,267
|
||||||||
|
Expected future pension withdrawal payments
|
57,581
|
-
|
-
|
57,581
|
||||||||||||
|
Total severance and pension withdrawal payments
|
$
|
94,670
|
$
|
2,650
|
$
|
22,528
|
$
|
119,848
|
||||||||
|
expected to be incurred
|
||||||||||||||||
|
Total occupancy payments made to date
|
$
|
92,140
|
$
|
60,866
|
$
|
34,084
|
$
|
187,090
|
||||||||
|
Expected future occupancy payments,
|
||||||||||||||||
|
excluding interest accretion
|
49,317
|
21,390
|
8,451
|
79,158
|
||||||||||||
|
Total occupancy payments expected to be incurred,
|
||||||||||||||||
|
excluding interest accretion
|
$
|
141,457
|
$
|
82,256
|
$
|
42,535
|
$
|
266,248
|
||||||||
|
Total severance and occupancy payments made to date
|
$
|
129,229
|
$
|
63,516
|
$
|
56,612
|
$
|
249,357
|
||||||||
|
Expected future pension withdrawal and occupancy payments
|
||||||||||||||||
|
expected to be incurred, excluding interest accretion
|
106,898
|
21,390
|
8,451
|
136,739
|
||||||||||||
|
Total severance, pension withdrawal and occupancy payments
|
||||||||||||||||
|
expected to be incurred, excluding interest accretion
|
$
|
236,127
|
$
|
84,906
|
$
|
65,063
|
$
|
386,096
|
||||||||
Payments to date were primarily for occupancy related costs such as rent, common area maintenance, real estate taxes, lease termination costs, severance, and benefits. The remaining obligation relates to expected future payments under long term leases and expected future payments for early withdrawal from multi-employer union pension plans. The expected completion dates for the 2007, 2005, and 2003 events are 2028, 2012, and 2020, respectively.
Summarized below are the amounts included in our balance sheet captions on our Company’s Consolidated Balance Sheets related to these events:
|
February 26, 2011
|
||||||||||||||||
|
2007
|
2005
|
2003
|
||||||||||||||
|
Events
|
Event
|
Event
|
Total
|
|||||||||||||
|
Other accruals
|
$
|
-
|
$
|
-
|
$
|
-
|
$
|
-
|
||||||||
|
Other non-current liabilities
|
$
|
-
|
$
|
-
|
$
|
-
|
$
|
-
|
||||||||
|
Liabilities Subject to compromise
|
$
|
106,898
|
$
|
21,390
|
$
|
8,451
|
$
|
136,739
|
||||||||
|
February 27, 2010
|
||||||||||||||||
|
2007
|
2005
|
2003
|
||||||||||||||
|
Events
|
Event
|
Event
|
Total
|
|||||||||||||
|
Other accruals
|
$
|
28,528
|
$
|
10,773
|
$
|
3,490
|
$
|
42,791
|
||||||||
|
Other non-current liabilities
|
$
|
126,396
|
$
|
48,201
|
$
|
19,004
|
$
|
193,601
|
||||||||
We evaluated the reserve balances as of February 26, 2011 based on current information and have concluded that they are adequate to cover future costs. We will continue to monitor the status of the vacant and subsidized properties, severance and benefits, and pension withdrawal liabilities, and adjustments to the reserve balances may be recorded in the future, if necessary.
NOTE 6 – Asset Disposition Initiatives
In addition to the events described in Note 5 – Discontinued Operations, there were restructuring transactions which were not primarily related to our discontinued operations businesses. These events are referred to based on the year the transaction was initiated, as described below.
Restructuring charges relate principally to employee severance and occupancy costs resulting from the closure of facilities and other workforce reductions attributable to our efforts to reduce costs. The costs of these reductions have been and will be funded through cash from operations. Occupancy costs represent facility consolidation and lease termination costs associated with our decision to consolidate and close duplicative or excess warehouse and office facilities, unproductive and excess facilities and the continued softening of real estate markets, which resulted in lower than expected sublease income.
2011 Event
In February 2011, our company filed a motion seeking approval from the United States Trustee to close 32 stores in six states as we continue to fully implement our comprehensive financial and operational restructuring. As a result, we recorded a charge for severance and benefits of $2.7 million and impairment charges of $31.4 million in the fourth quarter. Refer to Note 4 – Valuation of Long-Lived Assets. These store closures were completed on April 16, 2011. An occupancy charge for these stores will be recorded in the first quarter of fiscal 2011.
2010 Event
In August 2010, our Company announced a plan to close 25 stores in five states as we began the implementation and execution phase of our comprehensive turnaround. The affected stores include locations in close proximity to other Company stores, those facing real estate and cost issues, and underperforming non-core stores. As a result, we recorded a charge for severance and benefits of $1.3 million during the second quarter of fiscal 2010 and impairment of $23.7 million. The store closures were completed in our Company’s fiscal third quarter. During the third quarter of fiscal 2010, we recorded an additional impairment charge of $1.1 million. Refer to Note 4 – Valuation of Long-Lived Assets. Our Company also recorded a charge for occupancy costs of $55.0 million associated with vacant leases for 20 of these locations, partially offset by net proceeds of $4.0 million for five locations that were assigned or terminated and balance sheet reclassifications of $2.6 million for prepaid rent and real estate tax accounts.
2005 Event
During fiscal 2005, our Company sold our U.S. distribution operations and some warehouse facilities and related assets to C&S Wholesale Grocers, Inc. The Asset Purchase Agreement included the assignment of our leases in Central Islip, New York and Baltimore, Maryland, and a warranty deed for our owned facilities in Dunmore, Pennsylvania.
2001 Event
During the third quarter of fiscal 2001, our Company determined that certain underperforming operations, including 39 stores (30 in the United States and 9 in Canada) and 3 warehouses (2 in the United States and 1 in Canada) should be closed and/or sold, and certain administrative streamlining should take place.
1998 Event
In May 1998, we initiated an assessment of our business operations in order to identify the factors that were impacting our performance. As a result of this assessment, in fiscal 1998 and 1999, we announced a plan to close two warehouse facilities and a coffee plant in the U.S., a bakery plant in Canada and 166 stores (156 in the United States and 10 in Canada) including the exit of the Richmond, Virginia and Atlanta, Georgia markets.
Summarized below is a reconciliation of the liabilities related to restructuring obligations resulting from these activities:
|
Fiscal 2010
|
||||||||||||||||||||
|
Balance at
|
Interest
|
Balance at
|
||||||||||||||||||
|
2/27/2010
|
Accretion (1)
|
Adjustments(2)
|
Utilization(3)
|
2/26/2011
|
||||||||||||||||
|
2010 Event
|
||||||||||||||||||||
|
Continuing Operations
|
||||||||||||||||||||
|
Occupancy
|
$
|
-
|
$
|
356
|
$
|
29,786
|
$
|
(789
|
)
|
$
|
29,353
|
|||||||||
|
Health benefits
|
-
|
-
|
772
|
(533
|
)
|
239
|
||||||||||||||
|
2010 event total
|
-
|
356
|
30,558
|
(1,322
|
)
|
29,592
|
||||||||||||||
|
|
||||||||||||||||||||
|
2005 Event
|
||||||||||||||||||||
|
Continuing Operations
|
||||||||||||||||||||
|
Health benefits
|
687
|
-
|
-
|
(242
|
)
|
445
|
||||||||||||||
|
2005 event total
|
687
|
-
|
-
|
(242
|
)
|
445
|
||||||||||||||
|
2001 Event
|
||||||||||||||||||||
|
Continuing Operations
|
||||||||||||||||||||
|
Occupancy
|
6,324
|
308
|
(4,126
|
)
|
(379
|
)
|
2,127
|
|||||||||||||
|
Discontinued Operations
|
||||||||||||||||||||
|
Occupancy
|
10,009
|
435
|
(7,548
|
)
|
(1,122
|
)
|
1,774
|
|||||||||||||
|
2001 event total
|
16,333
|
743
|
(11,674
|
)
|
(1,501
|
)
|
3,901
|
|||||||||||||
|
1998 Event
|
||||||||||||||||||||
|
Continuing Operations
|
||||||||||||||||||||
|
Occupancy
|
4,098
|
69
|
-
|
(767
|
)
|
3,400
|
||||||||||||||
|
Pension withdrawals and health benefits
|
666
|
-
|
-
|
(142
|
)
|
524
|
||||||||||||||
|
Discontinued Operations
|
||||||||||||||||||||
|
Occupancy
|
13
|
-
|
-
|
(13
|
)
|
-
|
||||||||||||||
|
1998 event total
|
4,777
|
69
|
-
|
(922
|
)
|
3,924
|
||||||||||||||
|
Fiscal 2010 total
|
$
|
21,797
|
$
|
1,168
|
$
|
18,884
|
$
|
(3,987
|
)
|
$
|
37,862
|
|||||||||
|
Fiscal 2009
|
||||||||||||||||||||
|
Balance at
|
Interest
|
Balance at
|
||||||||||||||||||
|
2/28/2009
|
Accretion (1)
|
Adjustments(2)
|
Utilization(3)
|
2/27/2010
|
||||||||||||||||
|
2005 Event
|
||||||||||||||||||||
|
Continuing Operations
|
||||||||||||||||||||
|
Occupancy
|
$
|
1,114
|
$
|
11
|
$
|
(1,120
|
)
|
$
|
(5
|
)
|
$
|
-
|
||||||||
|
Health benefits
|
904
|
-
|
63
|
(280
|
)
|
687
|
||||||||||||||
|
2005 event total
|
2,018
|
11
|
(1,057
|
)
|
(285
|
)
|
687
|
|||||||||||||
|
2001 Event
|
||||||||||||||||||||
|
Continuing Operations
|
||||||||||||||||||||
|
Occupancy
|
7,080
|
452
|
284
|
(1,492
|
)
|
6,324
|
||||||||||||||
|
Discontinued Operations
|
||||||||||||||||||||
|
Occupancy
|
11,307
|
618
|
4
|
(1,920
|
)
|
10,009
|
||||||||||||||
|
2001 event total
|
18,387
|
1,070
|
288
|
(3,412
|
)
|
16,333
|
||||||||||||||
|
1998 Event
|
||||||||||||||||||||
|
Continuing Operations
|
||||||||||||||||||||
|
Occupancy
|
8,696
|
221
|
(1,398
|
)
|
(3,421
|
)
|
4,098
|
|||||||||||||
|
Health benefits
|
824
|
-
|
-
|
(158
|
)
|
666
|
||||||||||||||
|
Discontinued Operations
|
||||||||||||||||||||
|
Occupancy
|
543
|
16
|
-
|
(546
|
)
|
13
|
||||||||||||||
|
1998 event total
|
10,063
|
237
|
(1,398
|
)
|
(4,125
|
)
|
4,777
|
|||||||||||||
|
Fiscal 2009 total
|
$
|
30,468
|
$
|
1,318
|
$
|
(2,167
|
)
|
$
|
(7,822
|
)
|
$
|
21,797
|
||||||||
|
Fiscal 2008
|
||||||||||||||||||||
|
Balance at
|
Interest
|
Balance at
|
||||||||||||||||||
|
2/23/2008
|
Accretion (1)
|
Adjustments(2)
|
Utilization(3)
|
2/28/2009
|
||||||||||||||||
|
2005 Event
|
||||||||||||||||||||
|
Continuing Operations
|
||||||||||||||||||||
|
Occupancy
|
$
|
1,231
|
$
|
48
|
$
|
(91
|
)
|
$
|
(74
|
)
|
$
|
1,114
|
||||||||
|
Health benefits
|
1,686
|
-
|
-
|
(782
|
)
|
904
|
||||||||||||||
|
2005 event total
|
2,917
|
48
|
(91
|
)
|
(856
|
)
|
2,018
|
|||||||||||||
|
2001 Event
|
||||||||||||||||||||
|
Continuing Operations
|
||||||||||||||||||||
|
Occupancy
|
6,755
|
385
|
1,794
|
(1,854
|
)
|
7,080
|
||||||||||||||
|
Discontinued Operations
|
||||||||||||||||||||
|
Occupancy
|
12,281
|
688
|
(166
|
)
|
(1,496
|
)
|
11,307
|
|||||||||||||
|
2001 event total
|
19,036
|
1,073
|
1,628
|
(3,350
|
)
|
18,387
|
||||||||||||||
|
1998 Event
|
||||||||||||||||||||
|
Continuing Operations
|
||||||||||||||||||||
|
Occupancy
|
6,958
|
316
|
4,111
|
(2,689
|
)
|
8,696
|
||||||||||||||
|
Health benefits
|
1,000
|
-
|
-
|
(176
|
)
|
824
|
||||||||||||||
|
Discontinued Operations
|
||||||||||||||||||||
|
Occupancy
|
1,093
|
49
|
(8
|
)
|
(591
|
)
|
543
|
|||||||||||||
|
1998 event total
|
9,051
|
365
|
4,103
|
(3,456
|
)
|
10,063
|
||||||||||||||
|
Fiscal 2008 total
|
$
|
31,004
|
$
|
1,486
|
$
|
5,640
|
$
|
(7,662
|
)
|
$
|
30,468
|
|||||||||
|
(1)
|
Represents the interest accretion on future occupancy costs which were recorded at present value at the time of the original charge. These adjustments are recorded in “Store operating, general and administrative expense” for continuing operations and “Gain (loss) from operations of discontinued businesses” for discontinued businesses on our Consolidated Statements of Operations.
|
|
(2)
|
At each balance sheet date, we assess the adequacy of the balance to determine if any adjustments are required as a result of changes in circumstances and/or estimates. These adjustments are recorded in “Store operating, general and administrative expense” for continuing operations and “Gain (loss) from operations of discontinued businesses” as noted for discontinued operations on our Consolidated Statements of Operations.
|
Fiscal 2010
During fiscal 2010, we recorded an initial occupancy charge for the 2010 event of $55.0 million which increased by $13.4 million due to balance sheet reclassifications for real estate liability accounts, partially offset by an adjustment of $38.6 million to reduce the occupancy liabilities to an estimated allowable claim amount due to property leases that were rejected in the Bankruptcy Court during the fourth quarter. In addition, we recorded an initial severance charge of $1.3 million which was reduced by $0.5 million. We also recorded an adjustment for the 2001 event of $11.7 million to reduce the occupancy liabilities to an estimated allowable claim amount due to property leases that were rejected in Bankruptcy Court.
Fiscal 2009
During fiscal 2009, we recorded a $1.1 million adjustment to eliminate occupancy related costs due to the termination of the lease on the one remaining property included in the 2005 event. We increased occupancy related costs for the 2001 event by $0.3 million due to changes in our estimation of such future costs. Occupancy related costs for the 1998 event were reduced by $1.4 million primarily due to entering into new sublease agreements that were more favorable than our original estimates.
Fiscal 2008
During fiscal 2008, we recorded an adjustment reducing occupancy related costs by $0.1 million for the 2005 event due to changes in our estimation of such future costs. We also recorded adjustments for additional occupancy related costs of $1.6 million and $4.1 million, respectively, for the 2001 and 1998 events due to changes in our estimation of such future costs.
|
|
(3)
|
Occupancy utilization represents payments made during those periods for rent. Severance and benefits utilization represents payments made to terminated employees during the period.
|
Summarized below are the payments made to date from the time of the original charge and expected future payments related to these events:
|
2010
|
2005
|
2001
|
1998
|
|||||||||||||||||
|
Event
|
Event
|
Event
|
Event
|
Total
|
||||||||||||||||
|
Total severance payments made to date
|
$
|
533
|
$
|
49,237
|
$
|
28,205
|
$
|
30,940
|
$
|
108,915
|
||||||||||
|
Expected future severance payments
|
239
|
445
|
-
|
524
|
1,208
|
|||||||||||||||
|
Total severance payments expected
|
||||||||||||||||||||
|
to be incurred
|
$
|
772
|
$
|
49,682
|
$
|
28,205
|
$
|
31,464
|
$
|
110,123
|
||||||||||
|
Total occupancy payments made to date
|
$
|
789
|
$
|
13,856
|
$
|
67,283
|
$
|
119,972
|
$
|
201,900
|
||||||||||
|
Expected future occupancy payments,
|
||||||||||||||||||||
|
excluding interest accretion
|
29,353
|
-
|
3,901
|
3,400
|
36,654
|
|||||||||||||||
|
Total occupancy payments expected
|
||||||||||||||||||||
|
to be incurred, excluding interest
|
||||||||||||||||||||
|
accretion
|
$
|
30,142
|
$
|
13,856
|
$
|
71,184
|
$
|
123,372
|
$
|
238,554
|
||||||||||
|
Total severance and occupancy
|
||||||||||||||||||||
|
payments made to date
|
$
|
1,322
|
$
|
63,093
|
$
|
95,488
|
$
|
150,912
|
$
|
310,815
|
||||||||||
|
Expected future severance and
|
||||||||||||||||||||
|
occupancy payments, excluding
|
||||||||||||||||||||
|
interest accretion
|
29,592
|
445
|
3,901
|
3,924
|
37,862
|
|||||||||||||||
|
Total severance and occupancy payments
|
||||||||||||||||||||
|
expected to be incurred, excluding
|
||||||||||||||||||||
|
interest accretion
|
$
|
30,914
|
$
|
63,538
|
$
|
99,389
|
$
|
154,836
|
$
|
348,677
|
||||||||||
Payments to date were primarily for occupancy related costs such as rent, common area maintenance, real estate taxes, lease termination costs, severance, and benefits. The remaining obligation relates to expected future payments under long-term leases and expected future payments for early withdrawal from multi-employer union pension plans. The expected completion dates for the 2010, 2005, 2001 and 1998 events are 2012, 2015, 2012 and 2020, respectively.
Summarized below are the amounts included in our balance sheet captions on our Company’s Consolidated Balance Sheets related to these events:
|
February 26, 2011
|
||||||||||||||||||||
|
2010
|
2005
|
2001
|
1998
|
|||||||||||||||||
|
Event
|
Event
|
Event
|
Event
|
Total
|
||||||||||||||||
|
Other accruals
|
$ | - | $ | - | $ | - | $ | - | $ | - | ||||||||||
|
Other non-current liabilities
|
$ | - | $ | - | $ | - | $ | - | $ | - | ||||||||||
|
Liabilities subject to compromise
|
$ | 29,592 | $ | 445 | $ | 3,901 | $ | 3,924 | $ | 37,862 | ||||||||||
|
February 27, 2010
|
||||||||||||||||||||
| 2005 | 2001 | 1998 | ||||||||||||||||||
|
Event
|
Event
|
Event
|
Total
|
|||||||||||||||||
|
Other accruals
|
$ | 336 | $ | 2,992 | $ | 2,235 | $ | 5,563 | ||||||||||||
|
Other non-current liabilities
|
$ | 351 | $ | 13,341 | $ | 2,542 | $ | 16,234 | ||||||||||||
We evaluated the reserve balances as of February 26, 2011 based on current information and have concluded that they are adequate to cover future costs. We will continue to monitor the status of the vacant and subsidized properties, severance and benefits, and pension withdrawal liabilities, and adjustments to the reserve balances may be recorded in the future, if necessary.
NOTE 7 – Other Accruals
Other accruals are comprised of the following:
|
At
Feb. 26, 2011
|
At
Feb. 27, 2010
|
|||||||||||||||
|
Other Accruals
Prior toFinancial Statement
Classification |
Amounts
Classified as Subject to |
Other
Accruals |
Other
Accruals |
|||||||||||||
|
Self-insurance reserves
|
$
|
47,792
|
$
|
(45,466
|
)
|
$
|
2,326
|
$
|
74,221
|
|||||||
|
Deferred taxes
|
28,335
|
-
|
28,335
|
3,295
|
||||||||||||
|
Closed store and warehouse reserves
|
118,000
|
(118,000
|
)
|
-
|
62,189
|
|||||||||||
|
Pension withdrawal liabilities
|
10,461
|
(10,461
|
)
|
-
|
10,461
|
|||||||||||
|
GHI contractual liability for employee benefits
|
7,776
|
(7,776
|
)
|
-
|
8,066
|
|||||||||||
|
Accrued occupancy related costs for open stores
|
48,742
|
(24,523
|
)
|
24,219
|
26,952
|
|||||||||||
|
Deferred income
|
23,299
|
(21,363
|
)
|
1,936
|
26,534
|
|||||||||||
|
Deferred real estate income
|
2,508
|
(2,508
|
)
|
-
|
2,775
|
|||||||||||
|
Accrued audit, legal and other
|
11,777
|
(8,118
|
)
|
3,659
|
8,758
|
|||||||||||
|
Accrued interest
|
35,600
|
(33,921
|
)
|
1,679
|
12,509
|
|||||||||||
|
Other postretirement and postemployment benefits
|
2,918
|
(2,918
|
)
|
-
|
2,674
|
|||||||||||
|
Accrued advertising
|
718
|
-
|
718
|
1,911
|
||||||||||||
|
Dividends payable on preferred stock
|
-
|
-
|
-
|
2,982
|
||||||||||||
|
Other
|
10,181
|
(8,005
|
)
|
2,176
|
3,189
|
|||||||||||
|
Total
|
$
|
348,107
|
$
|
(283,059
|
)
|
$
|
65,048
|
$
|
246,516
|
|||||||
(1) Refer to Note 10 – Liabilities subject to compromise for additional information.
NOTE 8 – Other Non-Current Liabilities
Other non-current liabilities are comprised of the following:
|
At
|
At
|
|||||||||||||||
|
Feb. 26, 2011
|
Feb. 27, 2010
|
|||||||||||||||
|
Non-Current
Liabilities Prior to |
Amounts
Classified as |
Other Non-
Current |
Other Non-
Current |
|||||||||||||
|
Classification
|
Compromise(1)
|
Liabilities
|
Liabilities
|
|||||||||||||
|
Deferred taxes
|
$
|
-
|
$
|
-
|
$
|
-
|
$
|
11,367
|
||||||||
|
Self-insurance reserves
|
366,891
|
(354,704
|
)
|
12,187
|
217,962
|
|||||||||||
|
Closed store and warehouse reserves
|
39,192
|
(39,192
|
)
|
-
|
187,911
|
|||||||||||
|
Pension withdrawal liabilities
|
86,735
|
(86,735
|
)
|
-
|
89,495
|
|||||||||||
|
GHI contractual liability for employee benefits
|
86,505
|
(86,505
|
)
|
-
|
87,703
|
|||||||||||
|
Pension plan benefits
|
125,000
|
(125,000
|
)
|
-
|
109,549
|
|||||||||||
|
Other postretirement and postemployment benefits
|
38,737
|
(38,737
|
)
|
-
|
36,091
|
|||||||||||
|
Loans on life insurance policies
|
61,943
|
-
|
61,943
|
60,436
|
||||||||||||
|
Deferred rent liabilities
|
56,287
|
(56,287
|
)
|
-
|
57,963
|
|||||||||||
|
Deferred income
|
53,031
|
(53,031
|
)
|
-
|
68,250
|
|||||||||||
|
Unfavorable lease liabilities
|
4,201
|
(4,201
|
)
|
-
|
5,391
|
|||||||||||
|
Other
|
11,348
|
(11,316
|
)
|
32
|
13,634
|
|||||||||||
|
Total
|
$
|
929,870
|
$
|
(855,708
|
)
|
$
|
74,162
|
$
|
945,752
|
|||||||
(1) Refer to Note 10 – Liabilities subject to compromise for additional information.
NOTE 9 – Indebtedness and Other Financial Liabilities
Our debt consists of the following:
|
At
|
At
|
|||||||||||||||
|
Feb. 26, 2011
|
Feb. 27, 2010
|
|||||||||||||||
|
Indebtedness and
|
||||||||||||||||
|
Other Financial
|
||||||||||||||||
|
Liabilities Prior
|
Amounts
|
Indebtedness
|
Indebtedness
|
|||||||||||||
|
to Financial Statement
|
Classified as Subject to
|
and Other Financial
|
and Other Financial
|
|||||||||||||
|
Classification
|
Compromise(1)
|
Liabilities
|
Liabilities
|
|||||||||||||
|
Debtor-in-Possession Credit Agreement, due June 14, 2012
|
$
|
350,000
|
$
|
-
|
$
|
350,000
|
$
|
-
|
||||||||
|
Related Party Promissory Note, due August 18, 2011
|
10,000
|
(10,000
|
)
|
-
|
10,000
|
|||||||||||
|
5.125% Convertible Senior Notes, due June 15, 2011
|
165,000
|
(165,000
|
)
|
-
|
155,333
|
|||||||||||
|
9.125% Senior Notes, due December 15, 2011
|
12,840
|
(12,840
|
)
|
-
|
12,840
|
|||||||||||
|
6.750% Convertible Senior Notes, due December 15, 2012
|
255,000
|
(255,000
|
)
|
-
|
223,838
|
|||||||||||
|
11.375% Senior Secured Notes, due August 4, 2015
|
260,000
|
(260,000
|
)
|
-
|
253,668
|
|||||||||||
|
9.375% Notes, due August 1, 2039
|
200,000
|
(200,000
|
)
|
-
|
200,000
|
|||||||||||
|
Borrowings under Credit Agreement
|
-
|
-
|
-
|
132,900
|
||||||||||||
|
Other
|
2,544
|
(2,544
|
)
|
-
|
1,971
|
|||||||||||
|
Subtotal
|
1,255,384
|
(905,384
|
)
|
350,000
|
990,550
|
|||||||||||
|
Less current portion of long-term debt
|
(159
|
)
|
159
|
-
|
(191
|
)
|
||||||||||
|
Long-term debt
|
$
|
1,255,225
|
$
|
(905,225
|
)
|
$
|
350,000
|
$
|
990,359
|
|||||||
(1) Refer to Note 10 – Liabilities subject to compromise for additional information.
DEBTOR-IN-POSSESSION CREDIT AGREEMENT
In connection with the Bankruptcy Filing, on December 13, 2010, the Bankruptcy Court entered its interim financing order, among other things, permitting us to enter into a Superpriority Debtor-in-Possession Credit Agreement (as amended and restated by that certain Amended and Restated Superpriority Debtor-in-Possession Credit Agreement dated as of December 21, 2010 and further amended by that certain First Amendment thereto dated January 10, 2011, the “DIP Credit Agreement”) with JPMorgan Chase Bank, N.A., as administrative agent and as collateral agent (in such capacity, the “Agent”), the lenders from time to time party thereto (collectively, the “DIP Lenders”) and our Company and certain subsidiaries as borrowers thereunder. On December 14, 2010, we satisfied all of the conditions to the effectiveness of the DIP Credit Agreement and consummated the transactions contemplated thereunder including the refinancing in full of our Company’s and its applicable subsidiaries’ obligations under the pre-existing first lien credit facility. Pursuant to the terms of the DIP Credit Agreement:
|
●
|
the DIP Lenders agreed to lend up to $800.0 million in the form of a $350.0 million term loan and a $450.0 million revolving credit facility with a $250.0 million sublimit for letters of credit, in each case subject to the terms and conditions therein;
|
|
●
|
our Company’s and the Subsidiary Borrower’s obligations under the DIP Credit Agreement and the other specified loan documents are guaranteed by our Company’s certain other subsidiaries that are Debtors (“Subsidiary Guarantors” and, together with our Company and the Subsidiary Borrowers, the “Loan Parties”); and
|
|
●
|
the Loan Parties’ obligations under the DIP Credit Agreement and such other specified loan documents are secured by a security interest in, and lien upon, substantially all of the Loan Parties’ existing and after-acquired personal and real property, having the priority and subject to the terms therein and in the order(s) entered into by the Bankruptcy Court, as applicable.
|
Our Company will have the option to have interest on the revolving loans under the revolving credit facility provided under the DIP Credit Agreement accrue at an alternate base rate plus 200 basis points or at adjusted LIBOR plus 300 basis points. Our Company will have the option to have interest on the term loan provided under the DIP Credit Agreement accrue at an alternate base rate plus 600 basis points or at adjusted LIBOR (with a floor of 175 basis points) plus 700 basis points. The DIP Credit Agreement limits, among other things, our Company’s and the other Loan Parties’ ability to (i) incur indebtedness, (ii) incur or create liens, (iii) dispose of assets, (iv) prepay certain indebtedness and make other restricted payments, (v) enter into sale and leaseback transactions and (vi) modify the terms of certain indebtedness and certain material contracts.
The DIP Credit Agreement also contains certain financial covenants, including a minimum excess availability covenant of $100.0 million, minimum liquidity covenant of $100.0 million and minimum cumulative EBITDA covenant as defined in the DIP Credit Agreement. Minimum cumulative EBITDA measured beginning on April 24, 2011 is as follows (in millions):
|
Date
|
Minimum Cumulative EBITDA
|
|
August 13, 2011
|
$ -
|
|
September 10, 2011
|
10.0
|
|
October 8, 2011
|
20.0
|
|
November 5, 2011
|
35.0
|
|
December 3, 2011
|
50.0
|
|
December 31, 2011
|
65.0
|
|
January 28, 2012
|
90.0
|
|
February 25, 2012
|
100.0
|
|
March 24, 2012
|
110.0
|
|
April 21, 2012
|
125.0
|
|
May 19, 2012
|
150.0
|
|
June 16, 2012
|
175.0
|
We are currently in compliance with all covenants. Meeting our EBITDA covenant requires increasing levels of performance throughout the year. Achieving this improving performance will require our Company to successfully implement our business improvement initiatives beginning as early as June 2011 with the benefits reflected in our results shortly thereafter. The DIP Credit Agreement matures upon the earliest to occur of (a) June 14, 2012, (b) the acceleration of the loans and the termination of the commitment thereunder, and (c) the substantial consummation (as defined in Section 1101(2) of the Bankruptcy Code, which for purposes hereof shall be no later than the effective date thereof) of a plan of reorganization that is confirmed pursuant to an order entered by the Bankruptcy Court. The Bankruptcy Court entered a final order approving the DIP Credit Agreement on January 11, 2011.
RELATED PARTY PROMISSORY NOTE
On September 2, 2008, our Company borrowed $10.0 million from Erivan Karl Haub and issued a three-year, unsecured promissory note (the “Note”). Erivan Haub is the father of our former Executive Chairman and is a limited partner of Tengelmann. The principal is due in a lump sum payment on August 18, 2011 and will bear interest at the rate of 6% per year, payable in 12 equal payments of $0.15 million over the term of the Note. During fiscal 2010 and fiscal 2009, we paid interest of $0.45 million and $0.75 million respectively, and recorded interest expense of $0.48 million and $0.6 million, respectively, on this note. The Note is considered subject to compromise as a result of our Bankruptcy filing. Refer to Note 10 – Liabilities Subject to Compromise for additional information.
SENIOR SECURED NOTES
On August 4, 2009, we issued $260.0 million of 11.375% senior secured notes due 2015 (the "Notes") at a price equal to 97.385% of their face value. The Notes represent second lien secured obligations, guaranteed by all of our Company's domestic subsidiaries. The Notes bear interest at a fixed rate of 11.375% payable semi-annually in cash. The proceeds from this offering and our preferred stock offering on August 4, 2009 (Refer to Note 12 – Redeemable Preferred Stock) were used to repay a portion of our existing variable debt. In fiscal 2010, we reclassified $15.6 million of debt discount and deferred financing fees against the book value of the debt and adjusted the remaining balance to the face value due to the Bankruptcy Filing. As of February 26, 2011, the carrying value of the note is $260.0 million. Based upon the uncertainty surrounding the ultimate treatment of the Notes in our reorganization plan, including the potential that these Notes may be impaired, these notes are classified as Liabilities subject to compromise on our Consolidated Balance Sheets.
The Notes were offered only to qualified institutional buyers in reliance on Rule 144A under the Securities Act of 1933, as amended (the “Securities Act”), and only to non-U.S. investors pursuant to Regulation S outside the United States. The Notes have not been registered under the Securities Act or the securities laws of any other jurisdiction and may not be offered or sold in the United States absent registration or an applicable exemption from registration requirements. The Notes contain customary covenants found in secured notes, including, among other things, restrictions on the incurrence of additional indebtedness, asset sales, liens and restricted payments.
Pursuant to a registration rights agreement dated August 4, 2009, we have agreed to exchange the Notes for a new issue of substantially identical debt securities registered under the Securities Act. Our Company has agreed to use commercially reasonable efforts to file a registration statement, to cause it to be effective with the SEC, and to consummate the exchange offer prior to August 4, 2011. If such registration statement ceases to be effective during the registration period, subject to certain exceptions, we will be required to pay 0.25% of additional per annum interest for the first 90-day period immediately following the agreed upon registration date, increased by an additional 0.25% per annum for each subsequent 90-day period, up to the maximum additional rate of 1.0% per annum thereafter, or $2.6 million per year, until the exchange offer is made. We currently do not have a liability recorded with respect to this arrangement, as we believe that payment is improbable. The Note is considered subject to compromise as a result of our Bankruptcy filing. Refer to Note 10 – Liabilities Subject to Compromise for additional information.
PUBLIC DEBT OBLIGATIONS
As of February 26, 2011 and February 27, 2010, we had outstanding notes of $632.8 million and $592.0 million, respectively. Our public debt obligations are comprised of 9.125% Senior Notes due December 15, 2011, 5.125% Convertible Senior Notes due June 15, 2011, 6.75% Convertible Senior Notes due December 15, 2012 and 9.375% Notes due August 1, 2039. Interest is payable quarterly on the 9.375% Notes and semi-annually on the 9.125%, 5.125% and 6.75% Notes. The 9.375% Notes are now callable at par ($25 per bond) and the 9.125% Notes are now callable at a premium to par (103.042%). The 9.375% Notes are unsecured obligations and were issued under the terms of our senior debt securities indenture, which contains among other provisions, covenants restricting the incurrence of secured debt. All covenants and restrictions for the 9.125% Senior Notes have been eliminated in connection with the cash tender offer in fiscal 2005. Our unsecured notes are not guaranteed by any of our subsidiaries. All of our public debt obligations are considered subject to compromise as a result of our Bankruptcy filing. Refer to Note 10 – Liabilities Subject to Compromise for additional information. In fiscal 2010, we reclassified $35.8 million of debt discount and deferred financing fees against the book value of the debt and adjusted the remaining balance to the face value due to the Bankruptcy Filing. As of February 26, 2011, the carrying value of the notes is $632.8 million.
Convertible Senior Notes
On December 18, 2007, we completed a public offering and issued $165.0 million 5.125% Convertible Senior Notes due 2011 and $255.0 million 6.750% Convertible Senior Notes due 2012, to pay down our one-year $370 million Senior Secured Bridge Credit Agreement entered into on December 3, 2007 in connection with funding the acquisition of Pathmark. The 5.125% Notes are not redeemable at our option at any time. The 6.750% Notes are redeemable at our option on or after December 15, 2010, at a redemption price of 102.70% and on or after December 15, 2011, at a redemption price of 101.35%. The initial conversion price of the 5.125% Notes is $36.40, representing a 30.0% premium to the offering price of $28.00 and the initial conversion price of the 6.750% Notes is $37.80, representing a 35.0% premium to the offering price of $28.00 at maturity, and at our option, the notes are convertible into shares of our stock, cash, or a combination of stock and cash.
Concurrent with this offering, we entered into call options and financing warrant transactions with financial institutions that are affiliates of the underwriters of the notes to effectively increase the conversion price of the 5.125% Notes to $46.20 or a 65% premium and increase the conversion price of the 6.750% Notes to $49.00 or a 75% premium. Refer to the Call Option and Financing Warrants discussion below for additional information and the effect of Lehman Brothers OTC Derivatives, Inc. “LBOTC” bankruptcy, which effectively reduced the conversion prices for 50% of our Notes to their stated prices.
Upon the completion of our public offering of the Notes on December 18, 2007, our Company did not have sufficient authorized shares to provide for all potential issuances of common stock. Therefore, our Company accounted for the conversion features as freestanding instruments. The notes were recorded with a discount equal to the value of the conversion features at the transaction date and will be accreted to the par value of the notes over the life of the notes. The value of the conversion features were determined utilizing the Black-Scholes option pricing model and recorded as a long-term liability. The portion of the conversion features for which there was not shares available for settlement of conversions were marked to market each balance sheet date. On June 26, 2008, at a special meeting of shareholders, the number of shares of common stock we have the authority to issue was increased to 160,000,000. Based on an increase in available shares primarily due to the settlement of our Series A warrants during the first quarter of fiscal 2008 and the increase in authorized shares during the second quarter of fiscal 2008, the fair value of the conversion features of the 5.125% and 6.750% convertible senior notes of $13.8 million and $14.7 million, respectively, was reclassified from liabilities to “Additional paid-in-capital” on our Consolidated Statements of Stockholder's Equity and Comprehensive (Loss) Income as of June 26, 2008.
Our $255.0 million 6.750% Convertible Senior Notes that were issued in December 2007 are subject to accounting guidance relating to convertible debt instruments with cash settlement features, as our estimated nonconvertible debt borrowing rate is higher than the current contractual rate on these notes. We estimated that our effective interest rate for similar debt without the conversion feature was approximately 12.000%. As a result, we retrospectively recognized cumulative additional non-cash interest expense of $3.9 million from the date of issuance of these Convertible Senior Notes through February 28, 2009. During fiscal 2010, fiscal 2009 and fiscal 2008, we recognized additional non-cash interest expense of $4.1 million, $4.2 million and $3.5 million, respectively, as a result of our adoption of this new accounting guidance. Upon adoption, we also reclassified $26.4 million of debt and deferred financing costs to “Additional paid-in capital”, net of deferred taxes. In fiscal 2010, we reclassified $26.4 million of debt discount and deferred financing fees against the book value of the debt and adjusted the remaining balance to the face value. As of February 26, 2011, the carrying value of the note is $255.0 million.
The net carrying value of the 6.750% Convertible Senior Notes as of February 27, 2010 was $223.8 million, net of unamortized discount of $31.2 million. The Convertible Senior Notes are considered subject to compromise as a result of our Bankruptcy filing. Refer to Note 10 – Liabilities Subject to Compromise for additional information.
For our $165.0 million 5.125% Convertible Securities in fiscal 2010, we reclassified $4.4 million of debt discount and deferred financing fees against the book value of the debt and adjusted the remaining balance to the face value due to the Bankruptcy Filing. As of February 26, 2011, the carrying value of the note is $165.0 million. The 5.125% Convertible Securities are considered subject to compromise as a result of our Bankruptcy filing. Refer to Note 10 – Liabilities Subject to Compromise for additional information.
DEBT MATURITIES
Maturities on indebtedness for the next five fiscal years and thereafter are:
Fiscal 2011 $ 188,178
Fiscal 2012 605,293
Fiscal 2013 311
Fiscal 2014 329
Fiscal 2015 260,348
Fiscal 2016 and thereafter 200,985
These maturities are based upon contractual maturity dates, are subject to compromise and have not been adjusted as a result of the Bankruptcy Filing. Interest payments on indebtedness were approximately $129.6 million, $146.2 million and $131.3 million for fiscal 2010, fiscal 2009 and fiscal 2008, respectively.
SERIES B WARRANTS
Our Series B warrants issued as part of the acquisition of Pathmark on December 3, 2007, are exercisable at $32.40 and expire on June 9, 2015. The Tengelmann stockholders have the right to approve any issuance of common stock under these warrants upon exercise (assuming Tengelmann’s outstanding interest is at least 25% and subject to liquidity impairments defined within the Tengelmann Stockholder Agreement). In addition, Tengelmann has the right to require our Company to purchase our common stock held by Tengelmann to settle these warrants. However, rights under the Series B warrants are subject to the Bankruptcy Code. Based on the rights provided to Tengelmann, our Company does not have sole discretion to determine whether the payment upon exercise of these warrants will be settled in cash or through issuance of an equivalent portion of our shares. Therefore, these warrants are recorded as liabilities and marked-to-market each reporting period based on our Company’s current stock price. Series A warrants, which were also issued as part of the acquisition of Pathmark were cash settled on May 7, 2008 for $45.7 million.
The value of the Series B warrants as of February 26, 2011 and February 27, 2010 was $0.17 million and $13.9 million, respectively, and is included in “Liabilities Subject to Compromise” and in “Other financial liabilities”, respectively, on our Consolidated Balance Sheets. The following assumptions and estimates were used in the Black-Scholes model used to value the Series B warrants:
February 26, 2011 February 27, 2010
Expected life 4.29 years 5.28 years
Volatility 111.3% 68.6%
Dividend yield 0% 0%
Risk-free interest rate 2.16% 2.30%
CALL OPTION AND FINANCING WARRANTS
Concurrent with the issuance of the convertible senior notes, our Company issued financing warrants in conjunction with the call options recorded as equity in the Consolidated Balance Sheets (Refer to Note 19 - Capital Stock) to effectively increase the conversion price of these notes and reduce the potential dilution upon future conversion. The financing warrants allow holders to purchase common shares at $46.20 with respect to the 5.125% notes and $49.00 with respect to the 6.75% notes. The financing warrants were valued at $36.8 million at the issuance date. At the issuance date, we did not have sufficient authorized shares to provide for all potential issuances of common stock. Therefore, the financing warrants were accounted for as freestanding derivatives required to be settled in cash, recorded as a long-term liability and marked to market each reporting period utilizing the Black-Scholes option pricing model until sufficient shares became available for their potential issuance upon the majority shareholder vote on June 26, 2008. As a result, the fair value of the financing warrants of $28.9 million was reclassified from liabilities to “Additional paid-in-capital” on our Consolidated Statements of Stockholder's Equity and Comprehensive (Loss) Income as of June 26, 2008.
On or about October 3, 2008, Lehman Brothers OTC Derivatives, Inc. or “LBOTC,” which accounts for 50% of our call option and financing warrant transactions, filed for bankruptcy protection, which is an event of default under such transactions. We are carefully monitoring the developments affecting LBOTC, noting the impact of the LBOTC bankruptcy effectively reduced conversion prices for 50% of our convertible senior notes to their stated prices of $36.40 for the 5.125% Notes and $37.80 for the 6.750% Notes.
In the event we terminate these transactions, or they are canceled in bankruptcy, or LBOTC otherwise fails to perform its obligations under such transactions, we would have the right to monetary damages in the form of an unsecured claim against LBOTC in an amount equal to the present value of our cost to replace these transactions with another party for the same period and on the same terms.
Our “Nonoperating income (loss)” for fiscal 2010, fiscal 2009 and fiscal 2008 was comprised of gains (losses) relating to market value adjustments on the following:
|
Fiscal 2010
|
Fiscal 2009
|
Fiscal 2008
|
||||||||||
|
Series A warrants (1)
|
$
|
-
|
$
|
-
|
$
|
(1,197
|
)
|
|||||
|
Series B warrants (2)
|
13,777
|
(9,181
|
)
|
101,336
|
||||||||
|
5.125% convertible senior notes (3)
|
-
|
-
|
9,342
|
|||||||||
|
6.750% convertible senior notes (3)
|
-
|
-
|
5,129
|
|||||||||
|
Financing warrants on convertible senior notes (4)
|
-
|
-
|
2,254
|
|||||||||
|
Total
|
$
|
13,777
|
$
|
(9,181
|
)
|
$
|
116,864
|
|||||
|
(1)
|
Series A warrants were exercised by Yucaipa Corporate Initiatives Fund I, L.P., Yucaipa American Alliance Fund I, L.P. and Yucaipa American Alliance (Parallel) Fund I, L.P. on May 7, 2008 for $45.7 million in cash. These warrants were recorded as liabilities and marked to market each reporting period using our Company’s common stock price.
|
|
(2)
|
Refer to the preceding Series B Warrants discussion.
|
|
(3)
|
The portion of the conversion features relating to our 5.125% and 6.750% convertible senior notes for which our Company did not have sufficient authorized shares to provide for all potential issuances of common stock was recorded as a long-term liability and marked to market until stockholder approval authorizing the issuance of sufficient shares was obtained on June 26, 2008.
|
|
(4)
|
Our Company did not have sufficient authorized shares to provide for all potential issuances of common stock relating to our financing warrants issued in conjunction with our convertible senior notes. As such, these financing warrants were recorded as a liability and marked to market until stockholder approval authorizing the issuance of more shares was obtained on June 26, 2008.
|
NOTE 10 – Liabilities Subject to Compromise
As a result of the Bankruptcy Filing, the payment of pre-petition indebtedness is subject to compromise or other treatment under a plan of reorganization. Generally, actions to enforce or otherwise effect payment of pre-Bankruptcy Filing liabilities are stayed. Although payment of pre-petition claims generally is not permitted, the Bankruptcy Court granted the Debtor authority to pay certain pre-petition claims in designated categories and subject to certain terms and conditions. This relief generally was designed to preserve the value of our Company’s businesses and assets. Among other things, the Bankruptcy Court authorized us to pay certain pre-petition claims relating to employee wages and benefits, customers, vendors, and suppliers.
We have been paying and intend to continue to pay undisputed post-petition claims in the ordinary course of business. In addition, we may reject pre-petition executory contracts and unexpired leases with respect to our operations, with the approval of the Bankruptcy Court. Any damages resulting from rejection of executory contracts and unexpired leases are treated as general unsecured claims and will be classified as “Liabilities subject to compromise” on the Consolidated Balance Sheets. We will notify all known claimants subject to the bar date of their need to file a proof of claim with the Bankruptcy Court. A bar date is the date by which claims against our Company must be filed if the claimants disagree with the amounts included in our schedule of assets and liabilities filed with the United States Trustee and wish to receive any distribution in the Bankruptcy Filing. A bar date of June 17, 2011 has been set by the Bankruptcy Court. Differences between liability amounts estimated by our Company and claims filed by creditors will be investigated and, if necessary, the Bankruptcy Court will make a final determination of the allowable claims. The ultimate amount of such liabilities is not determinable at this time.
Pre-petition liabilities that are subject to compromise are required to be reported at the amounts expected to be allowed, even if they may be settled for lesser amounts. The amounts currently classified as “Liabilities subject to compromise” may be subject to future adjustments depending on Bankruptcy Court actions, further developments with respect to disputed claims, determinations of the secured status of certain claims, the values of any collateral securing such claims, or other events. We expect that certain amounts currently classified as “Liabilities subject to compromise” may in fact be paid in the ordinary course as they come due. Any resulting changes in classification will be reflected in subsequent financial statements.
Liabilities subject to compromise consist of the following:
|
At
|
||||
|
Feb 26,2011
|
||||
|
Accounts payable
|
$
|
212,135
|
||
|
Accrued salaries, wages, and benefits
|
10,939
|
|||
|
Self-insurance reserves
|
400,170
|
|||
|
Closed store and warehouse reserves
|
157,192
|
|||
|
Pension withdrawal liabilities
|
97,196
|
|||
|
GHI Contractual Liability for Employee Benefits
|
94,281
|
|||
|
Accrued occupancy related costs for open stores
|
24,523
|
|||
|
Deferred income
|
74,394
|
|||
|
Deferred real estate income
|
89,309
|
|||
|
Accrued audit, legal and other
|
8,118
|
|||
|
Accrued interest
|
33,921
|
|||
|
Other postretirement and postemployment benefits
|
41,655
|
|||
|
Other accruals
|
8,005
|
|||
|
Pension plan benefits
|
125,000
|
|||
|
Deferred Rent Liabilities
|
56,287
|
|||
|
Unfavorable lease liabilities
|
4,201
|
|||
|
Other noncurrent liabilities
|
11,316
|
|||
|
5.125% Convertible Senior Notes, due June 15, 2011
|
165,000
|
|||
|
Related Party Promissory Note, due August 18, 2011
|
10,000
|
|||
|
9.125% Senior Notes, due December 15, 2011
|
12,840
|
|||
|
6.750% Convertible Senior Notes, due December 15, 2012
|
255,000
|
|||
|
11.375% Senior Secured Notes, due August 4, 2015
|
260,000
|
|||
|
9.375% Notes, due August 1, 2039
|
200,000
|
|||
|
Other Debt
|
2,714
|
|||
|
Obligations under capital leases
|
121,058
|
|||
|
Real estate liabilities
|
399,480
|
|||
|
Total liabilities subject to compromise
|
$
|
2,874,734
|
||
Rejected Leases
We have rejected 98 of our leases through the bankruptcy process and reduced the reserve balance associated with these leases by $192.7 million, net to the allowable claim for damages of $130.2 million. The remaining closed store reserve balance of $27.0 million relates to locations for which the leases have not been rejected as of fiscal year end.
Non-debtor Financing Agreements
Intercompany financing agreements with foreign non-Debtor subsidiaries of $94.1 million are not reflected in the above liabilities subject to compromise table as these amounts were eliminated on a consolidated basis.
NOTE 11 – Lease Obligations
We operate primarily in leased facilities with lease terms generally ranging up to twenty-five years for store leases, with options to renew for additional periods. In addition, we lease certain store equipment. We recognize rent expense for operating leases with rent escalation clauses on a straight-line basis over the applicable lease term. The majority of the leases contain escalation clauses relating to real estate tax increases and certain store leases provide for increases in rentals when sales exceed specified levels. Our lease obligations consist of capital leases, operating leases and long-term real estate liabilities.
Our capital lease assets as of February 26, 2011 and February 27, 2010 were as follows:
|
At
|
At
|
|||||||
|
February 26,
|
February 27,
|
|||||||
|
2011
|
2010
|
|||||||
|
Real property under capital leases
|
$
|
92,355
|
$
|
114,137
|
||||
|
Equipment under capital leases
|
17,014
|
17,267
|
||||||
|
109,369
|
131,404
|
|||||||
|
Accumulated amortization
|
(46,023
|
)
|
(41,805
|
)
|
||||
|
Net property under capital leases
|
$
|
63,346
|
$
|
89,599
|
||||
During fiscal 2009, we entered into a new capital lease for equipment totaling $3.0 million. We did not enter into any new capital leases during fiscal 2010 and fiscal 2008. Amounts relating to this capital lease represent non-cash transactions and, accordingly, have been excluded from our Consolidated Statements of Cash Flows for fiscal 2009. Interest paid in connection with our capital lease obligations during fiscal 2010, fiscal 2009 and fiscal 2008 was approximately $15.5 million, $17.4 million and $18.6 million, respectively.
Rent expense recorded for our operating leases during the last three fiscal years consisted of the following:
|
Fiscal 2010
|
Fiscal 2009
|
Fiscal 2008
|
||||||||||
|
Minimum rentals
|
$
|
166,625
|
$
|
171,937
|
$
|
174,232
|
||||||
|
Contingent rentals
|
1,573
|
2,736
|
2,753
|
|||||||||
|
Total rent expense
|
$
|
168,198
|
$
|
174,673
|
$
|
176,985
|
||||||
Under the Bankruptcy Code, we generally must assume or reject executory contracts including lease obligations. Therefore, the commitments shown below may not reflect actual cash disbursements in future periods. Future minimum annual lease payments for capital leases and non-cancelable operating leases in effect at February 26, 2011 are presented below. The table below excludes leases rejected with court approval on or before February 26, 2011; any additional lease rejections will further reduce the indicated commitments, but would increase lease rejection claims included within Liabilities subject to compromise on the Consolidated Balance Sheets:
|
Operating Leases
|
||||||||||||||||||||||||
|
Future
|
Net Future
|
|||||||||||||||||||||||
|
Future Minimum Rental Payments
|
Minimum
|
Minimum
|
||||||||||||||||||||||
|
Capital
|
Open
|
Closed
|
Sublease
|
Rental
|
||||||||||||||||||||
|
Fiscal
|
Leases
|
Sites
|
Sites
|
Total
|
Rentals
|
Payments
|
||||||||||||||||||
|
2011
|
$
|
24,021
|
$
|
180,808
|
$
|
17,960
|
$
|
198,768
|
$
|
26,799
|
$
|
171,969
|
||||||||||||
|
2012
|
23,028
|
175,970
|
17,957
|
193,927
|
24,032
|
169,895
|
||||||||||||||||||
|
2013
|
19,656
|
160,592
|
18,952
|
179,544
|
21,014
|
158,530
|
||||||||||||||||||
|
2014
|
17,836
|
147,510
|
17,592
|
165,102
|
17,086
|
148,016
|
||||||||||||||||||
|
2015
|
17,583
|
135,934
|
12,174
|
148,108
|
13,172
|
134,936
|
||||||||||||||||||
|
2016 and thereafter
|
91,187
|
627,447
|
52,552
|
679,999
|
40,211
|
639,788
|
||||||||||||||||||
|
Net minimum rentals
|
193,311
|
$
|
1,428,261
|
$
|
137,187
|
$
|
1,565,448
|
$
|
142,314
|
$
|
1,423,134
|
|||||||||||||
|
Less interest portion
|
(73,334
|
)
|
||||||||||||||||||||||
|
Present value of future
|
||||||||||||||||||||||||
|
minimum rentals
|
$
|
119,977
|
||||||||||||||||||||||
During fiscal 2010, we sold six properties for $89.8 million and simultaneously leased them back from the purchaser. However, due to our continuing involvement with these properties, as all six leases contain fixed-price renewal options that extend beyond the economic useful life of the property, the sales did not qualify for sale-leaseback accounting treatment. The carrying value of these properties of approximately $68.3 million remained on our Consolidated Balance Sheets at February 26, 2011 and no sale was recognized. Instead, the cash received on the sale of these properties of $89.8 million was recorded as a long-term real estate liability with a maturity of 20 years, within ”Liabilities subject to compromise” on our Consolidated Balance Sheets at February 26, 2011. In addition, all lease payments are classified as “Interest expense” in our Consolidated Statements of Operations. Five properties were sold for a gain of $19.8 million after expenses which are being deferred until the end of the lease terms when our continuing involvement ceases. One property was sold at a loss of $ 0.8 million which was recognized immediately.
“Liabilities subject to compromise” on our Consolidated Balance Sheets include various leases in which we received landlord allowances to offset the costs of structural improvements we made to the leased space. Since we had directly paid for a substantial portion of the structural improvement costs, we were considered the owner of the building during the construction period. In all situations upon completion of the construction, we were unable to meet the requirements to qualify for sale-leaseback treatment. Thus, these landlord allowances have been recorded as long-term real estate liabilities on our Consolidated Balance Sheets and are being amortized over the related lease term based on rent payments designated in the lease agreements. These leases have terms ranging between 13 and 25 years and effective annual percentage rates between 4.74% and 71.14%. The effective annual percentage rates were implicitly calculated based upon technical accounting guidance.
The future minimum annual lease payments relating to these leases, as well as for the leased properties that we previously sold but did not qualify for sale-leaseback treatment have been included in the table below.
Long-term Real Estate Liabilities
Future Future Net Future
Minimum Minimum Minimum
Rental Sublease Rental
Fiscal Payments Rentals Payments
2011 $ 41,127 $ 4,531 $ 36,596
2012 41,295 3,750 37,545
2013 41,468 2,731 38,737
2014 43,054 2,414 40,640
2015 43,185 1,818 41,367
2016 and thereafter 408,342 4,857 403,485
$618,471 $ 20,101 $ 598,370
During fiscal 2010, fiscal 2009 and fiscal 2008, we recognized gains related to our qualified sale-leaseback transactions of $2.8 million, $2.8 million and $2.6 million. The remaining deferred gains at February 26, 2011 and February 27, 2010 amounted to $29.5 million and $32.3 million, respectively.
NOTE 12 – Redeemable Preferred Stock
On August 4, 2009, our Company issued 60,000 shares of 8.0% Cumulative Convertible Preferred Stock, Series A-T, without par value, to affiliates of Tengelmann Warenhandelsgesellschaft KG (“Tengelmann”) and 115,000 shares of 8.0% Cumulative Convertible Preferred Stock, Series A-Y, without par value, to affiliates of Yucaipa Companies LLC (“Yucaipa”), together referred to as the “Preferred Stock,” for approximately $162.8 million, after deducting approximately $12.2 million in closing and issuance costs. Each share of the Preferred Stock has an initial liquidation preference of one thousand dollars, subject to adjustment.
The Preferred Stock is convertible into shares of our Company’s common stock, par value $1.00 per share (the “Common Stock”), at an initial conversion price of $5.00 per share of Common Stock. The Preferred Stock was convertible upon the one-year anniversary of the issuance of Preferred Stock, or August 5, 2010, provided that prior to receiving shareholder approval, the Preferred Stock was not exercisable into greater than 19.99% of the Common Stock outstanding prior to the issuance of the Preferred Stock. The 57,750 shares that were originally convertible without shareholder approval were recorded within temporary stockholders’ equity upon issuance since the shares are (i) redeemable at the option of the holder and (ii) have conditions for redemption which are not solely within the control of the Company. The 117,250 shares that originally required shareholder approval in order to become convertible were initially recorded as a “Preferred stock liability”. On December 15, 2009, we obtained shareholder approval authorizing the convertibility of the shares originally recorded within “Preferred stock liability”, and reclassified $109.5 million to temporary equity, representing the book value of the liability on December 15, 2009 net of the related debt issuance costs. As of February 26, 2011, the entire Preferred Stock issuance was recorded within temporary stockholders’ equity.
The holders of our Convertible Preferred Stock have the right to cast votes together with the holders of our common stock on an as-converted basis. Our Company is required to redeem all of the outstanding Preferred Stock on August 1, 2016 (the “Maturity Date”), at 100.0% of the liquidation preference, plus all accrued and unpaid dividends. Subject to the repurchase rights of the investors, the Preferred Stock is not redeemable prior to the Maturity Date. At any time after December 3, 2012, in the event of any fundamental change, the investors may elect to require our Company to repurchase the Preferred Stock in cash at 101.0% of the liquidation preference amount plus any accrued and unpaid dividends.
The holders of the Preferred Stock are entitled to an 8.0% dividend, payable quarterly in arrears in cash or in additional shares of Preferred Stock if our Company does not meet the liquidity levels required to pay the dividends. However, all dividends have been stayed during the pendency of the bankruptcy case. Dividends and deferred financing fees amortization relating to preferred stock that was classified as a liability prior to receiving shareholder approval, were recorded within “Interest expense”. During fiscal 2010, we accrued Preferred Stock dividends of $11.5 million within “Additional paid-in capital,” and paid Preferred Stock dividends of $10.5 million. On November 24, 2010 our Company’s Board of Directors authorized a payment-in-kind (“PIK”) dividend on our Redeemable Preferred Stock, payable on December 15, 2010 to holders of record on November 15, 2010 (“Record Date”). Dividends are required to be PIK in the event our Company does not have the ability to pay the dividends in cash. As of the Record Date, we did not have the ability to pay the dividends in cash. The calculation of PIK dividends on our Redeemable Preferred Stock is based upon the rate defined by the original terms of the Redeemable Preferred Stock at 9.5% per annum. The PIK dividends of approximately $4.0 million are included in Redeemable Preferred Stock on the Consolidated Balance Sheets.
During fiscal 2009, we accrued Preferred Stock dividends of $8.1 million, of which $3.5 million was recorded within “Interest expense” and the remaining $4.6 million was recorded within “Additional paid-in capital,” and paid Preferred Stock dividends of $5.1 million.
During fiscal 2010, we recorded $1.7 million of deferred financing fees amortization within “Additional paid-in capital”. During fiscal 2009, we recorded $1.0 million of deferred financing fees amortization, of which $0.4 million was recorded within “Interest expense” and the remaining $0.6 million was recorded within “Additional paid-in capital”.
The shares classified within temporary equity contained an embedded beneficial conversion feature as the fair value of the Company's common stock on the date of issuance, $5.67 per share, was in excess of the effective conversion price of $4.74 per share, which represents the $5.00 per share conversion price reduced for fees paid to the investors. The embedded beneficial conversion feature relating to the 57,750 shares that were convertible without prior shareholder approval resulted in a discount of $10.8 million, which has been recorded within “Additional paid-in capital” and will be amortized over a seven-year period from the date of issuance until the stated redemption date. The 117,250 shares that were reclassified to temporary equity upon receiving shareholder approval on December 15, 2009, also contained an embedded beneficial conversion feature, which resulted in a discount of $21.8 million being recorded within “Additional paid-in capital”, which will be amortized from December 15, 2009 through the stated redemption date. During fiscal 2010 and fiscal 2009, we accreted $4.8 million and $1.6 million, respectively, relating to these beneficial conversion features through “Additional paid-in capital”. As of February 26, 2011, the carrying value of the Redeemable Preferred Stock was $143.3 million.
Certain features of the Preferred Stock constitute derivatives separate from the Preferred Stock; however, at issuance and the current balance sheet date, those features had little or no value and are not expected to have significant value for the foreseeable future.
NOTE 13 – Retirement Plans and Benefits
We recognize the funded status of our defined benefit pension and other postretirement benefit plans as a net liability or asset on our Consolidated Balance Sheets. Any unrecognized prior service costs and actuarial gains or losses are recognized as a component of accumulated other comprehensive income or loss. Our assumptions used to measure our annual expenses are determined as of our fiscal year-end and all plan assets and liabilities are valued as of that date.
Defined Benefit Pension Plans and Postretirement Benefit Plans
We provide retirement benefits to certain non-union and union employees under various defined benefit plans. Our defined benefit pension plans are non-contributory and benefits under these plans are generally determined based upon years of service and, for salaried employees, compensation. We fund these plans in amounts consistent with the statutory funding requirements.
We also provide postretirement health care and life insurance benefits to certain union and non-union employees. We recognize the cost of providing postretirement benefits during employees’ active service periods.
In March 2010, the Patient Protection and Affordable Care and Health Care and Education Affordability Acts (the “Healthcare Reform”) were signed into law. The Healthcare Reform legislation made a number of significant changes that are expected to increase our healthcare related benefits, a requirement to provide healthcare coverage for children up to the age of 26, and the imposition of an excise tax on high cost healthcare plans. The Healthcare Reform added $787,000 to our postretirement benefit obligations or 2.3% reflecting the impact of the expected excise tax on high cost health care plans.
The following tables set forth the change in benefit obligations, the change in plan assets, the funded status, and the accumulated benefit obligation at February 26, 2011 and February 27, 2010 for our defined benefit plans and postretirement plans:
|
Pension
|
Postretirement
|
|||||||||||||||
|
Feb. 26, 2011
|
Feb. 27, 2010
|
Feb. 26, 2011
|
Feb. 27, 2010
|
|||||||||||||
|
Change in Benefit Obligation
|
||||||||||||||||
|
Benefit obligation – beginning of year
|
$
|
476,920
|
$
|
408,139
|
$
|
31,849
|
$
|
27,765
|
||||||||
|
Benefit obligations assumed (1)
|
-
|
13,357
|
-
|
-
|
||||||||||||
|
Service cost
|
6,620
|
6,675
|
653
|
506
|
||||||||||||
|
Interest cost
|
28,955
|
29,147
|
1,856
|
1,947
|
||||||||||||
|
Actuarial loss
|
24,398
|
57,513
|
2,480
|
3,508
|
||||||||||||
|
Benefits paid
|
(23,298
|
)
|
(25,459
|
)
|
(1,984
|
)
|
(1,993
|
)
|
||||||||
|
Amendments (6)
|
(1,567
|
)
|
-
|
-
|
-
|
|||||||||||
|
Settlement payments (2)
|
-
|
(14,179
|
)
|
-
|
-
|
|||||||||||
|
Curtailment payments (3)
|
-
|
(1,457
|
)
|
-
|
-
|
|||||||||||
|
Special termination benefits (4)
|
600
|
3,184
|
-
|
-
|
||||||||||||
|
Retiree drug subsidy received
|
-
|
-
|
107
|
116
|
||||||||||||
|
Benefit obligation – end of year (5)
|
$
|
512,628
|
$
|
476,920
|
$
|
34,961
|
$
|
31,849
|
||||||||
|
Change in Plan Assets
|
||||||||||||||||
|
Fair value of plan assets – beginning of year
|
$
|
397,192
|
$
|
339,550
|
$
|
-
|
$
|
-
|
||||||||
|
Actual return on plan assets
|
57,473
|
105,427
|
-
|
-
|
||||||||||||
|
Company contributions
|
6,927
|
6,873
|
1,984
|
1,993
|
||||||||||||
|
Trust reverting to A&P
|
-
|
(577
|
)
|
-
|
-
|
|||||||||||
|
Settlements (2)
|
-
|
(14,179
|
)
|
-
|
-
|
|||||||||||
|
Benefits paid to GHI employees (5)
|
(10,078
|
)
|
(14,442
|
)
|
-
|
-
|
||||||||||
|
Benefits paid to our employees
|
(23,298
|
)
|
(25,460
|
)
|
(1,984
|
)
|
(1,993
|
)
|
||||||||
|
Fair value of plan assets – end of year (5)
|
$
|
428,216
|
$
|
397,192
|
$
|
-
|
$
|
-
|
||||||||
|
Funded status at end of year (5)
|
$
|
(84,412
|
)
|
$
|
(79,728
|
)
|
$
|
(34,961
|
)
|
$
|
(31,849
|
)
|
||||
|
Noncurrent assets
|
$
|
43,099
|
$
|
34,876
|
$
|
-
|
$
|
-
|
||||||||
|
Current liabilities
|
(5,079
|
)
|
(5,055
|
)
|
(1,996
|
)
|
(1,823
|
)
|
||||||||
|
Non-current liabilities
|
(122,432
|
)
|
(109,549
|
)
|
(32,965
|
)
|
(30,026
|
)
|
||||||||
|
Net liability recognized (5)
|
$
|
(84,412
|
)
|
$
|
(79,728
|
)
|
$
|
(34,961
|
)
|
$
|
(31,849
|
)
|
||||
|
(1)
|
On June 30, 2007, the UFCW Local 174 Retail Pension Fund (“UFCW”) experienced a mass withdrawal termination, which caused our Company to incur a mass withdrawal liability. On July 14, 2009, we signed a Transfer Agreement to settle our mass withdrawal liability owed to UFCW, pursuant to which we agreed to pay UFCW $0.7 million and to transfer the existing pension benefit liabilities relating to our employees and retirees from UFCW to the A&P pension plan. On July 29, 2009, our A&P Pension Plan was amended for the transfer of the UFCW pension benefit obligation effective July 1, 2009.
|
(2) During fiscal 2009, we settled our pension obligation relating to a participant in one of our non-qualified pension plans.
|
(3)
|
Effective January 31, 2010, we froze our Supplemental Executive Retirement Plan, resulting in curtailment.
|
|
(4)
|
During fiscal 2009, we recorded a $2.0 million loss based on the terms of the settlement agreement with one of the participants in our non-qualified pension plan. In addition, during fiscal 2010 and fiscal 2009 we recorded special termination benefits of $0.6 million and $1.2 million, respectively, to recognize retirement supplement payments to certain eligible union participants.
|
(5) Refer to the GHI Contractual Obligation discussion below.
(6) Effective June 30, 2010, we froze our Cash Balance Plan which resulted in an adjustment to our benefit obligation.
The noncurrent assets are included in “Other assets” on the Consolidated Balance Sheets, while the pension and postretirement liabilities are included in “Liabilities subject to compromise”.
The weighted average assumptions in the following table were used to develop our benefit obligations at the end of each fiscal year:
|
Pension
|
Postretirement
|
||||||
|
Fiscal
|
Fiscal
|
Fiscal
|
Fiscal
|
||||
|
2010
|
2009
|
2010
|
2009
|
||||
|
Discount rate
|
5.75%
|
6.25%
|
5.50%
|
6.0%
|
|||
|
Compensation increase
|
3.00%
|
3.00%
|
N/A
|
N/A
|
|||
|
Healthcare cost rate for next year
|
N/A
|
N/A
|
9.00%
|
9.50%
|
|||
|
Ultimate healthcare cost trend rate
|
N/A
|
N/A
|
5.00%
|
5.0%
|
|||
|
Year ultimate trend is reached
|
N/A
|
N/A
|
2019
|
2019
|
|||
For postretirement benefits, assumed healthcare cost trend rates have an effect on the recorded expense and liability amounts. The effect of a one percentage point change in the assumed health care cost trend rate for each future year on the sum of service and interest cost would either be an increase or decrease of $0.2 million, while the accumulated postretirement benefit obligation would either increase by $2.9 million or decrease by $2.5 million.
Pension and postretirement benefits related amounts recorded in accumulated other comprehensive loss at February 26, 2011 and February 27, 2010 were as follows:
|
Pension
|
Postretirement
|
|||||||||||||||
|
Feb. 26, 2011
|
Feb. 27, 2010
|
Feb. 26, 2011
|
Feb. 27, 2010
|
|||||||||||||
|
Net actuarial (loss) gain
|
$
|
(82,838
|
)
|
$
|
(89,040
|
)
|
$
|
7,302
|
$
|
10,269
|
||||||
|
Prior service credit (cost)
|
228
|
(1,490
|
)
|
-
|
858
|
|||||||||||
|
Total
|
$
|
(82,610
|
)
|
$
|
(90,530
|
)
|
$
|
7,302
|
$
|
11,127
|
||||||
Plans with accumulated benefit obligation in excess of plan assets consisted of the following:
|
Fiscal
|
Fiscal
|
|||||||
|
2010
|
2009
|
|||||||
|
Accumulated benefit obligation
|
$
|
274,532
|
$
|
252,139
|
||||
|
Projected benefit obligation
|
$
|
280,201
|
$
|
259,918
|
||||
|
Fair value of plan assets
|
$
|
152,690
|
$
|
145,314
|
||||
The Company’s accumulated benefit obligation for defined benefit plans was $506,959 and $469,141 at February 26, 2011 and February 27, 2010, respectively.
The components of our net periodic pension and postretirement benefit expense and related assumptions and amounts recognized in other comprehensive income were as follows:
|
Pension
|
Postretirement
|
|||||||||||||||||||||||
|
Fiscal
|
Fiscal
|
Fiscal
|
Fiscal
|
Fiscal
|
Fiscal
|
|||||||||||||||||||
|
2010
|
2009
|
2008
|
2010
|
2009
|
2008
|
|||||||||||||||||||
|
Net Periodic Benefit Cost:
|
||||||||||||||||||||||||
|
Service cost
|
$
|
6,620
|
$
|
6,675
|
$
|
7,428
|
$
|
653
|
$
|
506
|
$
|
1,013
|
||||||||||||
|
Interest cost
|
28,955
|
29,147
|
25,868
|
1,855
|
1,947
|
2,291
|
||||||||||||||||||
|
Expected return on plan
|
||||||||||||||||||||||||
|
assets
|
(28,773
|
)
|
(24,575
|
)
|
(31,307
|
)
|
-
|
-
|
-
|
|||||||||||||||
|
Amortization of:
|
||||||||||||||||||||||||
|
Prior service cost (credit)
|
150
|
291
|
274
|
(858
|
)
|
(1,347
|
)
|
(1,347
|
)
|
|||||||||||||||
|
Actuarial loss (gain)
|
1,901
|
4,716
|
117
|
(487
|
)
|
(820
|
)
|
-
|
||||||||||||||||
|
Special termination benefits (1)
|
600
|
3,184
|
800
|
-
|
-
|
-
|
||||||||||||||||||
|
Curtailment loss (2)
|
-
|
908
|
-
|
-
|
-
|
-
|
||||||||||||||||||
|
Settlement loss (2)
|
-
|
708
|
-
|
-
|
-
|
-
|
||||||||||||||||||
|
Net periodic benefit cost (3)
|
$
|
9,453
|
$
|
21,054
|
$
|
3,180
|
$
|
1,163
|
$
|
286
|
$
|
1,957
|
||||||||||||
|
Other Changes in Plan Assets and
|
||||||||||||||||||||||||
|
Benefit Obligations Recognized in
|
||||||||||||||||||||||||
|
Other Comprehensive Loss:
|
||||||||||||||||||||||||
|
Net actuarial (gain) loss
|
$
|
(4,302
|
)
|
$
|
(24,796
|
)
|
$
|
88,990
|
$
|
2,480
|
$
|
3,508
|
$
|
(14,120
|
)
|
|||||||||
|
Prior service (credit) cost (4)
|
(1,567
|
)
|
-
|
346
|
-
|
-
|
-
|
|||||||||||||||||
|
Amortization of prior
|
||||||||||||||||||||||||
|
service (cost) credit
|
(150
|
)
|
(291
|
)
|
(274
|
)
|
858
|
1,347
|
1,347
|
|||||||||||||||
|
Recognized prior service
|
||||||||||||||||||||||||
|
cost due to curtailments (2)
|
-
|
(908
|
)
|
-
|
-
|
-
|
-
|
|||||||||||||||||
|
Recognized actuarial
|
||||||||||||||||||||||||
|
loss due to settlements (2)
|
-
|
(708
|
)
|
-
|
-
|
-
|
-
|
|||||||||||||||||
|
Amortization of net (loss) income
|
(1,901
|
)
|
(4,716
|
)
|
(117
|
)
|
487
|
820
|
-
|
|||||||||||||||
|
Total recognized in
|
||||||||||||||||||||||||
|
Comprehensive (income) loss
|
$
|
(7,920
|
)
|
$
|
(31,419
|
)
|
$
|
88,945
|
$
|
3,825
|
$
|
5,675
|
$
|
(12,773
|
)
|
|||||||||
|
Recognized in total
|
||||||||||||||||||||||||
|
comprehensive loss (income)
|
$
|
1,533
|
$
|
(10,365
|
)
|
$
|
92,125
|
$
|
4,988
|
$
|
5,961
|
$
|
(10,816
|
)
|
||||||||||
|
Discount rate
|
6.25
|
%
|
7.25
|
%
|
5.75
|
%
|
6.00
|
%
|
7.25
|
%
|
5.75
|
%
|
||||||||||||
|
Compensation increase
|
3.00
|
%
|
3.00
|
%
|
2.75
|
%
|
N/A
|
N/A
|
N/A
|
|||||||||||||||
|
Expected long-term rate of
|
||||||||||||||||||||||||
|
return on plan assets
|
7.50
|
%
|
7.50
|
%
|
6.75
|
%
|
N/A
|
N/A
|
N/A
|
|||||||||||||||
|
(1)
|
During fiscal 2009, we recorded a $2.0 million loss based on the terms of the settlement agreement with one of the participants in our non-qualified pension plan. In addition, during fiscal 2009 and fiscal 2008, we recorded special termination benefits of $1.2 million and $0.8 million, respectively, to recognize retirement supplement payments to certain eligible union participants.
|
|
(2)
|
In fiscal 2009, we recorded a curtailment loss of $0.9 million to immediately recognize the unrecognized prior service cost relating to our non-qualified Supplemental Executive Retirement Plan, which has been frozen effective January 31, 2010. In addition, we recorded a settlement loss of $0.7 million to immediately recognize the unrecognized losses for one of our non-qualified pension plans due to a settlement agreement with the associated participant.
|
|
|
|
(3) Pension and postretirement benefit expenses are recorded within “Store operating, general and administrative expense.”
(4) Effective June 30, 2010, we froze our Cash Balance Plan which resulted in an adjustment to our benefit obligation.
For determining the fiscal 2011 net periodic pension cost, the expected long-term rate of return for the plan was determined by weighing the expected returns for each asset class by the assets allocated to that class. The expected return for each asset class was based on our actuaries’ capital market assumptions for real returns on standard asset classes and a long-term annual inflation range of 2.0%. Given the target asset allocation of 40-60% equities, 30-40% fixed income and 5-25% other, we consider 7.5% to be a reasonable estimate of average expected long-term investment returns over the life of the plan.
Our Company expects approximately $1.8 million of the net actuarial loss and $92,000 of the prior service cost to be recognized into net periodic benefit cost in fiscal 2011 for defined benefit pension plans. For postretirement plans, approximately $0.3 million of actuarial gains is expected to be recognized during fiscal 2011.
The following table details our expected benefit payments for the years 2011 through 2020.
|
Pension
|
Postretirement
|
||
|
2011
|
$ 25,838
|
$ 2,051
|
|
|
2012
|
26,958
|
2,231
|
|
|
2013
|
27,736
|
2,456
|
|
|
2014
|
28,773
|
2,600
|
|
|
2015
|
30,044
|
2,660
|
|
|
Years 2016 – 2020
|
165,412
|
13,770
|
Plan Assets
Our postretirement plans are unfunded. Our defined benefit pension plan assets are held in trust funds and are actively managed by external fund managers. Our overall investment strategy is to diversify investments across types of investments and investment managers. The investment managers have full discretion to manage their portion of the investments subject to the objectives and policies of the respective plans. The performance of the investment managers is reviewed on a regular basis. Our primary investment objectives are to achieve a sufficient rate of return to meet the current and future pension plan cash obligations, while avoiding excessive risk. Equity security investments consist of a broad range of publicly traded securities, ranging from small to large capitalization stocks and are diversified in both growth and value orientated strategies as well as diverse industry sectors. Fixed income securities consist of a broad range of investments, including U.S. government securities, investment-grade corporate debt securities, mortgages and other asset backed obligations. Our plans do not allow for direct investments in the publicly traded securities of our Company and investments in derivatives for speculative purposes.
Our defined benefit pension plan target and actual weighted average asset allocations by asset class were as follows:
Actual Allocation
Target February 26, February 27,
Allocation 2011 2010
Equity securities 40 – 60% 63% 55%
Fixed income securities 30 – 40% 28% 38%
Other 5 – 25% 9% 7%
Total 100% 100%
The following table provides the fair value of our pension plan assets, by level as determined by the fair value hierarchy, at February 26, 2011 and February 27, 2010, respectively:
|
Fair Value Measurements at Feb. 26, 2011 Using
|
||||||||||||||||
|
Quoted Prices
|
Significant Other
|
Significant
|
||||||||||||||
|
in Active
|
Observable
|
Unobservable
|
||||||||||||||
|
Markets
|
Inputs
|
Inputs
|
||||||||||||||
|
Asset Class:
|
Total
|
(Level 1)
|
(Level 2)
|
(Level 3)
|
||||||||||||
|
Cash and cash equivalents
|
$ | 1,957 | $ | - | $ | 1,957 | $ | - | ||||||||
|
Short-term investment collective trust
|
6,289 | - | 6,289 | - | ||||||||||||
|
Total cash and cash equivalents
|
8,246 | - | 8,246 | - | ||||||||||||
|
Equity securities
|
||||||||||||||||
|
Common stock
|
97,129 | 97,129 | - | - | ||||||||||||
|
Mutual equity funds
|
157,923 | 157,923 | - | - | ||||||||||||
|
Total equity securities
|
255,052 | 255,052 | - | - | ||||||||||||
|
Fixed income securities:
|
||||||||||||||||
|
Corporate bonds
|
16,664 | - | 16,664 | - | ||||||||||||
|
U.S. government and agency securities
|
33,721 | 13,264 | 20,457 | - | ||||||||||||
|
Mutual fixed income funds
|
95,141 | 95,141 | - | - | ||||||||||||
|
Total fixed income securities
|
145,526 | 108,405 | 37,121 | |||||||||||||
|
Hedge Funds - Common Collective Trusts
|
25,838 | - | - | 25,838 | ||||||||||||
|
Other
|
2,105 | - | 2,105 | - | ||||||||||||
|
Fair value of investment securities
|
436,767 | $ | 363,457 | $ | 47,472 | $ | 25,838 | |||||||||
|
Receivables
|
234 | |||||||||||||||
|
Payables
|
(4,562 | ) | ||||||||||||||
|
Other
|
(4,223 | ) | ||||||||||||||
|
Total fair value of Plan Assets
|
$ | 428,216 | ||||||||||||||
|
Fair Value Measurements at Feb. 27, 2010 Using
|
||||||||||||||||
|
Quoted Prices
|
Significant Other
|
Significant
|
||||||||||||||
|
in Active
|
Observable
|
Unobservable
|
||||||||||||||
|
Markets
|
Inputs
|
Inputs
|
||||||||||||||
|
Asset Class:
|
Total
|
(Level 1)
|
(Level 2)
|
(Level 3)
|
||||||||||||
|
Cash and cash equivalents
|
$ | 1,056 | $ | - | $ | 1,056 | $ | - | ||||||||
|
Short-term investment collective trust
|
2,560 | - | 2,560 | - | ||||||||||||
|
Total cash and cash equivalents
|
3,616 | - | 3,616 | - | ||||||||||||
|
Equity securities
|
||||||||||||||||
|
Common stock
|
83,174 | 83,174 | - | - | ||||||||||||
|
Mutual equity funds
|
133,101 | 133,101 | - | - | ||||||||||||
|
Total equity securities
|
216,275 | 216,275 | - | - | ||||||||||||
|
Fixed income securities:
|
||||||||||||||||
|
Corporate bonds
|
17,244 | - | 17,244 | - | ||||||||||||
|
U.S. government and agency securities
|
27,344 | 16,592 | 10,752 | - | ||||||||||||
|
Mutual fixed income funds
|
97,568 | 97,568 | - | - | ||||||||||||
|
Agency mortgage backed securities
|
8,555 | - | 8,555 | - | ||||||||||||
|
Total fixed income securities
|
150,711 | 114,160 | 36,551 | - | ||||||||||||
|
Hedge Funds - Common Collective Trusts
|
24,525 | - | - | 24,525 | ||||||||||||
|
Other
|
2,030 | - | 2,030 | - | ||||||||||||
|
Fair value of investment securities
|
397,157 | $ | 330,435 | $ | 42,197 | $ | 24,525 | |||||||||
|
Receivables
|
7,818 | |||||||||||||||
|
Payables
|
(7,783 | ) | ||||||||||||||
|
Total fair value of Plan Assets
|
$ | 397,192 | ||||||||||||||
The following is a description of the valuation methodologies used for assets measured at fair value.
The fair values of investments in money market accounts and common collective trust funds are valued based on their reported Net Asset Value (NAV). The NAV of short-term securities are based on the value of their underlying investments, adjusted for charges and expenses, and are classified as Level 2 of the fair value hierarchy.
The fair values of common stock, mutual funds and U.S. government securities are determined based on their quoted closing market prices in active markets for identical investments, and are classified as Level 1 of the fair value hierarchy.
The fair values of corporate bonds and U.S. agency securities are based on observable market information in primary markets or determined by pricing services based on values for investments with similar ratings and maturity dates. These securities are classified as Level 2 of the fair value hierarchy.
Agency mortgage-backed pass through securities issued by the government, Freddie Mac and Fannie Mae are valued based on observable market information relating to the underlying loans. As such, these securities are classified as Level 2 of the fair value hierarchy.
The fair value of the common collective trust invested in a fund of offshore hedge funds is determined based on the NAV of the underlying hedge funds, as reported by each third party administrator of the underlying hedge funds and further analyzed by the trust. The Plan’s investment in the trust is valued based on its proportionate share of the trust’s net assets, adjusted for related fees. The trust contains a holdback provision, whereas 10% of its investments cannot be redeemed by the Plan until after the fund’s fiscal year-end. As such, these investments are classified as Level 3.
The methods described above may produce a fair value calculation that may not be indicative of net realizable value or reflective of future fair values. Furthermore, while we believe that the valuation methods used by our pension plans are appropriate and consistent with other market participants, the use of different methodologies or assumptions to determine fair value of certain financial instruments could result in a different fair value measurement at the reporting date.
The table below provides a reconciliation of the beginning and ending balances for Level 3 assets for the year ended February 26, 2011 and February 27, 2010:
|
Fair Value Measurements Using
|
||||
|
Significant Unobservable Inputs
|
||||
|
(Level 3)
|
||||
|
Hedge Funds-
|
||||
|
Common Collective Trusts
|
||||
|
Beginning Balance as of 2/27/2010
|
$ | 24,525 | ||
|
Realized gains (losses)
|
- | |||
|
Unrealized gains (losses)
|
1,313 | |||
|
Transfers in/out of Level 3
|
- | |||
|
Net purchases, sales and settlements
|
- | |||
|
Ending Balance as of 2/26/2011
|
$ | 25,838 | ||
|
Fair Value Measurements Using
|
||||
|
Significant Unobservable Inputs
|
||||
|
(Level 3)
|
||||
|
Hedge Funds-
|
||||
|
Common Collective Trusts
|
||||
|
Beginning Balance as of 2/28/2009
|
$ | 24,200 | ||
|
Realized gains (losses)
|
- | |||
|
Unrealized gains (losses)
|
325 | |||
|
Transfers in/out of Level 3
|
- | |||
|
Net purchases, sales and settlements
|
- | |||
|
Ending Balance as of 2/27/2010
|
$ | 24,525 | ||
GHI Contractual Obligation
We have a contractual obligation to fund pension benefits for certain employees of Grocery Haulers, Inc. (“GHI”) who handle transportation and logistics services for our Pathmark stores. Upon our acquisition of Pathmark in December 2007, this obligation was accounted for as an unfavorable contract based on liabilities allocable to GHI, net of related assets, which were held by the Multiemployer Pension Plan (“the Fund”) jointly sponsored by the Local 863 Union and various other employers.
As we believed the Fund was likely to have funding challenges and would present a risk of higher future contribution requirements, our Company entered into a series of agreements with GHI and the Fund, which enabled us to transfer the pension assets attributable to GHI’s employees of $13.6 million from the Fund and combine them with our existing Pathmark Pension Plan’s assets in January 2009. We believe that our cash-flow and earnings will benefit from gaining a better control over the future costs and by limiting our obligations to fund pension benefits solely to GHI’s employees, compared to having remained in the Fund. Since the assets in the plan are available to pay pension benefits of both the Company’s employees and GHI’s employees servicing our Pathmark stores, the transferred assets are treated as plan assets, similar to all of our other pension plan assets. The related return on plan assets is recorded within “Store operating, general and administrative expense” in our Consolidated Statements of Operations. However, since GHI’s employees covered by this plan are not employees of the Company, our obligation to fund their pension benefits is accounted for as a contractual obligation, outside the scope of pension accounting. Accordingly, although our contractual obligations related to GHI’s employees are excluded from the above tabular disclosures of our defined benefit pension plans, we believe that they should be evaluated in conjunction with our other pension benefit obligations to fully understand our pension related financial obligations. We calculated the fair value of our contractual obligation to GHI’s employees to be $94.3 million and $91.4 million, as of February 26, 2011 and February 27, 2010, respectively, using discount rates of 5.50% and 7.00%, respectively, which were derived from the published zero-coupon AA corporate bond yields.
Our contractual obligation relating to pension benefits for GHI’s employees are considered subject to compromise and are included within “Liabilities subject to compromise” in our Consolidated Balance Sheets as of February 26, 2011. Additions to our GHI contractual obligation for current service costs and actuarial gains and losses are recorded within “Cost of merchandise sold” in our Consolidated Statements of Operations at their current value. Accretion of the obligation to present value is recorded within “Interest expense” in our Consolidated Statements of Operations.
Defined Contribution Plans
We maintain savings plans to which eligible participants may contribute a percentage of their eligible salaries. Due to the deteriorating economic conditions and our results of operations, effective March 1, 2009, we suspended our Company’s matching contributions to the savings plans, which were based on a percentage of the participants’ eligible contributions. Effective January 1, 2010, we also suspended our Company’s contributions to the defined contribution retirement plans, which were equal to 4% of eligible participants’ salaries. Participants vest in our prior contributions after two years of service for contributions made after January 1, 2008, and after five years of service for contributions made prior to such date. Our contributions charged to operations for all plans were approximately $0.5 million, $6.7 million and $12.0 million in fiscal years 2010, 2009 and 2008, respectively.
Multi-employer Union Pension Plans
We participate in various multi-employer union pension plans which are administered jointly by management and union representatives. These plans sponsor most full-time and certain part-time union employees who are not covered by our other pension plans. The pension expense for these plans in fiscal 2010, fiscal 2009 and fiscal 2008 was approximately $56.6 million, $65.2 million (all of which related to continuing operations) and $81.2 million ($4.1 million of which related to discontinued operations), respectively. Certain multi-employer plans have reached an unfunded status below current regulatory requirements. We could, under certain circumstances, be liable for unfunded vested benefits or other expenses of jointly administered union/management plans, which benefits could be significant and material for our Company.
The above fiscal 2010, fiscal 2009 and fiscal 2008 pension expense amounts for the multi-employer plans include nil, $2.8 million (all of which relates to continuing operations) and $33.0 million ($4.1 million of which relates to discontinued operations), respectively, for costs related to our Company’s withdrawals from multi-employer union pension plans during each respective year. We made withdrawals from certain multi-employer pension plans, as we believe that the related plans are likely to have funding challenges, and would present a risk of higher future contribution requirements. We also believe that our cash-flow and earnings will benefit from gaining a better control over the future costs and by limiting our obligations to fund pension benefits solely to our employees, compared to having remained in the multi-employer plans.
Postemployment Benefits
We accrue costs for pre-retirement, postemployment benefits provided to former or inactive employees and recognize an obligation for these benefits. The costs of these benefits have been included in operations for fiscal 2010, fiscal 2009 and fiscal 2008. As of February 26, 2011 and February 27, 2010, we had liabilities reflected on the Consolidated Balance Sheets of $17.4 million, $14.1 million of which was recorded within “Liabilities subject to compromise”, and $23.7 million, respectively, related to such benefits, which were recorded within “Other accruals” and “Other non-current liabilities”.
NOTE 14 – Stock Based Compensation
The components of our compensation expense related to our share-based incentive plans were as follows, none of which have been capitalized:
|
Fiscal 2010
|
Fiscal 2009
|
Fiscal 2008
|
||||||||||
|
Stock options
|
$
|
874
|
$
|
1,492
|
$
|
1,283
|
||||||
|
Restricted stock units
|
591
|
1,076
|
-
|
|||||||||
|
Performance restricted stock units
|
(550
|
)
|
2,358
|
3,781
|
||||||||
|
Common stock granted to Directors
|
352
|
741
|
630
|
|||||||||
|
Total stock-based compensation
|
$
|
1,267
|
$
|
5,667
|
$
|
5,694
|
||||||
At February 26, 2011, we had stock awards outstanding under two stock-based compensation plans, the 2008 Long Term Incentive and Share Award Plan (“2008 Plan”), which was approved by our shareholders on June 26, 2008, and the 2004 Non-Employee Director Compensation Plan. The 2008 Plan replaced the 1998 Long Term Incentive and Share Award Plan and provides for the same types of awards and is otherwise similar to the 1998 Plan. The general terms of each plan, the method of estimating fair value for each plan and fiscal 2010, fiscal 2009 and fiscal 2008 activity is reported below.
|
I.
|
2008 Plan: This plan provides for the grant of awards in the form of options, SAR’s, restricted shares, restricted share units, performance shares, performance units, dividend equivalent, or other share based awards to our Company’s officers and key employees. The total number of shares available for issuance under this plan is 4,750,000, subject to anti-dilution provisions.
|
Performance restricted stock units under the 2008 Plan were granted at the fair market value of the Company’s common stock at the date of grant, adjusted by an estimated forfeiture rate. Certain performance restricted stock units that include a market condition are granted at the award’s fair market value determined on the date of grant.
Stock options
The stock option awards under the 2008 Plan are granted based on the fair market value of the Company’s common stock on the date of grant. Our stock options have a contractual term of 10 years and vest 33% on each anniversary date of the issuance over a three-year period. Compensation expense of all awards is calculated at fair value using a Black-Scholes valuation model, which utilizes assumptions detailed in the below table for expected life based upon historical option exercise patterns, historical volatility for a period equal to the stock option’s expected life, and risk-free rate based on the U.S. Treasury constant maturities in effect at the time of grant. The following assumptions were in place during fiscal 2010, fiscal 2009 and fiscal 2008:
Fiscal 2010 Fiscal 2009 Fiscal 2008
Expected life 6 years 6 years 7 years
Volatility 70%-89% 66% 52%
Risk-free interest rate range 1.68%-2.05% 2.65%-2.68% 2.96%
During the fiscal 2010, our Company issued stock options for 1,846,542 shares of our Company’s common stock in excess of the number of shares available for issuance under the 2008 Plan. Shareholder approval is required to authorize an increase in the number of shares available for issuance under the 2008 Plan. Accordingly, the fiscal 2010 stock-based compensation relating to these options has been classified in other accruals. Once shareholder approval is obtained, this amount will be reclassified as equity.
As of February 26, 2011, approximately $8.5 million of total unrecognized compensation expense related to unvested stock option awards will be recognized over a weighted average period of 2.4 years.
The weighted average grant date fair value of stock options granted during fiscal 2010, fiscal 2009 and fiscal 2008 was $12.8 million or $1.98 per share, $3.7 million or $2.81 per share, and $1.9 million or $14.64 per share, respectively.
The following is a summary of the stock option activity during fiscal 2010, fiscal 2009 and fiscal 2008:
|
Weighted Avg.
|
||||||||||||
|
Weighted
|
Remaining
|
|||||||||||
|
Avg.
|
Contractual
|
|||||||||||
|
Shares
|
Exercise Price
|
Term (years)
|
||||||||||
|
Outstanding at February 23, 2008
|
1,827,529
|
$
|
24.21
|
|||||||||
|
Granted
|
128,434
|
27.08
|
||||||||||
|
Canceled or expired
|
(296,138
|
)
|
29.14
|
|||||||||
|
Exercised
|
(107,891
|
)
|
20.46
|
|||||||||
|
Outstanding at February 28, 2009
|
1,551,934
|
23.77
|
||||||||||
|
Granted
|
1,316,829
|
4.58
|
||||||||||
|
Canceled or expired
|
(772,899
|
)
|
17.28
|
|||||||||
|
Exercised
|
(19,396
|
)
|
4.63
|
|||||||||
|
Outstanding at February 27, 2010
|
2,076,468
|
14.18
|
||||||||||
|
Granted
|
6,473,047
|
3.13
|
||||||||||
|
Canceled or expired
|
(3,314,344
|
)
|
7.21
|
|||||||||
|
Exercised
|
(4,834
|
)
|
5.72
|
|||||||||
|
Outstanding at February 26, 2011
|
5,230,337
|
4.93
|
8.6
|
|||||||||
|
Exercisable at:
|
||||||||||||
|
February 26, 2011
|
850,332
|
14.51
|
3.7
|
|||||||||
|
Nonvested at:
|
||||||||||||
|
February 26, 2011
|
4,425,005
|
3.18
|
9.5
|
|||||||||
As of February 26, 2011, the aggregate intrinsic value of outstanding, exercisable and nonvested options was zero. The total intrinsic value of options exercised during fiscal 2010, fiscal 2009 and fiscal 2008 was $5,000, $0.1 million and $0.5 million, respectively. The amount of cash received from the exercise of stock options in fiscal 2010 was approximately $28,000 and classified as financing cash flows.
Restricted Stock
For restricted stock units granted in 2010, one-fourth of the awards will vest at the end of fiscal 2011 and one-third will vest at the end of fiscal 2013, subject to the recipients of such restricted stock units meeting the appropriate eligibility and service conditions. As of February 26, 2011, approximately $2.1 million of total unrecognized compensation expense relating to these restricted stock units is expected to be recognized through fiscal 2013.
The following is a summary of the restricted stock units activity during fiscal 2010 and 2009. There were no restricted stock units granted prior to fiscal 2009.
|
Weighted Avg.
|
||||||||
|
Grant Date
|
||||||||
|
Shares
|
Fair Value
|
|||||||
|
Nonvested at February 28, 2009
|
-
|
$
|
-
|
|||||
|
Granted
|
1,573,755
|
4.29
|
||||||
|
Canceled or expired
|
(326,237
|
)
|
4.01
|
|||||
|
Vested
|
-
|
-
|
||||||
|
Nonvested at February 27, 2010
|
1,247,518
|
4.37
|
||||||
|
Granted
|
390,000
|
3.36
|
||||||
|
Canceled or expired
|
(657,760
|
)
|
4.65
|
|||||
|
Vested
|
(250,838
|
)
|
4.02
|
|||||
|
Nonvested at February 26, 2011
|
728,920
|
3.70
|
||||||
Performance Restricted Stock Units
The following is a summary of the performance restricted stock units activity during fiscal 2010, fiscal 2009 and fiscal 2008:
|
Weighted Avg.
|
||||||||
|
Grant Date
|
||||||||
|
Shares
|
Fair Value
|
|||||||
|
Nonvested at February 23, 2008
|
1,905,427
|
$
|
22.60
|
|||||
|
Granted
|
471,731
|
26.60
|
||||||
|
Canceled or expired
|
(121,021
|
)
|
20.63
|
|||||
|
Vested
|
(440,600
|
)
|
12.72
|
|||||
|
Nonvested at February 28, 2009
|
1,815,537
|
26.17
|
||||||
|
Granted
|
1,440,968
|
4.01
|
||||||
|
Canceled or expired
|
(795,242
|
)
|
18.94
|
|||||
|
Vested
|
(590,795
|
)
|
17.97
|
|||||
|
Nonvested at February 27, 2010
|
1,870,468
|
14.53
|
||||||
|
Granted
|
-
|
-
|
||||||
|
Canceled or expired
|
(1,764,421
|
)
|
13.31
|
|||||
|
Vested
|
(54,085
|
)
|
31.41
|
|||||
|
Nonvested at February 26, 2011
|
51,962
|
38.67
|
||||||
There were no performance restricted stock units granted during fiscal 2010. During fiscal 2009 and fiscal 2008, our Company granted 1,440,968 and 471,731 of performance restricted stock units to selected employees, respectively, for a total grant date fair value of $5.8 million and $12.5 million, respectively. The total fair value of shares vested during fiscal 2010, fiscal 2009 and fiscal 2008 was $0.2 million, $3.1 million and $12.1 million, respectively. We currently expect to recognize approximately $0.3 million of unrecognized fair value compensation expense for our performance restricted stock units under our fiscal 2007 executive and non-executive Integration Programs, through fiscal 2011, based on our estimates of attaining vesting criteria.
On May 21, 2009, our Board of Directors modified the terms of the performance restricted stock units granted under our executive and non-executive Integration Program by removing the achievement of specific stock price targets as a precondition to the vesting of earned units. The Board also approved a modification of the vesting schedule for non-executives for the earned units to vest as follows: one-third in July 2009, one-third in July 2010 and one-third in July 2011. Additionally, on July 16, 2009, the Board determined that 100% of the performance restricted stock units had been earned. In connection with this decision, we reversed $0.4 million of previously recognized expense for the ancillary shares during fiscal 2009. As a result of the foregoing modification and Board determination, our Company incurred an additional incremental compensation cost of $1.3 million, adjusted for actual forfeitures, of which $0.9 million has been recognized during 2010 and the remainder will be recognized through fiscal 2011.
Fiscal 2009 Annual Grant
Performance restricted stock units issued during fiscal 2009 were to be earned based on our Company achieving certain operating targets in fiscal 2009, which include Adjusted EBITDA targets. During the second quarter of fiscal 2009, we determined that the related performance conditions would not be achieved based on the changes in our forecast for fiscal 2009. Once this determination was made, our Company reversed the associated stock compensation expense recorded during the first quarter of fiscal 2009 and compensation expense is no longer recognized.
Fiscal 2008 Annual Grants
During fiscal 2008, based on changes in our current year forecast and three year strategic plan, our Company determined that the targets described under the terms of the remaining two-thirds of our 2006 award (performance criteria relating to one third of the 2006 grant was deemed to have been met upon the closing of the Pathmark transaction), our fiscal 2008 award, and our fiscal 2007 award were not probable of being met. Once this determination is made, compensation expense is no longer recognized and any recognized compensation expense is reversed. As a result, during fiscal 2008, we recorded a reversal of previously recorded compensation expense related to performance restricted stock of $5.2 million within “Store operating, general and administrative expense” in our Consolidated Statements of Operations. Of this amount, approximately $4.0 million of this reversal should have been recorded in fiscal 2007 as our performance targets were no longer probable due to dispositions in advance of our acquisition of Pathmark. Had our Company recorded this reversal during fiscal 2007, the reversal for not meeting performance targets in fiscal 2008 would have been approximately $3.0 million.
|
II.
|
2004 Non-Employee Director Compensation Plan:
This plan provides for the annual grant of Company common stock equivalent of $90,000 to members of our Board of Directors. The $90,000 grant of common stock shall be made on the first business day following the Annual Meeting of Stockholders. The number of shares of our Company’s common stock granted annually to each non-employee Director will be based on the closing price of the common stock on the New York Stock Exchange, as reported in the Wall Street Journal on the date of grant. Only whole shares will be granted; any remaining amounts will be paid in cash as promptly as practicable following the date of grant. Although this plan is still in effect, at this time our Company does not anticipate issuing to the non-employee Directors an annual grant of common stock or common stock equivalent in 2011.
As of February 26, 2011, approximately $2.0 million of Non-Employee Director Compensation has been deferred at the election of members or our Board of Directors.
|
NOTE 15 – Interest Expense, Net
Interest expense, net is comprised of the following:
|
Fiscal 2010
|
Fiscal 2009
|
Fiscal 2008
|
||||||||||
|
$655 million Credit Agreement
|
$
|
11,873
|
$
|
15,411
|
$
|
21,139
|
||||||
|
$800 million Debtor-in-Possession Credit Agreement
|
7,804
|
-
|
-
|
|||||||||
|
Related Party Promissory Note, due Aug. 18, 2011
|
480
|
607
|
300
|
|||||||||
|
11.375% Senior Secured Notes, due Aug. 1, 2015
|
29,493
|
16,665
|
-
|
|||||||||
|
9.125% Senior Notes, due Dec. 15, 2011
|
924
|
1,168
|
1,188
|
|||||||||
|
5.125% Convertible Senior Notes, due June 15, 2011
|
6,668
|
8,433
|
8,553
|
|||||||||
|
6.750% Convertible Senior Notes, due Dec. 15, 2012
|
13,572
|
17,165
|
17,409
|
|||||||||
|
9.375% Notes, due August 1, 2039
|
14,782
|
18,729
|
19,011
|
|||||||||
|
Capital lease obligations and Real estate liabilities
|
50,795
|
52,552
|
53,970
|
|||||||||
|
Dividends on Preferred Stock Liability
|
-
|
3,505
|
-
|
|||||||||
|
Self-insurance and GHI interest
|
17,148
|
14,792
|
10,859
|
|||||||||
|
GHI discount rate adjustment and COLI non-cash interest
|
6,070
|
15,906
|
1,375
|
|||||||||
|
Amortization of deferred financing fees and discounts
|
58,471
|
26,619
|
23,030
|
|||||||||
|
Other
|
329
|
1,506
|
757
|
|||||||||
|
Subtotal
|
218,409
|
193,058
|
157,591
|
|||||||||
|
Interest and dividend income
|
(40
|
)
|
(169
|
)
|
(591
|
)
|
||||||
|
Interest Expense, net
|
$
|
218,369
|
$
|
192,889
|
$
|
157,000
|
||||||
We recorded $35.7 million in financing fees and $7.8 million in contractual interest from the DIP Credit Agreement in fiscal 2010. We continued to record contractual interest for our $260 million 11.375% Senior Secured Notes due 2015 that were issued in August 2009. We did not record contractual interest expense of approximately $9.6 million for our Related Party Promissory Note, due August 18, 2011, 9.125% Senior Notes, due December 15, 2011, 5.125% Convertible Senior Notes, due June 15, 2011, 6.750% Convertible Senior Notes, due December 15, 2012, and 9.375% Notes, due August 1, 2039, all of which are unsecured obligations for which we ceased accruing interest during the fourth quarter 2010 as a result of the Bankruptcy Filing. Debt discounts and deferred financing fees for all debt which is subject to compromise were reclassified into the carrying value of the respective indebtedness upon the Bankruptcy Filing and the balances were then adjusted to the face value of the debt. As a result of this reclassification, we ceased amortization of deferred financing fees and discounts effective as of the Bankruptcy Filing date. Although we have recorded interest accretion expense on capital leases and real estate liabilities, self-insurance reserves, GHI and corporate owned life insurance obligations, we have not made a final determination as to the value of any underlying assets or the rejection/assumption of any of the obligations. Once a determination is made, the accretion of the interest expense may change.
NOTE 16 – Reorganization Items, Net
Reorganization items, net represent amounts incurred and recovered as a direct result of the Bankruptcy Filing and were comprised of the following:
|
Fiscal 2010
|
||||
|
(in thousands)
|
||||
|
Adjustments to unsecured debt - subject to compromise
|
$
|
(35,829
|
)
|
|
|
Adjustments to secured debt - subject to compromise
|
(15,602
|
)
|
||
|
Professional fees
|
(15,062
|
)
|
||
|
Write-off of capitalized financing fees
|
(10,684
|
)
|
||
|
Other financing fees
|
(3,826
|
)
|
||
|
US Trustee Fees
|
(427
|
)
|
||
|
Reduction of closed store reserve – continuing operations
|
59,445
|
|||
|
Reorganization items, net – continuing operations
|
(21,985
|
)
|
||
|
Reduction of store closures reserve – discontinued operations
|
133,264
|
|||
|
Total reorganization items, net
|
$
|
111,279
|
||
We have rejected 98 of our leases through the bankruptcy process and adjusted the reserve balance associated with these leases by $192.7 million, the allowable claim for damages, of which $59.4 million was attributed to continuing operations and $133.3 million was attributed to discontinued operations. Debt discounts and deferred financing fees for secured and unsecured pre-petition indebtedness were reclassified against the book value of the related debt and adjustments of $15.6 million and $35.8 million, respectively, were made to adjust the debt to face value. After our Company’s Bankruptcy Filing, we repaid our pre-existing first lien credit facility with a balance of $140.5 million with the proceeds from the $350.0 million term loan under the DIP Credit Agreement. As a result of the repayment, we immediately expensed financing fees of approximately $10.7 million as “Reorganization items, net” on the Consolidated Statement of Operations which were previously capitalized in connection with the first lien credit facility. Professional fees of $11.7 million were accrued. We paid approximately $3.4 million for professional fees during the fiscal 2010 related to our Bankruptcy Filing. Other financing fees of $3.8 million were paid prior to the Bankruptcy Filing for a proposed financing arrangement that was not executed. U.S. Trustee fees of approximately $0.4 million were incurred.
NOTE 17 – Income Taxes
A reconciliation of income taxes from continuing operations at the 35% federal statutory income tax rate for fiscal 2010, fiscal 2009 and fiscal 2008 to income taxes as reported is as follows:
|
Fiscal 2010
|
Fiscal 2009
|
Fiscal 2008
|
||||||||||
|
Income tax benefit from continuing operations
|
||||||||||||
|
computed at federal statutory income tax rate
|
$
|
237,019
|
$
|
280,925
|
$
|
40,318
|
||||||
|
State and local income taxes, net of federal tax
|
||||||||||||
|
benefit and valuation allowance
|
(296
|
)
|
3,975
|
(2,924
|
)
|
|||||||
|
Permanent difference relating to the sale of
|
||||||||||||
|
canadian assets
|
-
|
153,841
|
-
|
|||||||||
|
Permanent differences relating to Pathmark financing
|
||||||||||||
|
and impairments
|
7,880
|
(108,168
|
)
|
40,902
|
||||||||
|
Permanent item relating to Share Lending Agreement
|
-
|
-
|
(9,897
|
)
|
||||||||
|
Valuation allowance
|
(239,401
|
)
|
(307,784
|
)
|
(69,377
|
)
|
||||||
|
Other
|
(1,404
|
)
|
(795
|
)
|
(1,705
|
)
|
||||||
|
Income tax benefit (provision), as reported
|
$
|
3,798
|
$
|
21,994
|
$
|
(2,683
|
)
|
|||||
The effective tax rate on continuing operations of (0.6%) for fiscal 2010 varied from the statutory rate of 35%, primarily due to state and local income taxes, the increase in our valuation allowance, and the impact of the Pathmark financing and fiscal 2010 impairments. Approximately $3.1 million of the net income tax benefit resulted from the write-off of the deferred tax liability associated with the Pathmark trademark, an indefinite-lived intangible asset, as a result of its impairment during fiscal 2010.
The effective tax rate on continuing operations of (2.7%) for fiscal 2009 varied from the statutory rate of 35%, primarily due to state and local income taxes, the increase in our valuation allowance as our Company could not recognize the benefit from our current losses, the remeasurement of uncertain tax positions, and the impact of the Pathmark financing and fiscal 2009 impairments. Approximately $16.0 million of the net income tax benefit resulted from the write-off of the deferred tax liability associated with the Pathmark trademark, an indefinite-lived intangible asset, as a result of its impairment during fiscal 2009.
The effective tax rate on continuing operations of 2.3% for fiscal 2008 varied from the statutory rate of 35%, primarily due to state and local income taxes, the increase in our valuation allowance and the impact of the Pathmark financing and the adjustment as a result of share lending agreements.
The benefit from (provision for) income taxes from continuing operations consisted of the following:
|
Fiscal 2010
|
Fiscal 2009
|
Fiscal 2008
|
||||||||||
|
Current:
|
||||||||||||
|
Federal
|
$
|
1,183
|
$
|
156,196
|
$
|
2,397
|
||||||
|
State and local
|
(455
|
)
|
6,116
|
(4,498
|
)
|
|||||||
|
Foreign taxes
|
12
|
(36
|
)
|
(582
|
)
|
|||||||
|
740
|
162,276
|
(2,683
|
)
|
|||||||||
|
Deferred:
|
||||||||||||
|
Federal
|
3,058
|
(140,282
|
)
|
-
|
||||||||
|
Benefit from (provision for) income taxes
|
$
|
3,798
|
$
|
21,994
|
$
|
(2,683
|
)
|
|||||
A deferred tax asset is recognized for temporary differences that will result in deductible amounts in future years and for carryforwards. In addition, a valuation allowance is recognized if, based on existing facts and circumstances, it is more likely than not that some portion or all of the deferred tax asset will not be realized. Based upon our continued assessment of the realization of our net deferred tax asset and our historic cumulative losses, we concluded that it was appropriate to record a valuation allowance in an amount that would reduce our net deferred tax asset to zero, exclusive of the deferred tax liability for our Pathmark tradename.
Our valuation allowance increased by $256.6 million during fiscal 2010, to reflect generation of additional operating losses, future deductible of temporary differences and impairment of indefinite lived intangible assets, partially offset by an adjustment to the valuation allowance related to the realizability of indefinite long lived assets. Our valuation allowance increased by $361.1 million during fiscal 2009, to reflect generation of additional operating losses, remeasurement of our uncertain tax positions and impairment of indefinite lived intangible assets, partially offset by an adjustment to the valuation allowance that was released in connection with the original purchase price allocation for Pathmark. In future periods, we will continue to record a valuation allowance against net deferred tax assets that are created by losses until such time as the certainty of future tax benefits can be reasonably assured.
The components of net deferred tax assets (liabilities) are as follows:
|
Feb. 26, 2011
|
Feb. 27, 2010
|
|||||||
|
Current assets:
|
||||||||
|
Insurance reserves
|
$
|
14,728
|
$
|
33,403
|
||||
|
Other reserves and accrued benefits
|
24,217
|
52,988
|
||||||
|
Accrued postretirement and postemployment benefits
|
1,033
|
959
|
||||||
|
Pension obligations
|
14,944
|
16,111
|
||||||
|
Other
|
6,747
|
6,648
|
||||||
|
61,669
|
110,109
|
|||||||
|
Current liabilities:
|
||||||||
|
Inventories
|
(37,012
|
)
|
(39,589
|
)
|
||||
|
Health and welfare
|
(1,616
|
)
|
(1,777
|
)
|
||||
|
Other
|
(4,131
|
)
|
(6,101
|
)
|
||||
|
(42,759
|
)
|
(47,467
|
)
|
|||||
|
Valuation allowance
|
(47,245
|
)
|
(65,937
|
)
|
||||
|
Net current deferred income taxes included in “Other accruals” and
|
||||||||
|
“Prepaid expenses and other current assets,” respectively
|
$
|
(28,335
|
)
|
$
|
(3,295
|
)
|
||
|
Non-current assets:
|
||||||||
|
Net operating losses
|
$
|
390,870
|
$
|
282,688
|
||||
|
Foreign tax credits
|
69,261
|
69,261
|
||||||
|
Alternative minimum tax credits and general business credits
|
51,306
|
51,661
|
||||||
|
Other reserves including asset disposition charges
|
131,859
|
147,971
|
||||||
|
Lease obligations
|
4,053
|
9,480
|
||||||
|
Insurance reserves
|
153,941
|
87,536
|
||||||
|
Accrued postretirement and postemployment benefits
|
16,747
|
15,696
|
||||||
|
Pension obligations
|
111,377
|
114,552
|
||||||
|
Step rents
|
23,640
|
24,344
|
||||||
|
State tax credits
|
22,789
|
22,789
|
||||||
|
Pathmark financing
|
20,148
|
9,084
|
||||||
|
Debtor in possession financing fee
|
15,010
|
-
|
||||||
|
Other
|
3,249
|
2,765
|
||||||
|
1,014,250
|
837,827
|
|||||||
|
Non-current liabilities:
|
||||||||
|
Depreciation
|
(143,887
|
)
|
(261,842
|
)
|
||||
|
Pension obligations
|
-
|
-
|
||||||
|
Intangibles
|
(52,201
|
)
|
(62,039
|
)
|
||||
|
Pathmark financing
|
(9,460
|
)
|
(9,460
|
)
|
||||
|
Other
|
(14,951
|
)
|
(14,137
|
)
|
||||
|
(220,499
|
)
|
(347,478
|
)
|
|||||
|
Valuation allowance
|
(777,021
|
)
|
(501,716
|
)
|
||||
|
Net non-current deferred income tax asset in
|
||||||||
|
“Other non-current liabilities” and “Other assets,” respectively
|
$
|
16,730
|
$
|
(11,367
|
)
|
|||
At February 26, 2011, we had federal Net Operating Loss (“NOL”) carryforwards of $903.0 million, which will expire between fiscal 2023 and 2030, some of which are subject to an annual limitation. The federal NOL carryforwards include $7.4 million related to the excess tax deductions for stock option plans that have yet to reduce income taxes payable. Upon utilization of these carryforwards, the associated tax benefits of approximately $2.6 million will be recorded in “Additional paid-in capital”. In addition, we had state loss carryforwards of $1.0 billion that will expire between fiscal 2010 and fiscal 2030. Our Company’s general business credits consist of federal and state work incentive credits, which expire between fiscal 2010 and fiscal 2030, some of which are subject to an annual limitation.
On December 3, 2007, our Company acquired Pathmark Stores, Inc. The acquired federal net operating loss carryforwards of $56.3 million are subject to limitations. Management believes these limitations will not have a material impact on the Company’s ability to utilize such pre-acquisition net operating losses.
Reconciliation of Unrecognized Tax Benefits:
|
Tax
|
Interest
|
Total
|
||||||||||
|
Balance at February 23, 2008
|
$
|
163,238
|
$
|
1,046
|
$
|
164,284
|
||||||
|
Decrease related to prior period
|
||||||||||||
|
tax positions
|
-
|
(82
|
)
|
(82
|
)
|
|||||||
|
Settlements
|
(297
|
)
|
-
|
(297
|
)
|
|||||||
|
Lapse of statute of limitations
|
(1,127
|
)
|
-
|
(1,127
|
)
|
|||||||
|
Balance at February 28, 2009
|
161,814
|
964
|
162,778
|
|||||||||
|
Decrease related to prior period
|
||||||||||||
|
(156,773
|
)
|
-
|
(156,773
|
)
|
||||||||
|
Settlements
|
534
|
-
|
534
|
|||||||||
|
Lapse of statute of limitations
|
(4,171
|
)
|
(958
|
)
|
(5,129
|
)
|
||||||
|
Balance at February 27, 2010
|
1,404
|
6
|
1,410
|
|||||||||
|
Decrease related to prior period
|
||||||||||||
|
tax positions
|
(208
|
)
|
(4
|
)
|
(212
|
)
|
||||||
|
Settlements
|
154
|
-
|
154
|
|||||||||
|
Lapse of statute of limitations
|
(752
|
)
|
-
|
(752
|
)
|
|||||||
|
Balance at February 26, 2011
|
$
|
598
|
$
|
2
|
$
|
600
|
||||||
Our Company is subject to U.S. federal income tax, as well as income tax in multiple state and foreign jurisdictions. As of February 26, 2011, with a few exceptions, we remain subject to examination by federal, state and local tax authorities for tax years 2005 through 2009. With a few exceptions, we are no longer subject to federal, state or local examinations by tax authorities for tax years 2004 and prior.
At February 26, 2011, we had unrecognized tax benefits of $0.6 million, which were recorded in “Other accruals”. At February 27, 2010, unrecognized tax benefits of $1.4 million were recorded in “Other accruals”. The remeasurement of our uncertain tax positions resulted in a decrease in our unrecognized tax benefits and an increase in our valuation allowance on our net deferred tax asset and did not impact our effective tax rate. We do not expect that the amount of our gross unrecognized tax positions will change significantly in the next 12 months. Any future decrease in our Company's gross unrecognized tax positions would require a reevaluation of our Company's valuation allowance maintained on our net deferred tax asset and, therefore, is not expected to affect our effective tax rate. Our Company classifies interest and penalty expense related to unrecognized tax benefits within “Benefit from (provision for) income taxes” in our Consolidated Statements of Operations. During fiscal 2010, fiscal 2009 and fiscal 2008, we did not record any interest or penalties.
Income tax payments, net of income tax refunds, for fiscal 2010, fiscal 2009 and fiscal 2008 were approximately $(8.9) million, $3.8 million and $3.9 million, respectively.
On July 30, 2008, The Housing Assistance Act of 2008 (“the Act”) was signed into law. The Act contained a provision allowing corporate taxpayers to make an election to treat certain unused research and Alternative Minimum Tax (AMT) credit carryforwards as refundable in lieu of claiming bonus and accelerated depreciation for “eligible qualified property” placed in service through the end of fiscal 2008. The American Reinvestment and Recovery Tax Act, which was enacted on February 17, 2009, extended this election through 2009. The Tax Relief, Unemployment Insurance Reauthorization, and Job Creation Act of 2010, extended the election again for 2011 and 2012. We expect the refund to be approximately $1.1 million for fiscal 2010, for a total refund of $5.9 million to date.
We have received approval to pay pre-petition employee withholding obligations in addition to employment and wage related taxes, sales and use taxes, and certain other taxes due in the normal course of business through certain 'first day' motions. As such, we have paid the applicable taxes when due except for amounts that are in dispute.
All post-petition tax obligations to the proper taxing authorities are current. A deferred tax liability of $28.3 million is included within “Other accrued liabilities” in the Consolidated Balance Sheet. Pre-petition amounts owed for our pro-rata portion of certain taxes for which we reimburse third parties have not been paid.
NOTE 18 — Loss Per Share
The following table sets forth the loss from continuing operations and common shares outstanding that are used in the calculation of basic and diluted earnings per share:
|
Fiscal 2010
|
Fiscal 2009
|
Fiscal 2008
|
||||||||||
|
Loss from continuing operations
|
$
|
(673,400
|
)
|
$
|
(780,650
|
)
|
$
|
(117,882
|
)
|
|||
|
Preferred stock dividends
|
(11,538
|
)
|
(4,572
|
)
|
-
|
|||||||
|
Beneficial conversion feature amortization
|
(4,813
|
)
|
(1,552
|
)
|
-
|
|||||||
|
Loss from continuing operations – basic
|
(689,751
|
)
|
(786,774
|
)
|
(117,882
|
)
|
||||||
|
Adjustments for convertible debt (1)
|
-
|
-
|
(30,621
|
)
|
||||||||
|
Adjustments on Other financial liabilities (2)
|
(13,777
|
)
|
9,181
|
(101,336
|
)
|
|||||||
|
Loss from continuing operations – diluted
|
$
|
(703,528
|
)
|
$
|
(777,593
|
)
|
$
|
(249,839
|
)
|
|||
|
Weighted average common shares outstanding
|
55,733,883
|
57,646,795
|
57,647,679
|
|||||||||
|
Share lending agreement (3)
|
(2,014,183
|
)
|
(4,443,054
|
)
|
(6,699,485
|
)
|
||||||
|
Common shares outstanding – basic
|
53,719,700
|
53,203,741
|
50,948,194
|
|||||||||
|
Effect of dilutive securities:
|
||||||||||||
|
Convertible debt (1)
|
-
|
-
|
7,725,182
|
|||||||||
|
Convertible financial liabilities (2)
|
(51,181,464
|
)
|
(23,431,837
|
)
|
(7,790,155
|
)
|
||||||
|
Common shares outstanding–diluted
|
2,538,236
|
29,771,904
|
50,883,221
|
|||||||||
|
(1)
|
We have debt instruments with a bifurcated conversion feature that were recorded at a significant discount. (Refer to Note 9 – Indebtedness and Other Financial Liabilities). For purposes of determining if an application of the “if-converted method” to these convertible instruments produces a dilutive result, we consider the combined impact of the numerator and denominator adjustments, including a numerator adjustment for gains and losses, which would have been incurred had the instruments been converted on the first day of the period presented.
|
|
(2)
|
Our Series B Warrants are classified as a liability because a third party has the right to determine their cash or share settlement. (Refer to Note 9 – Indebtedness and Other Financial Liabilities). These warrants are marked-to-market on our Consolidated Statements of Operations. For example, in periods when the market price of our common stock decreases, our income from continuing operations is increased. For purposes of determining if an application of the treasury stock method produces a dilutive result, we assume proceeds are used to repurchase common stock and we adjust the numerator similar to the adjustments required under the “if-converted” method. We consider the combined impact of the numerator and denominator adjustments, including a denominator adjustment to reduce shares, even when the average market price of our common stock for the period is below the warrant’s strike price. The significant increase in dilutive securities during fiscal 2010 was the result of a significant decline in the price of our common stock during fiscal 2010.
|
|
(3)
|
As of February 27, 2010, we had 5,634,002 of loaned shares under our share lending agreements, which were considered issued and outstanding. The obligation of the financial institutions to return the borrowed shares has been accounted for as prepaid forward contract and, accordingly, shares underlying this contract are removed from the computation of basic and diluted earnings per share, unless the borrower defaults on returning the related shares. On September 15, 2008, Lehman Europe, who is a party to a 3,206,058 share lending agreement with our Company filed under Chapter 11 of the U.S. Bankruptcy Code with the United States Bankruptcy Court and/or commenced equivalent proceedings in jurisdictions outside of the United States (collectively, the “Lehman Bankruptcy”). As such, we have included these loaned shares as issued and outstanding effective September 15, 2008 for purposes of computing our basic and diluted weighted average shares and (loss) income per share (Refer to Note 19 - Capital Stock). During fiscal 2009, Bank of America, N.A., who is a party to our share lending agreement, returned 2,500,000 shares, eliminating our obligation to lend additional shares to them in the future. The returned shares were immediately retired, reducing our issued and outstanding shares. As of February 26, 2011, there were no shares outstanding with Bank of America, N.A. During fiscal 2010, fiscal 2009 and fiscal 2008, weighted average common shares relating to share lending agreement of 2,014,183, 4,443,054, and 6,699,485, respectively, were excluded from the computation of earnings per share.
|
The following table contains common share equivalents, which were not included in the historical loss per share calculations as their effect would be antidilutive:
|
Fiscal 2010
|
Fiscal 2009
|
Fiscal 2008
|
||||
|
Stock options
|
6,545,887
|
2,258,431
|
1,785,583
|
|||
|
Warrants
|
686,277
|
686,277
|
686,277
|
|||
|
Performance restricted stock units
|
150,666
|
482,579
|
514,031
|
|||
|
Restricted stock units
|
982,469
|
1,016,272
|
-
|
|||
|
Convertible debt
|
11,278,988
|
11,278,988
|
3,553,806
|
|||
|
Financing warrant
|
11,278,988
|
11,278,988
|
11,278,988
|
|||
|
Preferred stock
|
35,804,000
|
35,000,000
|
-
|
|||
NOTE 19 – Capital Stock
Share Lending Agreements
We entered into share lending agreements, dated December 12, 2007, with certain financial institutions, under which we agreed to loan up to 11,278,988 shares of our common stock (subject to certain adjustments set forth in the share lending agreements). These borrowed shares must be returned to us no later than December 15, 2012 or sooner if certain conditions are met. If an event of default should occur under the stock lending agreement and a legal obstacle exists that prevents the Borrower from returning the shares, the Borrower shall, upon written request of our Company, pay our Company, using available funds, in lieu of the delivery of loaned shares, to settle its obligation. On June 26, 2008, our shareholders approved to loan up to an additional 1,577,569 shares of our Company’s common stock pursuant to the share lending agreement.
Pursuant to these agreements, we loaned 8,134,002 shares of our stock, of which 6,300,752 shares were sold to the public on December 18, 2007 in a public offering, to facilitate hedging transactions relating to the issuance of our 5.125% and 6.75% Convertible Notes. We did not receive any proceeds from the sale of the borrowed shares. We received a nominal lending fee from the financial institutions pursuant to the share lending agreements.
Any shares we loan are considered issued and outstanding. Investors that purchase borrowed shares are entitled to the same voting and dividend rights as any other holders of our common stock; however, the financial institutions will not have such rights pursuant to the share lending agreements. The obligation of the financial institutions to return the borrowed shares has been accounted for as a prepaid forward contract and, accordingly, shares underlying this contract, except for shares held by Lehman described below, are removed from the computation of basic and dilutive earnings per share. On November 23, 2009, Bank of America, N.A., who is a party to our share lending agreement, returned 1,000,000 shares, eliminating our obligation to lend additional shares to them in the future. Bank of America, N.A. returned an additional 1,500,000 shares on January 6, 2010, 1,500,000 shares on December 21, 2010 and 927,944 shares on January 4, 2011. All of the returned shares were immediately retired, reducing the number of our common shares issued and outstanding. The return of these shares has no impact on the computations of our basic and diluted earnings per share. As of February 26, 2011, there were no shares outstanding under this share lending agreement.
On September 15, 2008, Lehman and certain of its subsidiaries, including Lehman Europe, filed a petition under Chapter 11 of the U.S. Bankruptcy Code with the United States Bankruptcy Court and/or commenced equivalent proceedings in jurisdictions outside of the United States (collectively, the “Lehman Bankruptcy”). Lehman Europe was party to a 3,206,058 share lending agreement with our Company. Due to the circumstances of the Lehman Bankruptcy, we had recorded these loaned shares as issued and outstanding effective September 15, 2008, for purposes of computing and reporting our Company’s basic and diluted weighted average shares and earnings per share.
Call Options
Concurrent with the issuance of the senior convertible notes, as discussed in Note 9 – Indebtedness and Other Financial Liabilities, our Company entered into call options with financial institutions that are affiliates of the underwriters together with the financing warrants discussed in Note 9 – Indebtedness and Other Financial Liabilities to reduce the potential dilution upon future conversion of the notes and effectively increase the conversion price of the notes. The call options allow the Company to purchase common shares at $36.40 with respect to the 5.125% Notes and $37.80 with respect to the 6.75% Notes. These instruments are accounted for as free standing derivatives and are recorded as equity of $73.5 million in the Consolidated Balance Sheets.
On or about October 3, 2008, Lehman Brothers OTC Derivatives, Inc. or “LBOTC,” who accounts for 50% of our call option and financing warrant transactions, filed for bankruptcy protection, which is an event of default under such transactions. We are carefully monitoring the developments affecting LBOTC, noting the impact of the LBOTC bankruptcy effectively reduced conversion prices for 50% of our convertible senior notes to their stated prices of $36.40 for the 5.125% Notes and $37.80 for the 6.750% Notes.
In the event we terminate these transactions, or they are canceled in bankruptcy, or LBOTC otherwise fails to perform its obligations under such transactions, we would have the right to monetary damages in the form of an unsecured claim against LBOTC in an amount equal to the present value of our cost to replace these transactions with another party for the same period and on the same terms.
Warrants
As part of the acquisition of Pathmark, we assumed 5,294,118 of outstanding Pathmark 2000 warrants. Upon exercise at the price of $22.31, each warrant entitled the holder to receive 0.12963 shares of A&P common stock and $9.00 in cash. The Pathmark 2000 warrants expired in September of 2010. As part of the acquisition of Pathmark on December 3, 2007, we issued 6,965,858 roll-over stock warrants in exchange for Pathmark’s 2005 Series B warrants.
Other
Our articles of incorporation permit our board of directors to issue preferred shares without first obtaining stockholder approval. If we issued preferred shares, these additional securities may have dividend or liquidation preferences senior to our common stock. If we issue convertible preferred shares, a subsequent conversion may dilute the current common stockholders’ interest. Issuance of such preferred stock could adversely affect the price of our common stock.
NOTE 20 – Segments
We report segments based on our internal organization and reporting of revenue and segment income. The segments are designed to allocate resources internally and provide a framework to determine management responsibility. Reportable segments are defined as components of an enterprise about which separate financial information is available that is evaluated regularly by the chief operating decision maker in deciding how to allocate resources and in assessing performance. Our chief operating decision maker is our President and Chief Executive Officer.
We currently have four reportable segments: Fresh, Pathmark, Gourmet and Other. The Other segment includes our Discount and Wine, Beer & Spirits businesses.
We measure segment performance based upon segment income (loss). Reconciling amounts between segment income (loss) and loss from operations include corporate-level activity not specifically attributed to a segment, which includes (i) the merchandising department (including the design and production of private label merchandise sold in our retail stores), (ii) real estate management and (iii) information technology, finance and other corporate administrative personnel, as well as, other reconciling items primarily attributed to nonrecurring activities. Refer to the table below for detailed information relating to the other reconciling items.
Assets and capital expenditures are not allocated to segments for internal reporting presentations. Certain segment reclassifications have been made to segment information disclosed previously to conform to how our chief operating decision maker currently manages our business.
|
OPERATING DATA
|
Fiscal 2010
|
Fiscal 2009
|
Fiscal 2008
|
|||||||||
|
Sales by category
|
||||||||||||
|
Grocery (1)
|
$
|
5,575,449
|
$
|
6,151,413
|
$
|
6,663,157
|
||||||
|
Meat (2)
|
1,562,599
|
1,664,226
|
1,792,311
|
|||||||||
|
Produce (3)
|
940,407
|
997,929
|
1,060,718
|
|||||||||
|
Total Company
|
$
|
8,078,455
|
$
|
8,813,568
|
$
|
9,516,186
|
||||||
|
(1)
|
The grocery category includes grocery, frozen foods; dairy; general merchandise/health and beauty aids; wine, beer & spirits and pharmacy.
|
|
(2)
|
The meat category includes meat, deli, bakery and seafood.
|
|
(3)
|
The produce category includes produce and floral.
|
|
Fiscal 2010
|
Fiscal 2009
|
Fiscal 2008
|
||||||||||
|
Sales
|
||||||||||||
|
Fresh
|
$
|
4,060,958
|
$
|
4,402,044
|
$
|
4,806,467
|
||||||
|
Pathmark (4)
|
3,451,876
|
3,855,251
|
4,173,017
|
|||||||||
|
Gourmet
|
266,003
|
273,060
|
281,767
|
|||||||||
|
Other
|
299,618
|
283,213
|
254,935
|
|||||||||
|
Total sales
|
$
|
8,078,455
|
$
|
8,813,568
|
$
|
9,516,186
|
||||||
|
Segment income (loss)
|
||||||||||||
|
Fresh
|
$
|
41,573
|
$
|
111,582
|
$
|
148,617
|
||||||
|
Pathmark (4)
|
(84,017
|
)
|
(46,326
|
)
|
19,012
|
|||||||
|
Gourmet
|
20,419
|
25,691
|
24,866
|
|||||||||
|
Other
|
1,822
|
1,472
|
2,184
|
|||||||||
|
Total segment (loss) income
|
(20,203
|
)
|
92,419
|
194,679
|
||||||||
|
Corporate
|
(145,005
|
)
|
(114,335
|
)
|
(123,016
|
)
|
||||||
|
Reconciling items (5)
|
(285,413
|
)
|
(578,658
|
)
|
(146,726
|
)
|
||||||
|
Loss from operations
|
(450,621
|
)
|
(600,574
|
)
|
(75,063
|
)
|
||||||
|
Nonoperating income (loss)
|
13,777
|
(9,181
|
)
|
116,864
|
||||||||
|
Interest expense, net
|
(218,369
|
)
|
(192,889
|
)
|
(157,000
|
)
|
||||||
|
Reorganization items, net
|
(21,985
|
)
|
-
|
-
|
||||||||
|
Loss from continuing operations before income taxes
|
$
|
(677,198
|
)
|
$
|
(802,644
|
)
|
$
|
(115,199
|
)
|
|||
|
Fiscal 2010
|
Fiscal 2009
|
Fiscal 2008
|
||||||||||
|
Segment depreciation and amortization – continuing operations
|
||||||||||||
|
Fresh
|
$
|
73,043
|
$
|
83,080
|
$
|
91,327
|
||||||
|
Pathmark (4)
|
82,943
|
95,029
|
99,061
|
|||||||||
|
Gourmet
|
8,309
|
9,386
|
10,119
|
|||||||||
|
Other
|
5,474
|
4,661
|
3,722
|
|||||||||
|
Total segment depreciation and amortization – continuing operations
|
169,769
|
192,156
|
204,229
|
|||||||||
|
Corporate
|
48,629
|
53,304
|
56,762
|
|||||||||
|
Total company depreciation and amortization
|
$
|
218,398
|
$
|
245,460
|
$
|
260,991
|
||||||
|
(4)
|
Includes results from A&P stores that have been subsequently converted to Pathmark stores.
|
|
(5)
|
Reconciling items, which are not included in segment income, consist of the following:
|
|
Fiscal 2010
|
Fiscal 2009
|
Fiscal 2008
|
||||||||||
|
Goodwill, trademark and long-lived asset impairment
|
$
|
(114,183
|
)
|
$
|
(477,180
|
)
|
$
|
-
|
||||
|
Net restructuring and other
|
(27,843
|
)
|
(16,670
|
)
|
(35,866
|
)
|
||||||
|
Real estate related activity
|
(58,338
|
)
|
(37,093
|
)
|
(40,161
|
)
|
||||||
|
Stock-based compensation
|
(1,267
|
)
|
(5,667
|
)
|
(5,694
|
)
|
||||||
|
Pension withdrawal costs
|
-
|
(2,445
|
)
|
(28,911
|
)
|
|||||||
|
Insurance reserve adjustment
|
(81,739
|
)
|
(40,445
|
)
|
-
|
|||||||
|
Share lending accounting restatement
|
-
|
-
|
(28,277
|
)
|
||||||||
|
LIFO adjustment
|
(2,043
|
)
|
842
|
(7,817
|
)
|
|||||||
|
Total reconciling items
|
$
|
(285,413
|
)
|
$
|
(578,658
|
)
|
$
|
(146,726
|
)
|
|||
NOTE 21 – Related Party Transactions
Concurrently with the execution of the Pathmark Merger Agreement, on March 4, 2007, Tengelmann and the Company entered into the Stockholder Agreement (the “Tengelmann Stockholder Agreement”). Under the terms of the Tengelmann Stockholder Agreement, the Company has agreed to provide Tengelmann with board designation and governance rights regarding certain transactions as long as it holds a specified percentage of the outstanding Company common stock; most of these rights have also been made via an amendment of the Company’s by-laws that became effective as of the transaction closing. The Tengelmann Stockholder Agreement also provides Tengelmann with certain demand and piggyback registration rights and certain preemptive rights.
Concurrently with the execution of the Pathmark Merger Agreement, on March 4, 2007, the Company and Yucaipa Corporate Initiatives Fund I, LP, Yucaipa American Alliance Fund I, LP and Yucaipa American Alliance (Parallel) Fund I, LP, funds affiliated with The Yucaipa Companies LLC (collectively, “Yucaipa”), entered into a stockholder agreement (the “Yucaipa Stockholder Agreement”), and a warrant Agreement (the “Yucaipa Warrant Agreement”). This agreement provided Pathmark representation on our Board of Directors. Under the terms of the Yucaipa Warrant Agreement, the Company issued to Yucaipa warrants to purchase the Company’s common stock in exchange for the cancellation of warrants to purchase Pathmark common stock. Options and other rights to acquire Pathmark equity have been converted into the right to receive cash, Company common stock or Company stock options as set forth in the Merger Agreement. Under the terms of the Yucaipa Stockholder Agreement, Yucaipa has agreed to certain restrictions on its ownership, acquisition and disposition of Company common stock and warrants to purchase Company common stock that it will own and may acquire after the merger. In addition, Yucaipa, its affiliates and general partners have agreed not to take certain actions relating to the governance of the Company. The Yucaipa Stockholder Agreement also provides Yucaipa with certain demand and piggyback registration rights.
On August 4, 2009, our Company issued 60,000 shares of 8.0% Cumulative Convertible Preferred Stock, Series A-T, without par value, to affiliates of Tengelmann and 115,000 shares of 8.0% Cumulative Convertible Preferred Stock, Series A-Y, without par value, to affiliates of Yucaipa for net proceeds of approximately $162.2 million. Concurrently with the issuance of the Preferred Stock, the Company entered into an amended and restated stockholder agreement with Tengelmann (the “Amended and Restated Tengelmann Stockholder Agreement”) and an amended and restated stockholder agreement with Yucaipa (the “Amended and Restated Yucaipa Stockholder Agreement” and, together with the Amended and Restated Tengelmann Stockholder Agreement, the “Stockholder Agreements”), amended its By-laws and filed Articles Supplementary with respect to the Preferred Stock, appointed two directors designated by Yucaipa to the Company’s Board and reelected four existing Tengelmann directors to the Company’s Board.
Without Tengelmann and Yucaipa’s approval, the Company may not consummate certain business combinations, issue additional equity securities, amend the Company’s charter or by-laws, make amendments to Board committee charters which would circumvent the Stockholder Agreements, take actions which would dilute their ownership, take actions to amend certain of the Company’s existing indebtedness or limit the Company’s ability to pay cash dividends on the Preferred Stock. In addition, depending upon specified ownership thresholds maintained by Tengelmann and Yucaipa, without the approval of a majority of Tengelmann-appointed directors and at least one Yucaipa-appointed director, the Company may not enter into certain acquisitions or dispositions of assets, offer or repurchase equity securities, incur debt above specified levels or declare dividends on the Company’s common stock. Based upon certain ownership thresholds, without Tengelmann’s approval, the Company may not adopt certain anti-takeover measures or enter into affiliate transactions and the approval of a majority of Tengelmann directors may be required in order to adopt or amend any long-term strategic plan, adopt or amend any operating plan or budget or make capital expenditures over a certain threshold or appoint a chief executive officer. During the Bankruptcy Filing, the Company does not expect to comply with the terms of the Stockholder Agreement or the Articles Supplementary to the Preferred Stock.
The Company granted certain registration rights, preemptive rights and rights to nominate directors to the Company’s Board to Tengelmann and Yucaipa and certain tag-along rights to Yucaipa. In addition, Yucaipa granted the Company a right of first offer under certain circumstances on the transfer of voting power, which if exercised by the Company would then provide Tengelmann the right to purchase any such securities, pursuant to an agreement between the Company and Tengelmann.
Until August 4, 2014, or earlier if certain conditions occur, Yucaipa is subject to a standstill provision which prevents Yucaipa, without the approval of the majority of the Board of Directors (excluding the directors designated by Yucaipa), from acquiring beneficial ownership of common stock or voting interests in common stock to an extent that exceeds 35.5% of our Company’s outstanding Common Stock. Prior to December 4, 2010, subject to limited exceptions, Yucaipa may not transfer its Preferred Stock and is prohibited from transferring any securities to certain designated persons.
We entered into agreements with four employees from Yucaipa for consulting services. In connection with these consulting agreements agreement, we made total payments of $2.2 million and $0.2 million during fiscal 2010 and fiscal 2009, respectively.
During fiscal 2010, fiscal 2009 and fiscal 2008, our Company purchased $2.9 million, $4.7 million and $2.9 million in store fixtures from Source Interlink Companies, Inc, a media and marketing services company whose offerings include design, manufacture, and installation of wire fixtures and displays in major retail chains. Gregory Mays, who is a member of our Board of Directors, is the Chairman and Chief Executive Officer of Source Interlink Companies, Inc.
On September 2, 2008, our Company borrowed $10.0 million from Erivan Karl Haub and issued a three-year, unsecured promissory note (the “Note”). Erivan Haub is the father of our Executive Chairman and is a limited partner of Tengelmann. The principal is due in a lump sum payment on August 18, 2011 and will bear interest at the rate of 6% per year, payable in 12 equal payments of $0.15 million over the term of the Note. During fiscal 2010, fiscal 2009 and fiscal 2008, we paid interest of $0.45 million, $0.75 million and $0.15 million, respectively, and recorded interest expense of $0.5 million, $0.6 million and $0.3 million, respectively, on this note. This note is subject to compromise, as discussed in Note 10 – Liabilities Subject to Compromise.
On January 4, 2008 the Company entered into an extension of a real estate lease for a residence for the benefit of Andreas Guldin, the Company’s Vice Chairman and member of the Board of Directors. The term of the lease, as extended, ran through May 31, 2010. The payment of Mr. Guldin’s living expenses was a Company obligation under the Company’s employment agreement with Mr. Guldin. All rent payments under the lease, as extended, represented income that was taxable to Mr. Guldin; however, Mr. Guldin’s annual income was “grossed up” by the Company in an amount that was necessary to cover this tax obligation.
We owned a jet aircraft, which Tengelmann leased under a full cost reimbursement lease. Prior to its sale in February 2009, Tengelmann was obligated to and has reimbursed us $1.4 million and $4.6 million during fiscal 2008 and 2007, respectively, for their use of the aircraft.
NOTE 22 – Commitments and Contingencies
Supply Agreement
Our Company currently acquires a majority of our saleable inventory from one supplier, C&S Wholesale Grocers, Inc. (“C&S”). Under our March 7, 2008 agreement, C&S provides warehousing, logistics, procurement and purchasing services (the “Services”) in support of our Company's entire supply chain. This agreement expires on September 29, 2018. The agreement defines the parties' respective responsibilities for the procurement and purchase of merchandise intended for use or resale at our Company's stores, as well as the parties' respective remuneration for warehousing and procurement/purchasing activities. In consideration for its services, C&S is paid an annual fee and has incentive income opportunities based upon our cost savings and increases in retail sales volume. The agreement also provides that we will purchase virtually our entire warehoused inventory from C&S. We are rebidding the Services to ensure that the structure and cost and costs of our entire supply chain are more closely aligned with the needs of our business. The rebidding of the Services may result in a rejection or termination of our agreement with C&S in Bankruptcy Court. We anticipate that the rebidding process will result in significant cost savings in fiscal 2011 and beyond, but there can be no assurance that these efforts will be successful or will result in any savings or improvements.
Lease Assignment
On August 14, 2007, Pathmark entered into a leasehold assignment contract for the sale of its leasehold interests in one of its stores to CPS Operating Company LLC, a Delaware limited liability company ("CPS"). Pursuant to the terms of the agreement, Pathmark was to receive $87.0 million for assigning and transferring to CPS all of Pathmark's interest in the lease and CPS was to have assumed all of the duties and obligations of Pathmark under the lease. CPS deposited $6.0 million in escrow as a deposit against the purchase price for the lease, which is non-refundable to CPS, except as otherwise expressly provided in the agreement. The assignment of the lease was scheduled to close on December 28, 2007. On December 27, 2007, CPS issued a notice terminating the agreement for reason of a purported breach of the agreement, which, if proven, would require the return of the escrow. We are disputing the validity of CPS’s notice of termination as we believe CPS's position is without merit. Because we are challenging the validity of CPS’s December 27, 2007 notice of termination, we issued our own notice to CPS on December 31, 2007, asserting CPS's breach of the agreement as a result of their failure to close on December 28, 2007. CPS’s breach, if proven, would entitle us to keep the escrow. Both parties have taken legal action to obtain the $6.0 million deposit held in escrow.
LaMarca et al v. The Great Atlantic & Pacific Tea Company, Inc (“Defendants”)
On June 24, 2004, a class action complaint was filed in the Supreme Court of the State of New York against The Great Atlantic & Pacific Tea Company, Inc., d/b/a A&P, The Food Emporium, and Waldbaum’s alleging violations of the overtime provisions of the New York Labor Law. Three named plaintiffs, Benedetto LaMarca, Dolores Guiddy, and Stephen Tedesco, alleged on behalf of a class that our Company failed to pay overtime wages to full-time hourly employees who were either required or permitted to work more than 40 hours per week. This matter has been stayed by our Bankruptcy Filing and is a claim that is subject to compromise.
Other
We are subject to various legal proceedings and claims, either asserted or unasserted, which arise in the ordinary course of business. We are also subject to certain environmental claims. While the outcome of these claims cannot be predicted with certainty, Management does not believe that the outcome of any of these legal matters will have a material adverse effect on our consolidated results of operations, financial position or cash flows.
NOTE 23 – Summary of Quarterly Results (Unaudited)
|
|
The following table summarizes our results of operations by quarter for fiscal 2010 and fiscal 2009. The first quarter of each fiscal year contains sixteen weeks, while the second, third and fourth quarters each contain twelve weeks.
|
|
First
|
Second
|
Third
|
Fourth
|
Total
|
|||||||||||||||||
|
Quarter
|
Quarter
|
Quarter(a)
|
Quarter
|
Year
|
|||||||||||||||||
|
2010 (unaudited)
|
(Dollars in thousands, except per share amounts)
|
||||||||||||||||||||
|
Sales
|
$
|
2,564,930
|
$
|
1,918,279
|
$
|
1,793,805
|
$
|
1,801,441
|
$
|
8,078,455
|
|||||||||||
|
Gross margin
|
763,812
|
562,707
|
534,237
|
539,899
|
2,400,655
|
||||||||||||||||
|
Depreciation and amortization
|
(70,379
|
)
|
(51,518
|
)
|
(49,944
|
)
|
(46,557
|
)
|
(218,398
|
)
|
|||||||||||
|
Loss from operations
|
(62,602
|
)
|
(98,767
|
)
|
(143,385
|
)
|
(145,867
|
)
|
(450,621
|
)
|
|||||||||||
|
Nonoperating income (loss) (d)
|
8,277
|
2,177
|
(213
|
)
|
3,536
|
13,777
|
|||||||||||||||
|
Interest expense, net
|
(61,142
|
)
|
(46,126
|
)
|
(40,038
|
)
|
(71,063
|
)
|
(218,369
|
)
|
|||||||||||
|
Reorganization items, net (b)
|
-
|
-
|
-
|
(21,985
|
)
|
(21,985
|
)
|
||||||||||||||
|
Loss from continuing operations
|
(115,607
|
)
|
(142,821
|
)
|
(180,683
|
)
|
(234,289
|
)
|
(673,400
|
)
|
|||||||||||
|
(Loss) income from discontinued operations
|
(7,036
|
)
|
(10,853
|
)
|
(18,687
|
)
|
111,401
|
74,825
|
|||||||||||||
|
Net loss
|
(122,643
|
)
|
(153,674
|
)
|
(199,370
|
)
|
(122,888
|
)
|
(598,575
|
)
|
|||||||||||
|
Per share data(e)
|
|||||||||||||||||||||
|
Loss from continuing operations – basic
|
(2.27
|
)
|
(2.73
|
)
|
(3.44
|
)
|
(4.39
|
)
|
(12.84
|
)
|
|||||||||||
|
(Loss) income from discontinued operations - basic
|
(0.13
|
)
|
(0.21
|
)
|
(0.34
|
)
|
2.07
|
1.39
|
|||||||||||||
|
Net loss – basic
|
(2.40
|
)
|
(2.94
|
)
|
(3.78
|
)
|
(2.32
|
)
|
(11.45
|
)
|
|||||||||||
|
Loss from continuing operations - diluted
|
(4.60
|
)
|
(2.76
|
)
|
(3.44
|
)
|
(4.39
|
)
|
(277.17
|
)
|
|||||||||||
|
(Loss) income from discontinued operations - diluted
|
(0.23
|
)
|
(0.19
|
)
|
(0.34
|
)
|
2.07
|
29.48
|
|||||||||||||
|
Net loss – diluted
|
(4.83
|
)
|
(2.95
|
)
|
(3.78
|
)
|
(2.32
|
)
|
(247.69
|
)
|
|||||||||||
|
Number of stores at end of period
|
429
|
428
|
395
|
393
|
|||||||||||||||||
|
First
|
Second
|
Third
|
Fourth
|
Total
|
||||||||||||||||
|
Quarter
|
Quarter
|
Quarter
|
Quarter(c)
|
Year
|
||||||||||||||||
|
2009 (unaudited)
|
(Dollars in thousands, except per share amounts)
|
|||||||||||||||||||
|
Sales
|
$
|
2,790,243
|
$
|
2,065,061
|
$
|
1,962,692
|
$
|
1,995,572
|
$
|
8,813,568
|
||||||||||
|
Gross margin
|
844,869
|
623,358
|
590,584
|
607,949
|
2,666,760
|
|||||||||||||||
|
Depreciation and amortization
|
(77,788
|
)
|
(57,784
|
)
|
(55,813
|
)
|
(54,075
|
)
|
(245,460
|
)
|
||||||||||
|
Loss from operations
|
(1,836
|
)
|
(8,566
|
)
|
(453,151
|
)
|
(137,021
|
)
|
(600,574
|
)
|
||||||||||
|
Nonoperating (loss) income(d)
|
(1,875
|
)
|
(7,079
|
)
|
(15,944
|
)
|
15,717
|
(9,181
|
)
|
|||||||||||
|
Interest expense, net
|
(54,207
|
)
|
(48,508
|
)
|
(45,718
|
)
|
(44,456
|
)
|
(192,889
|
)
|
||||||||||
|
Loss from continuing operations
|
(58,304
|
)
|
(62,159
|
)
|
(502,438
|
)
|
(157,749
|
)
|
(780,650
|
)
|
||||||||||
|
Loss from discontinued operations
|
(6,856
|
)
|
(18,150
|
)
|
(57,148
|
)
|
(13,694
|
)
|
(95,848
|
)
|
||||||||||
|
Net loss
|
(65,160
|
)
|
(80,309
|
)
|
(559,586
|
)
|
(171,443
|
)
|
(876,498
|
)
|
||||||||||
|
Per share data(e)
|
||||||||||||||||||||
|
Loss from continuing operations – basic
|
(1.10
|
)
|
(1.18
|
)
|
(9.43
|
)
|
(3.03
|
)
|
(14.79
|
)
|
||||||||||
|
Loss from discontinued operations - basic
|
(0.13
|
)
|
(0.34
|
)
|
(1.07
|
)
|
(0.25
|
)
|
(1.80
|
)
|
||||||||||
|
Net loss – basic
|
(1.23
|
)
|
(1.52
|
)
|
(10.50
|
)
|
(3.28
|
)
|
(16.59
|
)
|
||||||||||
|
Loss from continuing operations - diluted
|
(3.36
|
)
|
(3.06
|
)
|
(12.85
|
)
|
(4.73
|
)
|
(26.12
|
)
|
||||||||||
|
Loss from discontinued operations - diluted
|
(0.28
|
)
|
(0.68
|
)
|
(1.50
|
)
|
(0.34
|
)
|
(3.22
|
)
|
||||||||||
|
Net loss – diluted
|
(3.64
|
)
|
(3.74
|
)
|
(14.35
|
)
|
(5.07
|
)
|
(29.34
|
)
|
||||||||||
|
Number of stores at end of period
|
435
|
432
|
433
|
429
|
||||||||||||||||
|
(a)
|
During the third quarter of fiscal 2010, we sold seven stores in Connecticut, closed 25 stores as part of our restructuring effort, and closed one store in the normal course of business.
|
|
(b)
|
Reorganization items, net were incurred as a result of the Bankruptcy Filing.
|
|
(c)
|
During the fourth quarter of fiscal 2009, we recorded $7.3 million of impairment charges for capital lease assets, which related to the third quarter of fiscal 2009.
|
|
(d)
|
Our nonoperating income reflects the mark-to-market adjustments related to the conversion features, financing warrants, and Series A and B warrants, which fluctuate based on our stock price.
|
|
(e)
|
The sum of quarterly basic and diluted (loss) income per share differs from full year amounts because the number of weighted average common shares outstanding has changed each quarter.
|
ITEM 9 – Changes in and Disagreements with Accountants on Accounting and Financial
Disclosure
There were no changes in or disagreements with accountants on accounting and financial disclosure.
ITEM 9A – Controls and Procedures
Evaluation of Disclosure Controls and Procedures
We have established and maintain disclosure controls and procedures (as defined in Exchange Act Rules 13a-15(e) and 15d-15(e)) that are designed to ensure that information required to be disclosed in our Company’s Exchange Act reports is recorded, processed, summarized and reported within the time periods specified in the SEC’s rules and forms, and that such information is accumulated and communicated to our Company’s management, including our President and Chief Executive Officer, and Chief Administrative Officer, Chief Restructuring Officer and Chief Financial Officer, as appropriate, to allow timely decisions regarding required disclosure.
We carried out an evaluation, under the supervision and with the participation of our Company’s management, including our Company’s President and Chief Executive Officer along with our Company’s Chief Administrative Officer, Chief Restructuring Officer and Chief Financial Officer, of the effectiveness of the design and operation of our Company’s disclosure controls and procedures pursuant to Exchange Act Rule 13a-15(b). Based upon the foregoing, as of the end of the period covered by this report, our Company’s President and Chief Executive Officer along with our Company’s Chief Administrative Officer, Chief Restructuring Officer and Chief Financial Officer, concluded that our Company’s disclosure controls and procedures were effective at the reasonable assurance level.
The Company’s management does not expect that its disclosure controls and procedures or its internal control over financial reporting will prevent all errors and all fraud. A control system, no matter how well conceived and operated, can provide only reasonable, not absolute, assurance that the objectives of the control system are met. Further, the design of a control system must reflect the fact that there are resource constraints, and the benefits of controls must be considered relative to their costs. Because of the inherent limitations in all control systems, no evaluation of controls can provide absolute assurance that all control issues and instances of fraud, if any, within the Company have been detected. These inherent limitations include the realities that judgments in decision-making can be faulty, and breakdowns can occur because of simple errors or mistakes. Additionally, controls can be circumvented by the individual acts of some person or by collusion of two or more people. The design of any system of controls also is based in part upon certain assumptions about the likelihood of future events, and there can be no assurance that any design will succeed in achieving its stated goals under all potential future conditions; over time, controls may become inadequate because of changes in conditions, or the degree of compliance with the policies or procedures may deteriorate. Because of the inherent limitations in a cost-effective control system, misstatements due to error or fraud may occur and not be detected. Accordingly, the Company’s disclosure controls and procedures are designed to provide reasonable, not absolute, assurance that the objectives of our disclosure control system are met and, as set forth above, the Company’s management has concluded, based on their evaluation as of the end of the period, that our disclosure controls and procedures were effective to provide reasonable assurance that the objectives of our disclosure control system were met.
Management’s Annual Report on Internal Control over Financial Reporting
Management of our Company, including the President and Chief Executive Officer and the Senior Vice President, Chief Financial Officer and Treasurer, is responsible for establishing and maintaining adequate internal control over financial reporting, as defined in Rules 13a – 15(f) and 15d – 15(f) of the Securities Exchange Act of 1934, as amended. Our Company’s internal control over financial reporting was designed to provide reasonable assurance regarding the reliability of financial reporting and the preparation of the consolidated financial statements for external purposes in accordance with generally accepted accounting principles and includes those policies and procedures that: (i) pertain to the maintenance of records that in reasonable detail accurately and fairly reflect the transactions and dispositions of the assets of our Company; (ii) provide reasonable assurance that transactions are recorded as necessary to permit preparation of financial statements in accordance with generally accepted accounting principles, and that receipts and expenditures of our Company are being made only in accordance with authorizations of management and directors of our Company; and (iii) provide reasonable assurance regarding prevention or timely detection of unauthorized acquisition, use or disposition of our Company’s assets that could have a material effect on the financial statements.
Our management conducted an evaluation of the effectiveness of the Company’s internal control over financial reporting based on the framework in Internal Control – Integrated Framework issued by the Committee of Sponsoring Organizations of the Treadway Commission. This evaluation included review of the documentation of controls, evaluation of the design effectiveness of controls, testing of the operating effectiveness of controls and a conclusion on this evaluation. Based on the evaluation, management has concluded our Company’s internal control over financial reporting was effective as of February 26, 2011.
The effectiveness of the Company’s internal control over financial reporting as of February 26, 2011, has been audited by PricewaterhouseCoopers LLP, an independent registered public accounting firm, as stated in their report, which appears herein.
|
/s/ Samuel Martin
|
/s/ Frederic F. Brace
|
|
|
Samuel Martin
|
Frederic F. Brace
|
|
|
President and
Chief Executive Officer |
Chief Administrative Officer,
Chief Restructuring Officer and Chief Financial Officer
|
Changes in Internal Control over Financial Reporting
There has been no change during the Company’s fiscal quarter ended February 26, 2011 in the Company’s internal control over financial reporting (as such item is defined in Rules 13a-15(f) and 15d-15(f) under the Exchange Act) that has materially affected, or is reasonably likely to materially affect, the Company’s internal control over financial reporting. The recent change in our Chief Executive Officer did not have a material effect on the Company’s internal control over financial reporting.
ITEM 9B – Other Information
None.
PART III
|
|
ITEM 10 – Directors, Executive Officers and Corporate Governance
|
The information required under this item is incorporated herein by reference in an amendment to this Annual Report on Form 10-K, which will be filed within 120 days after the close of our Company’s 2010 fiscal year.
Executive Officers of the Registrant
The executive officers of our Company are as follows:
| Name | Age | Current Position |
| Sam Martin | 55 | President and Chief Executive Officer |
| Frederic F. Brace | 53 | Chief Administrative Officer, Chief Restructuring Officer |
| and Chief Financial Officer | ||
| Paul Hertz | 41 | Executive Vice President, Operations |
| Thomas O’Boyle | 41 | Executive Vice President, Merchandising & Marketing |
| Christopher W. McGarry | 44 | Senior Vice President, General Counsel & Secretary |
| Carter Knox | 61 | Senior Vice President, Human Resources & Communications |
Mr. Martin was appointed President and Chief Executive Officer on July 29, 2010. Prior to joining the company, Mr. Martin served as Executive Vice President and Chief Operating Officer of OfficeMax Incorporated, from September 2007 to July 2010. Prior to joining OfficeMax, Mr. Martin served as Senior Vice President of Operations for Wild Oats Markets, Inc. from January 2006 to September 2007. Prior to joining Wild Oats, Mr. Martin served as Senior Vice President of Supply Chain at Shopko from April 2003 to April 2006. From 1998 until 2003, he was Regional Vice President, Western Region and General Manager for Toys “R” Us, Inc., where he was responsible for operations, including stores, distribution, and logistics.
Mr. Brace was appointed Chief Financial Officer on March 28, 2011, Chief Restructuring Officer on December 9, 2010 and Chief Administrative Officer on August 20, 2010. Mr. Brace was a member of the Board of Directors of the Company from August 4, 2009 to August 20, 2010. Mr. Brace served as Executive Vice President and the Chief Financial Officer of UAL Corp., an air transportation company, from August 2002 until his retirement from the Company in October 2008. From 2004 to 2008, Mr. Brace also served as a member of the Board of Directors, chair of the audit and finance committees, and member of the executive committee of SIRVA, Inc., a relocation logistics services provider, from 2004 through 2008. During 2009, Mr. Brace also served as a member of the Board of Directors and of the audit committee of BearingPoint, Inc., a leading global management and technology consulting services firm during 2009. Currently, Mr. Brace is also a member of the Board of Directors, the audit committee and the compensation committee of Anixter International, a communications, electrical wire and cable products distribution company.
Mr. Hertz was appointed Executive Vice President of Operations on August 18, 2010. Prior to joining A&P, Mr. Hertz was Executive Vice President of Retail Stores for OfficeMax, which he joined in September 2007. Previously, Mr. Hertz served as Vice President of Stores for Wild Oats Markets, Inc. from August 2006 to September 2007. Prior to joining Wild Oats, Mr. Hertz served as Vice President of Store Operations for ShopKo Stores Inc. from April 2003 to August 2006. For the 16 years prior to joining Shopko, Mr. Hertz held positions of increasing responsibility with Fred Meyer Stores, a division of The Kroger Company including, Vice President, Regional Director of Stores.
Mr. O’Boyle was appointed Executive Vice President, Merchandising and Marketing on August 25, 2010. Prior to joining the Company, Mr. O’Boyle was President and Senior Vice President, Food and Drug, for Sears Holdings from 2008 to 2010. Before joining Sears, Mr. O’Boyle was Senior Vice President, Merchandising and Marketing for Albertson’s from 2005 to 2006. Before that he held merchandising and marketing management positions at Jewel Food Stores and American Stores.
Mr. McGarry was appointed Senior Vice President, General Counsel and Secretary on October 7, 2009. Mr. McGarry joined the Company in March 2006 as Vice President of Legal Services. From July 2006 to October 2009, he served as Vice President, Legal Compliance Officer and Assistant Secretary. Prior to joining the Company, Mr. McGarry was General Counsel from 2003 to 2005 for Exel, Inc., successor-in-interest to Tibbett & Britten Group Americas, a major international logistics service provider for the food and beverage, fashion and other consumer product sectors. From 1992 to 1998 and from 2001 to 2003, he was a Partner and attorney in various New Jersey based law firms. From 1998 to 2001, Mr. McGarry served as Assistant General Counsel and Corporate Secretary for The Grand Union Company.
Mr. Knox was appointed Senior Vice President of Human Resources and Communications on August 19, 2010. Prior to joining the Company, Mr. Knox was Senior Vice President of Human Resources for OfficeMax from 2005 to August 2010. Before joining OfficeMax, Mr. Knox held roles of increasing responsibility at Fred Meyer, a division of The Kroger Company, over more than 30 years at the Company. His responsibilities spanned store operations, merchandising, marketing and human resources.
Code of Business Conduct and Ethics
Our Company has adopted a Code of Business Conduct and Ethics applicable to all employees. This Code is applicable to Senior Executives including the Chief Executive Officer, Chief Financial Officer and Treasurer and Chief Accounting Officer of our Company. A&P’s Code of Business Conduct and Ethics is available on the Company’s Website at www.aptea.com under “Corporate Governance.” Our Company intends to post on its website any amendments to, or waivers from, its Code of Business Conduct and Ethics applicable to Senior Financial Executives. The Code of Business Conduct and Ethics is available in print to any shareholder or other interested party upon written request to the Legal Compliance Officer, 2 Paragon Drive, Montvale, New Jersey 07645 or by calling (201) 571-4355.
|
ITEM 11 – Executive Compensation
|
The information required regarding our director and executive compensation and certain corporate governance matters is contained under the captions, “The Board of Directors of the Company,” “Executive Compensation” and “Report of Management Development and Compensation Committee,” respectively, is incorporated herein by reference in an amendment to this Annual Report on Form 10-K, which will be filed within 120 days after the close of our Company’s 2010 fiscal year.
ITEM 12 – Security Ownership of Certain Beneficial Owners and Management and Related Stockholder Matters
The information required is incorporated herein by reference in an amendment to this Annual Report on Form 10-K, which will be filed within 120 days after the close of our Company’s 2010 fiscal year.
As of April 30, 2011, there were approximately 5,238 stockholders of record of our common stock.
Securities authorized for issuance under equity compensation plans are summarized below:
|
As of February 26, 2011
|
||||||||||||
|
Number of securities to be issued upon exercise of outstanding
options and rights
|
Weighted average exercise price of outstanding
options and rights
|
Number of securities remaining available for future issuance under equity compensation plans
(excluding securities
reflected in first column)
|
||||||||||
|
Equity compensation plans approved by security holders:
|
||||||||||||
|
1994 Stock Option Plan for officers and key employees*
|
44,137 | $ | 4.34 | - | ||||||||
|
1994 Stock Option Plan for Board of Directors**
|
14,341 | 8.70 | - | |||||||||
|
1998 Long Term Incentive and Share Award Plan***
|
433,865 | 17.19 | - | |||||||||
|
2008 Long Term Incentive and Share Award Plan
|
5,367,571 | 3.25 | 1,067,825 | |||||||||
|
Pathmark Rollover Options
|
151,305 | 32.06 | - | |||||||||
|
Total Outstanding as of February 26, 2011
|
6,011,219 | $ | 5.00 | 1,067,825 | ||||||||
Equity Compensation Plans
Not approved by security holders:
None.
* On March 17, 2004, the plan expired.
** On July 14, 2004, the plan was replaced with the 2004 Non-Employee Director Compensation Plan
*** On July 14, 2008, the plan expired.
ITEM 13 – Certain Relationships and Related Transactions and Director Independence
The information required is incorporated herein by reference in an amendment to this Annual Report on Form 10-K, which will be filed within 120 days after the close of our Company’s 2010 fiscal year.
ITEM 14 – Principal Accounting Fees and Services
The information required is incorporated herein by reference in an amendment to this Annual Report on Form 10-K, which will be filed within 120 days after the close of our Company’s 2010 fiscal year.
PART IV
ITEM 15 – Exhibits and Financial Statement Schedules
(a) Documents filed as part of this report:
|
1)
|
Financial Statements: The following Consolidated Financial Statements, related Notes and Report of Independent Registered Public Accounting Firm are included in Item 8 of Part II of this Annual Report on Form 10-K.:
|
Consolidated Statements of Operations
Consolidated Statements of Stockholders’ Deficit and Comprehensive Loss
Consolidated Balance Sheets
Consolidated Statements of Cash Flows
Notes to Consolidated Financial Statements
Report of Independent Registered Public Accounting Firm
|
2)
|
Financial Statement Schedule:
|
Schedule II Valuation and Qualifying Accounts and Reserves
All other schedules are omitted because they are not required or do not apply, or the required information is included elsewhere in the Consolidated Financial Statements or Notes thereto.
|
3)
|
Exhibits:
|
The following are filed as Exhibits to this Report:
EXHIBIT NO. DESCRIPTION
|
|
10.1*
|
Third Amended and Restated Superpriority Debtor-in-Possession Credit Agreement dated as of January 13, 2011 among the Great Atlantic & Pacific Tea Company, Inc. and the other Borrowers party thereto, as Borrowers and the Lenders party thereto, and JPMorgan Chase Bank, N.A., as Administrative Agent and Collateral Agent (incorporated herein by reference to Exhibit 10.1 to Form 8-K Filed on May 10, 2011)
|
|
|
18
|
Preferability Letter Issued by PricewaterhouseCoopers LLP (incorporated herein by reference to Exhibit 18 to Form 10-Q filed on July 29, 2004)
|
|
|
21*
|
Subsidiaries of Registrant
|
|
|
23.1*
|
Consent of Independent Registered Public Accounting Firm from PricewaterhouseCoopers LLP
|
|
|
31.1*
|
Certification of the Chief Executive Officer Pursuant to Section 302 of the Sarbanes-Oxley Act of 2002
|
|
|
31.2*
|
Certification of the Chief Financial Officer Pursuant to Section 302 of the Sarbanes-Oxley Act of 2002
|
|
|
32*
|
Certification Pursuant to 18 U.S.C. Section 1350, as Adopted Pursuant to Section 906 of the Sarbanes-Oxley Act of 2002
|
|
|
*
|
Filed with this 10-K
|
|
|
**
|
Information required to be presented in Exhibit 11 is included in Exhibit 13 under Note 18 – Earnings per Share, prepared in accordance with the accounting guidance for earnings per share.
|
|
|
***
|
Portions of this exhibit have been omitted pursuant to a request for confidential treatment.
|
Schedule II
The Great Atlantic & Pacific Tea Company, Inc.
(Debtors-in-Possession)
Valuation and Qualifying Accounts and Reserves
Years Ended February 28, 2009, February 27, 2010 and February 26, 2011
(in thousands)
|
Additions
|
Additions
|
|||||||||||||||||||||||
|
Allowance for
|
Charged to
|
Charged to
|
||||||||||||||||||||||
|
Bad Debts for
|
Beginning
|
Costs &
|
Other
|
Ending
|
||||||||||||||||||||
|
Year Ended
|
Balance
|
Expenses
|
Accounts
|
Deductions (1)
|
Adjustments
|
Balance
|
||||||||||||||||||
|
Feb. 28, 2009
|
$ | 5,864 | $ | 1,263 | $ | 2,910 | (2) | $ | (1,574 | ) | $ | - | $ | 8,463 | ||||||||||
|
Feb. 27, 2010
|
8,463 | 1,433 | - | (1,168 | ) | - | 8,728 | |||||||||||||||||
|
Feb. 26, 2011
|
8,728 | 1,793 | - | (4,967 | ) | - | 5,554 | |||||||||||||||||
|
Additions
|
Additions
|
|||||||||||||||||||||||
|
Stock Loss
|
Charged to
|
Charged to
|
||||||||||||||||||||||
|
Reserve for
|
Beginning
|
Costs &
|
Other
|
Ending
|
||||||||||||||||||||
|
Year Ended
|
Balance
|
Expenses
|
Accounts
|
Deductions
|
Adjustments
|
Balance
|
||||||||||||||||||
|
Feb. 28, 2009
|
$ | 15,717 | $ | 8,525 | $ | - | $ | - | $ | - | $ | 24,242 | ||||||||||||
|
Feb. 27, 2010
|
24,242 | (5,293 | ) | - | - | - | 18,949 | |||||||||||||||||
|
Feb. 26, 2011
|
18,949 | (244 | ) | - | - | - | 18,705 | |||||||||||||||||
|
Additions
|
Additions
|
|||||||||||||||||||||||
|
LIFO
|
Charged to
|
Charged to
|
||||||||||||||||||||||
|
Reserve for
|
Beginning
|
Costs &
|
Other
|
Ending
|
||||||||||||||||||||
|
Year Ended
|
Balance
|
Expenses
|
Accounts
|
Deductions
|
Adjustments
|
Balance
|
||||||||||||||||||
|
Feb. 28, 2009
|
$ | 2,310 | $ | 7,817 | $ | - | $ | - | $ | - | $ | 10,127 | ||||||||||||
|
Feb. 27, 2010
|
10,127 | (842 | ) | - | - | - | 9,285 | |||||||||||||||||
|
Feb. 26, 2011
|
9,285 | 2,044 | - | - | - | 11,329 | ||||||||||||||||||
|
Deferred Tax
|
Additions
|
Additions
|
||||||||||||||||||||||
|
Valuation
|
Charged to
|
Charged to
|
||||||||||||||||||||||
|
Allowance for
|
Beginning
|
Costs &
|
Other
|
Ending
|
||||||||||||||||||||
|
Year Ended
|
Balance
|
Expenses
|
Accounts
|
Deductions
|
Adjustments
|
Balance
|
||||||||||||||||||
|
Feb. 28, 2009 (3)
|
$ | 43,646 | $ | 71,240 | $ | 91,622 | (4) | $ | - | $ | - | $ | 206,508 | |||||||||||
|
Feb. 27, 2010 (3)
|
206,508 | 327,796 | 33,349 | (5) | - | - | 567,653 | |||||||||||||||||
|
Feb. 26, 2011 (3)
|
567,653 | 258,333 | - | (1,720 | ) (5) | - | 824,266 | |||||||||||||||||
|
(1)
|
Deductions to Allowance for Bad Debts represent write-offs of accounts receivable balances.
|
|
(2)
|
Primarily represents additional reserves recorded as part of purchase accounting for Pathmark Stores, Inc.
|
|
(3)
|
Prior period amounts were adjusted due to our retrospective adoption of the new accounting guidance for convertible debt with cash settlement features during fiscal 2009.
|
|
(4)
|
Primarily relates to purchase accounting adjustments relating to our acquisition of Pathmark, and pension and postretirement charges to “Other comprehensive income.”
|
|
(5)
|
Primarily relates to pension and postretirement charges to “Other comprehensive income.”
|
SIGNATURES
Pursuant to the requirements of Section 13 or 15 (d) of the Securities Exchange Act of 1934, the registrant has duly caused this report to be signed on its behalf by the undersigned, thereunto duly authorized.
The Great Atlantic & Pacific Tea Company, Inc. (Registrant)
Date: May 10, 2011 By: /s/ Frederic F. Brace
Frederic F. Brace
Chief Administrative Officer,
Chief Restructuring Officer and
Chief Financial Officer
Pursuant to the requirements of the Securities Exchange Act of 1934, this report has been signed below by the following persons on behalf of the registrant in the capacities and as of the date indicated.
/s/ Samuel Martin President and Chief Executive Officer Date: May 10, 2011
Samuel Martin
/s/ Frederic F. Brace Chief Administrative Officer, Chief Date: May 10, 2011
Frederic F.Brance Restructuring Officer, and Chief
Financial Officer
/s/ Melissa E. Sungela Senior Vice President, Corporate Controller Date: May 10, 2011
Melissa E. Sungela
/s/ John D. Barline Director Date: May 10, 2011
John D. Barline
/s/ Thomas Casey Director Date: May 10, 2011
Thomas Casey
/s/ Andreas Guldin Director Date: May 10, 2011
Andreas Guldin
/s/ Christian W. E. Haub Director Date: May 10, 2011
Christian W. E. Haub
/s/ Dan P. Kourkoumelis Director Date: May 10, 2011
Dan P. Kourkoumelis
/s/ Edward Lewis Director Date: May 10, 2011
Edward Lewis
/s/ Gregory Mays Director Date: May 10, 2011
Gregory Mays
/s/ Gregory F. Rayburn Director Date: May 10, 2011
Gregory F. Rayburn
/s/ Maureen B. Tart-Bezer Director Date: May 10, 2011
Maureen B. Tart-Bezer
/s/ Terrence J. Wallock Director Date: May 10, 2011
Terrence J. Wallock